 Hanna Helander1*
 Meghan Beck-O’Brien1Christian Lutz2
 Rüdiger Schaldach1Anna Schomberg1Johannes Többen2†Stefan Bringezu1
- 1Center for Environmental Systems Research (CESR), University of Kassel, Kassel, Germany
- 2Institute of Economic Structures Research (GWS), Osnabrück, Germany
Environmental footprints should play a key role in monitoring the bioeconomy. They can capture environmental pressures and impacts of biomass production and extraction, as well as provide comparable per capita values disclosing how biomass use is distributed globally. As such, footprints could help ensure a sustainable transition and implementation of the bioeconomy. To develop national bioeconomy monitoring systems, we suggest six specific indicators and revise the state-of-art as regards their methodological development, as well as assess their applicability and feasibility for contributing to a systemic monitoring. Drawing on several years of collaborations between researchers from the different footprint domains, we introduce an integrated modelling approach to link global trade models for national footprint accounting with spatially specific impact assessments of terrestrial biomass production. The integrated approach captures all six indicators as it combines pressure indicators (forest- and agricultural biomass, agricultural land use and greenhouse gas emissions) and spatially specific impact indicators (water scarcity and biodiversity). This comprehensive and manageable set of footprint indicators addresses the main sustainability challenges of the bioeconomy developments.
1 Introduction
The bioeconomy sectors play a fundamental role in meeting human needs. Yet, soil degradation, biodiversity loss, climate change, and other issues threaten the provision of food, feed, fuels, and fibers from agricultural lands and forests (Richardson et al., 2023). The ‘bioeconomy’ includes and interlinks all sectors that rely on biological resources (including production and consumption of animals, plants, microorganisms, organic waste and surpluses), their functions and principles (European Commission, 2018). The political bioeconomy vision further includes a future-oriented, circular and sustainable production systems (BMBF, 2020; European Commission, 2018). In this context, the bioeconomy and its expansion are often seen as part of the solution to meet humanity’s basic challenges, such as climate change management, halting biodiversity loss, and ensuring food security (European Commission, 2018). However, according to the International Resource Panel (2020), biomass cultivation and processing is the main driver of biodiversity loss. It is responsible for almost 90% of global water stress impacts and more than 30% of global greenhouse gas (GHG) emissions, without accounting for land use change. In this sense, the bioeconomy is on the one hand largely contributing to global environmental change, and on the other hand an expected solution for humanity’s basic challenges.
In the context of developing a monitoring system for national and supranational bioeconomy policies, we argue that footprint accounting can, and should, play a key role. Through the allocation of environmental pressures and impacts to the consumer region, footprints address key drivers and capture how biomass use is distributed between regions and countries. This is pivotal for assessing the ability to meet human needs for biomass within ecological boundaries, and in turn, for meeting Sustainable Development Goals (Lenzen et al., 2022; Vanham et al., 2019).
Methodological advancements in Multi-Regional Input Output (MRIO)-modelling as regards its integration with spatial land use models and consumption benchmarks, have increased the capacity to answer key questions for steering the development of the bioeconomy. Thus, footprint assessments can answer questions related to spatially explicit impacts on ecosystems (Green et al., 2019; Moran et al., 2020; Sun et al., 2022a) and help compare resource use and impacts with benchmarks for sustainable levels of consumption (Fang et al., 2015; Richardson et al., 2023; Rockström et al., 2021). Such consumption-based assessments targeting the sustainability of biomass provision systems fall short in many other bioeconomy monitoring frameworks (Kardung et al., 2019; Robert et al., 2020).
In this article, we determine key monitoring needs, examine recent developments in footprint accounting and introduce an integrated modelling approach for a purposeful bioeconomy monitoring. Our focus is on terrestrial biomass because it is the majority of the resource base. The article is structured as follows: First, we take a systems perspective to define key monitoring needs and determine how footprints–together with consumption-based benchmarks - can contribute to meeting these needs. We then review the state of the art for selected footprint indicators of particular relevance to the bioeconomy. Thereafter, we introduce an integrated modeling approach for six key footprint indicators applied to the German bioeconomy. The approach is the result of a lengthy collaborative effort between researchers and modelers in the various footprint domains. We discuss remaining needs and requirements for the modeling structure to feed into a regular monitoring system. Finally, we provide an outlook for footprint accounting in the context of bioeconomy monitoring.
2 The need for environmental footprints in bioeconomy monitoring frameworks
Ecosystems and earth system dynamics are complex and intertwined. A sufficiently broad and manageable system perspective is needed to help address policy challenges for steering development in a way that supports meeting all human needs over time within ecological boundaries. To capture the complex challenges of the bioeconomy, causes, threats, and solutions must be addressed in conjunction–with biomass provisioning systems in the center. In a monitoring context, these relate to environmental pressures and impacts both locally and globally, the capacity of the provisioning systems, and preconditions for a safe and just bioeconomy (Figure 1, green and red boxes).
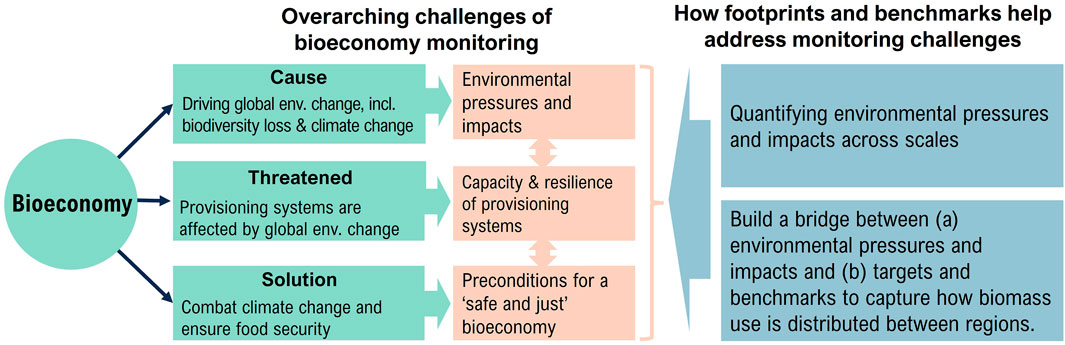
Figure 1. Overarching challenges of the bioeconomy monitoring and the contribution footprints and benchmarks can make in addressing those. With ‘safe and just’ we refer to a bioeconomy within a safe operating space and with a fair distribution of resource uses.
Footprints can play a key role in addressing parts of these challenges in the context of a viable monitoring system (Figure 1, blue boxes). First, footprint accounting can help assess pressures and impacts across supply chains and scales. Second, footprints can build a bridge between a) environmental impacts and pressures and b) science-based targets and benchmarks of resource limits to capture how the related biomass use is distributed between regions.
2.1 Footprints link consumption and production to capture global resource use and local ecosystem impacts
For agricultural products, global trade more than doubled between 2000 and 2015, and it continues to grow (Escobar et al., 2020; OECD and FAO, 2022). Global trade is characterized by a displacement of resource extraction–and their associated impacts–in particular from industrialized countries to developing countries (Dorninger et al., 2021; Hickel et al., 2022; Pendrill et al., 2019; Weinzettel et al., 2013). To capture the growing spatial disconnect between biomass consumption and the impacts of production, MRIO-based footprint accounting is a well-recognized method (Lenzen et al., 2022; Weinzettel et al., 2014; Wiedmann et al., 2011).
Combining pressure and impact footprints into a ‘footprint family’ supports integrated policy decisions and the understanding of trade-offs related to ecological boundaries (Vanham et al., 2019; Wu et al., 2021). Pressure indicators capture the flows of the social metabolism and impact indicators assess the related effects on the ecosphere. The generally aggregated country-level footprints have lately been extended with spatially specific information on environmental impacts (Figure 2).
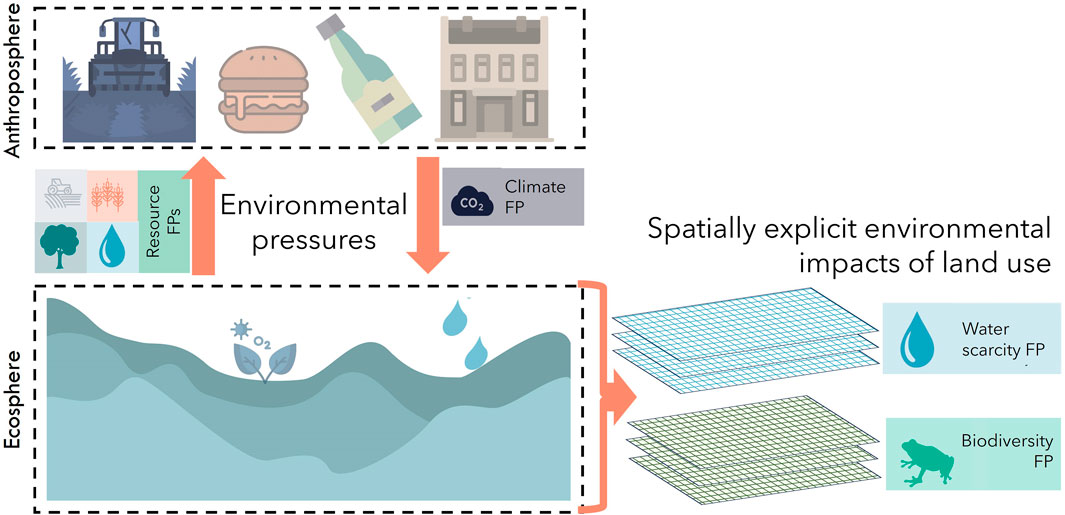
Figure 2. Material flows between the anthroposphere and ecosphere are defined as environmental pressures. These include (1) use of resources from the ecosphere (resource FPs, depicting agricultural land use, water quantities, and agricultural and forestry biomass) and (2) emissions to the ecosphere (e.g., climate FP). Using the example of terrestrial biomass provisioning systems (land use) ecosystem impacts are spatially specific. Own illustration drawing on Bringezu (2000) and Fischer-Kowalski et al. (2011). Anthroposphere/ecosphere icons: ©Freepik (adapted with permission). Footprint icons: ©Adobe Stock (licensed permission).
Pressure footprints–and in particular resource FPs–help to assess the physical scale of consumption, and ultimately, prevent overconsumption (O’Brien et al., 2017), i.e., a level of consumption which cannot be provided within safe ecological boundaries. Regardless of if the biomass is feeding into new biotechnology fields with high resource efficiency and increasing recycling-rates, or if it is used for energy or food, the amount of land available for agriculture and timber production—as well as the capacity of that land to grow biomass (yields) — sets global limits for the physical scale of the bioeconomy. Resource footprints have been taken up in EU and UN policies, for example, the material footprint which is used as an indicator for SDG 8 “Decent work and economic growth” and SDG 12, “sustainable consumption and production” (EU, 2022; UN, 2023).
To assess the burden of globally produced commodities on local ecosystems, an increasing number of authors call for spatially explicit environmental impact assessments (Moran et al., 2020; Verones et al., 2017; Weinzettel and Wood, 2023). Impacts, on for instance water scarcity and biodiversity, differ widely and depend on production methods, crop requirements, and ecosystem diversity and resilience, among others. Tropical regions are particularly critical for biodiversity conservation and climate mitigation, and at the same time, strongly affected by deforestation and intensive production practices (IRP, 2020; Pendrill et al., 2019).
2.2 Benchmarks help define preconditions for a just and safe bioeconomy
To stop the global overshoot of planetary boundaries (Richardson et al., 2023) there is also a need to turn ecological boundaries into benchmarks, and to incorporate them into monitoring systems (Ferretto et al., 2022; Häyhä et al., 2016; Wu et al., 2021). The sustainability of a far-reaching deployment of bioeconomies around the world depends on both how resources are produced and how much are needed. It is often an accumulation of pressures that lead to global overshoot, making it difficult to pinpoint who is responsible for what. Global benchmarks would allow sustainability criteria related to resource management at the macro level to complement the existing management of resource production and use at the micro level. The aim is to monitor whether and how much a country like Germany contributes to global overshoot through its consumption.
Our conceptual goal for monitoring the sustainability of the bioeconomy transition is to place key footprints within the framework for ecological boundaries, which define ranges of safe and just consumption levels (Figure 3). While there are many ways to approach this, the planetary boundaries concept aims to define a safe operating space for current and future human populations. How this space is to be shared among the global population adds both an intra- and an intergenerational dimension of justice (Gupta et al., 2023). A rough definition of a just distribution is a per capita approach. It should be noted that in complementary contexts this approach has been contested, especially in relation to climate mitigation as historical emissions play a key role (Neumayer, 2000). Also, local conditions, cultural dimensions and deviating needs to meet e.g., nutrition requirements makes it challenging to define “just”.
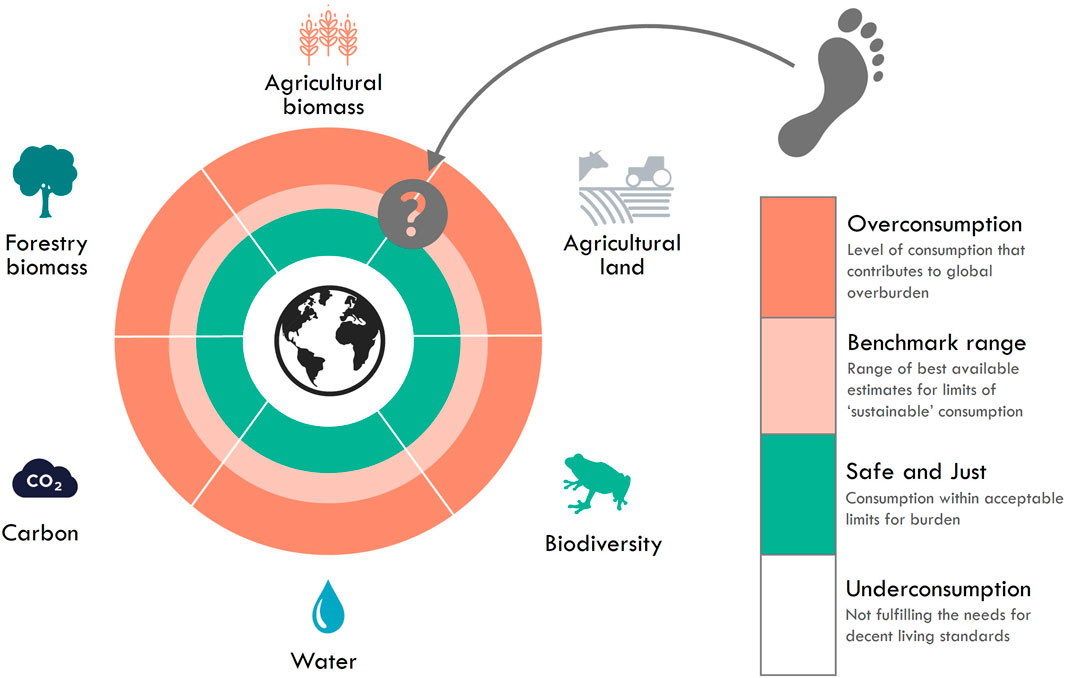
Figure 3. The envisioned framework for monitoring footprints in comparison to benchmark ranges for safe and just consumption in the bioeconomy. Benchmarks are comparative indicators used to relate consumption levels with sustainable supply capacities. By “safe,” we mean consumption that remains within acceptable limits regarding global sustainability. The term “just” is simplistically defined here as an equitable per capita distribution of that global burden. “Benchmark ranges” denote the best available estimates for sustainable consumption, represented in light orange. Next to “safe and just”, multiple benchmarks can help policymakers to steer the development of national bioeconomies in a sustainable direction. These include e.g., global averages or, e.g., for forestry biomass, regional capacities of sustainable supply. Icons: ©Adobe Stock (licensed).
Research to determine safe and just levels of nature appropriation is progressing rapidly (Richardson et al., 2023; Rockström et al., 2023). Conflicting sustainability dimensions and land use needs make it complex. We encompass a “benchmark range” of best available estimates for sustainable consumption (light orange area in Figure 3). For many of the footprints, estimates of global capacities linked to the planetary boundary framework and existing global targets (SDGs, Aichi Biodiversity targets, etc.) exist (Bringezu, 2022; Richardson et al., 2023; Rogelj et al., 2018). Combining these with population forecast data enables per capita benchmarks to be determined.
In some cases, while it is useful to have knowledge on where a country stands in comparison to an equal distribution of global resource supply under sustainability constraints, it is also useful to know how much and how well that country uses its own national resource supply. This could be relevant for countries with, for example, a large forest area and the ability to use local wood-based fibres in efficient supply loops (Beck-O’Brien et al., 2022). For instance, in Germany, available wood supply under conditions of sustainability amount to 1.1–1.3 m3 per capita, which is two to three times as much as the global average of 0.4–0.5 m3 (Beck-O’Brien et al., 2022).
For resources to which every human has an equal right, like the right to food, and equal global “budget” of agricultural land and biomass must play a larger role. Estimations show that per capita there is approximately 0.2 ha cropland available under conditions of sustainability, and targets for agricultural biomass per capita should not exceed 2 t per capita (Bringezu, 2015).
Altogether, the benchmark ranges considered in this article could be considered a starting point. Defining legitimate monitoring benchmark ranges requires an inclusive and participatory process that emphasizes social dialogue and science and citizen deliberation. This process should be guided by scientific evidence, while recognizing that decisions related to risk-taking and responsibility ultimately reside within the socio-political sphere.
Another key aspect of justice is assuring the material requirements for a decent living standard, which is one boundary of the so called ‘doughnut’ as defined by Raworth (2012), Raworth (2018). Because our focus is on understanding the limits of expanding bioeconomy markets in high-consumption countries (i.e., how much biomass is available to sustainably replace fossil fuels?), we focus on the upper limits of global sustainable production capacities. Conversely, research is emerging on the quantitative minimal levels of resources needed to meet the ‘social foundation’ (Raworth, 2012; Raworth, 2018) or ‘decent living standards’ (Vélez-Henao and Pauliuk, 2023).
The use of per capita benchmarks allows for the transparent reflection of the biomass availability and the distribution of biomass use across regions. Incorporating such benchmarks into monitoring frameworks would help identify which countries are overconsuming and which are underconsuming for which footprints.
3 Footprint accounting of the bioeconomy: state-of-the-art
Aiming for a comprehensive macro-level assessment of the bioeconomy footprints, as discussed in Sections 1, 2, we concentrate on MRIO-based footprint accounting, which is the most widely recognized method for national footprint assessments. While alternative life-cycle assessment (LCA) approaches can also be employed—typically involving the compilation of a representative basket of products, performing individual life-cycle assessments, and subsequently scaling up the findings to reflect total national consumption—these methods face other challenges and data uncertainties. This basket-based approach is currently utilized by the EU bioeconomy monitoring system, which has made initial attempts to connect the results to planetary boundaries (Sinkko et al., 2023). Additionally, Schlesier et al. (2024) adopt an LCA-based methodology to explore the potential for achieving a sustainable quality of life within the “doughnut” framework. Because of the uncertainties related to both the composition of product baskets and the upscaling of data, we focus on MRIO-based footprint accounting, while still briefly addressing the selection of specific indicators captured in the complementary “EU Bioeconomy footprint”.
3.1 Overview of footprint indicators
There are diverse concepts and approaches for various of the bioeconomy relevant footprints–and in some areas, the research is rapidly advancing (Table 1). The biomass, or material, footprint quantifies primary agricultural and forest biomass harvested, grazed, or caught. This and other material footprints are assessed either as Raw Material Consumption (RMC) or Total Material Consumption (TMC). The agriculture biomass footprint shows the mass of agricultural resources that are taken from nature globally to satisfy final demand in a country (like Germany). Dairy and meat from livestock farming are accounted for as primary biomass equivalents reflecting the required amounts of feed to produce them. The forest biomass footprint comprises the annual volume of roundwood equivalents used for final consumption in a country.
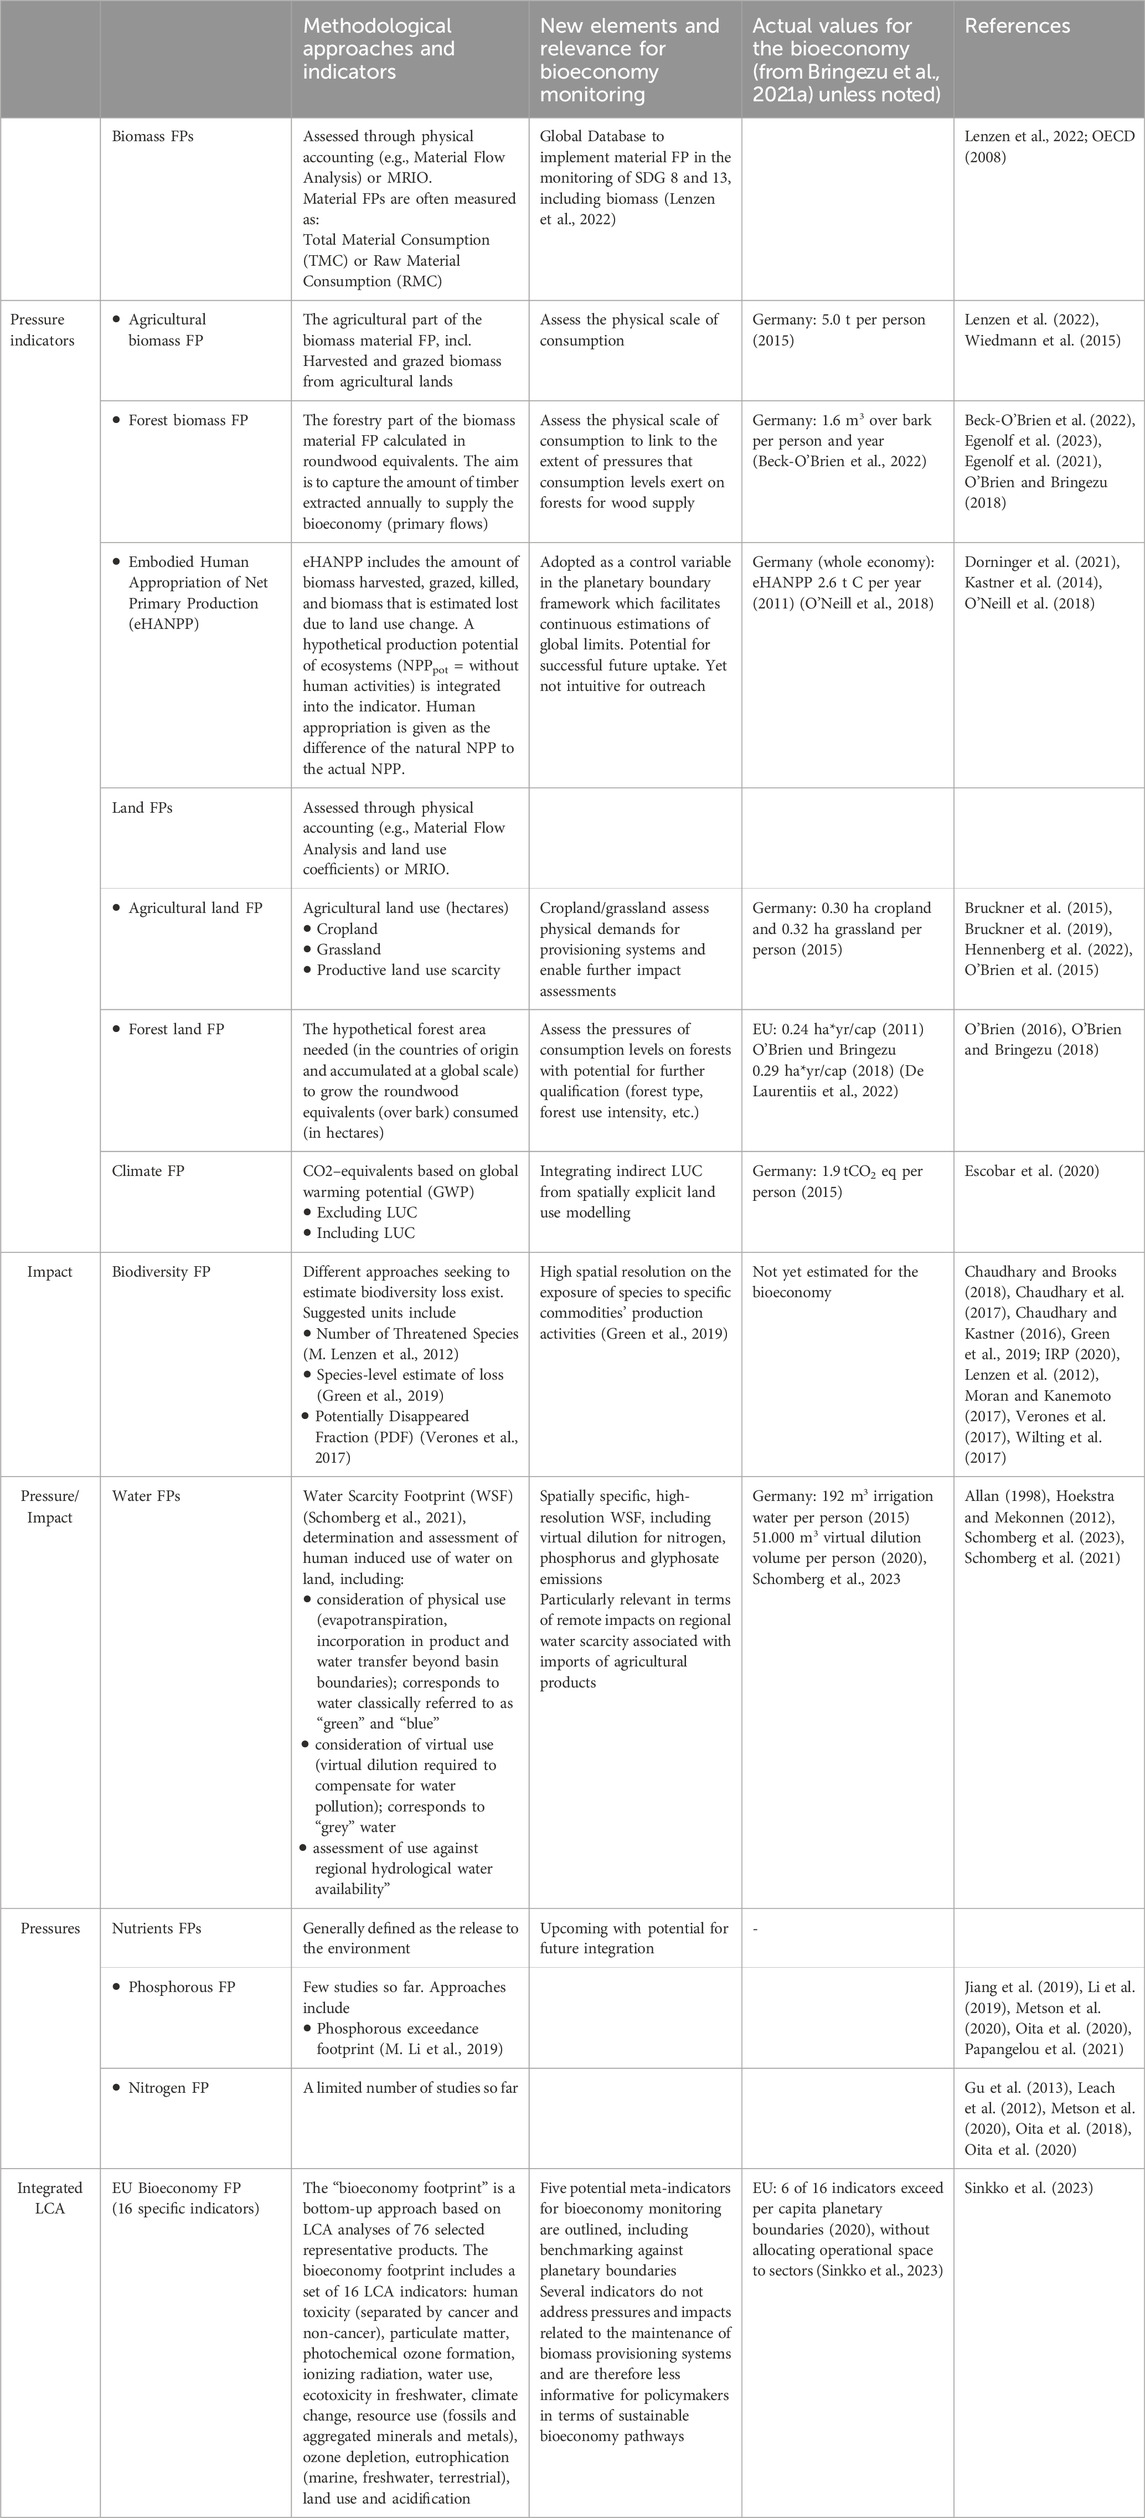
Table 1. Recent developments of footprint indicators and assessment approaches of particular relevance for the bioeconomy. Indicators used in the integrated modelling approach presented in this article are shaded blue. Selected indicators are based on MRIO-models unless shaded yellow which indicate Life Cycle Assessment (LCA). Relevance for bioeconomy monitoring is assessed based on 1) its contribution to the systemic assessment of pressures and impacts related to the maintenance of biomass provisioning systems and 2) its matureness and intuitiveness for effective outreach. Actual values mainly refer to Bringezu et al. (2021a) as comparable metrics and assessed for the German bioeconomy. Activities looking at the aquatic biomass, which is part of the bioeconomy, are beyond the scope as we focus on terrestrial biomass.
Related to biomass footprints, embodied Human Appropriation Net Primary Production (eHANPP) was recently taken up as a footprint (Dorninger et al., 2021; O’Neill et al., 2018) and as a control variable in the planetary boundary framework (Richardson et al., 2023). It integrates production capacity and thereby goes beyond both biomass quantities and available agricultural land. Yet, eHANPP is less intuitive than biomass or land footprints and for irrigated areas it can provide negative values, which complicates its interpretation.
Land footprints have largely focused agricultural land, which is also generally differentiating between croplands and grasslands (Bringezu et al., 2021a; Bruckner et al., 2015; Hennenberg et al., 2022). Cropland is the most intensively used land and is more frequently addressed in environmental assessments (Bruckner et al., 2019; Helander et al., 2021). The main challenges for the agricultural land footprint relate to the quantification of grassland (Vanham et al., 2023) and the broad variety of grassland characteristics (e.g., grazing versus mowing). To facilitate a comparison between different kinds of land use, spatially explicit land use models can help to assess local impacts (Schaldach et al., 2013). The forest land footprint is conceptualized as the hypothetical forest area needed in the countries of origin. Efforts are underway to extend land footprints to reflect impacts such as land use change (Hennenberg et al., 2022) and productive land scarcity (Ridoutt and Navarro Garcia, 2020).
For the climate footprint of biomass production, land use change such as deforestation or shifted agricultural practices plays a significant role (Pendrill et al., 2019). Spatially specific land use assessments integrate land use change in the climate footprint calculations to increase validity (Escobar et al., 2020). Climate footprints quantify the climate impact of greenhouse gas emissions based on the Global Warming Potential in a 100-year perspective (GWP100).
Biodiversity footprint assessments apply diverse approaches. One of the first general approaches linked industrial pressures (e.g., agricultural production, logging, pollution) to the IUCN Red List of Threatened Species to calculate a biodiversity footprint as a number of threatened species at the national scale (M. Lenzen et al., 2012). This approach was taken up in later studies (X. Li et al., 2022; Moran and Kanemoto, 2017). A second approach replaced the implicitly assumed relations between production and threatened species in a region or nation, with more spatially explicit data and models (Green et al., 2019). This approach captures the fine-scale exposure of species to specific commodities’ production activities by using information with higher geographical resolution. It estimates both the potential distributions of species and the commodity-specific production areas (Egli et al., 2018; Green et al., 2019). The required crop-specific land-use maps can be generated by land use models (Schaldach et al., 2011). A last family of approaches to biodiversity footprints comes from the Life-cycle assessment (LCA) and has also been combined with MRIO (Egenolf et al., 2023; Sun et al., 2022a; 2022b; Verones et al., 2017). Here, characterization factors representing biodiversity damage of global land use were calculated by combining a countryside species-area relationship model and vulnerability scores of ecoregions (Chaudhary and Brooks, 2018; Chaudhary et al., 2015). The resulting footprints are referred to as e.g., “potential global species loss” (Chaudhary and Brooks, 2018) or “potentially disappeared fraction (PDF)” (Verones et al., 2017). In contrast to the aforementioned approaches, the countryside species-area relationship model link spatially coarse biodiversity data (species richness in 804 terrestrial ecoregions) to higher resolution land-use maps of production, resulting in a high uncertainty and applicability (Chaudhary and Brooks, 2018).
Water footprints have generally assessed quantities of blue, green and grey water use, describing the ground and surface water, the soil moisture and the pollution of freshwater, respectively (Berger et al., 2021; Hoekstra and Mekonnen, 2012). In recent years, efforts have been made to develop more integrated water footprints to address local impacts (Berger et al., 2021; Pierrat et al., 2023; Schomberg et al., 2021). Impacts assessments often address freshwater scarcity (Ridoutt and Pfister, 2010; Schomberg et al., 2021), but also impacts on water quality (Schomberg et al., 2023) and effects on human health and ecosystems (Berger et al., 2021; Boulay et al., 2011; Pfister et al., 2009; Pierrat et al., 2023) have been addressed. Water scarcity footprints are based on characterization factors that adjust the volumetric impact on fresh water availability (Ridoutt and Pfister, 2010; Schomberg et al., 2021). Using a systems perspective on the water cycles, the recently developed “Water Scarcity Footprint (WSF)” (Schomberg et al., 2021; Schomberg et al., 2022) integrates the different water bodies within a catchment area into one system. It assesses the risk of freshwater scarcity by identifying the amount of withdrawal from the total available water of a basin, without differentiating between the water’s origin. Water withdrawal consists of product-incorporation and evapotranspiration, including irrigation water. The criticality of water use is assessed based on hydrological water availability and use models. Using the same system perspective, water quality impacts can be assessed by calculating the theoretical volume required to dilute water pollution from agriculture to the geogenic background level (Schomberg et al., 2023). As polluted water can no longer be used for purposes with higher quality demands, this helps illustrate the potential of water pollution to cause scarcity of clean freshwater.
Nutrient footprint (phosphorous and nitrogen) studies are limited. So far concepts and scope are diverging. Phosphorous and nitrogen footprints are generally defined as the release to the environment, including for instance agricultural production, food processing, and wastewater processes (Metson et al., 2020; Wu et al., 2021). In contrast to a pure footprint perspective, many studies have focused on studying agricultural systems and nutrient circles, with the aim to reduce input flows to agriculture and close nutrient circles (Papangelou et al., 2021; Wu et al., 2021). Yet, the phosphorous and nitrogen footprints may play a role in further expanded footprint family assessments (Wu et al., 2021).
The EU Bioeconomy footprint (Sinkko et al., 2023) captures 16 indicators commonly used in LCA. It includes e.g., the use of minerals and metals, ionizing radiation, photochemical ozone formation and human toxicity. Several of these indicators are more relevant to abiotic sectors which in combination with the lacking coverage of substitution effects between sectors limits the conclusiveness in terms of policy implications.
To capture both physical scale aspects and key spatially specific impacts of land use, we depict six target footprint indicators for the monitoring of the German bioeconomy. These are: agricultural biomass, forestry biomass, agricultural land, climate, water, and biodiversity. This selection includes a water footprint that captures water quality and accounts for nutrient emissions into water bodies. Thus, it incorporates one important dimension of the nutrient footprints. The proposed comprehensive and manageable set of indicators is informative in providing policy guidance as it relates directly to the main bioeconomy challenges by placing biomass quantities, land use and land use related impacts at the core. This is largely consistent with identified monitoring needs, framed within strong sustainability (Egenolf and Bringezu, 2019; Liobikiene et al., 2019; Liobikiene et al., 2020; O’Brien et al., 2017).
3.2 Methodological approaches to trace global trade flows for national footprint accounting
Next to environmentally extended MRIO-models, physical accounting models (e.g., Material Flow Analysis) – or a hybrid of both–can be used to link consumption to environmental pressures (Bruckner et al., 2015). These approaches are consistent with the conventions for economy-wide material flow accounting (OECD, 2008; UNEP, 2021). However, the choice of the methodological approach has profound impact on the interpretation of the results (Hubacek and Feng, 2016; Kastner et al., 2014). MRIO models comprehensively map of all economic transactions in monetary units, including “virtual flows” of biomass that are indirectly embodied in non-biotic products and services, such as bio-based energy used to transport abiotic goods. Physical accounting models do not account for virtual flows. Instead, they typically combine FAO’s supply-utilization accounts and bilateral trade data to trace actual material flows measured in raw material equivalents. Hybrid accounting approaches in mixed units aim to combine the advantages of physical accounting models’ greater commodity detail with the broader system boundary of MRIO models (Bruckner et al., 2019; Többen et al., 2018).
Alternatively, a bottom-up approach, based on product life cycle assessments, use a selection of representative products (e.g., Table 1, the EU Bioeconomy Footprint). This approach faces the biggest challenges in the selection of products and the upscaling to total national consumption as it cannot be comprehensive in its coverage (Sinkko et al., 2023).
4 An integrated modelling approach for policy-relevant footprint accounting
In contribution to the envisioned monitoring framework (Figure 3), we suggest an integrated footprint assessment approach of six key footprint indicators capturing both pressures and spatially specific impacts. This approach for footprint accounting has been designed within the research project SYMOBIO (Systemic Monitoring and Modelling of the Bioeconomy) during two consolidation phases for the development of a monitoring system of the German bioeconomy. The core structure have been used to calculate five environmental footprints of the German bioeconomy (Bringezu et al., 2021b; Bringezu et al., 2021a). Other publications based on this modelling approach have addressed consumption-driven land-use change (Hennenberg et al., 2022), the impacts of timber consumption on biodiversity (Egenolf et al., 2023) and the water quality footprint (Schomberg et al., 2023).
4.1 Designing an integrated modelling approach
The main goal of the integrated modelling approach is to comprehensively account for the biomass and agricultural land required to meet national consumption levels, the associated environmental pressures, and the spatially specific impacts on ecosystems. It combines an MRIO-model with a set of spatially explicit simulation models and analytical tools for environmental impact assessment and environmental footprint calculations. In order to provide a system that facilitates long-term periodic monitoring, the approach fulfils three additional requirements: First, it provides a manageable number of indicators that are easy to understand and communicate in a monitoring context. Second, the modular structure allows for the independent development or replacement of individual databases or models, facilitating the integration of important research advances and the continuous development of the tool. Third, the MRIO core allows for socio-economic modelling and supports ex-ante evaluation of policy strategies, for example, through exploratory scenarios of changes in demand and supply.
In its current form, the modelling structure has six headline indicators addressing agricultural and forest biomass, climate, water scarcity, agricultural land use and biodiversity (Figure 4). The agricultural land footprint is further divided into cropland and grassland. As water footprint, we adopt the water scarcity footprint (Schomberg et al., 2022) which has two subcomponents, one for water quantity and another for water quality (see section 3.1). The climate footprint includes GHG emissions released through land-use change. The biodiversity footprint relies on high resolution data on both species’ distribution and commodities’ production areas. This footprint, which is under development, contribute further to the establishment of a fine-scale biodiversity footprint. Through the consumption-based accounting, the footprint results can be benchmarked against globally safe and just shares of resource use.
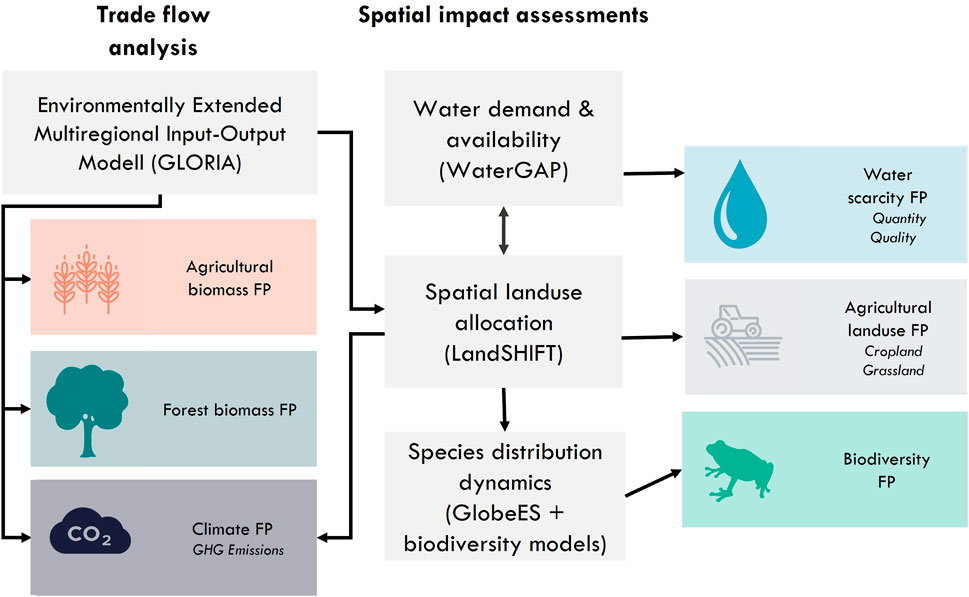
Figure 4. The SYMOBIO modelling approach for national footprint assessment of the bioeconomy. Grey boxes depict modelling entities with the specific models used in SYMOBIO 2.0 in brackets. FP: Footprint. Forest and agricultural biomass FPs are material FPs, given as Raw Material Consumption, RMC. The climate FP (given as GHG emissions) has spatially specific components related to land-use change (LUC). The agricultural land use FP is given as cropland and grassland quantities, it is spatially allocated enabling further land quality assessments. Water and biodiversity FPs display spatially specific environmental impacts. The integrated modelling consists of an MRIO-model supporting the trade flow analysis (GLORIA, Lenzen et al., 2017; Lenzen et al., 2022), a spatial land use allocation model (LandSHIFT, Schaldach et al., 2011), a hydrological model of water demand and availability (WaterGAP, Alcamo et al., 2003) and species occupancy modelling system that include the spatial distribution of thirty thousand vertebrates and characteristics of their habitats. The latter is based on a global ecosystem database (GlobeES) and biodiversity models of species range-dynamics. Icons: ©Adobe Stock (licensed).
4.2 The MRIO core to trace global trade flows of national consumption
The MRIO traces global supply chains from place of consumption to the country of production. We use a monetary MRIO model to comprehensively account for biomass requirements. This is especially relevant for capturing virtual flows, as non-food uses of biomass, such as bioenergy or bio-based chemical products, play a significant role in the bioeconomy and its development. The International Resource Panel’s (IRP) MRIO database, GLORIA, provides institutional support for future updates. GLORIA covers 164 regions and 120 sectors. The MRIO analysis provides the crop- and country-specific data for German national consumption.
The Agriculture and Forestry Biomass footprints are calculated based solely on the MRIO. GLORIA’s satellite accounts for materials estimate the physical quantities of primary products that are harvested or grazed, including various crops, grazed biomass, timber, and wood fuel. Dividing these quantities by gross output in monetary units yields biotic extraction intensities. These intensities assist in translating the direct and indirect production requirements in monetary values to physical quantities. The choice of using monetary values has a significant impact on the interpretation of the results as the monetary value is not intrinsically linked to biophysical properties. Depending on whether physical or monetary data is used, outcomes may differ for instance in terms of which countries are net-exporters or imports of biomass (Hubacek and Feng, 2016). Monetary MRIO models provide a comprehensive mapping of all economic transactions in monetary units, including intermediate transactions and losses. For instance, the supply chain of cotton imported by China for the production of clothing for export is fully represented in MRIO, regardless of potential losses within the processing sectors. In contrast, physical trade flow analyses often lack this comprehensive perspective, as they may overlook significant portions of the commodity chain beyond the initial importing country (Hubacek and Feng, 2016). Hybrid accounting approaches in mixed units aim at combining the advantages of much greater commodity detail of physical accounting models with the broader system boundary of MRIO models to account for direct non-food use as well as virtual consumption of biomass (Bruckner et al., 2019; Többen et al., 2018).
4.3 Spatial land use allocation to assess agricultural land use and land-use change
The land use model LandSHIFT (Schaldach et al., 2011) utilizes region- and country-specific crop and livestock production data from the MRIO model, which covers the entire world (Figure 5, GLORIA and LandSHIFT). Some OECD/FAO (2023) crop production and livestock data are also linked to the MRIO to inform LandSHIFT. The production is downscaled to a 5 arc-min raster in a two-step procedure. Firstly, the model assesses the suitability of the raster cells for crop production and livestock grazing. Based on this information, the second step assigns crop production and grazing livestock to the most appropriate cells. Cropland is further classified as rain-fed or irrigated. The results are global maps that show the spatial distribution of cropland and grassland used for grazing purposes (Figure 5, LandSHIFT). With this information, additional environmental impacts that are influenced by the actual location of agricultural areas can be identified. The land use data generated is utilized as input for computing the water, climate, and biodiversity footprints.
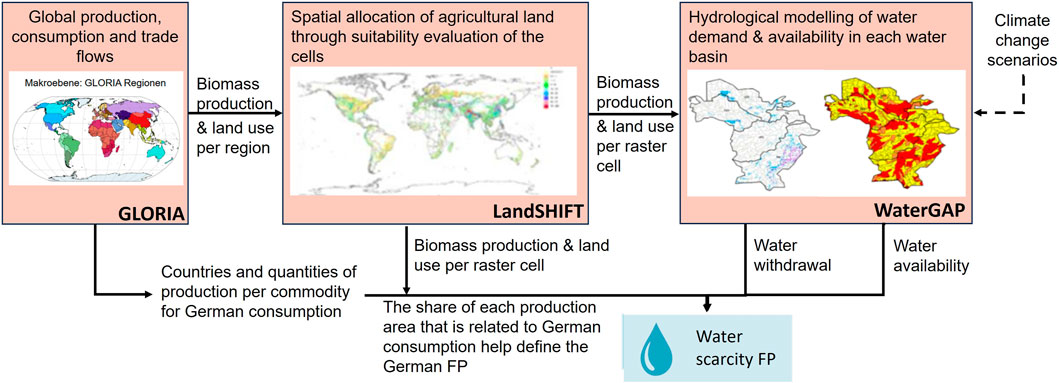
Figure 5. Linking the global trade model (GLORIA) and the spatially specific land and water models (LandSHIFT and WaterGAP), using the water scarcity footprint as an example. The crop-specific landuse and water availability and demand are modelled for the total global production. The consumption-based accounting from the MRIO provides the share that is allocated to the consumption footprint of Germany. In line with the integrated modelling approach, WaterGAP also supports ex-ante assessments as it estimates water availability under different climate scenarios.
The Agricultural Land Footprint is determined by combining the MRIO information on trade related to German consumption with the cropland and grazing land maps. It defines the amount of land occupied in the respective countries for producing agricultural commodities exported to Germany (Figure 5, combining GLORIA with LandSHIFT).
The Climate Footprint is constructed by combining two sources of GHG emissions. First, the GLORIA database provides satellite accounts for GHG emissions according to standard reporting (EDGAR (Crippa et al., 2023). This includes fossil fuel combustion, emissions from industrial and agricultural processes but excludes land-use, land-use change and forestry (LULUCF). For mixed sectors, estimated bio-based shares are used to determine how much of the sectoral GHG emissions is to be allocated to the bioeconomy (Iost et al., 2019). Second, the CO2 emissions related to land-use change resulting from the production of specific commodities are estimated using the IPCC Tier 1 approach (IPCC, 2019), based on spatially specific land-use modeling. The approach from Hennenberg et al. (2022) is used to allocate land-use change to consumption and is sensitive to the chosen time period (Hennenberg et al., 2022).
4.4 Species distribution dynamics add a biodiversity impact assessment
The biodiversity assessment is based on the land use maps generated through LandSHIFT. The spatial estimates of commodity-specific production areas and yields produced by the LandSHIFT model for a given series of years (i.e., the monitoring horizon) is linked to time-series of species distribution estimates for terrestrial vertebrate species. The latter are modelled using range-dynamics models that integrate species occurrence information with time-series of >50 terrestrial, freshwater, and intertidal ecosystem types (GlobeES, www.globesdata.org) and ancillary species-specific and environmental information. Linking the land-use and biodiversity models allows quantifying, for a given area and period of interest, in how far a given species’ potentially occupied habitat has changed due to land-use changes that are attributable to the production of a given commodity.
The Biodiversity Footprint in each source region is calculated by further aggregating the source region’s pixel-level habitat-change information across the respective groups of exported commodities and affected species. This source-region-specific footprint information is then linked to the MRIO model to provide the biodiversity losses and gains related to German consumption.
4.5 Spatial water demand and availability assessment
The water demand and availability model, WaterGAP (Flörke et al., 2013; Verzano et al., 2012), is a hydrological model operating on the same grid as LandSHIFT. The WaterGAP model provides data on water requirements for each cropland cell and water scarcity on basin level. Crop-specific irrigation water requirements are calculated using an established irrigation planning and management approach (Schaldach et al., 2012; Smith, 1996) whereas water scarcity is based on data on basin-level water availability and water use are generated by the global water model WaterGAP. The integrated modelling enables ex-ante assessments using different climate change scenarios for the water availability assessments which are integrated in WaterGAP.
The water scarcity footprint links the spatial pattern of irrigated cropland from LandSHIFT with the German consumption shares from the MRIO analysis (Figure 5). It has two components: First, the water quantity footprint refers to the physical quantities of water used and how it risks contributing to regional water scarcity. It is calculated by combining water withdrawals with different levels of water scarcity. Second, the water quality footprint refers to the virtual volumes required to dilute polluted water to its natural quality level. This assessment rely on additional data on input and fate of nutrients and pesticides that are provided by external sources (such as IMAGE and UseTox) (Schomberg et al., 2023). Virtual volumes are important because water pollution contributes to regional water scarcity when polluted water is no longer suitable for certain uses.
4.6 Relevance for strategic management of the bioeconomy
The relevance of this monitoring framework for the strategic management of the bioeconomy lies in its ability to (1) link spatially disconnected biomass consumption to pressures and impacts at the place of production and (2) thereby make it possible to assess the overall scale of the bioeconomy in relation to a safe and just operating space. In this sense, the footprint approach helps to answer questions such as ‘how much biomass could policymakers count on to design a future-oriented bioeconomy that contributes to solving environmental problems, given a just distribution of the global operating space?’ The footprint approach complements sectoral and meso-level indicators by assessing the bioeconomy in relation to framework conditions for sustainability. Below we illustrate this with some findings based on this approach and discuss their policy implications.
Using the proposed modeling approach, Beck-O´Brien et al. (2024) found that the German agricultural biomass footprint was 4.1 t per capita in 2021. This significantly exceeds the global average of 2.8 t per person and is double the upper target of 2 t biomass per capita (Bringezu, 2015). The German biomass consumption in 2021 was associated with an agricultural land footprint of 0.56 ha per capita, which is 2.8 times the agricultural land available in Germany. Of the agricultural land footprint, 88% was in foreign countries, most prominently in Argentina, the USA and China (Beck-O´Brien et al., 2024). Moreover, the analysis showed that in 2020, 16% of the total water footprint of the German bioeconomy was related to regions suffering from high water stress, led by Iran, Egypt, Pakistan, Tunisia, Libya and Syria (Beck-O´Brien et al., 2024).
These findings have several policy-relevant implications. Here, we will discuss a few. First and foremost, the findings imply that given the proposed benchmark range for a safe and just level of biomass consumption, there is no room for physical expansion of the German bioeconomy. Thus, the strategic considerations for a future-oriented bioeconomy should focus on priority setting between different sectors and the efficient and sufficient use of natural resources (including e.g., re-use and cascading use). Such information provides framework conditions for the German “National Strategy for Biomass Use” (NABIS) which is under development (BMWK et al., 2022). The analysis further revealed that more than half of the agricultural biomass footprint is made up of fodder crops, pastures and straw for livestock, 22% is made up of sugar crops, oilseeds and crop residues, while cereals, vegetables, fruits and nuts together make up 26% (Beck-O'Brien et al., 2024). Priority setting may imply efficiency and sufficiency measures in the energy and food sectors (e.g., by promoting more plant-based diets and supporting innovation for increased resource efficiency), which may free up resources for increased biomass use, e.g., in the biotechnology sector.
Second, the results show that considerable amounts of land are exploited in foreign countries for German consumption, partly in the global south. This calls for political attention as the spatial disconnect potentially covers both environmental and social impacts. Hennenberg et al. (2022) used the core structure of the proposed modelling approach and found that Germany significantly contributed to foreign land use change in the past (see references for methodological deviations from the introduced approach). The high water scarcity in some production regions further underscores the issue of exploiting resources in foreign countries where consequences are not visible for the consumers. Spatially specific impact assessments thereby underscore the role of import patterns as a conveyor for environmental impacts abroad.
Third, mapping both import quantities but also environmental pressures and impacts of imports from different countries and regions carry strategically relevant information for economic development. Import dependencies particularly associated with environmental and geopolitical risks can be identified. For example, high competition for water can be foreseen and mitigated, potential land use-conflicts can be identified and import dependencies of products from geopolitically unstable regions can be mitigated by strategically investing in domestic production or by strengthening other trade relations.
In sum, footprints and benchmarks provide information about the order of magnitude that biobased resources can be expected to be available under the premises of sustainability as well as disclose import patterns and their environmental impacts. By providing the evidence base, national consumption footprints can be used to build support for strategic decisions related to e.g., priority setting of resource use among the different bioeconomy options. This aggregated national consumption perspective complements specific sectoral and subregional indicators for bioeconomy processes within Germany, which can inform policy interventions on a management and industry level, for instance to identify and mobilizable secondary raw materials.
4.7 Needs and challenges for regular monitoring
To implement the proposed modelling approach into an official periodic monitoring system, several remaining needs and requirements need to be addressed. First, there is a need to define benchmarks that put the bioeconomy footprints in relation to a safe and just operating space. Estimates of safe and just consumption shares of global resources are particularly relevant. Such benchmarks must be further developed and involve a social discourse, they must be based on best available scientific evidence and regularly updated and adjusted. Other informative references can also be used as complementary benchmarks, such as regionally available resources or global averages. Estimates of various benchmarks are constantly improving, especially on a global scale for safe and equitable levels.
Second, a regular collection and compilation of data would be needed and must be strengthened in various aspects for the models introduced. Data collection demands significant time and resources. To bridge the gap between the raw data needs and their availability, models and estimates can help filling the gaps in historical and projection data. These are based on known parameters such as GDP growth and sectoral development and assumptions of constancy of intensities or shares. Yet, such model-based estimates come with costs of reduced robustness and need to be carefully assessed. We welcome more regular data collection and synthesizing in the fields of MRIO, irrigation water use, global remote sensing data of global land use and land cover as well as spatial species occupancy data.
Last, a regular footprint assessment relies on institutional settings (ministries, agencies, research centers etc.) with the mandate, capacity, and trained personnel to collect and cross-check raw data, run the models, and present the resulting footprint. Due to the different areas involved, a collaborative approach across several institutions and expert fields might be suitable. Cross-benefits with German National Strategy for Biomass Use and other sustainability assessments seem meaningful, including an integration on EU-level.
5 Conclusion
Three main characteristics make footprints–and in particular, the proposed set of six footprint indicators–meaningful to the monitoring of bioeconomy strategies, both at the EU and at national levels. First, footprints have the potential to capture both environmental impacts and how the related biomass use is distributed between regions, which are needed for targeting a safe and just operating space and thus the maintenance of the biomass provisioning systems. Second, the selected set of footprints captures key challenges of the bioeconomy by addressing the physical scale of the bioeconomy, the land use requirements and decisive spatially specific impacts on water scarcity and biodiversity. Third, by highlighting a comprehensive and manageable set of footprints, key bioeconomy challenges are disclosed, feeding into current bioeconomy discourses, and spurring societal learning.
The presented modelling approach illustrates how high-resolution geographical models and related databases can be integrated into an MRIO-driven footprint accounting structure. Through its modular structure, it provides the flexibility that makes the approach suitable also for continuous monitoring systems–where specific models can independently be further developed or exchanged. Thus, it paves the way for comprehensive footprint monitoring that includes place-specific ecosystem impact assessments.
Author contributions
HH: Conceptualization, Investigation, Methodology, Visualization, Writing – original draft, Writing – review and editing. MB-O’: Conceptualization, Project administration, Writing – original draft, Writing – review and editing. CL: Conceptualization, Formal Analysis, Methodology, Writing – review and editing. RS: Conceptualization, Formal Analysis, Methodology, Writing – review and editing. AS: Methodology, Writing – review and editing. JT: Writing – original draft, Conceptualization, Writing – review and editing. SB: Conceptualization, Funding acquisition, Methodology, Project administration, Writing – review and editing.
Funding
The author(s) declare that financial support was received for the research and/or publication of this article. We express our gratitude for the financial support of this research by the German Federal Ministry of Education and Research, research project “Monitoring Bioeconomy: SYMOBIO 2.0 – Consolidation of the Systemic Monitoring and Modelling of the Bioeconomy” [Grant Number 031B1129A].
Acknowledgments
The authors want to thank Martin Distelkamp, Mark Meyer, Saskia Reuschel, Jan Schüngel, Ellen Kynast, Florian Wimmer, Carsten Meyer and Talita Ferreira Amado for their contribution to the development of the modelling framework, and Verena Pommerenke for her contribution to the design of figures. The authors would also like to thank the reviewers, whose comments significantly improved the manuscript.
Conflict of interest
The authors declare that the research was conducted in the absence of any commercial or financial relationships that could be construed as a potential conflict of interest.
Generative AI statement
The author(s) declare that Generative AI was used in the creation of this manuscript. Generative AI (DeepL write) was used for single sentences or paragraphs to improve formulations, grammar and/or check spelling. The authors declare full responsibility for the chosen formulations.
Publisher’s note
All claims expressed in this article are solely those of the authors and do not necessarily represent those of their affiliated organizations, or those of the publisher, the editors and the reviewers. Any product that may be evaluated in this article, or claim that may be made by its manufacturer, is not guaranteed or endorsed by the publisher.
References
Alcamo, J., Döll, P., Henrichs, T., Kaspar, F., Lehner, B., Rösch, T., et al. (2003). Development and testing of the WaterGAP 2 global model of water use and availability. Hydrological Sci. J. 48 (3), 317–337. doi:10.1623/hysj.48.3.317.45290
Allan, J. A. (1998). Virtual water: a strategic resource global solutions to regional deficits. Ground Water 36 (4), 545–546. doi:10.1111/j.1745-6584.1998.tb02825.x
Beck-O’Brien, M., Egenolf, V., Winter, S., Zahnen, J., and Griesshammer, N. (2022). Everything from wood: the resource of the future or the next crisis? How footprints, benchmarks and targets can support a balanced bioeconomy transition. Berlin: WWF Germany.
Beck-O´Brien, M., Bringezu, S., Banse, M., Barrelet, J., Bezama, A., Bösch, M., et al. (2024). Monitoring the German bioeconomy. doi:10.17170/KOBRA-2024111510679
Berger, M., Campos, J., Carolli, M., Dantas, I., Forin, S., Kosatica, E., et al. (2021). Advancing the water footprint into an instrument to support achieving the SDGs – recommendations from the “water as a global resources” research initiative (GRoW). Water Resour. Manag. 35 (4), 1291–1298. doi:10.1007/s11269-021-02784-9
BMBF/BMEL (2020). National bioeconomy strategy. Berlin, Germany: Federal Ministry of Education and Research (BMBF) and Federal Ministry of Food and Agriculture (BMEL).
BMWK, BMEL, and BMUV (2022). Eckpunkte für eine Nationale Biomassestrategie (NABIS). Available online at: https://www.bmel.de/SharedDocs/Downloads/DE/_Landwirtschaft/Nachwachsende-Rohstoffe/eckpunkte-nationale-biomassestrategie-nabis.html (Accessed January 10, 2025).
Boulay, A.-M., Bulle, C., Bayart, J.-B., Deschênes, L., and Margni, M. (2011). Regional characterization of freshwater Use in LCA: modeling direct impacts on human health. Environ. Sci. and Technol. 45 (20), 8948–8957. doi:10.1021/es1030883
Bringezu, S., Banse, M., Ahmann, L., Bezama, N. A., Billig, E., Bischof, R., et al. (2021b). Pilot report on the monitoring of the German bioeconomy. doi:10.17170/KOBRA-202201115406
Bringezu, S., Distelkamp, M., Lutz, C., Wimmer, F., Schaldach, R., Hennenberg, K. J., et al. (2021a). Environmental and socioeconomic footprints of the German bioeconomy. Nat. Sustain. 4 (9), 775–783. doi:10.1038/s41893-021-00725-3
Bringezu, S. (2015). Possible target corridor for sustainable use of global material resources. Resources 4 (1), 25–54. doi:10.3390/resources4010025
Bringezu, S. (2022). The World Budget: safe and fair use of resources for global survival and well-being. Stefan: Bringezu.
Bruckner, M., Fischer, G., Tramberend, S., and Giljum, S. (2015). Measuring telecouplings in the global land system: a review and comparative evaluation of land footprint accounting methods. Ecol. Econ. 114, 11–21. doi:10.1016/j.ecolecon.2015.03.008
Bruckner, M., Häyhä, T., Giljum, S., Maus, V., Fischer, G., Tramberend, S., et al. (2019). Quantifying the global cropland footprint of the European Union’s non-food bioeconomy. Environ. Res. Lett. 14 (4), 45011. doi:10.1088/1748-9326/ab07f5
Chaudhary, A., and Brooks, T. M. (2018). Land use intensity-specific global characterization factors to assess product biodiversity footprints. Environ. Sci. and Technol. 52 (9), 5094–5104. doi:10.1021/acs.est.7b05570
Chaudhary, A., Carrasco, L. R., and Kastner, T. (2017). Linking national wood consumption with global biodiversity and ecosystem service losses. Sci. total Environ. 586, 985–994. doi:10.1016/j.scitotenv.2017.02.078
Chaudhary, A., and Kastner, T. (2016). Land use biodiversity impacts embodied in international food trade. Glob. Environ. Change 38, 195–204. doi:10.1016/j.gloenvcha.2016.03.013
Chaudhary, A., Verones, F., Baan, L. de, and Hellweg, S. (2015). Quantifying land use impacts on biodiversity: combining species-area models and vulnerability indicators. Environ. Sci. and Technol. 49 (16), 9987–9995. doi:10.1021/acs.est.5b02507
Crippa, M., Guizzardi, D., Pagani, F., Banja, M., Muntean, M., Schaaf, E., et al. (2023), GHG emissions of all world countries. Luxembourg: Publications Office of the European Union. doi:10.2760/953332
De Laurentiis, V., Galli, A., and Sala, S. (2022). Modelling the land footprint of EU consumption (JRC technical report JRC128072). Eur. Komm. Luxembourg: Publications Office of the European Union. doi:10.2760/97417
Dorninger, C., Wehrden, H. von, Krausmann, F., Bruckner, M., Feng, K., Hubacek, K., et al. (2021). The effect of industrialization and globalization on domestic land-use: a global resource footprint perspective. Glob. Environ. Change 69, 102311. doi:10.1016/j.gloenvcha.2021.102311
Egenolf, V., and Bringezu, S. (2019). Conceptualization of an indicator system for assessing the sustainability of the bioeconomy. Sustainability 11 (2), 443. doi:10.3390/su11020443
Egenolf, V., Schüngel, J., Bringezu, S., and Schaldach, R. (2023). The impact of the German timber footprint on potential species loss in supply regions. Sci. total Environ. 901, 165897. doi:10.1016/j.scitotenv.2023.165897
Egenolf, V., Vita, G., Distelkamp, M., Schier, F., Hüfner, R., and Bringezu, S. (2021). The timber footprint of the German bioeconomy—state of the art and past development. Sustainability 13 (7), 3878. doi:10.3390/su13073878
Egli, L., Meyer, C., Scherber, C., Kreft, H., and Tscharntke, T. (2018). Winners and losers of national and global efforts to reconcile agricultural intensification and biodiversity conservation. Glob. change Biol. 24 (5), 2212–2228. doi:10.1111/gcb.14076
Escobar, N., Tizado, E. J., Ermgassen, E. K. zu, Löfgren, P., Börner, J., and Godar, J. (2020). Spatially-explicit footprints of agricultural commodities: mapping carbon emissions embodied in Brazil's soy exports. Glob. Environ. Change 62, 102067. doi:10.1016/j.gloenvcha.2020.102067
EU (2022). DECISION (EU) 2022/591 of the EUROPEAN parliament and of the council of 6 april 2022 on a general union environment action programme to 2030. Official J. Eur. Union. Available online at: https://eur-lex.europa.eu/legal-content/EN/TXT/?uri=CELEX:32022D0591 (Accessed January 10, 2025).
European Commission (2018). A sustainable bioeconomy for Europe: strengthening the connection between economy, society and the environment: updated bioeconomy strategy. Luxembourg: Publications Office of the European Union. doi:10.2777/792130
Fang, K., Heijungs, R., and Snoo, G. R. (2015). Understanding the complementary linkages between environmental footprints and planetary boundaries in a footprint–boundary environmental sustainability assessment framework. Ecol. Econ. 114, 218–226. doi:10.1016/j.ecolecon.2015.04.008
Ferretto, A., Matthews, R., Brooker, R., and Smith, P. (2022). Planetary Boundaries and the Doughnut frameworks: a review of their local operability. Anthropocene 39, 100347. doi:10.1016/j.ancene.2022.100347
Fischer-Kowalski, M., Krausmann, F., Giljum, S., Lutter, S., Mayer, A., Bringezu, S., Moriguchi, Y., Schütz, H. [H.], Schandl, H. [H.], and Weisz, H. (2011). Methodology and indicators of economy-wide material flow accounting. J. Industrial Ecol. 15 (6), 855–876. doi:10.1111/j.1530-9290.2011.00366.x
Flörke, M., Kynast, E., Bärlund, I., Eisner, S., Wimmer, F., and Alcamo, J. (2013). Domestic and industrial water uses of the past 60 years as a mirror of socio-economic development: a global simulation study. Glob. Environ. Change 23 (1), 144–156. doi:10.1016/j.gloenvcha.2012.10.018
Green, J. M. H., Croft, S. A., Durán, A. P., Balmford, A. P., Burgess, N. D., Fick, S., et al. (2019). Linking global drivers of agricultural trade to on-the-ground impacts on biodiversity. Proc. Natl. Acad. Sci. U. S. A. 116 (46), 23202–23208. doi:10.1073/pnas.1905618116
Gu, B., Leach, A. M., Ma, L., Galloway, J. N., Chang, S. X., Ge, Y., et al. (2013). Nitrogen footprint in China: food, energy, and nonfood goods. Environ. Sci. and Technol. 47 (16), 9217–9224. doi:10.1021/es401344h
Gupta, J., Liverman, D., Prodani, K., Aldunce, P., Bai, X., Broadgate, W., et al. (2023). Earth system justice needed to identify and live within Earth system boundaries. Nat. Sustain. 6 (6), 630–638. doi:10.1038/s41893-023-01064-1
Häyhä, T., Lucas, P. L., van Vuuren, D. P., Cornell, S. E., and Hoff, H. (2016). From Planetary Boundaries to national fair shares of the global safe operating space — how can the scales be bridged? Glob. Environ. Change 40, 60–72. doi:10.1016/j.gloenvcha.2016.06.008
Helander, H., Bruckner, M., Leipold, S., Petit-Boix, A., and Bringezu, S. (2021). Eating healthy or wasting less? Reducing resource footprints of food consumption. Environ. Res. Lett. 16 (5), 054033. doi:10.1088/1748-9326/abe673
Hennenberg, K. J., Gebhardt, S., Wimmer, F., Distelkamp, M., Lutz, C., Böttcher, H., et al. (2022). Germany’s agricultural land footprint and the impact of import pattern allocation. Sustainability 14 (1), 105. doi:10.3390/su14010105
Hickel, J., Dorninger, C., Wieland, H., and Suwandi, I. (2022). Imperialist appropriation in the world economy: drain from the global South through unequal exchange, 1990–2015. Glob. Environ. Change 73, 102467. doi:10.1016/j.gloenvcha.2022.102467
Hoekstra, A. Y., and Mekonnen, M. M. (2012). The water footprint of humanity. Proc. Natl. Acad. Sci. U. S. A. 109 (9), 3232–3237. doi:10.1073/pnas.1109936109
Hubacek, K., and Feng, K. (2016). Comparing apples and oranges: some confusion about using and interpreting physical trade matrices versus multi-regional input–output analysis. Land Use Policy 50, 194–201. doi:10.1016/j.landusepol.2015.09.022
Iost, S., Labonte, N., Banse, M., Geng, N., Jochem, D., Schweinle, J., et al. (2019). German bioeconomy: economic importance and concept of measurement, 68, doi:10.52825/gjae.v68i4.2141
IPCC (2019). 2019 refinement to the 2006 IPCC guidelines for national greenhouse gas inventories. Available online at: https://www.ipcc.ch/report/2019-refinement-to-the-2006-ipcc-guidelines-for-national-greenhouse-gas-inventories/ (Accessed January 10, 2025).
IRP (2020). Global resources outlook 2019: natural resources for the future we want. Kenya. doi:10.18356/689a1a17-en
Jiang, S., Hua, H., Sheng, H., Jarvie, H. P., Liu, X., Zhang, Y., Yuan, Z., Zhang, L., and Liu, X. (2019). Phosphorus footprint in China over the 1961-2050 period: historical perspective and future prospect. Sci. total Environ. 650 (Pt 1), 687–695. doi:10.1016/j.scitotenv.2018.09.064
Kardung, M., Costenoble, O., Dammer, L., Lovrić, M., van Leeuwen, M., M'Barek, R., et al. (2019). BioMonitor: task 1.1: setting the scope for the bioeconomy.
Kastner, T., Schaffartzik, A., Eisenmenger, N., Erb, K.-H., Haberl, H., and Krausmann, F. (2014). Cropland area embodied in international trade: contradictory results from different approaches. Ecol. Econ. 104, 140–144. doi:10.1016/j.ecolecon.2013.12.003
Leach, A. M., Galloway, J. N., Bleeker, A., Erisman, J. W., Kohn, R., and Kitzes, J. (2012). A nitrogen footprint model to help consumers understand their role in nitrogen losses to the environment. Environ. Dev. 1 (1), 40–66. doi:10.1016/j.envdev.2011.12.005
Lenzen, M., Geschke, A., Abd Rahman, M. D., Xiao, Y., Fry, J., Reyes, R., et al. (2017). The Global MRIO Lab – charting the world economy. Econ. Syst. Res. 29 (2), 158–186. doi:10.1080/09535314.2017.1301887
Lenzen, M., Geschke, A., West, J., Fry, J., Malik, A., Giljum, S., Milà i Canals, L., Piñero, P., Lutter, S., Wiedmann, T., Li, M., Sevenster, M., Potočnik, J., Teixeira, I., van Voore, M., Nansai, K., and Schandl, H. (2022). Implementing the material footprint to measure progress towards Sustainable Development Goals 8 and 12. Nat. Sustain. 5 (2), 157–166. doi:10.1038/s41893-021-00811-6
Lenzen, M., Moran, D., Kanemoto, K., Foran, B., Lobefaro, L., and Geschke, A. (2012). International trade drives biodiversity threats in developing nations. Nature 486 (7401), 109–112. doi:10.1038/nature11145
Li, M., Wiedmann, T., and Hadjikakou, M. (2019). Towards meaningful consumption-based planetary boundary indicators: the phosphorus exceedance footprint. Glob. Environ. Change 54, 227–238. doi:10.1016/j.gloenvcha.2018.12.005
Li, X., Xing, L., Zhang, Z., and Zhang, Y. (2022). National accounting scheme for biodiversity loss: an international trade perspective. Front. Environ. Sci. 10. doi:10.3389/fenvs.2022.1000970
Liobikiene, G., Balezentis, T., Streimikiene, D., and Chen, X. (2019). Evaluation of bioeconomy in the context of strong sustainability. Sustain. Dev. 27 (5), 955–964. doi:10.1002/sd.1984
Liobikiene, G., Chen, X., Streimikiene, D., and Balezentis, T. (2020). The trends in bioeconomy development in the European Union: exploiting capacity and productivity measures based on the land footprint approach. Land Use Policy 91, 104375. doi:10.1016/j.landusepol.2019.104375
Metson, G. S., MacDonald, G. K., Leach, A. M., Compton, J. E., Harrison, J. A., and Galloway, J. N. (2020). The U.S. consumer phosphorus footprint: where do nitrogen and phosphorus diverge? Environ. Res. Lett. 15 (10), 105022. doi:10.1088/1748-9326/aba781
Moran, D., Giljum, S., Kanemoto, K., and Godar, J. (2020). From satellite to supply chain: new approaches connect earth observation to economic decisions. One Earth 3 (1), 5–8. doi:10.1016/j.oneear.2020.06.007
Moran, D., and Kanemoto, K. (2017). Identifying species threat hotspots from global supply chains. Nat. Ecol. and Evol. 1 (1), 0023. doi:10.1038/s41559-016-0023
Neumayer, E. (2000). In defence of historical accountability for greenhouse gas emissions. Ecol. Econ. 33 (2), 185–192. doi:10.1016/S0921-8009(00)00135-X
O'Brien, M., and Bringezu, S. (2018). European timber consumption: developing a method to account for timber flows and the EU's global forest footprint. Ecol. Econ. 147, 322–332. doi:10.1016/j.ecolecon.2018.01.027
O’Brien, M., Schütz, H., and Bringezu, S. (2015). The land footprint of the EU bioeconomy: monitoring tools, gaps and needs. Land Use Policy 47, 235–246. doi:10.1016/j.landusepol.2015.04.012
O’Brien, M., Wechsler, D., Bringezu, S., and Schaldach, R. (2017). Toward a systemic monitoring of the European bioeconomy: gaps, needs and the integration of sustainability indicators and targets for global land use. Land Use Policy 66, 162–171. doi:10.1016/j.landusepol.2017.04.047
OECD (2008). Measuring material flows and resource productivity: volume 1. The OECD guide. Paris, France: OECD Publishing. Available online at: https://www.oecd.org/environment/indicators-modelling-outlooks/MFA-Guide.pdf (Accessed February 26, 2024).
OECD/FAO (2022). OECD-FAO agricultural outlook 2022-2031. Paris: OECD Publishing. doi:10.1787/f1b0b29c-en
Oita, A., Nagano, I., and Matsuda, H. (2018). Food nitrogen footprint reductions related to a balanced Japanese diet. Ambio 47 (3), 318–326. doi:10.1007/s13280-017-0944-4
Oita, A., Wirasenjaya, F., Liu, J., Webeck, E., and Matsubae, K. (2020). Trends in the food nitrogen and phosphorus footprints for Asia's giants: China, India, and Japan. Resour. Conservation Recycl. 157, 104752. doi:10.1016/j.resconrec.2020.104752
O’Neill, D. W., Fanning, A. L., Lamb, W. F., and Steinberger, J. K. (2018). A good life for all within planetary boundaries. Nat. Sustain. 1 (2), 88–95. doi:10.1038/s41893-018-0021-4
Papangelou, A., Towa, E., Achten, W. M. J., and Mathijs, E. (2021). A resource-based phosphorus footprint for urban diets. Environ. Res. Lett. 16 (7), 075002. doi:10.1088/1748-9326/ac07d6
Pendrill, F., Persson, U. M., Godar, J., Kastner, T., Moran, D., Schmidt, S., et al. (2019). Agricultural and forestry trade drives large share of tropical deforestation emissions. Glob. Environ. Change 56, 1–10. doi:10.1016/j.gloenvcha.2019.03.002
Pfister, S., Koehler, A., and Hellweg, S. (2009). Assessing the environmental impacts of freshwater consumption in LCA. Environ. Sci. and Technol. 43 (11), 4098–4104. doi:10.1021/es802423e
Pierrat, É., Laurent, A., Dorber, M., Rygaard, M., Verones, F., and Hauschild, M. (2023). Advancing water footprint assessments: combining the impacts of water pollution and scarcity. Sci. total Environ. 870, 161910. doi:10.1016/j.scitotenv.2023.161910
Raworth, K. (2012). A safe and just space for humanity: can we live within the doughnut. Oxford, United Kingdom: Oxfam International.
Raworth, K. (2018). Dougnout economics: seven ways to think like a 21st-century economist. Vermont, US: White River Junction.
Richardson, K., Steffen, W., Lucht, W., Bendtsen, J., Cornell, S. E., Donges, J. F., et al. (2023). Earth beyond six of nine planetary boundaries. Sci. Adv. 9 (37), eadh2458. doi:10.1126/sciadv.adh2458
Ridoutt, B., and Navarro Garcia, J. (2020). Cropland footprints from the perspective of productive land scarcity, malnutrition-related health impacts and biodiversity loss. J. Clean. Prod. 260, 121150. doi:10.1016/j.jclepro.2020.121150
Ridoutt, B. G., and Pfister, S. (2010). A revised approach to water footprinting to make transparent the impacts of consumption and production on global freshwater scarcity. Glob. Environ. Change 20 (1), 113–120. doi:10.1016/j.gloenvcha.2009.08.003
Robert, N., Giuntoli, J., Araujo, R., Avraamides, M., Balzi, E., Barredo, J. I., et al. (2020). Development of a bioeconomy monitoring framework for the European Union: an integrative and collaborative approach. New Biotechnol. 59, 10–19. doi:10.1016/j.nbt.2020.06.001
Rockström, J., Gupta, J., Lenton, T. M., Qin, D., Lade, S. J., Abrams, J. F., et al. (2021). Identifying a safe and just corridor for people and the planet. Earth's Future 9 (4). doi:10.1029/2020EF001866
Rockström, J., Gupta, J., Qin, D., Lade, S. J., Abrams, J. F., Andersen, L. S., et al. (2023). Safe and just Earth system boundaries. Nature 619 (7968), 102–111. doi:10.1038/s41586-023-06083-8
Rogelj, J., Shindell, D., Jiang, K., Fifita, S., Forster, P., Ginzburg, V., et al. (2018). “Mitigation pathways compatible with 1.5°C in the context of sustainable development,” in IPCC (hrsg.), global Warming of 1.5°C (S. 93–174) (Cambridge University Press). doi:10.1017/9781009157940.004
Schaldach, R., Alcamo, J., Koch, J., Kölking, C., Lapola, D. M., Schüngel, J., et al. (2011). An integrated approach to modelling land-use change on continental and global scales. Environ. Model. and Softw. 26 (8), 1041–1051. doi:10.1016/j.envsoft.2011.02.013
Schaldach, R., Koch, J., Beek, T., Kynast, E., and Flörke, M. (2012). Current and future irrigation water requirements in pan-Europe: an integrated analysis of socio-economic and climate scenarios. Glob. Planet. Change 94-95, 33–45. doi:10.1016/j.gloplacha.2012.06.004
Schaldach, R., Wimmer, F., Koch, J., Volland, J., Geissler, K., and Köchy, M. (2013). Model-based analysis of the environmental impacts of grazing management on Eastern Mediterranean ecosystems in Jordan. J. Environ. Manag. 127 (Suppl. l), S84–S95. doi:10.1016/j.jenvman.2012.11.024
Schlesier, H., Schäfer, M., and Desing, H. (2024). Measuring the Doughnut: a good life for all is possible within planetary boundaries. J. Clean. Prod. 448, 141447. doi:10.1016/j.jclepro.2024.141447
Schomberg, A. C., Bringezu, S., and Beusen, A. W. H. (2023). Water quality footprint of agricultural emissions of nitrogen, phosphorus and glyphosate associated with German bioeconomy. Commun. Earth and Environ. 4 (1), 404. doi:10.1038/s43247-023-01054-3
Schomberg, A. C., Bringezu, S., and Flörke, M. (2021). Extended life cycle assessment reveals the spatially-explicit water scarcity footprint of a lithium-ion battery storage. Commun. Earth and Environ. 2 (1), 11. doi:10.1038/s43247-020-00080-9
Schomberg, A. C., Bringezu, S., Flörke, M., and Biederbick, H. (2022). Spatially explicit life cycle assessments reveal hotspots of environmental impacts from renewable electricity generation. Commun. Earth and Environ. 3 (1), 197. doi:10.1038/s43247-022-00521-7
Sinkko, T., Sanyé-Mengual, E., Corrado, S., Giuntoli, J., and Sala, S. (2023). The EU Bioeconomy Footprint: using life cycle assessment to monitor environmental impacts of the EU Bioeconomy. Sustain. Prod. Consum. 37, 169–179. doi:10.1016/j.spc.2023.02.015
Smith, M. (1996). CROPWAT: a computer program for irrigation planning and management. FAO Irrigation and drainage paper, 46. Rome, Italy: FAO.
Sun, Z., Behrens, P., Tukker, A., Bruckner, M., and Scherer, L. (2022a). Global human consumption threatens key biodiversity areas. Environ. Sci. and Technol. 56 (12), 9003–9014. doi:10.1021/acs.est.2c00506
Sun, Z., Behrens, P., Tukker, A., Bruckner, M., and Scherer, L. (2022b). Shared and environmentally just responsibility for global biodiversity loss. Ecol. Econ. 194, 107339. doi:10.1016/j.ecolecon.2022.107339
Többen, J., Wiebe, K. S., Verones, F., Wood, R., and Moran, D. D. (2018). A novel maximum entropy approach to hybrid monetary-physical supply-chain modelling and its application to biodiversity impacts of palm oil embodied in consumption. Environ. Res. Lett. 13 (11), 115002. doi:10.1088/1748-9326/aae491
UN (2023). The Sustainable Development Goals Report 2023. Special edition. Towards a Rescue Plan for People and Planet. New York, US: United Nations Publications.
UNEP (2021). The use of natural resources in the economy: a global manual on economy wide material flow accounting. U. N. Environ. Programme. Available online at: https://www.resourcepanel.org/reports/global-manual-economy-wide-material-flow-accounting (Accessed January 10, 2025).
Vanham, D., Bruckner, M., Schwarzmueller, F., Schyns, J., and Kastner, T. (2023). Multi-model assessment identifies livestock grazing as a major contributor to variation in European Union land and water footprints. Nat. food 4 (7), 575–584. doi:10.1038/s43016-023-00797-8
Vanham, D., Leip, A., Galli, A., Kastner, T., Bruckner, M., Uwizeye, A., et al. (2019). Environmental footprint family to address local to planetary sustainability and deliver on the SDGs. Sci. total Environ. 693, 133642. doi:10.1016/j.scitotenv.2019.133642
Vélez-Henao, J. A., and Pauliuk, S. (2023). Material requirements of decent living standards. Environ. Sci. and Technol. doi:10.1021/acs.est.3c03957
Verones, F., Moran, D., Stadler, K., Kanemoto, K., and Wood, R. (2017). Resource footprints and their ecosystem consequences. Sci. Rep. 7, 40743. doi:10.1038/srep40743
Verzano, K., Bärlund, I., Flörke, M., Lehner, B., Kynast, E., Voß, F., et al. (2012). Modeling variable river flow velocity on continental scale: current situation and climate change impacts in Europe. J. Hydrology 424-425, 238–251. doi:10.1016/j.jhydrol.2012.01.005
Weinzettel, J., Hertwich, E. G., Peters, G. P., Steen-Olsen, K., and Galli, A. (2013). Affluence drives the global displacement of land use. Glob. Environ. Change 23 (2), 433–438. doi:10.1016/j.gloenvcha.2012.12.010
Weinzettel, J., Steen-Olsen, K., Hertwich, E. G., Borucke, M., and Galli, A. (2014). Ecological footprint of nations: comparison of process analysis, and standard and hybrid multiregional input–output analysis. Ecol. Econ. 101, 115–126. doi:10.1016/j.ecolecon.2014.02.020
Weinzettel, J., and Wood, R. (2023). Global environmental footprint of food. Nat. food 4 (7), 543–544. doi:10.1038/s43016-023-00801-1
Wiedmann, T., Wilting, H. C., Lenzen, M., Lutter, S., and Palm, V. (2011). Quo vadis MRIO? Methodological, data and institutional requirements for multi-region input–output analysis. Ecol. Econ. 70 (11), 1937–1945. doi:10.1016/j.ecolecon.2011.06.014
Wiedmann, T. O., Schandl, H., Lenzen, M., Moran, D., Suh, S., West, J., et al. (2015). The material footprint of nations. Proc. Natl. Acad. Sci. U. S. A. 112 (20), 6271–6276. doi:10.1073/pnas.1220362110
Wilting, H. C., Schipper, A. M., Bakkenes, M., Meijer, J. R., and Huijbregts, M. A. J. (2017). Quantifying biodiversity losses due to human consumption: a global-scale footprint analysis. Environ. Sci. and Technol. 51 (6), 3298–3306. doi:10.1021/acs.est.6b05296
Keywords: environmental footprints, spatially explicit impact assessment, ecological boundaries, MRIO, indicators
Citation: Helander H, Beck-O’Brien M, Lutz C, Schaldach R, Schomberg A, Többen J and Bringezu S (2025) Six footprints to monitor the bioeconomy into a safe and just future. Front. Environ. Sci. 13:1563666. doi: 10.3389/fenvs.2025.1563666
Received: 20 January 2025; Accepted: 31 March 2025;
Published: 12 May 2025.
Edited by:
Ponnusami Venkatachalam, SASTRA University, IndiaReviewed by:
Jacopo Giuntoli, Independent Researcher, Montecatini Terme, ItalyGautham Jegadeesan, SASTRA University, India
Senthilkumar Rathnasamy, SASTRA University, India
Copyright © 2025 Helander, Beck-O’Brien, Lutz, Schaldach, Schomberg, Többen and Bringezu. This is an open-access article distributed under the terms of the Creative Commons Attribution License (CC BY). The use, distribution or reproduction in other forums is permitted, provided the original author(s) and the copyright owner(s) are credited and that the original publication in this journal is cited, in accordance with accepted academic practice. No use, distribution or reproduction is permitted which does not comply with these terms.
*Correspondence: Hanna Helander, aGwuaGVsYW5kZXJAZ21haWwuY29t
†Present address: Johannes Többen, Jülich Systems' Analysis, Institute of Energy and Climate Systems, Forschungszetrum Jülich, Jülich, Germany