 Ingrid Cintura
 Antonio Arenas
- Department of Civil Construction and Environmental Engineering, Iowa State University, Ames, IA, United States
Climate change has intensified the frequency and severity of droughts, significantly impacting water resources, agriculture, and ecosystems. Traditional drought indicators typically focus on recent conditions rather than future projections, and conventional forecasting methods often struggle to capture the complex, non-linear relationships between long-term climate variables and droughts. This project aims to fill this gap by developing a machine-learning model to project drought conditions in Iowa, specifically focusing on the U.S. Drought Monitor categories. The developed model, a Long Short-Term Memory neural network, was validated to assess its reliability and accuracy. With a Root Mean Squared Error of 0.19 and an R2 of 91%, the model achieved a high level of accuracy, making it effective in guiding conservation practices and enabling timely interventions. The model was trained on historical data from 2012 to 2019 and thoroughly evaluated using out-of-sample data from 2002 to 2011. It exhibited strong performance in the projection of drought conditions across Iowa’s Hydrologic Unit Code 08 watersheds. Drought conditions for the period 2030–2050 were projected using three general circulation models (GCMs): MPI-ESM1-2-HR, BCC-CSM2-MR, and CNRM-ESM2-1. These projections were conducted under two contrasting Shared Socioeconomic Pathways (SSPs): SSP1-2.6, representing a low-emissions sustainability scenario, and SSP5-8.5, reflecting a high-emissions, fossil–fuel–intensive trajectory. Results indicate that droughts in the coming decades will become more intense, prolonged, and frequent, with projections suggesting intensities up to twice as severe and durations and frequencies in northwestern regions up to nine times higher than historical records. Moreover, this research developed an interactive application for visualizing future drought conditions in Iowa. This tool aids users in making informed water management decisions by providing stakeholders with detailed visualizations and technical information.
1 Introduction
Understanding and predicting droughts is key to mitigating their most devastating effects on environmental degradation. The impacts of droughts extend far beyond water scarcity. Economic implications, such as reduced agricultural output, can lead to increased food prices and economic instability in rural communities dependent on farming (Drugova et al., 2022; Gana and Sa’id, 2022). Regions with high ecological vulnerability experience more severe drought impacts, potentially leading to long-term habitat degradation and loss of species (Jordaan et al., 2019). According to the Fifth National Climate Assessment report, droughts and related heatwaves in the U.S. have caused approximately $328 billion in damages between 1980 and 2022 (USGCRP, 2023). Even more concerning is that droughts are expected to increase in intensity, duration, and frequency, particularly in the U.S. Southwest, affecting both surface water and groundwater supplies (USGCRP, 2023).
Given these projections, understanding drought dynamics at regional scales is essential for effective adaptation and mitigation strategies. Iowa, as one of the leading corn-producing states in the U.S., is particularly vulnerable because of its reliance on rainfed agriculture, making it susceptible to periods of low rainfall and drought (Hatfield and Prueger, 2004; Yildirim and Demir, 2022). Historically, Iowa has experienced some notable droughts, with the most severe events occurring in 1988 and 2012. The 2012 drought was characterized by extreme heat and below-average precipitation, leading to substantial agricultural losses. This drought was among the most severe in the Midwest, affecting crop yields significantly and prompting emergency relief declarations for many counties (Islam S et al., 2024; Loecke et al., 2017). Drought also threatens Iowa’s water supply systems and natural ecosystems, as reduced streamflow and soil moisture compromise municipal water sources, wetlands, and biodiversity.
In managing drought, Iowa has adopted several strategies to reduce its impacts. These include utilizing drought models based on climate data as part of the broader national USDM system (“What is the USDM? |U.S. Drought Monitor,” n.d.) and employing advanced agricultural techniques to improve resilience to drought conditions, like drought-resistant crops, soil moisture monitoring, and conservation tillage (Islam SMS et al., 2024). For instance, the Standardized Streamflow Index (SSI) has been used to evaluate drought conditions and inform water management strategies (Anderson and Schilling, 2024). The state has also concentrated on enhancing soil moisture management and implementing improved crop rotation practices to build drought resilience (Khong et al., 2015). Furthermore, the use of machine learning models as an example of advanced technology to forecast agricultural outcomes during droughts has been explored by researchers (Branstad-Spates et al., 2023). Although many of these approaches are still being developed, they have not yet been fully integrated into operational drought planning. Despite these efforts, most current approaches prioritize short-term responses rather than long-term projections, creating a gap in preparedness for future droughts.
Recently, Iowa has implemented a comprehensive drought management plan developed collaboratively by the Iowa Department of Natural Resources, the Iowa Department of Agriculture and Land Stewardship, and the Iowa Department of Homeland Security and Emergency Management, with input from various stakeholders (“Iowa Drought Plan - January 2023,” 2023). The plan divides the state into five drought regions, each with distinct topography, soils, geology, and hydrology. It features a data-driven system to assess drought status and outlines specific actions for different levels of severity. Additionally, the plan includes a vulnerability and impact assessment that recognizes regional vulnerabilities, particularly concerning agriculture, water supply, and public health. While this plan is a step forward, its primary reliance on observed data underscores the need for forward-looking models capable of integrating climate projections to support long-term resilience planning.
As global temperatures rise and climate patterns shift, understanding the dynamics of drought becomes increasingly important for effective resource management and policy formulation. Various indices and monitoring and synthesis tools have been developed to assess different types of droughts in the U.S., including meteorological, agricultural, and hydrological droughts. Some of them are:
• The Standardized Precipitation Index (SPI) is used to assess meteorological drought by comparing current precipitation with a reference period. It is widely recognized for its versatility in monitoring meteorological droughts at various time scales and regions (Vicente-Serrano et al., 2011). Its ability to standardize precipitation data facilitates the comparison of drought conditions over time and space, which is vital for effective management (Santos et al., 2019).
• The Palmer Drought Severity Index (PDSI), introduced by Palmer in 1965, this method evaluates drought severity based on temperature and precipitation data, but it is sensitive to local climate conditions and depends on historical data (Salimi et al., 2021).
• The Standardized Precipitation Evapotranspiration Index (SPEI) considers both precipitation deficits and temperature effects on evaporation, making it particularly relevant in the context of climate change (Vicente-Serrano et al., 2010).
• The U.S. Drought Monitor (USDM), established in 1999 by the National Oceanic and Atmospheric Administration, United States Department of Agriculture, and the National Drought Mitigation Center, is one of the most commonly used tools for monitoring and synthesizing drought conditions nationwide (Current Map, 2024). By integrating in situ measurements, remote sensing data, and expert input, the USDM provides a comprehensive assessment of drought severity. Published weekly, it utilizes various indicators, such as precipitation, soil moisture, temperature, and vegetation health, to create detailed maps that reflect the complex nature of drought and its impact on sectors like agriculture and water supply (Benedict et al., 2021). The USDM categorizes drought conditions from “abnormally dry” to “exceptional drought,” informing agricultural practices, water resource management, and emergency responses and supporting federal and state relief efforts (Benedict et al., 2021).
While traditional drought indices such as SPI, PDSI, SPEI, and the monitoring and synthesis tool USDM assess current drought conditions, they are based on past observations. These indices and tools provide a snapshot of the current drought conditions, but they do not offer sufficient insight into how droughts might evolve in the future. As the impacts of climate change intensify, there is a need to go beyond historical analysis and develop tools to project future drought scenarios. This limitation is increasingly problematic in a changing climate, where reliance on historical patterns may no longer be sufficient for risk assessment.
In recent years, machine learning techniques like Long Short-Term Memory (LSTM) networks (Hochreiter and Schmidhuber, 1997), have become increasingly popular in drought forecasting and monitoring. These networks excel at processing sequential data, such as past and current climate variables, to forecast drought conditions (Abbes et al., 2023; Danandeh Mehr et al., 2023; Das et al., 2023; Yang et al., 2025).
Previous research has shown that LSTM models can deliver more accurate predictions of long-term drought conditions than traditional methods and can forecast droughts up to 18 months in advance, which is crucial for proactive management and mitigation strategies (Dikshit et al., 2021; Vo et al., 2023). Nevertheless, many existing models fall short in integrating projected climate data or in offering spatial resolution tailored to specific decision-making regions like HUC8 watersheds (Gyaneshwar et al., 2023). This research seeks to address this gap by integrating historical and projected climate data and developing a model to predict future drought conditions, which is essential for effective climate change adaptation strategies.
This manuscript presents an LSTM machine learning model trained in historical precipitation and maximum temperature data at the HUC8 level for Iowa. The model is designed to predict future drought conditions by analyzing future precipitation and maximum temperature values from climate models, enabling the identification of regions likely to be impacted by drought conditions in the 2030–2050 period. Additionally, we introduce a new tool for drought assessment in Iowa: an interactive application that supports decision-making and provides stakeholders with information on drought conditions. The application displays drought projections at the HUC8 level based on the outputs of the LSTM model.
The objectives of this research were to 1) Build a machine learning model to project USDM drought conditions at the HUC8 level in the 2030–2050 period, 2) Develop an interactive application for displaying future USDM categories at the HUC8 levels in Iowa, and 3) Apply Intensity-Duration-Frequency (IDF) analysis to characterize future drought patterns and assess their potential impact on water resources and agriculture.
2 Methodology
This section outlines the approach and methodologies used in this research to develop and implement the projection and assessment of future droughts in Iowa. It begins with an overview of the study area, followed by a detailed description of the machine learning model employed. Additionally, the methodology for calculating drought’s IDF is also presented, outlining the steps for deriving intensity, duration, and frequency metrics based on historical and projected data. Finally, this section covers the development of the interactive application, including its design, user interface, and the integration of the model results to display projected drought conditions in Iowa’s HUC8 watersheds.
2.1 Study area
Iowa covers approximately 56,272 square miles, with around 85% of its land used for agriculture, mainly corn and soybean production (USDA, 2024; USDA/NASS, 2023). The state receives an average annual precipitation of 30–35 inches, though this can vary significantly (Drainage Water Management - Iowa Agriculture Water Alliance, n.d.). Irrigation is limited, mostly concentrated in western Iowa, with higher drought risks (USDA/NASS, 2023). Tile drainage systems are widely used, particularly in northern and central Iowa, to improve water management in poorly drained soils, especially in fields dedicated to row crops (Drainage Water Management, 2024; Iowa Regional Crop 2024; Corn and Soybeans, n.d.). The area of study map is shown in Figure 1.
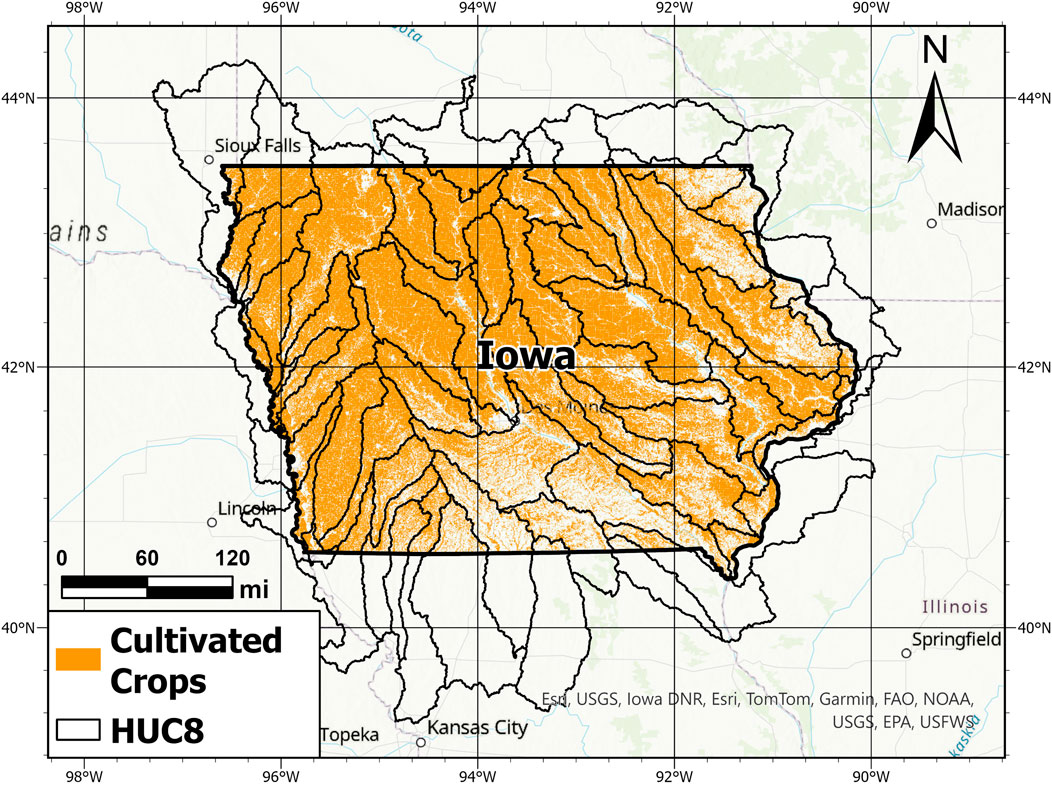
Figure 1. Area of Study - Iowa. Map of Iowa displaying HUC8-level watersheds, with cultivated crop areas highlighted in orange.
2.2 Drought projection model
This manuscript’s scope covers the 56 HUC8s in the State of Iowa. The temporal window analyzed goes from January 2012 until December 2019, for the training data. Out-of-sample validation was performed for the period 2002 to 2011. Drought projections were made for the period from 2030 to 2050 using data from the MPI-ESM1-2-HR, BCC-CSM2-MR, and CNRM-ESM2-1 climate models. These projections were conducted under two contrasting Shared Socioeconomic Pathways (SSP1-2.6 and SSP5-8.5), representing low- and high-emissions scenarios, respectively. The variables considered in this paper are precipitation (PPT), maximum temperature (Tmax), and USDM categories (including categories such as D0 - Abnormally Dry, D1 - Moderate Drought, D2 - Severe Drought, D3 - Extreme Drought, and D4 - Exceptional Drought). The model is based on average data for each HUC8. Both input and output data will be average values for each watershed, representing the behavior of the variables in that specific area. This allows predictions and analysis to reflect each region’s average conditions accurately. The data span a wide gradient of drought conditions in Iowa, making it an ideal time window and region for developing and testing robust drought prediction methods.
2.2.1 Model datasets
The study employs a detailed analysis of hydrologic data at the HUC8 scale in Iowa. This scale was selected because HUC8s represent sub-basins that align with hydrological processes and management boundaries, providing a consistent framework for understanding water resources and assessing drought impacts at a regional level. Additionally, the HUC8 scale strikes a balance between data availability and computational efficiency. Using a smaller scale, such as HUC12 or finer, would significantly increase the consumption of computational resources and processing time, making it less practical for large-scale studies. This choice is supported by previous hydrologic reports, such as those by the Iowa DNR and the Iowa Flood Center/IIHR (IIHR, 2019a; 2019b), which also conducts analyses at the HUC8 scale to ensure effective water resource management and drought monitoring in the state. The analysis is structured around extracting and processing precipitation (PPT), maximum temperature (Tmax), and USDM data. The datasets and models employed are listed in Table 1.
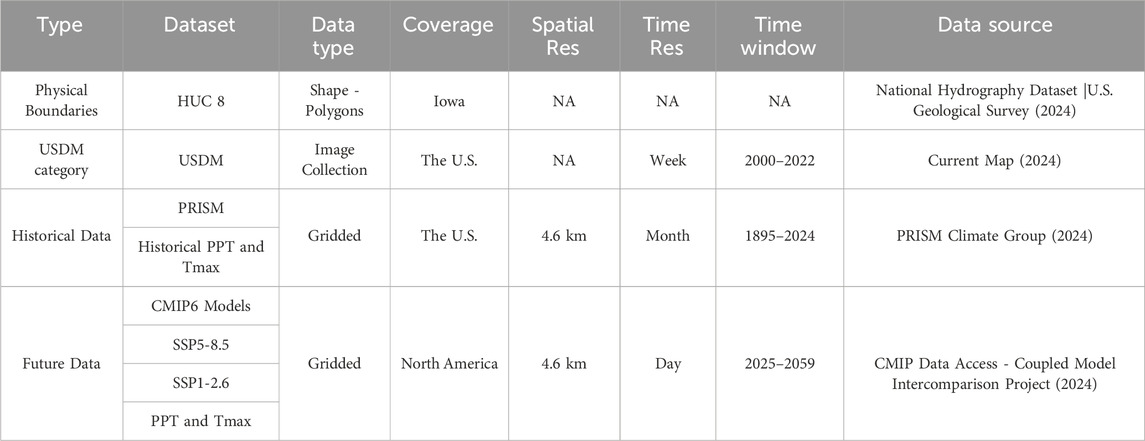
Table 1. Model datasets.
The HUC 8 boundaries define the study regions, allowing for targeted geospatial analyses. The USDM categories provide a reliable framework for monitoring water stress events, incorporating both climatic variables and expert judgment; it has been available since 2000. This is why the USDM was selected as the target variable for projection, as it enables the development of additional methods for future drought management. For historical data, PRISM was used, offering detailed monthly representations of PPT and Tmax over time. These data are available in the Google Earth Engine (GEE) repository, simplifying geospatial analysis.
The period selected for the training and testing analysis reveals a complex interplay of climatic factors, seasonal variability, and the impacts of drought on agriculture and water resources. Particularly, 2012; 2013 were marked by extreme drought conditions that severely affected crop yields and water availability across Iowa (USDA, n.d.-b). The 2012 drought, in particular, was characterized by extreme heat and below-average precipitation, leading to significant reductions in corn and soybean yields (Hoerling et al., 2014). Iowa also experienced a significant drought in 2003, affecting the northwest and southwest areas of the state. Another severe drought occurred in 2020, with 80% of Iowa experiencing moderate drought conditions or worse (Iowa, 2024). While there was some improvement in 2021, the northwestern regions faced significant precipitation deficits (Iowa | Drought.Gov, n.d.). These recurring drought episodes, with at least one or two extreme droughts recorded per decade, support the selection of the analysis period.
The analysis was carried out monthly to identify drought events that can significantly affect water resources, agriculture, and ecosystems. This approach is supported by research indicating that monthly data provides the necessary temporal resolution to track and respond to drought dynamics before they escalate, which is critical for effective water management and agricultural planning (Kuzucu and Onuşluel Gül, 2023). Studies have also shown that indices such as the monthly-calculated SPEI effectively capture both the frequency and intensity of drought occurrences, with droughts becoming more frequent and severe at this scale (Shi et al., 2017). Furthermore, groundwater studies highlight that droughts lasting more than a month have a more pronounced effect on groundwater fluctuations, emphasizing the significance of monthly intervals in understanding hydrological processes (Khorrami and Gunduz, 2019).
Temporal variability highlights the importance of monthly data for accurately assessing drought trends. This temporal resolution also supports the development of models for long-term projections, such as those spanning decades, making data management more efficient. Furthermore, monthly data is essential for effective water resource management, agricultural planning, and understanding the broader implications of climate variability on drought patterns.
For drought projection, the models MPI-ESM1-2-HR, BCC-CSM2-MR, and CNRM-ESM2-1, all part of the CMIP6 framework, were selected due to their advanced capabilities and reliable performance in climate simulations (Eyring et al., 2016). These widely recognized models have undergone rigorous testing across different regions and climate extremes, making them highly reliable for predicting droughts.
The MPI-ESM1-2-HR excels with its high spatial resolution, allowing for detailed simulation of precipitation patterns, which is important for accurately predicting droughts. Its strength in capturing ocean-atmosphere interactions also makes it particularly effective for studying climate variability on both regional and global scales (Jungclaus et al., 2019). The BCC-CSM2-MR, developed by the Beijing Climate Center, has made significant improvements in simulating surface air temperature and atmospheric circulation. This model is particularly adept at representing land-atmosphere interactions, which enhances its ability to model extreme weather events (Wu et al., 2019). The CNRM-ESM2-1, from the Centre National de Recherches Météorologiques, integrates advanced biogeochemical processes, such as carbon and water cycles, which are vital for understanding and predicting droughts. Numerous studies have validated these models for their accurate simulation of climate variables, which are key variables in drought dynamics (Séférian et al., 2019).
Shared Socioeconomic Pathways SSP5–8.5 and SSP1–2.6 were selected for analysis as they represent the upper and lower bounds of the Shared Socioeconomic Pathways framework. SSP5–8.5 reflects a high-emission, fossil fuel–driven pathway characterized by rapid economic growth, high energy demand, and limited environmental regulation, leading to intensified greenhouse gas emissions and considerable strain on water resources. In contrast, SSP1–2.6 represents a low-emission, sustainability-oriented scenario with strong global cooperation, reduced resource intensity, and proactive climate policies aimed at mitigation and adaptation. Examining these divergent pathways enables a comprehensive evaluation of how varying socioeconomic and emission trajectories may influence the spatial and temporal characteristics of future droughts, thereby informing the development of targeted adaptation and mitigation strategies to address these evolving challenges.
2.2.2 Data preprocessing
Data preprocessing is crucial in ensuring that the model can effectively capture complex patterns and make accurate predictions of drought conditions. This study used data on PPT, TMAX, and the USDM values from 2012 to 2019. The data was first filtered and sorted by HUC8 watersheds to maintain spatial and temporal integrity. For short-term temporal dependencies, lagged values of PPT and TMAX were included for the current month and with lags of one, two, and 3 months. These features are represented in Equation 1:
Moving averages and variances were computed for 6- and 9-month periods to account for longer-term seasonal effects. Equation 2 defines the rolling mean, and Equation 3 defines the rolling variance:
Where n can be any time window considered, such as 6 or 9 months.
Finally, sine and cosine transformations were applied to the month and the year to account for cyclical seasonal patterns. These features are represented in Equations 4, 5:
Where month takes values from 1 to 12, and year takes values from 1 to 8.
A key aspect of preprocessing was the normalization of the data, which is crucial for ensuring that all input variables are on comparable scales, particularly when working with machine learning models like LSTMs. To achieve this, the StandardScaler from scikit-learn (version 1.5.1) was applied (Pedregosa et al., 2011), transforming the features to have a mean of zero and a standard deviation of one. This normalization process optimizes model convergence and ensures that the machine learning algorithm is not disproportionately influenced by variables with larger scales, such as precipitation, compared to smaller variables, like cyclical features.
Although the model predicts a continuous variable (USDM index values), class balancing was applied to ensure that the model could make accurate predictions for each drought class, as represented by the different USDM categories. Given that the dataset contained more than 5,000 data points, the class balancing was achieved without creating synthetic data. Instead, a down-sampling approach was used, where the more common classes were subsampled to balance the dataset. This method has been extensively discussed by several authors; among the most prominent are Ryan Hoens and Chawla (2013), who highlight its effectiveness in improving performance. This approach ensured that all levels of drought, from no drought to extreme drought conditions, were adequately represented in the training data. By doing so, the model was better able to predict all drought classes, even the extreme events, without the risk of overfitting to the more frequent conditions. As part of model validation, the ability of the model to generalize was rigorously assessed. In addition to training performance, the model was evaluated for its capacity to accurately predict extreme drought values, which are less frequent but crucial for water management decisions. Metrics such as mean squared error (MSE), R2 score, and Pearson correlation were used to verify that the model was not overfitting and was generalizing well, particularly in predicting extreme drought events.
2.2.3 Data processing and analysis
The model input data is processed using Google Colab with the GEE API and Python. Initially, the HUC8 shapefile is loaded and simplified. The data is then converted into a collection of Earth Engine features for spatial analysis. The training data extraction spans from 2012 to 2019 and focuses on each HUC8 region. PPT, Tmax, and USDM data are filtered and processed for each study watershed every month within this period. Monthly aggregated values are computed and then integrated over the HUC8 areas to calculate average values. These results are compiled into a structured format and exported for further integration into the model.
When preparing input data for future projections, the procedure is similar to that of historical data, with the main difference being the use of the CMIP6 models. This model provides future projections for the SSP5 and SSP1 future climate scenarios. Similar to the historical data process, average values for PPT and Tmax are estimated for integration into the model, which will then be used to make future predictions. The results are USDM predicted average values in the HUC8 watersheds.
2.2.4 Model architecture
The model’s architecture leverages LSTM networks to predict future drought conditions. The model starts with a Sequential LSTM framework consisting of two LSTM layers. The first LSTM layer, with 64 neurons, is configured to return sequences, allowing it to process temporal dependencies in the data. This is followed by a Dropout layer set at 30% to mitigate overfitting.
The second LSTM layer has 32 neurons, followed by another Dropout layer at 30%. The dropout layers used hyperbolic tangent as an activation function. The model concludes with two Dense layers: the first, with 16 neurons and ReLU activation, introduces non-linearity, and the second, a single neuron, produces the final prediction. The model is compiled using the Adam optimizer and mean squared error loss function, with early stopping implemented to halt training when validation loss ceases to improve. This architecture, illustrated in Figure 2, is designed to effectively capture and predict complex temporal patterns in drought data.
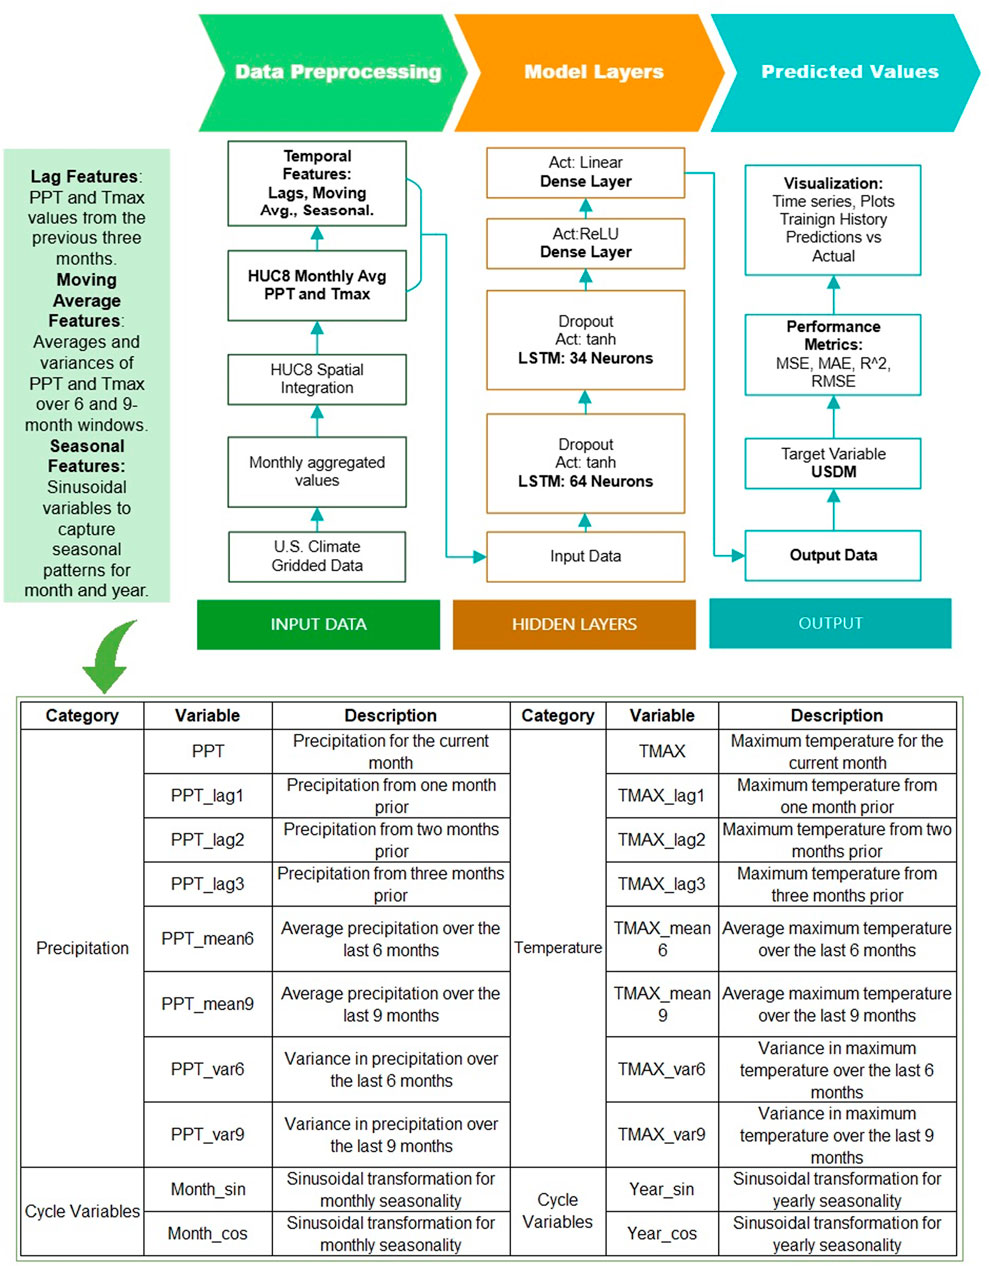
Figure 2. LSTM Model architecture and Input features. The first column represents the preprocessing of input data and the generation of temporal features. The second column details the model’s layer structure. The third column, on the right, displays the outputs used for results and performance analysis of the model. The Input data table shows the features and its descriptions.
The variables used in the model are shown in Figure 2. These variables capture information about monthly precipitation, maximum temperature, and seasonal patterns. They include current and lagged values, multi-month averages, and variances, which provide information about recent and historical trends. In addition, sinusoidal transformations are applied to represent monthly and annual seasonal cycles, which helps the model account for recurring patterns.
2.2.5 Model training
In the model training phase, an LSTM network is utilized to capture the temporal dependencies in the data. The dataset spans from 2012 to 2019 and includes data from 56 HUC8s in Iowa. The data were first standardized to ensure uniform scaling of features. Lagged features and rolling statistics (Figure 2) are incorporated to provide the model with historical context and temporal trends. The data is prepared and divided into training and testing sets, with an 80%–20% split. The LSTM model is built with two layers of LSTM units, interspersed with dropout layers to mitigate overfitting. The model is trained over 50 epochs with early stopping to prevent overfitting by halting training when validation loss ceases to improve. During training, the model learns to minimize the Mean Squared Error (MSE) loss function, aiming to accurately predict drought conditions based on historical climate data. The training process is monitored through the loss metrics plotted to visualize the model’s learning progression.
2.2.6 Model explainability
In order to clarify the functionality of the model, we employ Explainable Artificial Intelligence (XAI) techniques. XAI refers to a set of methods and tools designed to make machine learning models understandable to humans. These methods facilitate the interpretation of models and help identify the variables that contribute most significantly to the predictions (Hanif et al., 2023; Sharma et al., 2024).
The main XAI technique used in this research is SHAP (Shapley Additive Explanations), one of the most widely used methods for sequential data (Salih et al., 2023). SHAP is based on game theory concepts to assign each feature of the model an importance value based on its contribution to the prediction (Scott Lundberg, 2018). SHAP breaks down each observation’s prediction into “impact” values for each feature, providing a measure of how much each variable contributes to a specific prediction. Through this approach, SHAP offers two types of insights:
Local Interpretation: For each individual prediction, SHAP shows how each variable influences the outcome. This is essential for understanding the specific causes behind each prediction of the USDM.
Global Interpretation: By aggregating the SHAP values across all observations in the sample, we can assess the overall importance of each variable in the model. This provides information on which features most affect the USDM predictions in general.
This study built the drought prediction model using climatic variables and seasonal features. Predicting drought is a complex problem influenced by multiple interrelated factors, as discussed in previous sections of this manuscript. The selection of SHAP is ideal for this analysis because it enhances transparency (Felsche and Ludwig, 2021). SHAP allows us to break down the model’s predictions, making it possible to understand how each variable—such as precipitation, temperature, and seasonal features—contributes to the risk of drought. This facilitates the identification of climatic patterns that affect the USDM drought category. Additionally, SHAP effectively captures the model’s complexity: since the predictive model includes multiple variables and non-linear relationships, SHAP is particularly useful for explaining these interactions and their impact on the final prediction, which would be challenging to understand with simpler explanatory methods.
To support and validate the results provided by SHAP, permutation analysis is applied to the model’s features. Permutation feature importance (FPI) is a model-agnostic technique that assesses the importance of each feature by measuring the decrease in model performance when the values of that feature are randomly shuffled (Molnar et al., 2024). By permuting the values, the relationship between the feature and the target variable is disrupted, and any significant drop in performance indicates the importance of that feature to the model’s predictive power (Fumagalli et al., 2023; Molnar et al., 2024). This technique corroborates the findings of SHAP by providing complementary information on feature importance and reinforcing the robustness of the interpretations.
Furthermore, the results obtained from SHAP and permutation importance are contrasted with those generated by LIME (Local Interpretable Model-agnostic Explanations). LIME approximates the behavior of complex models locally using simpler, more interpretable models (Salih et al., 2023). This method demonstrates how small perturbations in input data affect the output, offering insights into the model’s behavior concerning specific predictions (Tan et al., 2023). Comparing the local interpretability results from LIME with the global insights from SHAP helps identify areas of agreement or divergence.
This approach ensures a comprehensive interpretability framework by integrating SHAP, permutation importance, and LIME. This combination facilitates a more nuanced understanding of model behavior, confirms the influence of key variables, and provides a reliable foundation for deriving practical insights into drought prediction.
2.3 IDF analysis
The methodology for calculating the IDF curves involves analyzing the historical drought data to derive relationships between the intensity, duration, and frequency of drought events. Specifically, the calculation process is the following:
The intensity of drought is measured using the USDM categories by taking the average of the maximum annual values. According to the USDM categories, values range from 0 (Abnormally Dry) to 4 (Exceptional Drought), with 2 indicating Severe Drought and 3 indicating Extreme Drought.
The duration analysis is calculated by counting, on an annual basis, the consecutive months with droughts having a USDM category greater than two, corresponding to severe, extreme, and exceptionally extreme droughts. The annual average duration for the analyzed period was then calculated.
Finally, for the frequency analysis, drought events with a USDM category greater than two were examined. Using a 20-year time window, the number of years in which such droughts occurred was estimated.
2.4 Future Drought Viewer app
The Future Drought Viewer app employs our advanced LSTM machine learning model to visualize future drought conditions at the HUC8 level under the SSP5 and SSP1 scenarios. The methodology includes the following stages:
• Data Import: The application integrates drought predictions generated by the LSTM model, which are stored in a GEE project.
• User Interface: An intuitive interface allows users to select the year and month to view the corresponding drought conditions. Users interact with dropdown menus to choose these parameters.
• Map Visualization: The application updates the map based on user selections, applying color styles to regions according to USDM categories. Colors represent different levels of drought severity, ranging from abnormally dry to exceptional drought.
• Classification Legend: A legend is included on the map to provide context for the different levels of drought, aiding in the interpretation of the visualizations.
• Initial Setup: The map is centered on a default view suitable for displaying HUC8 regions and is initially loaded with default values.
3 Results
This section presents the findings from the drought assessment and prediction model developed for Iowa. The results are organized into four main sections: model performance, explanation of the model using XAI, Iowa Drought Projections, and assessment of future droughts, including IDF analysis.
One of the outcomes of this research is the projection of future droughts in Iowa, information that is accessible through the interactive Future Drought Viewer. The app enables users to effectively explore future drought projections and supports better planning and management of water resources. The interface is shown in Figure 3.
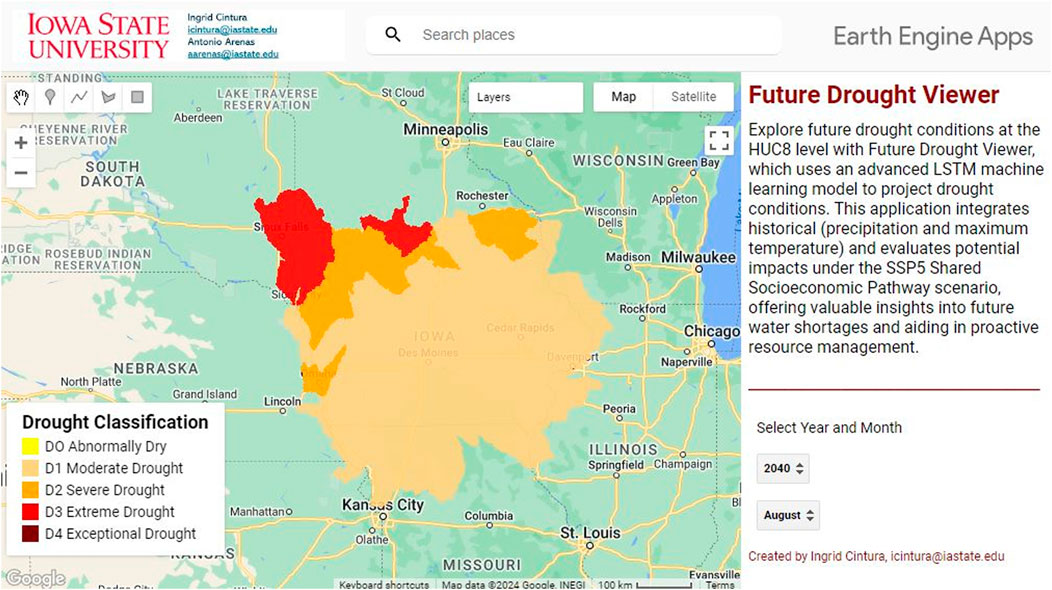
Figure 3. Future Drought Viewer. A screenshot of the application is shown with the selection layer, and the general panel that displays the data of future drought conditions in Iowa.
3.1 Model performance
The performance of the LSTM model was evaluated based on its ability to predict drought conditions. The model was trained on historical data, and its effectiveness was assessed using various metrics. The MSE, the Root Mean Squared Error (RMSE), the Mean Absolute Error (MAE), the Coefficient of Determination (R2), and the Pearson correlation coefficient were evaluated, and the results are presented below.
3.1.1 Model validation
The model’s predictions were compared against actual observed values using several key metrics. The MSE is 0.04, indicating a low average squared error between predicted and observed values. The RMSE of 0.19 further confirms that the prediction errors are relatively small. The MAE of 0.09 reveals that the model’s average prediction error is also minimal. The R2 Score of 0.91 demonstrates that the model explains approximately 91% of the variance in the target variable, highlighting its effectiveness. Additionally, the Pearson Correlation coefficient of 0.96 shows a strong positive linear relationship between predicted and actual values, suggesting that the model’s predictions are reliable.
In summary, these results highlight the model’s strong performance, characterized by small errors and a significant ability to account for the variance in the target variable. A comparative analysis with other models is made in Section 4.3, enabling a clear assessment of the quality of the model’s performance metrics.
3.1.2 Out-of-sample validation
Out-of-sample validation was conducted using data from 2002 to 2011 to further assess the model’s performance and generalizability. This external validation aimed to evaluate how well the trained LSTM network could predict drought conditions outside the initial training and testing periods.
The results varied across the years, reflecting the challenges inherent in predicting complex environmental phenomena. For instance, in 2002, the model yielded an MSE of 0.119 and a MAE of 0.227, indicating a moderate level of prediction error. However, performance improved substantially in later years, with the MSE dropping to as low as 0.0003 in 2010 and the MAE to 0.013, demonstrating the model’s increasing accuracy. The overall trend suggests that the LSTM network maintained a strong predictive capacity even when applied to unseen data. The use of the USDM scale, which ranges from 0 to 4, helps contextualize these errors as relatively small. An average MSE of 0.15 and MAE of 0.19 were the metrics performance for the decade. Specifically, MSE measures the average squared difference between predicted and observed values, significantly penalizing larger errors. With a value of 0.15, the error is small relative to the 0–4 scale of the USDM, meaning that the predictions are generally close to the actual drought severity. Meanwhile, MAE provides the average of the absolute differences, giving a clearer view of the average prediction error. With an MAE of 0.19, this suggests that, on average, the model’s predictions are off by less than 0.2 on the scale. These metrics indicate that the model performs well, offering reliable predictions for drought intensity with relatively minor errors.
Based on the USDM categories, the model’s performance over the decade revealed that 84% of the predictions matched the actual drought class, 14% deviated by one class, and only 2% were off by two classes. This external validation further supports the model’s high performance.
3.1.3 Visual and quantitative model validation
Figure 4 displays observed and simulated values for months with different levels of droughts from the historical window to provide a comprehensive view of the model’s efficacy throughout various periods.
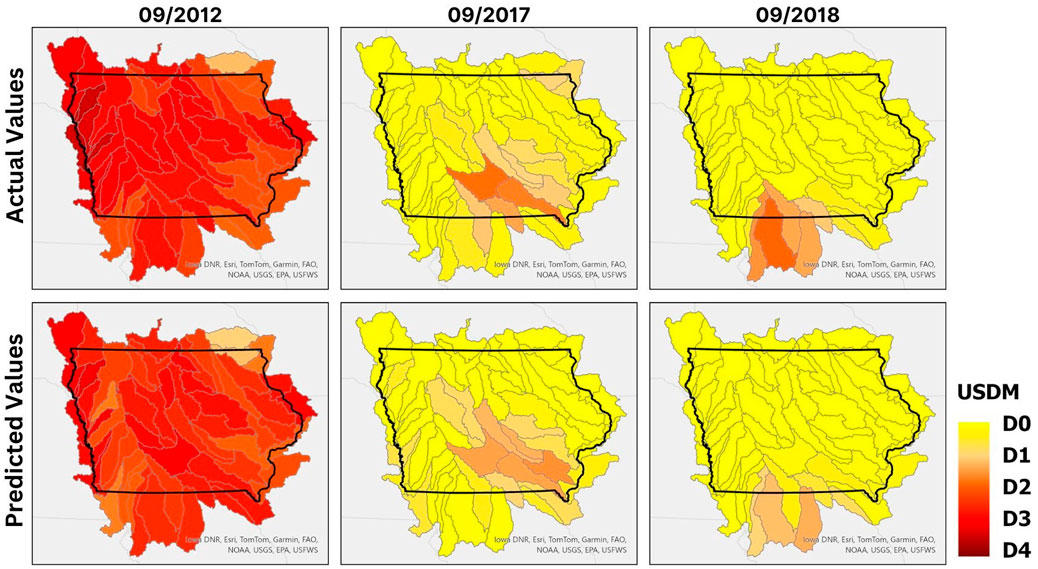
Figure 4. Model Performance Results. Map of actual and predicted values for September in the years 2012, 2017, and 2018.
Another result that reflects the model’s performance is shown in Table 2, which highlights the accuracy of drought class predictions based on the US Drought Monitor (USDM). The data were processed and classified according to the USDM categories, as both the actual and predicted values are continuous variables representing the averages for each HUC8 region. As presented in the table, this analysis provides quantitative insights into how well the model predicts these drought categories by year.
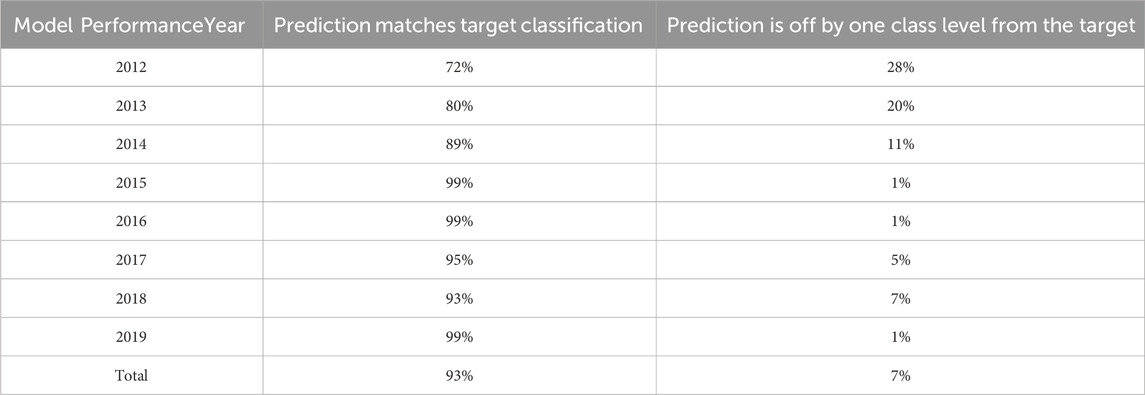
Table 2. Model performance accuracy by year.
Finally, 12 HUC8s were selected, for which the actual and predicted USDM values were plotted. Figure 5 presents a graph for each HUC8 along with the corresponding R2 value, demonstrating the reliability of the model’s results.
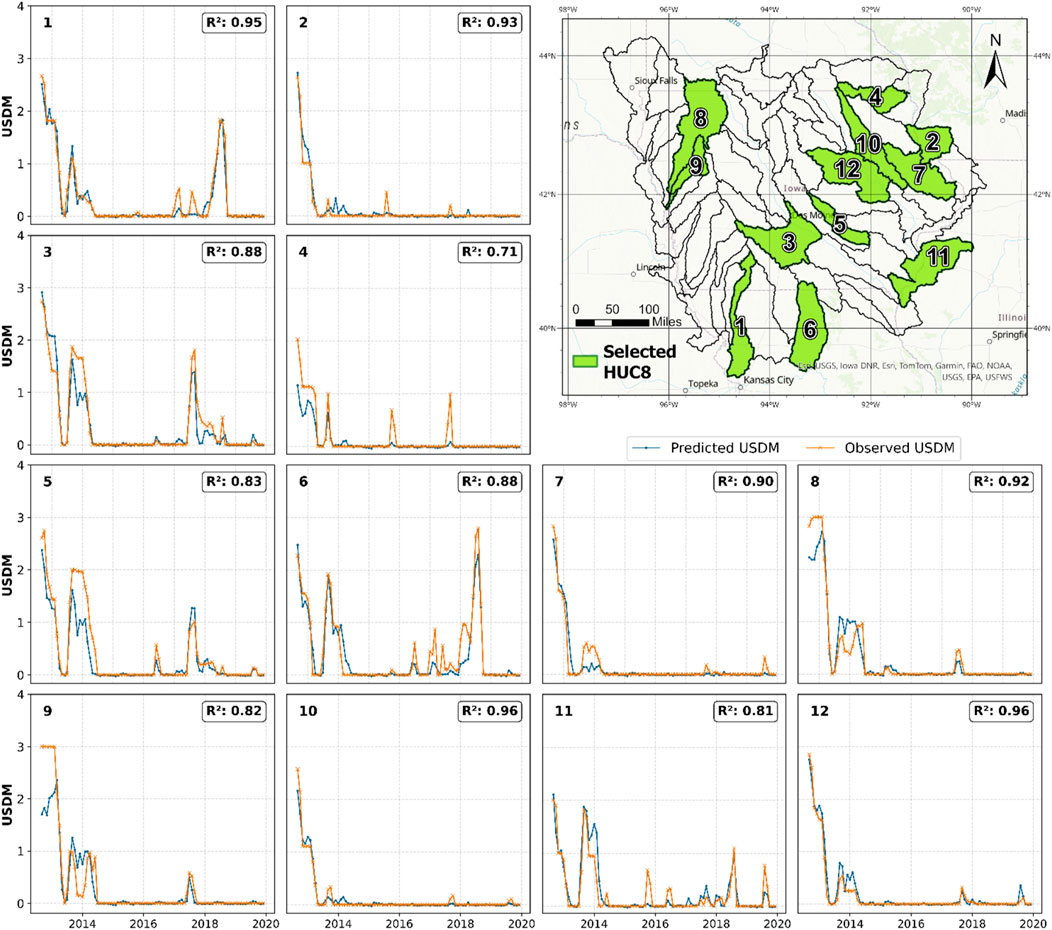
Figure 5. Results for Selected HUC8. The graph displays two time series of the USDM average for the selected HUC8. The blue line represents the predicted values, while the orange line shows the historical values from 2012 to 2019.
3.2 Explanation of the model
As a result of the XAI analysis using the SHAP technique, we present the SHAP Beeswarm plot based on a representative sample of 1,000 data points from the model spanning the years 2012–2020. Variable definitions used in the model are detailed in the Methods chapter; see Section 2.2.3.
Figure 6 illustrates the importance and impact of each feature or variable in the model, see feature descriptions in Figure 2. Each point represents the SHAP value of a specific data point for each variable involved in the model. The colors indicate the feature values, with high values shown in magenta and low values in blue.
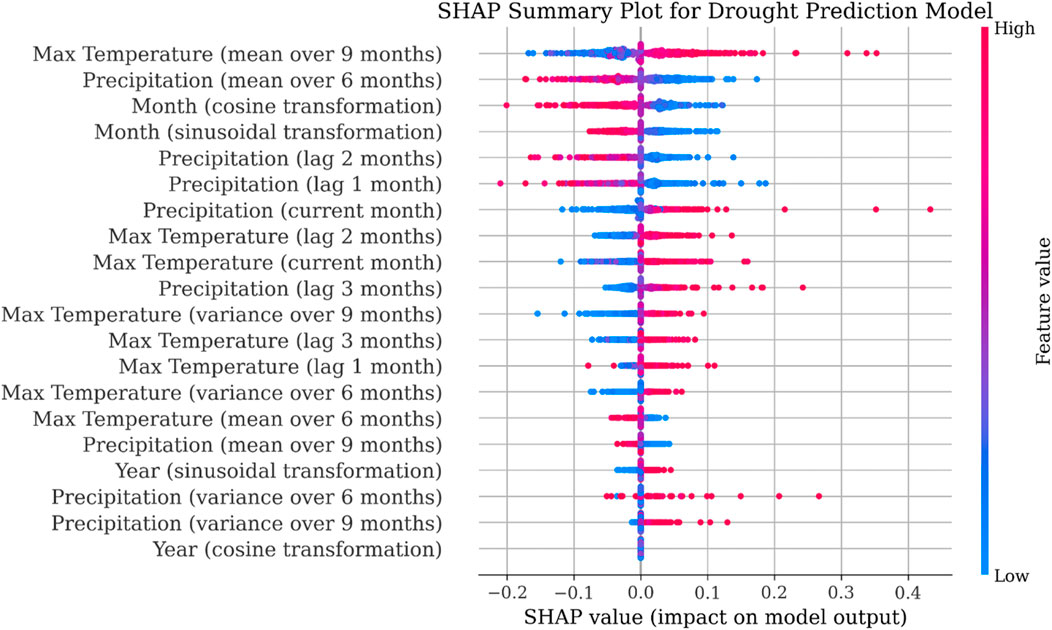
Figure 6. XAI Results - SHAP Beeswarm plot of the Model. The plot shows the contribution of each input feature to the model’s output, using SHAP values. Each point represents a SHAP value for a specific feature in one prediction instance. The color scale indicates the original feature value, while the horizontal position shows the impact of that feature on the prediction. Features are ranked by importance from top to bottom.
Figure 6 provides information on the global importance of each feature (climatic or seasonal), with variables ordered from top to bottom according to their overall impact on the model. Additionally, it shows the effect of feature values, helping to understand whether high or low values of a variable increase or decrease the probability of drought.
Two additional plots explain the result; one uses Permutation Feature Importance (PFI), and the other uses Local Interpretable Model Agnostic Explanations (LIME). Figure 7 illustrates the PFI and shows how model performance changes when feature values are permuted, highlighting the contribution of each feature to the model predictions. The permutation analysis measures the change in the model’s error (in this case, MSE) by randomly permuting the values of each feature, breaking its relationship with the target. A positive value indicates that the feature is important, as its permutation increases the model’s error, while a value close to 0 or negative suggests it has little or no impact. According to the results obtained, the most important features, which should be prioritized in future analyses, are: TMAX_mean9, the average maximum temperature at 9 months (+0.058), PPT_lag1, the accumulated precipitation from the previous month (+0.027), PPT_mean6, the average accumulated precipitation over 6 months (+0.025), PPT_lag2, the accumulated precipitation from 2 months ago (+0.023), and Month_sin, the sinusoidal component capturing monthly seasonality (+0.015).
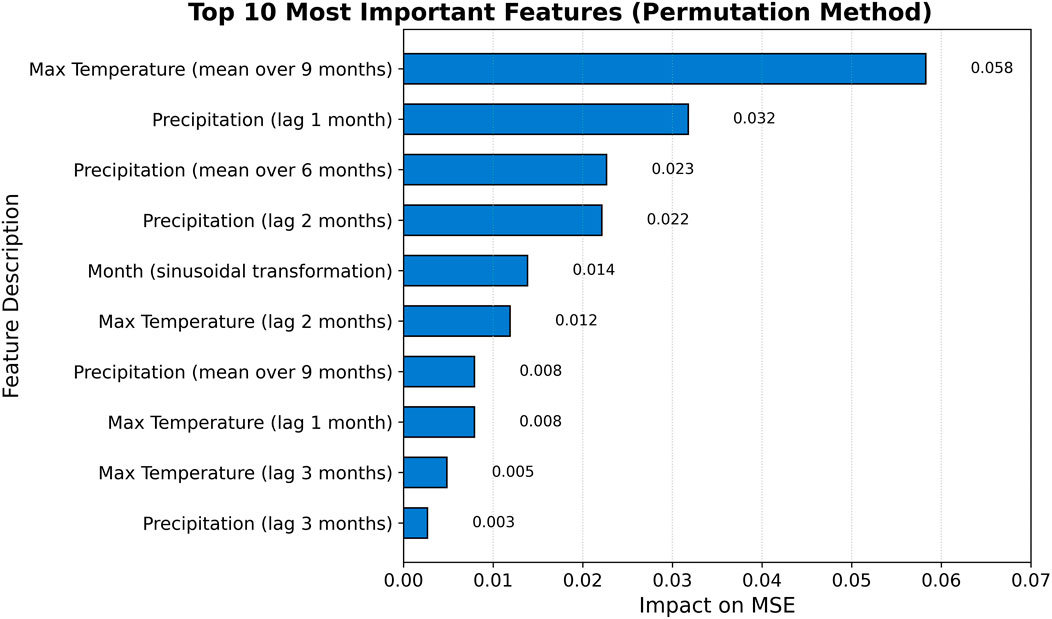
Figure 7. XAI Results - PFI Analysis of the Model. The bar chart displays the top 10 most important input variables ranked by their impact on model performance, based on Permutation Feature Importance (PFI) analysis.
Figure 8 shows the LIME plot, which provides a local explanation for a specific data point, illustrating the effect of the feature values on the prediction for that instance. In the local explanation plots of LIME, the vertical axis represents the features of the model that have the greatest influence on the prediction for a specific sample. These features are ordered based on their relative impact on the prediction. Each bar corresponds to a feature, and its position on the graph indicates its contribution to the prediction outcome. The most important features (closer to the top) have a greater impact on the predicted value for the specific example. On the other hand, the less important features (closer to the bottom) have little or no influence on the prediction. The length of each bar indicates the magnitude of the influence of that feature on the local prediction (the prediction for the current sample).
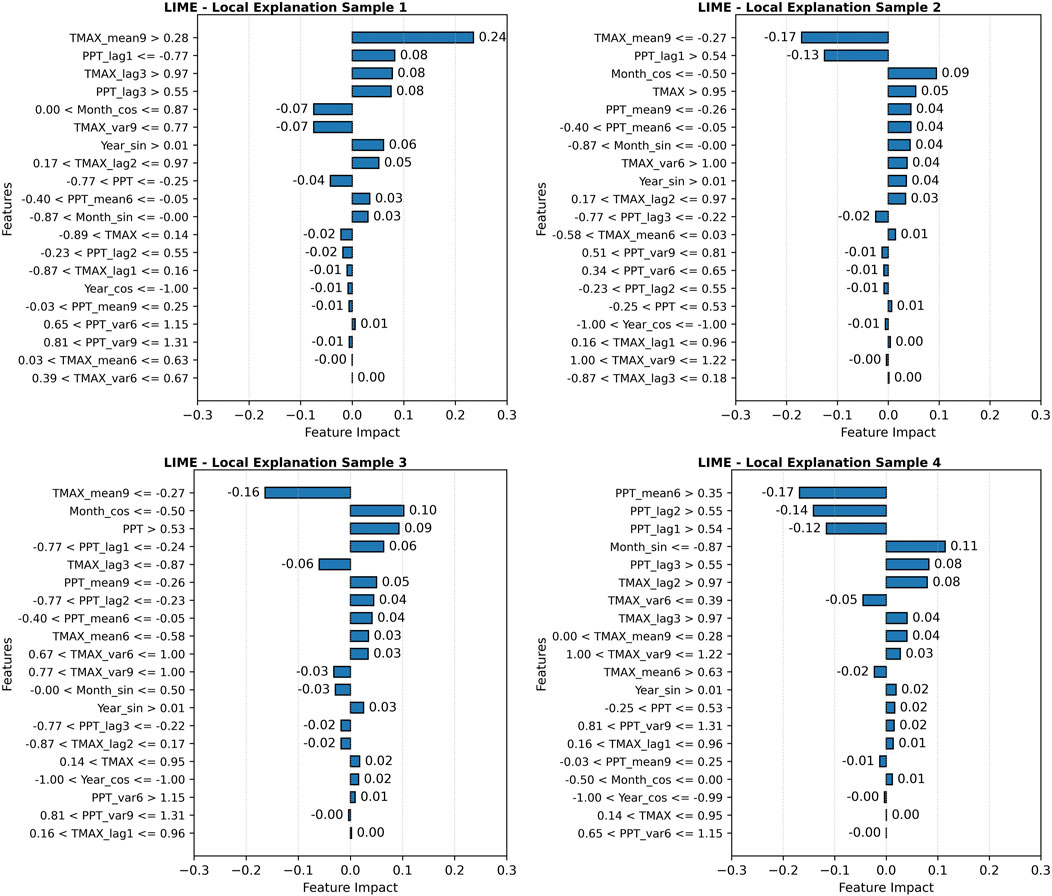
Figure 8. XAI Results - LIME Analysis of the Model. Each graph represents a local explanation of the model, corresponding to a specific data point. Each panel shows a local explanation generated by the LIME method for four individual prediction samples. The bars indicate the contribution (positive or negative) of specific input features to the model’s output for each data point.
These XAI plots help to understand the global influence of the features and how they affect individual predictions, particularly in terms of whether high or low values of a variable increase or decrease the likelihood of drought. A more detailed discussion of these results can be found in the Discussion section of this manuscript.
3.3 Iowa Drought Projections
In addition to evaluating overall model performance, we analyzed the projections from three climate models under the SSP5 and SSP1 future scenarios. While both scenarios were considered, the manuscript focuses primarily on SSP5–8.5, given its representation of the most extreme pathway in terms of greenhouse gas emissions, land-use intensity, and environmental pressure. Results for the SSP1–2.6 scenario are provided for comparative purposes, as they exhibit similar spatial and temporal patterns in drought projections, though with generally lower severity. A comparative discussion of the key differences between the two scenarios is included in the discussion section, highlighting contrasts in vulnerability and climate response under divergent development trajectories.
This analysis involved calculating the average of the USDM values over the decades studied to contrast historical and projected drought conditions. The historical data spans from 2002 to 2022, while the projections cover the period from 2030 to 2050. We examined the time series for these watersheds to understand how drought conditions are expected to evolve.
The results reveal significant variations in the severity of droughts across the state of Iowa, with both duration and frequency projected to increase over the coming decades. Although the models exhibit differences in their drought behavior, they generally predict an uptick in the occurrence of drought events. A detailed analysis comparing historical and future data is presented in the Discussion chapter of this manuscript. This comparison enables us to examine the temporal dynamics of droughts and provides valuable insights into how future droughts may impact the selected watersheds, see Figure 9.
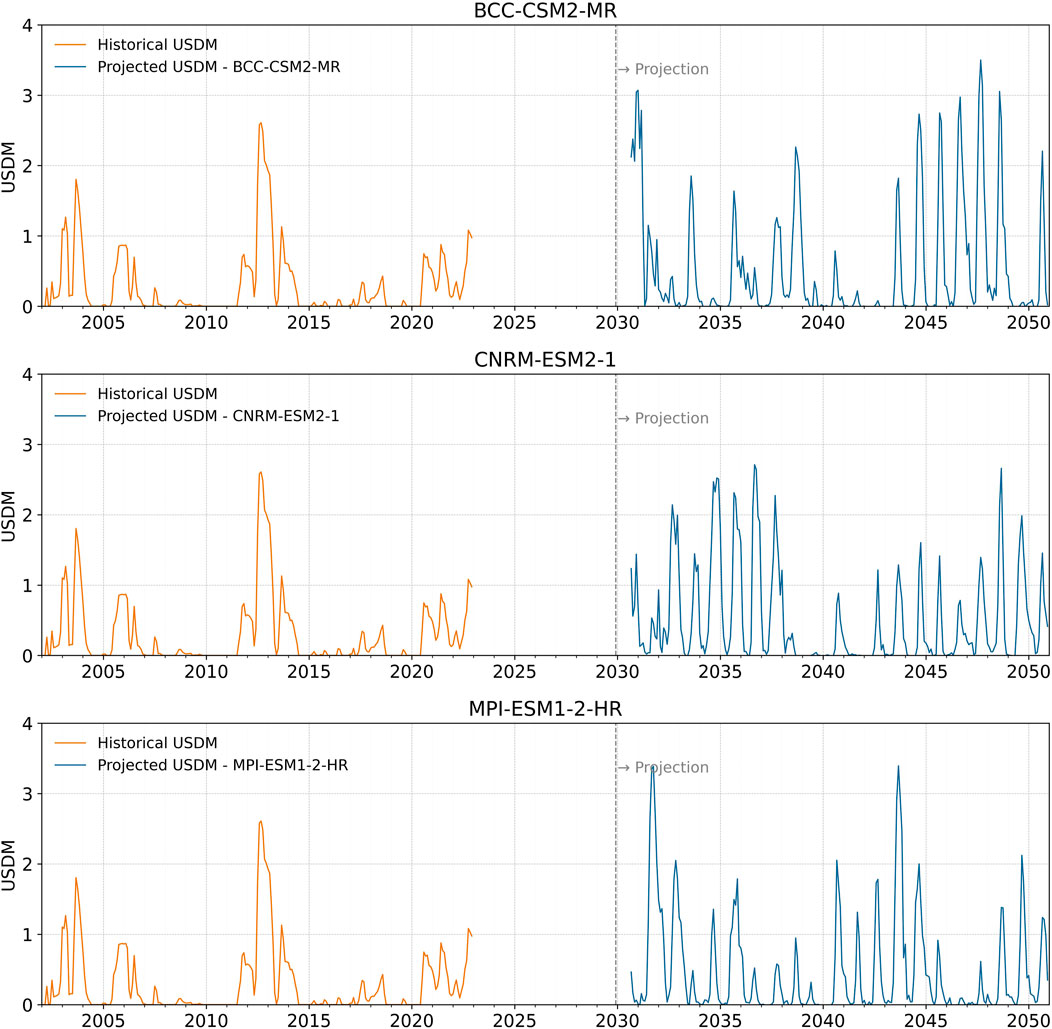
Figure 9. Results for Selected HUC8. The graph displays two time series of the USDM average for the selected HUC8. The blue line represents the predicted values from 2036 to 2045, while the green line shows the historical values from 2012 to 2021.
Monthly results for each HUC8 watershed between 2030 and 2050 are available in the interactive application https://icintura.users.earthengine.app/view/droughtviewer, where users can select the desired time frame for analysis.
3.4 Assessment of future droughts
Based on the model results for the future period from 2030 to 2050, an evaluation of the intensity, duration, and frequency of droughts was conducted over these 2 decades under scenarios SSP5 and SSP1. Figure 10 presents the results.
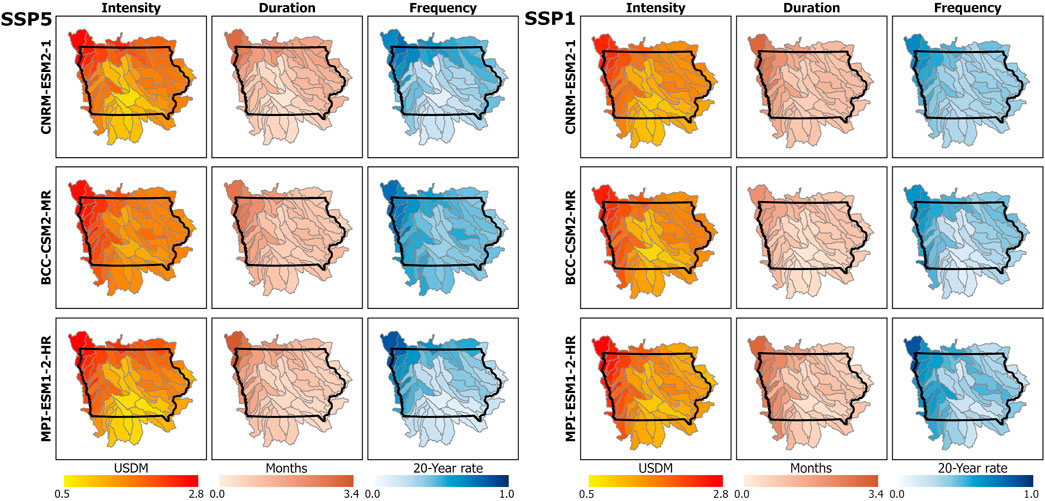
Figure 10. Intensity Duration Frequency (IDF) analysis for drought projections. The figure presents the IDF analysis for droughts classified as severe, extreme, or exceptional (USDM ≥2) over the future period 2030–2050. The left panel displays projections under the high-emissions scenario SSP5, while the right panel shows results under the low-emissions scenario SSP1. Maps include outputs from three CMIP6 models, highlighting spatial patterns of intensity, duration, and frequency of drought events across Iowa.
The intensity analysis (I) results show that the averages within the decade from 2030 to 2050, vary from 0.5 to 2.8. Extreme droughts are expected to occur in the northwest region, aligning with the findings from the three climatic models studied. Severe droughts are anticipated in the northeast zone, while the southern and central parts of the state are projected to experience the least impact.
The duration analysis (D) was conducted, and we found that the northwest region is the most critical, with droughts expected to last up to 3.4 consecutive months. In general, the statewide average duration is 1.15 months. Once again, the results from the three climate models generally align with the observed patterns.
The Frequency (F) results are expressed as percentages based on 20 years of analysis. In this context, a rate close to 1 indicates that droughts are expected every year during the 20-year period, while a rate of 0.5 suggests that droughts would occur in only half of the years. In this case, the northwest zone is again particularly critical, with values reaching up to 0.85, indicating that severe droughts or worse are expected in 17 out of the 20 years. The state average across the climate models studied is 0.4, meaning that 8 years in the 20-year period are projected to experience severe droughts or worse.
Furthermore, a study was conducted on the ten driest HUC8 regions and the ten driest months. The results are presented in Table 3. This analysis reveals critical information about future drought trends in Iowa’s HUC8 regions. The data show that certain areas, such as HUC8 Lower Big Sioux (10170203), Rock (10170204), and Floyd (10,230,002) located in the northwest region, consistently rank among the driest regions, with USDM indices reaching extreme and exceptional USDM values. The fact that many of the three driest months recur in different HUC8s (such as September, October, and November) for all the climate models indicates a pattern in which late summer and early fall months are particularly vulnerable to severe droughts. Information that highlights the significant implications for agriculture, particularly regarding crop loss and water stress during the critical late growing season.
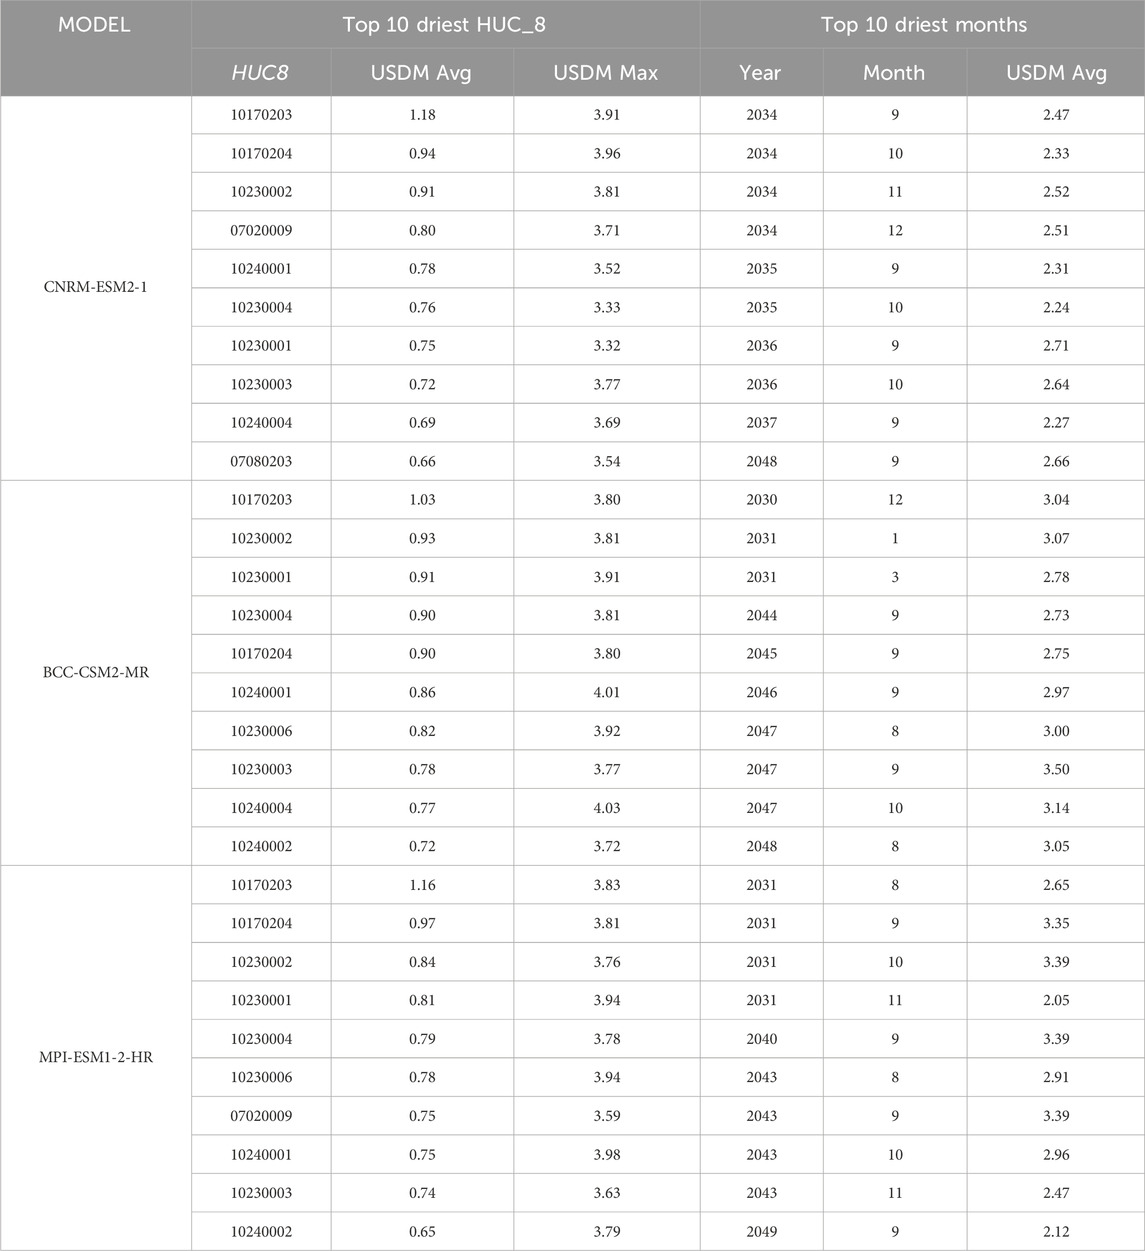
Table 3. Top 10 driest HUC8 and Months.
A key aspect of the assessment involves comparing future trends with historical data. Figure 11 presents the drought intensity, frequency, and duration changes, showcasing how conditions have evolved. Historical data from 2002 to 2022 contrasts with future projections for 2030 to 2050 under the SSP5 and SSP1 scenarios. The results are expressed as percentages, with higher values indicating worsening drought conditions characterized by increased intensity, duration, and frequency.
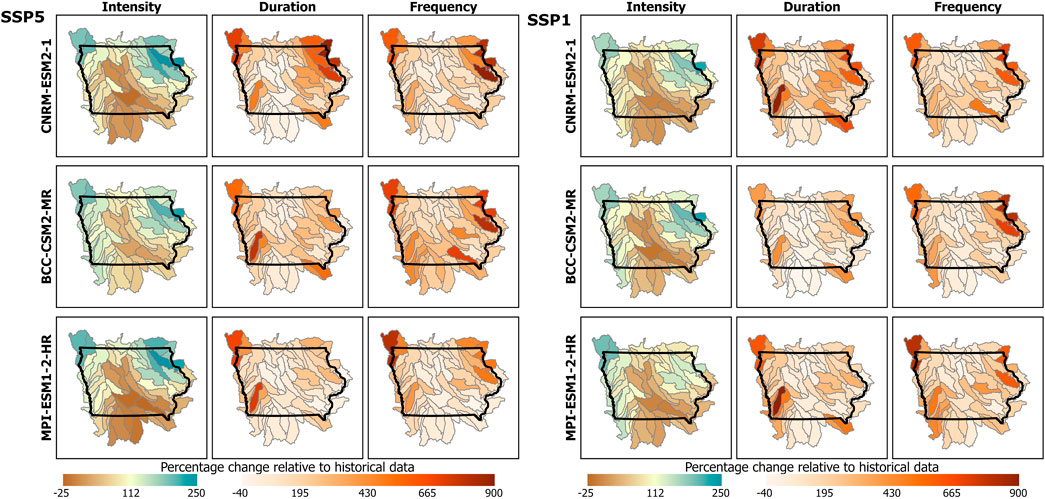
Figure 11. Intensity Duration Frequency (IDF) analysis for drought projections. Illustrates the IDF percentage change in the USDM category, comparing historical records from 2002 to 2022 with future projections for 2030 to 2050 under the SSP5 scenario (left panel) and SSP1 scenario (right panel). The assessment focuses on droughts classified as severe, extreme, or exceptional (USDM ≥2). Higher positive values indicate a significant increase, suggesting more intense, frequent, or prolonged drought conditions. Conversely, negative values represent a reduction in these conditions.
4 Discussion
This research focused on multiple aspects. Initially, it aimed to develop a machine learning model utilizing LSTM networks to predict USDM drought conditions at the HUC8 level for long-term assessment. Secondly, it sought to create an interactive application for displaying future drought conditions at the HUC8 level in Iowa based on the predictions generated by the LSTM model. Thirdly, IDF analysis was applied to characterize future drought patterns, examining the intensity, duration, and frequency of potential drought events to better understand their impact on water resources and agriculture in the region.
This detailed analysis presents significant findings into long-term drought dynamics and their implications for resource management in the state, offering essential tools for decision-making and adaptation to future climate challenges. The key points that support and validate these objectives are discussed in detail below, highlighting the importance of this research for enhancing drought projections and management.
4.1 XAI model analysis and evaluation
Figure 6 illustrates how various climatic variables and seasonal features affect the prediction of the USDM categories or drought levels. In this context, positive SHAP values indicate a higher probability of drought or a higher USDM category, while negative values indicate a lower probability of drought or a lower USDM category.
Among all the input variables in the model, the most important and influential are the average maximum temperature over a 9-month period and the average precipitation over a 6-month period. These two variables capture recent climatic conditions and have a strong correlation with USDM predictions. As expected, a high average maximum temperature over the past 9 months increases the probability of drought, as it tends to dry the soil, increase evapotranspiration, and reduce water availability. This is reflected in positive SHAP values, meaning that the probability of drought increases as this variable rises. Conversely, higher average precipitation over the last 6 months reduces drought probability. High values of this variable show negative SHAP values, indicating that accumulated moisture from precipitation decreases drought risk.
Secondly, the cyclical variables, Month_cos and Month_sin, represent and capture seasonality and are fundamental for modeling the impact of drought variations during specific periods. Thirdly, lag variables, particularly PPT_lag2, PPT_lag1 and TMAX_lag2, emerge as significant factors, capturing the influence of prior conditions on current drought levels. According to the results, lag variables from 1 to 2 months are more relevant, while lag variables from 3 months are less significant than more recent ones. However, they still influence current conditions, especially when precipitation was low or temperatures were high three periods ago.
Finally, the annual seasonality variables reflect cyclical patterns affecting drought conditions. While these are not as influential as the monthly seasonal variables, they help adjust the model to represent recurring dry seasons over a certain number of years.
The results obtained through feature permutation (Figure 7) reinforce the findings from the SHAP values. The importance of the variables according to the permutation shows clear support for the key variables identified in the SHAP analysis. For example, the variables “TMAX_mean9,” “PPT_lag1,” and “PPT_mean6” stand out in both analyses as the most relevant for predicting USDM categories, with importance values of 0.058, 0.027, and 0.025, respectively. This indicates that the average maximum temperature over the past 9 months and precipitation in the preceding months are indeed crucial determinants for drought prediction models. Additionally, variables related to lagged temperature and precipitation, such as “PPT_lag2” and “TMAX_lag2,” also appear relevant in both methods, confirming the influence of prior conditions on current drought levels.
Regarding the local explanations generated by LIME in Figure 8, it is observed that, in many cases, the most relevant variables identified by SHAP and feature permutation also emerge as key determinants in the explanations for specific samples. However, some variations in the LIME results are due to the nature of the isolated samples and the model’s ability to adapt to particular local conditions. For example, while “TMAX_mean9” and “PPT_lag1” are consistent variables in the global explanations, in specific samples, their importance levels may change due to the unique characteristics of each case, such as seasonal fluctuations or anomalous climatic events. This behavior underscores the flexibility of the model and the need to consider both global trends and local effects when interpreting predictions.
In addition to highlighting the importance of the model’s most relevant variables, this study helps clarify that drought does not solely depend on current precipitation and temperature conditions. For example, it is observed that high precipitation during the studied month does not necessarily lead to reduced drought severity. This indicates that other factors are involved; despite high precipitation in the current month, conditions such as elevated temperatures and precipitation levels from previous months contribute to increased drought severity.
4.2 Comparing historical and projected droughts for water management
A valuable analysis is the comparison of future trends with historical data. Figure 11 illustrates the drought intensity, frequency, and duration changes. The historical data from 2002 to 2022 are compared with future projections from 2030 to 2050 under the SSP5 scenario. While both scenarios were considered, this section focuses primarily on SSP5–8.5, given its representation of the most extreme pathway in terms of greenhouse gas emissions, land-use intensity, and environmental pressure. These results are presented as percentages, where higher percentages indicate unfavorable changes in drought conditions, specifically, more intense, longer, and more frequent droughts. This analysis aligns with the results section, explaining the methodology for estimating each studied variable.
An increase in the average intensity over the analyzed decades is expected. The most impacted regions are projected to be primarily in the northeast and some northwest areas. However, in certain central and southern regions, no significant increase is observed, and some areas may even experience a reduction in intensity. This analysis was conducted by averaging the data across the evaluated decades, which means that extreme values are smoothed out, as years with extreme droughts are averaged with non-dry years. Historically, the average drought intensity recorded was around 1.08, indicating moderate drought conditions. In contrast, the future projections for the CNRM-ESM2-1, BCC-CSM2-MR, and MPI-ESM1-2-HR show average intensities of 1.6, 1.8, and 1.6, respectively. This suggests that, on average, more severe droughts are expected in the future, with some watersheds experiencing increases in intensity that are more than double the current values, exceeding 200% and even reaching 250% increase.
HUC8s in the northeast and northwest and some basins in the state’s southeast (West Nishnabotna) are expected to experience more prolonged droughts. In contrast, more central areas of the state appear less affected by increased drought duration. According to historical records, severe droughts lasted between 0.5 and 1 month annually, on average, over the two-decade period. A 750% increase indicates that in watersheds where these droughts historically lasted an average of 0.2 months, they are projected to last 1.6 months in the future. Severe droughts lasting more than a month on average are expected in the future. On the other hand, HUC8s with negative percent change values represent a reduction in the duration of these events.
There is a notable increase in the east and northwest regions regarding the frequency of severe droughts. Historically, extreme droughts were expected once or twice per decade, but in the future, multiple drought events are anticipated within a single decade, according to the projections. The future projections for the CNRM-ESM2-1, BCC-CSM2-MR, and MPI-ESM1-2-HR show the average rate of occurrence over 20 years of 0.39, 0.47, and 0.35, respectively. This translates to an average of 8 to 9 severe droughts during the analyzed period, representing a significant increase. Consequently, some basins exhibit increases of up to 900%, indicating that if there was previously one severe drought in 20 years, there would be 9 in the same timeframe in the future.
The findings of this study are consistent with previous research indicating that climate change will likely increase the frequency and severity of drought events in Iowa. Previous studies suggest that the Midwest, including Iowa, will face more extreme weather patterns, with fewer but more intense rainfall events, exacerbating the risk of prolonged droughts (Xu et al., 2016). Studies of historical climate patterns from 1981 to 2015 already show a trend toward greater variability in precipitation, with droughts becoming more common during critical periods for crops such as corn and soybeans (Iqbal et al., 2018; Lobell et al., 2014). This research reinforces the expectation that, in the future for the period from 2030 to 2050, droughts will occur more frequently and for longer durations, particularly during key stages of crop development. Consistent with previous thinking, droughts will put Iowa agriculture at even greater risk (Nowatzke and Arbuckle, 2024).
Furthermore, the relationship between drought and agricultural productivity has become increasingly complex over time. While Iowa agricultural systems have historically adapted to variable moisture conditions, recent data suggest that the sensitivity of crops, particularly corn and soybeans, to drought stress has intensified (Lobell et al., 2014). Even small reductions in moisture availability can lead to significant yield losses, and prolonged periods of drought threaten the overall resilience of Iowa’s agricultural sector. Furthermore, the combination of drought and declining soil health creates a dangerous feedback loop where soil desiccation reduces crop yields and contributes to environmental degradation, including increased greenhouse gas emissions (Mikhailova et al., 2024; Vahedifard et al., 2024).
In conclusion, increasing frequency, duration, and severity of droughts present critical challenges for Iowa agriculture, especially in a changing climate. Analytical tools and modeling approaches, such as those presented in this study, are essential to developing effective water management and agricultural planning strategies. These tools help farmers and policymakers better understand future risks and take steps to mitigate drought impacts. Iowa can better protect its agricultural productivity in the face of increasing climate uncertainty by adopting more adaptive strategies, such as drought-tolerant crop varieties, improved irrigation techniques, and sustainable soil management practices.
4.3 Comparative analysis of SSP1 and SSP5 scenarios
The spatial analysis of future drought conditions under SSP1 and SSP5 scenarios highlights regional vulnerabilities and the potential magnitude of climate-driven hydrological stress. Figure 10 presents the spatial patterns of drought intensity, duration, and frequency across Iowa under two contrasting future climate scenarios, SSP1 (sustainability-oriented, low emissions) and SSP5 (fossil-fueled development, high emissions), based on three CMIP6 models: CNRM-ESM2-1, BCC-CSM2-MR, and MPI-ESM1-2-HR. Across all models and both scenarios, the northwestern region of the state consistently emerges as the most vulnerable to drought, particularly in terms of intensity and frequency. While the spatial distribution of drought characteristics remains relatively consistent between SSP1 and SSP5, the severity is greater under SSP5. This scenario represents an upper-bound projection associated with higher radiative forcing, elevated temperatures, and increased evapotranspiration demand, which collectively intensify drought conditions (Meinshausen et al., 2020; Song and Chung, 2024). In contrast, SSP1 reflects a lower-bound trajectory characterized by mitigated warming and more sustainable land-use practices, resulting in comparatively less severe drought impacts. Despite inter-model variability, the agreement in spatial trends across scenarios strengthens confidence in the identification of northwest Iowa as a drought-prone region, with SSP1 and SSP5 effectively delineating a plausible range of future drought risk under divergent emission pathways (Lindenlaub et al., 2025).
Further insights are provided by Figure 11, which illustrates the percentage change in drought metrics relative to historical conditions. These maps reveal that even under the SSP5 and SSP1 scenarios, drought conditions are expected to worsen significantly in many areas of the state. Duration and frequency show particularly strong increases in northern and northeastern Iowa, with projected changes exceeding several hundred percent in some cases. Notably, while central and southeastern Iowa may experience minor changes or localized reductions in drought intensity, the overall statewide trend points toward more frequent, longer-lasting droughts in the future. These findings underscore that even under a low-emission trajectory, adaptation efforts will be essential for managing drought-related stress in vulnerable regions.
Although SSP5 generally projects more severe drought conditions due to higher greenhouse gas emissions and stronger warming, certain regions in Iowa show higher drought intensity or frequency under SSP1 in some models. This behavior can be attributed to the complex interplay between precipitation patterns and temperature-induced evapotranspiration at the regional scale (Song and Chung, 2024). For example, under SSP1, while overall warming is less intense, certain areas may experience more pronounced reductions in summer precipitation, leading to localized soil moisture deficits and enhanced drought signals. Additionally, SSP1 scenarios often assume land-use changes and afforestation efforts that, while globally beneficial, may locally increase evapotranspiration rates and reduce surface runoff, particularly in agriculturally intensive areas. Model variability also plays a role; some models may simulate circulation patterns or feedbacks (e.g., vegetation-climate interactions) differently under SSP1, leading to unexpected hotspots of drought vulnerability. Thus, higher drought metrics in some regions under SSP1 do not contradict the broader trend of increasing risk under SSP5, but rather reflect the nuanced, non-linear responses of the hydroclimate system to different mitigation pathways.
4.4 Regional vulnerabilities and environmental implications
The analysis provides insights into future drought conditions to develop a deeper understanding of the vulnerabilities associated with the hydrological regime in Iowa’s agricultural landscapes. These conditions result from multiple interrelated factors, including a decrease in annual precipitation and intensive land-use practices characterized by agricultural production systems that reduce both soil water retention capacity and overall ecosystem resilience. In particular, the lack of vegetative cover and the degradation of soil organic matter further diminish the land’s ability to absorb and retain moisture. These dynamics are clearly reflected in the projected spatial patterns of increased drought frequency and duration.
The vulnerability of northern Iowa to droughts can be attributed to an interplay of climatic, geographic, and anthropogenic factors (USGCRP, 2023). Climatically, the region lies within a transitional zone between humid continental and semi-arid regimes, making it particularly sensitive to large-scale atmospheric oscillations such as ENSO (El Niño–Southern Oscillation), which drive significant interannual variability in precipitation (Baule et al., 2024). Geographically, the soils, primarily loess and glacial till, are highly fertile but structurally porous and prone to compaction, which reduces their effective water retention capacity under intensive land use (Peters et al., 2025). From an anthropogenic perspective, the landscape is dominated by monocultures of corn and soybeans, often supported by extensive subsurface tile drainage systems that disrupt natural hydrological cycles by accelerating runoff and limiting infiltration (Kalcic et al., 2018). Additionally, the scarcity of crop rotations and regenerative practices has led to declining soil organic matter levels, further diminishing resilience to hydrological stress (Henzel et al., 2025; Holman et al., 2021). These structural and systemic conditions create a landscape with high exposure and low adaptive capacity to prolonged droughts.
Results from the drought projections and IDF analysis suggest that northern Iowa is particularly vulnerable to future drought events. From a land management perspective, these findings provide insights for guiding adaptation efforts. Northern watersheds, especially those with extensive corn and soybean cover and limited conservation practices, may benefit from more robust drought mitigation strategies, such as the implementation of cover crops, conservation tillage, and riparian corridor restoration. These practices can help strengthen resilience by enhancing infiltration, reducing runoff, and maintaining ecological function during dry periods. The need for such adaptive strategies has been highlighted by Bravo and Sarker (2022), who stress the role of nature-based solutions in mitigating agricultural drought risks under future climate scenarios.
Moreover, the interactive Future Drought Viewer developed in this study supports watershed-scale planning by allowing stakeholders to explore projected drought conditions at the HUC8 level. This functionality enables local planners, producers, and decision-makers to make informed, geographically specific decisions regarding resource allocation and drought preparedness.
Long-term drought projections play a crucial role in guiding adaptation strategies at local and regional scales, as well as informing policies related to sustainable agriculture, water allocation, and habitat conservation amid changing climate conditions. This research advances watershed planning by integrating hydrologic modeling to identify high-risk areas and quantify anticipated shifts in drought intensity, frequency, and duration. Consistent with Singhal et al. (2024), the study underscores the importance of strategically locating hydrologic monitoring stations using topographic and hydrological data to improve early detection and management of extreme events. Additionally, the findings align with Gao et al. (2022), who demonstrate how water infrastructure, such as constructed and planned dams, can substantially impact the environmental integrity and ecological resilience of river basins. These insights are important for regions like northwest Iowa, which are already experiencing heightened hydrologic variability driven by climate change.
4.5 Conrast with other models
The application of LSTM models for drought projections has garnered increasing attention in recent research. These models have proven capable of capturing the complex temporal dependencies within climate data, leading to notable improvements in prediction accuracy compared to traditional methods. This chapter focuses on assessing the performance of LSTM models in drought prediction to compare existing studies with the results presented in this research.
LSTM existing models have been successfully employed to predict drought indices derived from various meteorological data, such as precipitation and temperature. For instance (Xu et al., 2022), developed a hybrid ARIMA-LSTM model, achieving a Nash-Sutcliffe Efficiency (NSE) value of up to 0.895 over a 24-month time scale, indicating strong alignment between forecasted and observed drought conditions. Another study (Dikshit et al., 2021) used a stacked LSTM model to extend the forecast horizon, demonstrating that the model outperformed traditional drought prediction techniques by delivering lower RMSE and MAE scores. Similarly (Zhang et al., 2023), applied a convolutional LSTM model and found high correlation coefficients between forecasted results and established drought indices.
Moreover, hybrid approaches integrating LSTM with other methodologies have improved performance. For example (Ding et al., 2022), proposed a CEEMD-LSTM hybrid model, stabilizing time series data and enhancing accuracy across multiple time scales. Such hybrid models consistently outperformed standalone LSTM models, particularly in long-term drought projections, by leveraging the strengths of different modeling approaches.
In this context, our work stands out by applying an LSTM model to project drought conditions in Iowa, focusing on the USDM dataset. The results reflect high accuracy and reliability, with an RMSE of 0.24 and an R2 score of 0.91. This underscores the model’s ability to capture complex patterns in climate data and provide precise future projections. Table 4 presents results from various LSTM models reported in the manuscript (Márquez-Grajales et al., 2024) and additional studies to compare our research with previous works.
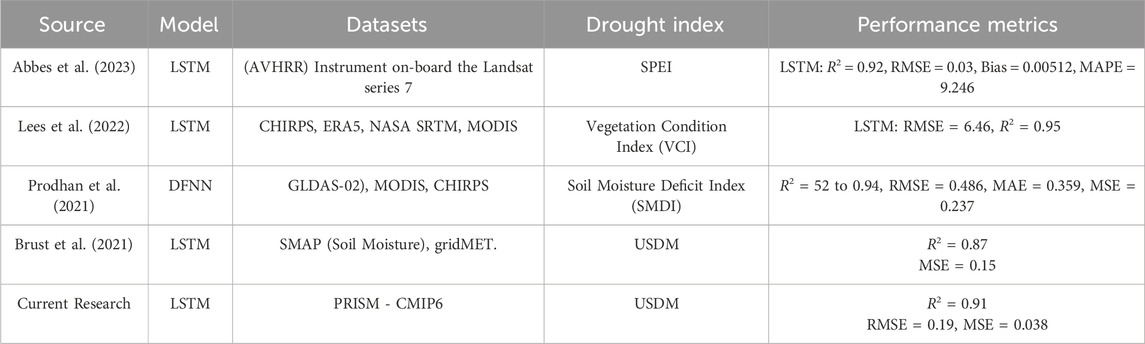
Table 4. Deep learning model comparison.
To support a broader understanding of how LSTM models have been applied to drought-related forecasting tasks, we include results from previous studies as reference points, Table 2 4. These models serve as a basis for general interpretation and comparison with our own results. However, differences in data configurations (such as variable selection, temporal resolution, and input window size) limit their ability to serve as direct performance standards. Instead, they should be understood as contextual benchmarks that reflect the broader range of modeling strategies and outcomes in studies using neural networks to model climate time series and project drought conditions or related indices.
This research validates the use of LSTM models for drought projections. It paves the way for the development of interactive tools that facilitate drought condition visualization and management at the community level, thus enhancing decision-making for water resource management in a changing climate.
5 Conclusion
This study explored the future drought conditions in the HUC8 regions using an advanced LSTM machine-learning model. The model was developed using PPT and Tmax data from 2012 to 2019, and predictions were generated between 2030 and 2050. The LSTM model demonstrates good performance in predicting drought conditions. The model validation results show an MSE of 0.038, an R2 of 0.91, and a Pearson correlation coefficient of 0.96, suggesting that the model predictions are highly reliable.
Intensity, duration, and frequency analyses were performed. It is evident that drought conditions will increase in the coming decades under the conditions of the SSP5 and SSP1 climate scenarios and according to three different evaluated climate models (CNRM-ESM2-1, BCC-CSM2-MR, and MPI-ESM1-2-HR). The most affected region in Iowa by an increase in the duration of droughts will be the northern zone. An increase in the frequency of these events will affect the northeast and northwest regions specifically. Severe, extreme, and exceptionally dry droughts are expected to occur in the coming decades, averaging a duration of 1.2 months and a frequency of 8–9 times every 20 years.
The model results were integrated into the Future Drought Viewer app, which is presented as a tool to visualize, study, and analyze future drought conditions. The interactive interface allows users to select specific years and months to view detailed drought conditions. This functionality is essential for planning and decision-making, providing critical data to water resource managers and conservation policymakers.
The insights provided by Future Drought Viewer highlight the need for proactive water resource management. Understanding future drought conditions can guide the development of more resilient water supply systems and information policies to reduce vulnerability to water scarcity. The application supports strategic planning by offering projections that can be integrated into long-term water management plans.
While the model provides valuable predictions, the data is subject to specific future climate models and scenarios. Seasonal variations and regional differences in weather patterns can affect the accuracy of drought projections. Continuously refining the model and incorporating the most accurate climate data is critical to improving the reliability of future predictions.
Future research should focus on extending the model to include more comprehensive datasets and exploring other machine-learning techniques that could further improve prediction capabilities. In addition, user feedback and field validation studies will be essential to optimize the application and ensure its effectiveness in real-world scenarios.
Generative AI statement
The author(s) declare that no Generative AI was used in the creation of this manuscript.
Data availability statement
The app is available via https://icintura.users.earthengine.app/view/droughtviewer (accessed on September 5th, 2024). The LSTM model is available via https://github.com/ingridcintura/DroughtProjection.git (accessed on October 5th, 2024).
Author contributions
IC: Formal Analysis, Methodology, Software, Validation, Visualization, Writing – original draft. AA: Supervision, Writing – review and editing.
Funding
The author(s) declare that financial support was received for the research and/or publication of this article. This work was partially funded by an EPA grant (Award Number 84046101-0). We gratefully acknowledge their support.
Conflict of interest
The authors declare that the research was conducted in the absence of any commercial or financial relationships that could be construed as a potential conflict of interest.
Publisher’s note
All claims expressed in this article are solely those of the authors and do not necessarily represent those of their affiliated organizations, or those of the publisher, the editors and the reviewers. Any product that may be evaluated in this article, or claim that may be made by its manufacturer, is not guaranteed or endorsed by the publisher.
References
Abbes, A. B., Inoubli, R., Rhif, M., and Farah, I. R. (2023). Combining deep learning methods and multi-resolution analysis for drought forecasting modeling. Earth Sci. Inf. 16, 1811–1820. doi:10.1007/s12145-023-01009-4
Anderson, E. S., and Schilling, K. E. (2024). Expanding the applications of the standardized streamflow index through regionalization. JAWRA J. Am. Water Resour. Assoc. 60, 837–850. doi:10.1111/1752-1688.13205
Baule, J., Licht, W. M., Reynolds, M., Fillius, B., Vos, D., Glisan, R., et al. (2024). Climate change impacts on Iowa agriculture methods and supplementary materials contact information.
Benedict, T. D., Brown, J. F., Boyte, S. P., Howard, D. M., Fuchs, B. A., Wardlow, B. D., et al. (2021). Exploring VIIRS continuity with MODIS in an expedited capability for monitoring drought-related vegetation conditions. Remote Sens. 13, Page 1210–13. doi:10.3390/RS13061210
Branstad-Spates, E. H., Castano-Duque, L., Mosher, G. A., Hurburgh, C. R., Owens, P., Winzeler, E., et al. (2023). Gradient boosting machine learning model to predict aflatoxins in Iowa corn. Front. Microbiol. 14, 1248772. doi:10.3389/fmicb.2023.1248772
Bravo, A. G., and Sarker, S. (2022). Fundamentals of climatology for engineers: lecture note. Eng 3, 573–595. doi:10.3390/ENG3040040
Brust, C., Kimball, J. S., Maneta, M. P., Jencso, K., and Reichle, R. H. (2021). DroughtCast: a machine learning forecast of the United States drought monitor. Front. Big Data 4, 773478. doi:10.3389/fdata.2021.773478
CMIP Data Access - Coupled Model Intercomparison Project (2024). Available online at: https://wcrp-cmip.org/cmip-data-access/(Accessed 25 September 2024).
Current Map. U.S. Drought Monitor (2024). Available online at: https://droughtmonitor.unl.edu/CurrentMap.aspx (Accessed 9 January 2024).
Danandeh Mehr, A., Rikhtehgar Ghiasi, A., Yaseen, Z. M., Sorman, A. U., and Abualigah, L. (2023). A novel intelligent deep learning predictive model for meteorological drought forecasting. J. Ambient. Intell. Humaniz Comput. 14, 10441–10455. doi:10.1007/s12652-022-03701-7
Das, S., Tariq, A., Santos, T., Kantareddy, S. S., and Banerjee, I. (2023). Recurrent neural networks (RNNs): architectures, training tricks, and introduction to influential research. Neuromethods 197, 117–138. doi:10.1007/978-1-0716-3195-9_4
Dikshit, A., Pradhan, B., and Alamri, A. M. (2021). Long lead time drought forecasting using lagged climate variables and a stacked long short-term memory model. Sci. Total Environ. 755, 142638. doi:10.1016/J.SCITOTENV.2020.142638
Ding, Y., Yu, G., Tian, R., and Sun, Y. (2022). Application of a hybrid CEEMD-LSTM model based on the standardized precipitation index for drought forecasting: the case of the Xinjiang uygur autonomous region, China. Atmosphere 13, 1504–1513. doi:10.3390/ATMOS13091504
Drainage Water Management (2024). Iowa agriculture water alliance. Available online at: https://www.iaagwater.org/drainage-water-management (Accessed January 10, 2024).
Drugova, T., Curtis, K. R., and Ward, R. A. (2022). Producer preferences for drought management strategies in the arid west. Renew. Agric. Food Syst. 37, 14–23. doi:10.1017/S1742170521000259
Eyring, V., Bony, S., Meehl, G. A., Senior, C. A., Stevens, B., Stouffer, R. J., et al. (2016). Overview of the coupled model intercomparison project phase 6 (CMIP6) experimental design and organization. Geosci. Model Dev. 9, 1937–1958. doi:10.5194/GMD-9-1937-2016
Felsche, E., and Ludwig, R. (2021). Applying machine learning for drought prediction in a perfect model framework using data from a large ensemble of climate simulations. Nat. Hazards Earth Syst. Sci. 21, 3679–3691. doi:10.5194/NHESS-21-3679-2021
Fumagalli, F., Muschalik, M., Hüllermeier, E., and Hammer, B. (2023). Incremental permutation feature importance (iPFI): towards online explanations on data streams. Mach. Learn 112, 4863–4903. doi:10.1007/s10994-023-06385-y
Gao, Y., Sarker, S., Sarker, T., and Leta, O. T. (2022). Analyzing the critical locations in response of constructed and planned dams on the mekong River Basin for environmental integrity. Environ. Res. Commun. 4, 101001. doi:10.1088/2515-7620/AC9459
Gana, A. H., and Sa’id, A. I. (2022). Importance of climate change adaptation in drought mitigation: a review. UMYU J. Microbiol. Res. (UJMR) 7, 36–42. doi:10.47430/UJMR.2272.006
Gyaneshwar, A., Mishra, A., Chadha, U., Raj Vincent, P. M. D., Rajinikanth, V., Pattukandan Ganapathy, G., et al. (2023). A contemporary review on deep learning models for drought prediction. Sustainability, 15, Page 6160–15. doi:10.3390/SU15076160
Hanif, A., Beheshti, A., Benatallah, B., Zhang, X., Foo, E. J., Shabani, N., et al. (2023). A comprehensive survey of explainable artificial intelligence (XAI) methods: exploring transparency and interpretability. Lect. Notes Comput. Sci, 915–925. doi:10.1007/978-981-99-7254-8_71
Henzel, D., Junge, S. M., Joergensen, R. G., and Finckh, M. R. (2025). Can potato cropping be made regenerative? Cover crops and dead organic mulch support soil microbial activity. Biol. Fertil. Soils 61, 735–746. doi:10.1007/s00374-024-01887-w
Hatfield, J. L., and Prueger, J. H. (2004). Impacts of changing precipitation patterns on water quality. J. Soil Water Conserv. 59, 51–58. doi:10.1080/00224561.2004.12435710
Hochreiter, S., and Schmidhuber, J. (1997). Long short-term memory. Neural comput. 9, 1735–1780. doi:10.1162/NECO.1997.9.8.1735
Hoerling, M., Eischeid, J., Kumar, A., Leung, R., Mariotti, A., Mo, K., et al. (2014). Causes and predictability of the 2012 great plains drought. Bull. Am. Meteorological Soc. 95, 269–282. doi:10.1175/bams-d-13-00055.1
Holman, I. P., Hess, T. M., Rey, D., and Knox, J. W. (2021). A multi-level framework for adaptation to drought within temperate agriculture. Front. Environ. Sci. 8, 589871. doi:10.3389/fenvs.2020.589871
IIHR (2019a). Upper Iowa River watershed hydrologic assessment report upper Iowa River watershed management authority Iowa watershed approach phase I report.
IIHR (2019b). Upper wapsipinicon watershed hydrologic assessment report Iowa watershed approach phase I report.
Iowa (2024). Iowa | drought.gov. Available online at: https://www.drought.gov/states/iowa#drought-overview (Accessed 19 August, 24).
Iowa Regional Crop (2024). Iowa regional crop use in 2021: corn and soybeans. Available online at: https://www.iowafarmbureau.com/Article/Iowa-Regional-Crop-Use-in-2021-Corn-and-Soybeans (Accessed January 10, 2024).
Iqbal, J., Necpalova, M., Archontoulis, S. V., Anex, R. P., Bourguignon, M., Herzmann, D., et al. (2018). Extreme weather-year sequences have nonadditive effects on environmental nitrogen losses. Glob. Chang. Biol. 24, e303–e317. doi:10.1111/GCB.13866
Islam, S., Mount, J., and Demir, I. (2024). Comprehensive assessment of drought impact on crop yields across Iowa over two decades (2000-2022). doi:10.2139/SSRN.4987801
Islam, S. M. S., Yeşilköy, S., Baydaroğlu, Ö., Yıldırım, E., and Demir, I. (2024). State-level multidimensional agricultural drought susceptibility and risk assessment for agriculturally prominent areas. Int. J. River Basin Manag. 23, 337–354. doi:10.1080/15715124.2024.2304546
Jordaan, A., Bahta, Y. T., and Phatudi-Mphahlele, B. (2019). Ecological vulnerability indicators to drought: case of communal farmers in Eastern Cape, South Africa. J. Disaster Risk Stud. 11, 591. doi:10.4102/JAMBA.V11I1.591
Jungclaus, J. H., Bittner, M., Wieners, K., Wachsmann, F., Schupfner, M., Legutke, S., et al. (2019). MPI-M MPI-ESM1.2-HR model output prepared for CMIP6 CMIP historical. doi:10.22033/ESGF/CMIP6.6594
Kalcic, M., Crumpton, W., Liu, X., D’Ambrosio, J., Ward, A., and Witter, J. (2018). Assessment of beyond-the-field nutrient management practices for agricultural crop systems with subsurface drainage. J. Soil Water Conserv. 73, 62–74. doi:10.2489/JSWC.73.1.62
Khong, A., Wang, J. K., Quiring, S. M., and Ford, T. W. (2015). Soil moisture variability in Iowa. Int. J. Climatol. 35, 2837–2848. doi:10.1002/JOC.4176
Khorrami, B., and Gunduz, O. (2019). Analyses of meteorological drought and its impacts on groundwater fluctuations, a case study: marand plain (iran). Pamukkale Univ. J. Eng. Sci. 25, 711–717. doi:10.5505/PAJES.2019.63600
Kuzucu, A., and Onuşluel Gül, G. (2023). Analysis of drought dynamics over annual maximum drought severity series based on daily index definitions. Water Resour. Manag. 37, 1421–1436. doi:10.1007/s11269-023-03434-y
Lees, T., Tseng, G., Atzberger, C., Reece, S., and Dadson, S. (2022). Deep learning for vegetation health forecasting: a case study in Kenya. Remote Sens. 14, 698–14. doi:10.3390/RS14030698
Lindenlaub, L., Weigel, K., Hassler, B., Jones, C., and Eyring, V. (2025). Characteristics of agricultural droughts in CMIP6 historical simulations and future projections. doi:10.5194/EGUSPHERE-2025-1517
Lobell, D. B., Roberts, M. J., Schlenker, W., Braun, N., Little, B. B., Rejesus, R. M., et al. (2014). Greater sensitivity to drought accompanies maize yield increase in the U.S. Midwest. Science 344, 516–519. doi:10.1126/science.1251423
Loecke, T. D., Burgin, A. J., Riveros-Iregui, D. A., Ward, A. S., Thomas, S. A., Davis, C. A., et al. (2017). Weather whiplash in agricultural regions drives deterioration of water quality. Biogeochemistry 133, 7–15. doi:10.1007/s10533-017-0315-z
Márquez-Grajales, A., Villegas-Vega, R., Salas-Martínez, F., Acosta-Mesa, H. G., and Mezura-Montes, E. (2024). Characterizing drought prediction with deep learning: a literature review. MethodsX 13, 102800. doi:10.1016/J.MEX.2024.102800
Meinshausen, M., Nicholls, Z. R. J., Lewis, J., Gidden, M. J., Vogel, E., Freund, M., et al. (2020). The shared socio-economic pathway (SSP) greenhouse gas concentrations and their extensions to 2500. Geosci. Model Dev. 13, 3571–3605. doi:10.5194/GMD-13-3571-2020
Mikhailova, E. A., Zurqani, H. A., Lin, L., Hao, Z., Post, C. J., Schlautman, M. A., et al. (2024). Spatiotemporal analysis of soil quality degradation and emissions in the State of Iowa (USA). Land (Basel) 13, 547. doi:10.3390/land13040547
Molnar, C., König, G., Bischl, B., and Casalicchio, G. (2024). Model-agnostic feature importance and effects with dependent features: a conditional subgroup approach. Data Min. Knowl. Discov. 38, 2903–2941. doi:10.1007/S10618-022-00901-9/TABLES/8
National Hydrography Dataset U.S. Geological Survey (2024). Available online at: https://www.usgs.gov/national-hydrography/national-hydrography-dataset (Accessed 4 September, 2024).
Nowatzke, L., and Arbuckle, J., (2024). Global warming’s “Six Americas” among Iowa farmers: exploring differential attitudes towards climate change and agriculture. doi:10.21203/RS.3.RS-4351136/V1
Peters, A., Tian, Z., Heitman, J. L., Iden, S. C., Rolfes, L., Germer, K., et al. (2025). Modeling compaction effects on soil water retention across the full moisture range: calibration and validation. Vadose Zone J. 24, e70004. doi:10.1002/VZJ2.70004
Pedregosa, F., Michel, V., Grisel Oliviergrisel, O., Blondel, M., Prettenhofer, P., Weiss, R., et al. (2011). Scikit-learn: machine learning in python. J. Mach. Learn. Res. 12, 2825–2830.
PRISM Climate Group. Oregon State University, (2024). Available online at: https://www.prism.oregonstate.edu/(Accessed 9 April 2024).
Prodhan, F. A., Zhang, J., Yao, F., Shi, L., Sharma, T. P. P., Zhang, D., et al. (2021). Deep learning for monitoring agricultural drought in south Asia using remote sensing data. Remote Sens. 13, 1715–13. doi:10.3390/RS13091715
Salimi, H., Asadi, E., and Darbandi, S. (2021). Meteorological and hydrological drought monitoring using several drought indices. Appl. Water Sci. 11, 11–10. doi:10.1007/s13201-020-01345-6
Santos, C. A. G., Brasil Neto, R. M., da Silva, R. M., and dos Santos, D. C. (2019). Innovative approach for geospatial drought severity classification: a case study of Paraíba state, Brazil. Stoch. Environ. Res. Risk Assess. 33, 545–562. doi:10.1007/s00477-018-1619-9
Séférian, R., Nabat, P., Michou, M., Saint-Martin, D., Voldoire, A., Colin, J., et al. (2019). Evaluation of CNRM earth system model, CNRM-ESM2-1: role of Earth system processes in present-day and future climate. J. Adv. Model Earth Syst. 11, 4182–4227. doi:10.1029/2019MS001791
Shi, B., Zhu, X., Hu, Y., and Yang, Y. (2017). Drought characteristics of Henan Province in 1961-2013 based on standardized precipitation evapotranspiration index. J. Geogr. Sci. 27, 311–325. doi:10.1007/s11442-017-1378-4
Salih, A., Raisi-Estabragh, Z., Galazzo, I. B., Radeva, P., Petersen, S. E., Menegaz, G., et al. (2023). A perspective on explainable artificial intelligence methods: SHAP and LIME. doi:10.1002/aisy.202400304
Scott Lundberg (2018). SHAP documentation. Available online at: https://shap.readthedocs.io/en/latest/index.html (Accessed 4 November, 2024).
Sharma, N. A., Chand, R. R., Buksh, Z., Ali, A. B. M. S., Hanif, A., and Beheshti, A. (2024). Explainable AI frameworks: navigating the present challenges and unveiling innovative applications. Algorithms 17, 227–17. doi:10.3390/A17060227
Singhal, A., Jaseem, M., Sarker, S., Prajapati, P., Singh, A., Jha, S. K., et al. (2024). Identifying potential locations of hydrologic monitoring stations based on topographical and hydrological information. Water Resour. Manag. 38, 369–384. doi:10.1007/S11269-023-03675-X
Song, Y. H., and Chung, E. S. (2024). Uncertainties in future extreme drought characteristics associated with SSP scenarios over global lands. Earth Syst. Environ. 9, 935–965. doi:10.1007/s41748-024-00505-x
Tan, Z., Tian, Y., and Li, J. (2023). GLIME: general, stable and local LIME explanation. Adv. Neural Inf. Process Syst. 36.
USDA/NASS (2023). State agriculture overview for Iowa. Available online at: https://www.nass.usda.gov/Quick_Stats/Ag_Overview/stateOverview.php?state=IOWA (Accessed January 10, 2024).
Vicente-Serrano, S. M., Beguería, S., and López-Moreno, J. I. (2010). A multiscalar drought index sensitive to global warming: the standardized precipitation evapotranspiration index. J. Clim. 23, 1696–1718. doi:10.1175/2009JCLI2909.1
Vicente-Serrano, S. M., Beguería, S., and López-Moreno, J. I. (2011). Comment on “Characteristics and trends in various forms of the Palmer Drought Severity Index (PDSI) during 1900–2008” by Aiguo Dai. J. Geophys. Res. Atmos. 116, 19112. doi:10.1029/2011JD016410
Vo, T. Q., Kim, S. H., Nguyen, D. H., and Bae, D. H. (2023). LSTM-CM: a hybrid approach for natural drought prediction based on deep learning and climate models. Stoch. Environ. Res. Risk Assess. 37, 2035–2051. doi:10.1007/s00477-022-02378-w
Vahedifard, F., Goodman, C. C., Paul, V., and AghaKouchak, A. (2024). Amplifying feedback loop between drought, soil desiccation cracking, and greenhouse gas emissions. Environ. Res. Lett. 19, 031005. doi:10.1088/1748-9326/AD2C23
Wu, T., Lu, Y., Fang, Y., Xin, X., Li, L., Li, W., et al. (2019). The Beijing climate center climate system model (BCC-CSM): the main progress from CMIP5 to CMIP6. Geosci. Model Dev. 12, 1573–1600. doi:10.5194/GMD-12-1573-2019
Xu, D., Zhang, Q., Ding, Y., and Zhang, D. (2022). Application of a hybrid ARIMA-LSTM model based on the SPEI for drought forecasting. Environ. Sci. Pollut. Res. 29, 4128–4144. doi:10.1007/s11356-021-15325-z
Xu, H., Twine, T. E., and Girvetz, E. (2016). Climate change and maize yield in Iowa. PLoS One 11, e0156083. doi:10.1371/JOURNAL.PONE.0156083
Yildirim, E., and Demir, I. (2022). Agricultural flood vulnerability assessment and risk quantification in Iowa. Sci. Total Environ. 826, 154165. doi:10.1016/J.SCITOTENV.2022.154165
Yang, Y., Feng, D., Beck, H. E., Hu, W., Abbas, A., Sengupta, A., et al. (2025). Global daily discharge estimation based on grid long short-term memory (LSTM) model and River routing. Water Resour. Res. 61, e2024WR039764. doi:10.1029/2024WR039764
Keywords: drought projections, long short-term memory, climate data analysis, drought intensity, drought duration, drought frequency, future drought viewer
Citation: Cintura I and Arenas A (2025) Projection and assessment of future droughts in Iowa: developing a machine learning model and an interactive application. Front. Environ. Sci. 13:1564670. doi: 10.3389/fenvs.2025.1564670
Received: 22 January 2025; Accepted: 22 July 2025;
Published: 08 August 2025.
Edited by:
Munir Ahmad Nayak, National Institute of Technology, Srinagar, IndiaReviewed by:
Shiblu Sarker, Virginia Department of Conservation and Recreation, United StatesXiaoyan Song, Northwest A & F University, China
Md Saquib Saharwardi, King Abdullah University of Science and Technology, Saudi Arabia
Copyright © 2025 Cintura and Arenas. This is an open-access article distributed under the terms of the Creative Commons Attribution License (CC BY). The use, distribution or reproduction in other forums is permitted, provided the original author(s) and the copyright owner(s) are credited and that the original publication in this journal is cited, in accordance with accepted academic practice. No use, distribution or reproduction is permitted which does not comply with these terms.
*Correspondence: Ingrid Cintura, aWNpbnR1cmFAaWFzdGF0ZS5lZHU=; Antonio Arenas, YWFyZW5hc0BpYXN0YXRlLmVkdQ==