 Mathis Tonn
 Christian Barthlott
 Michael Kunz
 Corinna Hoose
- Institute of Meteorology and Climate Research Troposphere Research (IMKTRO), Karlsruhe Institute of Technology (KIT), Karlsruhe, Germany
The impact of wind shear on aerosol-cloud interactions and convective precipitation is investigated with real-case simulations using the ICOsahedral Non-hydrostatic (ICON) model over central Europe. Three days with severe convective storms have been simulated using a double-moment microphysics scheme on a 1-km grid. For each day, twenty simulations with varied initial vertical wind shear and cloud condensation nuclei (CCN) concentrations were performed. In these simulations, a higher convective potential is found for stronger wind shear. However, this is not necessarily reflected in the amount of precipitation, which shows no systematic dependency on the wind shear for the days analyzed. Changing the CCN concentration generally has a smaller impact on the precipitation amount than changing the wind shear. Even if hydrometeor amounts and microphysical process rates respond similarly to changing CCN concentrations in the different shear cases, the convective precipitation shows no systematic CCN dependency. Furthermore, it is shown that this dependency even changes for a different simulation duration. If the amount of precipitation is related to its generation processes, a systematic relationship emerges: the precipitation efficiency always increases with increasing CCN concentrations, and this increase is greater the higher the initial wind shear of the simulations is. The findings of the present paper demonstrate that the impact of wind shear on aerosol-cloud interactions is complex, and previous results from idealized simulations cannot be transferred to realistic simulations.
1 Introduction
The forecast skill of numerical weather prediction (NWP) models has improved greatly over the past years. Nowadays, much higher computing power is available than a few decades ago. This makes it possible to run model simulations with a higher resolution and to use more accurate descriptions of radiation, clouds, and other physical processes. Aside from that, much more data, particularly from remote-sensing instruments, are collected nowadays, which are assimilated in a better way (Magnusson and Källén, 2013; Bauer et al., 2015; Brunet et al., 2023). Also, ensemble modeling strategies are often used to estimate uncertainties of the model forecast (Buizza, 2018). However, accurately forecasting convective events is still a big challenge, as such events are often small-scale and influenced by many different factors. This is a problem since convective clouds and storms are often associated with severe weather phenomena like hail, heavy rain, or severe wind gusts. As a consequence, these events often cause large damage to buildings, infrastructure, vehicles, and agriculture or even pose a risk to human health, making accurate forecasts highly important (e.g., Púčik et al., 2019; Kron et al., 2019; Wilhelm et al., 2021).
The three ingredients necessary for convection are sufficient low-level moisture, instability of the atmosphere, and a trigger mechanism (Doswell III, 1987; Houze, 1993). The triggering mechanisms can be induced by the orography or heterogeneities of the land surface (Kirshbaum et al., 2018). Also, the synoptic-scale flow can play an important role in convection initiation (CI) as a relevant portion of convective cells is triggered by fronts (Pacey et al., 2023; Kunz et al., 2020). Besides the triggering, the large-scale synoptic flow influences the thermodynamic conditions of the atmosphere as well and is therefore to a large extent decisive for the occurrence of convection (e.g., Wapler and James, 2015; Piper and Kunz, 2017; Piper et al., 2019).
After CI, the environmental dynamics and the complex microphysics in the formation of cloud droplets while interacting with aerosols (aerosol–cloud interactions: ACI) are additional factors that increase the uncertainty in convection forecasts (e.g., Tao et al., 2007; Seifert et al., 2012; Fan et al., 2013). While vertical wind shear is crucial for the organization and lifetime of convective cells (Markowski and Richardson, 2010; Wilhelm et al., 2023), ACI in particular introduces large uncertainties in numerical modeling (Stier et al., 2024). A higher amount of aerosols that are activated as cloud condensation nuclei (CCN) leads to more but smaller cloud droplets in general (Gunn and Phillips, 1957). This has an effect on the earth’s energy budget as the optical thickness of a cloud is dependent on the diameter of the droplets (Twomey, 1977). Further, the lifetime of the cloud is assumed to be longer for higher pollution due to the lack of efficient collision–coalescence (Albrecht, 1989; Rosenfeld and Lensky, 1998).
As summarized by Fan et al. (2016), the aerosol effects differ for the various cloud types. In convective clouds, the so-called cold-phase invigoration hypothesis (Rosenfeld et al., 2008) states that in polluted conditions, a higher amount of droplets can reach the freezing level, resulting in an additional heat release and therefore in more intense convection with higher precipitation amounts. Another theory is the warm-phase invigoration, stating that more condensation can occur during convection in high-pollution environments, leading to a higher latent energy release (Cotton and Walko, 2021). This theory was supported by simulations of the measurement campaign GoAmazon (Fan et al., 2018). However, a recent study by Öktem et al. (2023) did not confirm this hypothesis since they found no aerosol impacts on updraft speed and reflectivities for the same data. As a third theory of invigoration, a higher humidity of the environment due to stronger moisture detrainment for higher pollution could also strengthen the large-scale ascent and therefore the small-scale convective cells (Abbott and Cronin, 2021).
In all invigoration hypotheses, the convective intensity only increases up to an optimum CCN concentration and decreases for higher aerosol loading as the radiative effect is assumed to dominate then with the consequence that less energy is available at near-surface layers for convection (Rosenfeld et al., 2008). However, several studies in the past were not able to find evidence for the hypothesis of convective invigoration independent of the physical process behind it (Altaratz et al., 2014). In Barthlott and Hoose (2018), realistic convection-resolving simulations of weakly- and strongly-forced events were performed, revealing no systematic aerosol effect in the weakly forced cases, while in the strongly forced cases, even a decreasing precipitation amount for increasing CCN concentration was observed. Therefore, the aerosol effect is not negligible, but more accurate knowledge about the environmental conditions is of high importance.
Several variables influence ACI, explaining deviations from the idealized concept of convective invigoration. Factors regulating the dominant microphysical processes as well as the feedback between microphysics and dynamics are relative humidity (Khain et al., 2008; Mulholland et al., 2024), convective available potential energy (CAPE) (Storer et al., 2010), soil moisture (Barthlott et al., 2022a; Schneider et al., 2019), and vertical wind shear (Fan et al., 2009; 2012; Mulholland et al., 2024). In particular, the wind shear has a dominant influence on how the ACI impacts convective clouds and precipitation. For higher wind shear (especially across mid-levels: 1–6 km), Mulholland et al. (2024) found stronger storm-relative inflows, and therefore, less dilute and stronger updrafts, leading to a larger hydrometeor mass as well as higher precipitation rates in the case of supercells. Fan et al. (2009) used idealized cloud-resolving simulations to systematically assess how aerosols affect isolated convection in strong and weak wind shear conditions. For cases with weak wind shear, convective precipitation depends on the CCN amount as stated in the invigoration hypothesis: an increase is observed up to an optimum CCN concentration, but a decrease for higher aerosol loading. However, for strong vertical wind shear, an increasing CCN amount leads in their simulations to less convective intensity. The authors stated that in strong shear environments, the increasing evaporative cooling is always larger than the increasing condensational heating when increasing the CCN concentration.
The main objectives of this study are to assess whether this CCN–precipitation relation for different wind shear can also be seen in real-case simulations. We want to give new insights into realistically simulated convective event days where idealized simulations cannot give the full picture. Many studies, apart from Fan et al. (2009) in the past, focused on idealized simulations (e.g., Altaratz et al., 2008; Storer et al., 2010; Kalina et al., 2014; Mulholland et al., 2024) since these have the advantage of easily changeable environmental conditions. Numerous sensitivity runs are possible at relatively moderate computational costs. However, it was stressed by Noppel et al. (2010) that the ACI sensitivity in idealized simulations often differs from that in real-case simulations. The latter represent a more realistic life cycle, account for a variable orography and land surface, and enable also the interaction between different cloud regimes within a large domain (e.g., Barthlott and Hoose, 2018; Dagan and Stier, 2020; Barthlott et al., 2022b; 2024).
For our purpose, we simulated three convective active days - 23 June 2021, 28 June 2021, and 22 July 2015 (see Section 2.2) - for a period of 30 h until 0600 UTC of the following day with a 1 km resolution, in which both vertical wind shear and CCN concentration are systematically varied. We are interested in the similarities and differences in the thermodynamic environmental variables and microphysical process rates of the individual simulations that explain the results of the precipitation. We also investigate how the relationship between precipitation generation and actual precipitation amounts behaves in the individual simulations.
The model and its general structure are described in Section 2. Additionally, it is explained how wind shear and CCN concentration were modified in the individual simulations to investigate the effects of wind shear and aerosol content on convective precipitation. To get an overview of the three simulation days, observations are also shown, and the Swabian MOSES field campaign is introduced, as two of the three cases occurred during that campaign. In Section 3, the effects of varying initial wind shear and CCN concentration on convective precipitation on the three simulation days are shown. The results for each day are presented individually, followed by the conclusions that can be learned from the simulations.
2 Methods
2.1 Model description and simulations overview
To study the impacts of changing vertical wind shear and ACI on convective precipitation, the model simulations were performed with the ICOsahedral Non-hydrostatic (ICON) model in version 2.6.5. The horizontal grid of ICON is triangular, resulting from the projection of an icosahedron onto a sphere (Zängl et al., 2015). The German Weather Service (Deutscher Wetterdienst, DWD) uses ICON for operational global and regional NWP. For the forecast over Germany, the ICON-D2 model has been run since February 2021 with a convection-permitting resolution of 2 km over the domain depicted in Figure 1. For the black framed model area, simulations of convective events are performed in the present study with an even higher resolution of 1 km (R19B08). In the vertical, 100 layers extend up to 22 km above ground level. For that, the smooth level vertical (SLEVE) coordinate is utilized, enabling a faster transition from a terrain following to a smoothed signal in the upper troposphere (Leuenberger et al., 2010).
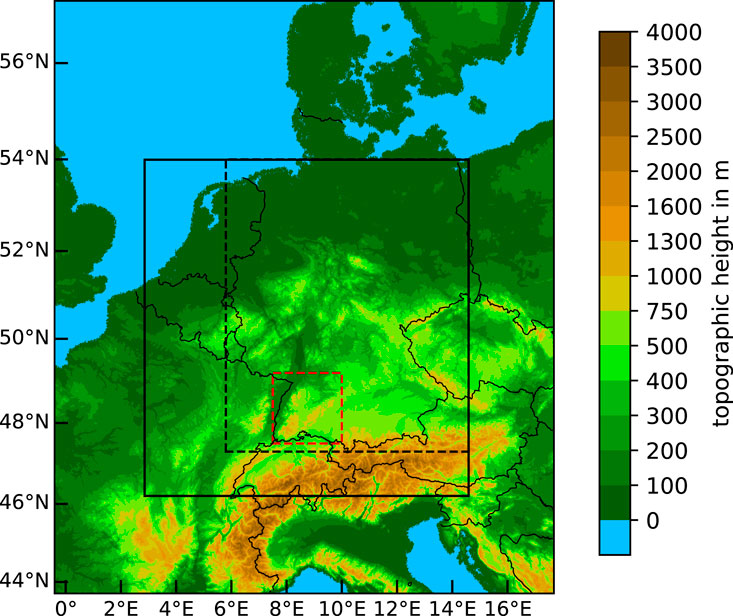
Figure 1. Map of the ICON-D2 model area with colors indicating the orography. The black framed domain inside indicates the model area for the simulations with 1 km resolution performed for the present study. The black dashed box displays the DE-domain used for most analysis (Section 3). The red dashed box shows the location of the Swabian MOSES field campaign (see Section 2.2).
The three convective active days - 23 June 2021, 28 June 2021, and 22 July 2015 - which are described in more detail in Section 2.2, are all simulated for an integration time of 30 h, initialized at 0000 UTC, producing output half-hourly. The original simulation period of 24 h was extended by 6 h, as not all convective systems had completely dissipated within that time. An even longer period was not considered so as not to stray too far from the initial conditions. For the time integration, a two-time-level predictor-corrector scheme is used, which is explicit except for the vertical sound-wave propagation terms (Zängl et al., 2015). For the initialization, different data are used: in the cases of summer 2021, ICON-EU operational analysis (R03B08; resolution = 6.5 km) function as initial and boundary data, and in the case of summer 2015, data from the Integrated Forecasting System (IFS) of the European Center for Medium-Range Weather Forecasts (ECMWF). That is because an index describing the soil moisture was not available in the ICON data before 2018. For all 3 days, these initial and boundary data are mapped onto the 1-km limited-area grid.
In the simulations, the two-moment bulk microphysics scheme of Seifert and Beheng (2006) is employed to account for aerosol effects on the microphysics of mixed-phase clouds. This scheme predicts the mass and number concentrations of liquid hydrometeors, including cloud droplets and raindrops, as well as of solid hydrometeors, such as cloud ice, snow, graupel, and hail. By using this microphysics scheme and the CCN activation parameterization of Segal and Khain (2006), four reference simulations (in the following referred to as REF in the figures) per day were performed with different conditions of pollution in each run, indicated by the CCN concentration
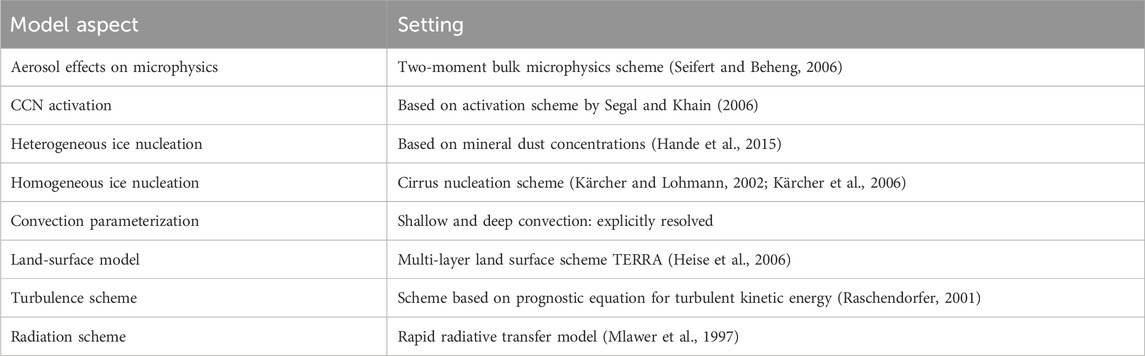
Table 1. Further model configuration details.
With the reference simulations described above, it is possible to study the impact of ACI on convective clouds and precipitation. To study the importance of vertical wind shear, the wind profile is modified in sensitivity runs. For the present work, we decided to only change the wind speed, not the wind direction, in several layers. Up to a height of 1.15 km in the ICON-EU initial data (IFS: 1.092 km), the wind speed is kept constant to avoid strong disturbances of the boundary layer. Even if the boundary layer is not constant over the day and can reach higher up in the atmosphere, it was decided to multiply the wind speed above that constant threshold height with a factor
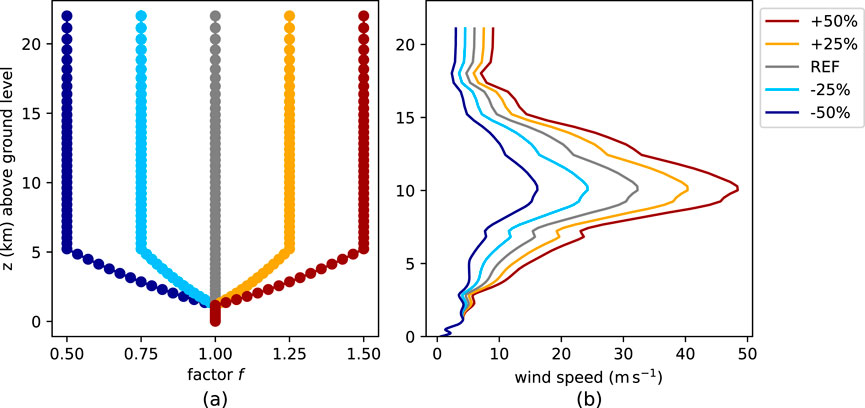
Figure 2. (a) Factor
With the chosen approach, large wind speed differences occur in the upper troposphere, the region of highest wind speed (Figure 2b). However, wind velocity differences are already obtained in the storm-inflow layer (1–3 km, according to Markowski and Richardson (2010)). Also in the lowest 6 km, there are relevant wind shear variations between the different simulations. Additionally, it is ensured with the chosen approach that there is no abrupt increase or decline in wind speed above the boundary layer.
It should be noted that even if only the wind speed is changed in the initial conditions, there can be differences in the wind direction. This is a consequence of the connection between the wind and the pressure fields. A higher (lower) wind speed corresponds to a larger (smaller) pressure gradient. Since the pressure field is also in balance with the temperature field, any variables affecting thermodynamics in the simulations can induce changes in the pressure field. This balance impacts again the wind field with the vectors parallel to the isobars in geostrophic balance. The above-described effect accounts for observed differences in the wind direction, for example, on 23 June 2021, 1200 UTC, between the +50%-simulation featuring southwesterly winds across Germany and the −50%-simulation characterized by mainly southerly winds, albeit with a slight easterly component in northern Germany (Figure 3).
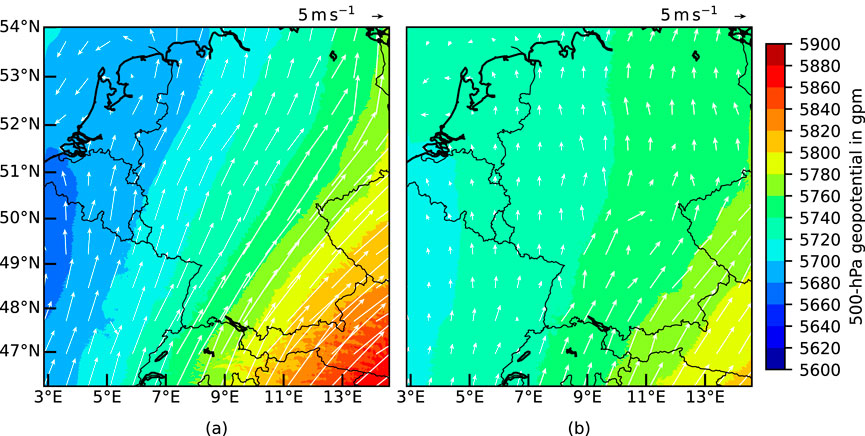
Figure 3. 500 hPa geopotential field and 500 hPa horizontal wind vectors for the ICON simulation domain on 23 June 2021, 1200 UTC in the (a) +50%-simulation and (b) −50%-simulation.
2.2 Case studies
Two of the three simulated thunderstorm days occurred during the first phase of the Swabian MOSES (Modular Observation Solutions for Earth System) field campaign in summer 2021 (Kunz et al., 2022). This field campaign was conducted by five Helmholtz research centers, three universities, and DWD under the coordination of the Karlsruhe Institute of Technology (KIT) to capture and explore the whole event chain of hydro-meteorological extremes like heavy precipitation or hail events in local-scale thunderstorms. The measuring area was located in southwestern Germany, including the regions of Neckar Valley and Swabian Jura (red dashed box in Figure 1), which is a hotspot for intense convection and hail (e.g., Puskeiler et al., 2016; Junghänel et al., 2016; Schmidberger, 2018).
According to Kunz et al. (2022), supercells were observed in the study area on both simulation days, the 23 and 28 June 2021, leading to widespread damage. Barthlott et al. (2024) showed for 23 June, how favorable convective conditions lead to a supercell with an especially long lifetime (7.5 h) and distance (187 km) producing hail with diameters of up to 4 cm, and hail accumulations on the ground of around 30 cm (Kunz et al., 2022). On 28 June, slightly smaller hail of 3 cm occurred, but heavy rainfall caused several flash floods on that day since the rain hit already high soil moisture.
Looking at these 2 days in the RADOLAN (Radar Online Adjustment) data of DWD, a precipitation data set created by combining radar data with rain gauge ground observations (DWD, 2023), it can be seen that on both days, high precipitation totals occurred over southwestern Germany within the Swabian MOSES domain, but also in some other regions. On 23 June, southeastern Germany is also affected by larger precipitation features, reaching into the Czech Republic (Figure 4a). On 28 June 2021, some areas in central and northwestern Germany were also affected by heavy precipitation (Figure 4b). Over southeastern Germany, there is again precipitation on that day.
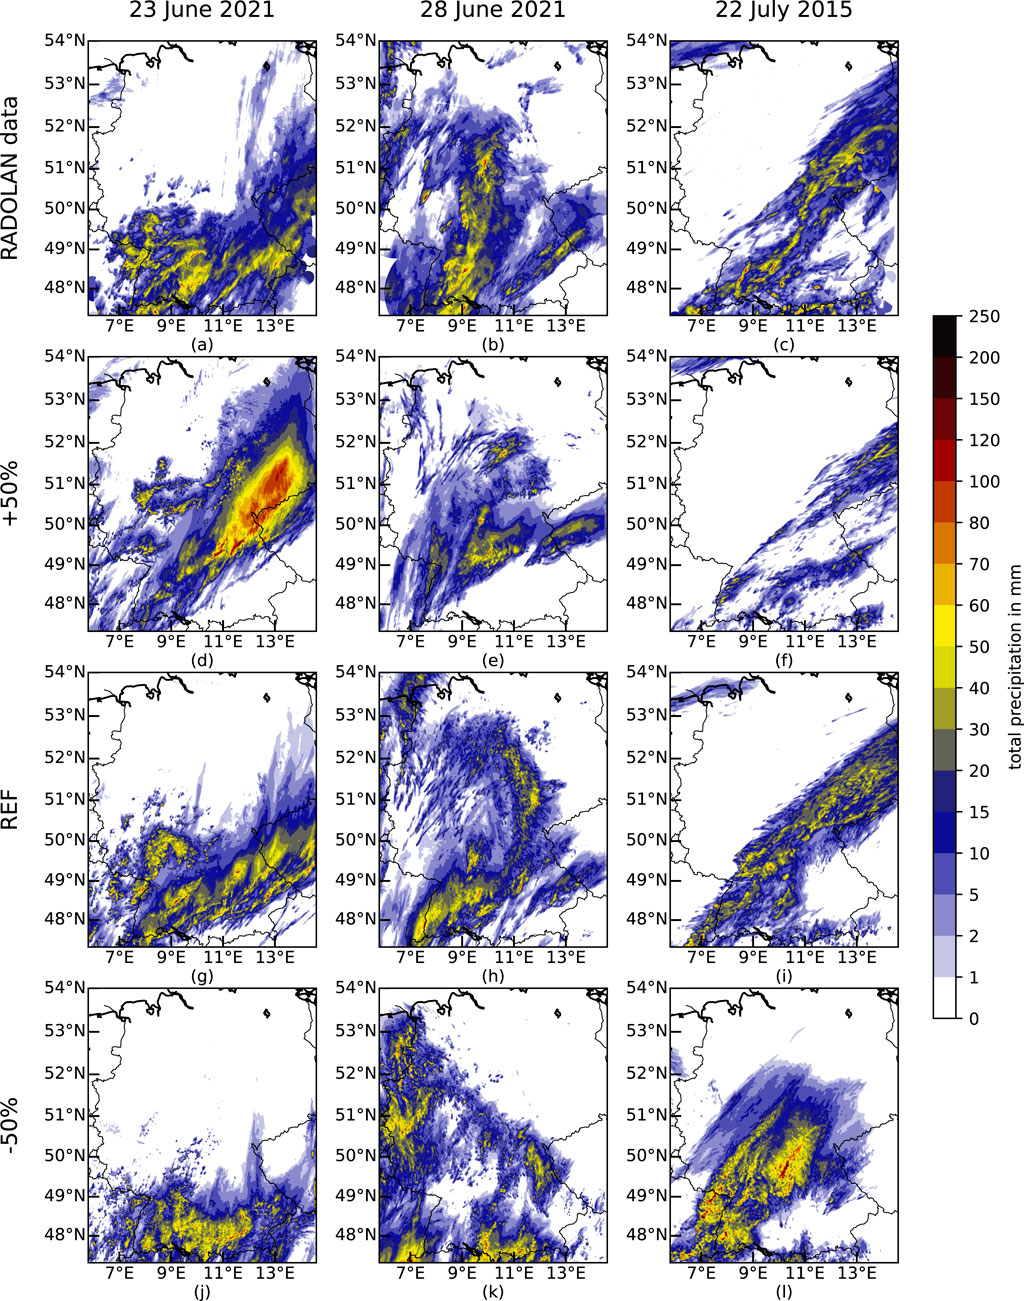
Figure 4. Accumulated surface precipitation over Germany and some bordering regions with each row indicating 1 day (a, d, g, j) 23 June 2021; (b, e, h, k) 28 June 2021; (c, f, i, l): 22 July 2015). In the first line, the precipitation amounts according to RADOLAN data are displayed (a-c). Each additional row indicates one shear case (d, e, f) +50%; (g, h, i) reference shear; (j, k, l): −50%). All simulations are performed with the continental CCN concentration. The map section shown in each plot corresponds to the DE-domain (see Section 3).
The third simulation day, 22 July 2015, was found in the data set of Tonn et al. (2023) as a day with strong convective activity and several mesocyclonic features. The most intense convective cells occurred in southwestern Germany (Figure 4c). A feature with high precipitation amounts extended over a larger area and was directed from southwest to northeast in northeastern Germany. Many single cells also occurred in southern Bavaria along the Austria-Germany border.
3 Results
For the 3 days, the results for the simulated amount of convective precipitation are shown in the following. First, dynamic and thermodynamic variables are used to explain why changing wind shear results in the depicted different precipitation amounts. Most explanations refer to the continental CCN concentrations
3.1 Effect of changing wind shear and CCN concentration on convective precipitation
Compared with the observations (Figure 4a), the spatial distribution of the precipitation features is similar to the simulation with reference shear and continental CCN concentration of 23 June 2021 (Figure 4g). Most of the precipitation falls over southern Germany. In this area, precipitation is mostly from longer-lived convection (not directly shown, but visible from somehow coherent features in this area). Additionally, short-lived convective cells occur over central western Germany. Over northern Germany, there is no precipitation. Overall, only slight deviations from the observations occur, such as a minor spatial shift of the convective cells. As a consequence, there is, for example, no precipitation in the simulations over the southeastern part of Germany (Figure 4g) even if there is some in the observations (Figure 4a).
Because of the chosen change of wind speed in the different simulations, the deep-layer shear (DLS), calculated as the difference in wind velocity between 0 and 6 km, is larger during the whole course of the day on all three simulation days the larger the vertical wind shear in the initial conditions is. It becomes visible for all days that with smaller DLS, the convection is less organized and characterized by a smaller-scale structure. On 23 June 2021, precipitation is, therefore, more concentrated in southern Germany in the −50%-simulations, as convective cells originally moving northeast have shorter lifetimes and tend to move more eastward (Figure 4j). The storm track of the observed supercell in southwestern Germany is not simulated by the model for this reduced shear. When DLS is larger, convection is more organized, resulting in larger areas affected by high amounts of accumulated precipitation on 23 June 2021 (Figure 4d). As the convective cells in the +50%-simulation have a stronger movement towards the north than in the reference run, the southeast of Germany is less affected than before, but now in eastern Germany, large amounts of precipitation occur. Furthermore, the track of the supercell is visible in the increased amount of precipitation along a strip in southwestern Germany.
Same as in the RADOLAN observations (Figure 4b), the simulated precipitation characteristics of 28 June 2021 (Figure 4h) are very different from those on 23 June 2021. The total precipitation amount in southern Germany decreases substantially for increasing wind shear on 28 June 2021 (Figure 4e). A large area with continuous high precipitation amounts is shifted more towards the north. This means that the precipitation features deviate significantly from the ones of the reference shear (Figure 4h). For that reference shear, precipitation occurred with the highest amounts in southwestern Germany and over central Germany, a bit shifted to the east compared to the RADOLAN data (Figure 4b). Also over Bavaria and in northern and northwestern Germany, some less intense convection takes place. In the −50%-simulation, the convective cells in the northwestern part of Germany are the most intense, as well as those in southern Bavaria along the Austria-Germany border (Figure 4k). As of 23 June 2021, the distribution of convective cells is characterized by smaller-scale structures for decreased wind shear.
When examining the precipitation distributions over Germany in the reference simulations on 22 July 2015, a continuous precipitation area can be seen stretching from the southwest to the east (Figure 4i). Additionally, some convective cells develop at the border region between Germany and Austria. Thus, the precipitation in the simulations aligns well with the observations also on this third simulation day (Figure 4c). In the +50%-simulation, the spatial pattern of the precipitation is similar; however, significantly lower precipitation amounts are visible (Figure 4f). In the −50%-simulation, precipitation, with significantly higher accumulated rainfall at some locations, is concentrated primarily in the central and southwestern parts of Germany (Figure 4l).
After accumulating the precipitation amounts of the different simulations over the entire DE area, a systematic, however, opposite behavior for wind shear dependency is striking: on 23 June 2021, precipitation sums are larger the stronger the shear in the initial conditions is (Figure 5a). This is mainly caused by the precipitation peak in the late evening and during the night. This effect is stronger in the simulations with larger initial wind shear (Figure 5b). The maximum rates are similar in the +25%- and +50%-simulation. However, in the +50%-simulation, the precipitation rate is larger earlier on the day, leading to the highest values in the precipitation amount over the whole day in this simulation. In contrast, on both other simulation days, more precipitation occurs the lower the wind shear is (Figure 5a). Only in the reference simulation of 28 June 2021, there is slightly more precipitation than in the −25%-simulation. The general decrease with increasing wind shear on 28 June 2021 is mainly caused by an earlier onset of precipitation, the lower the wind shear is (Figure 5c). In the reference simulation, the precipitation amount is still relatively high in the last simulation hours, leading to slightly higher accumulated values than in the −25%-simulation. On 22 July 2015, the precipitation rate is higher the lower the wind shear is over almost the whole simulation period affected by precipitation (Figure 5d).
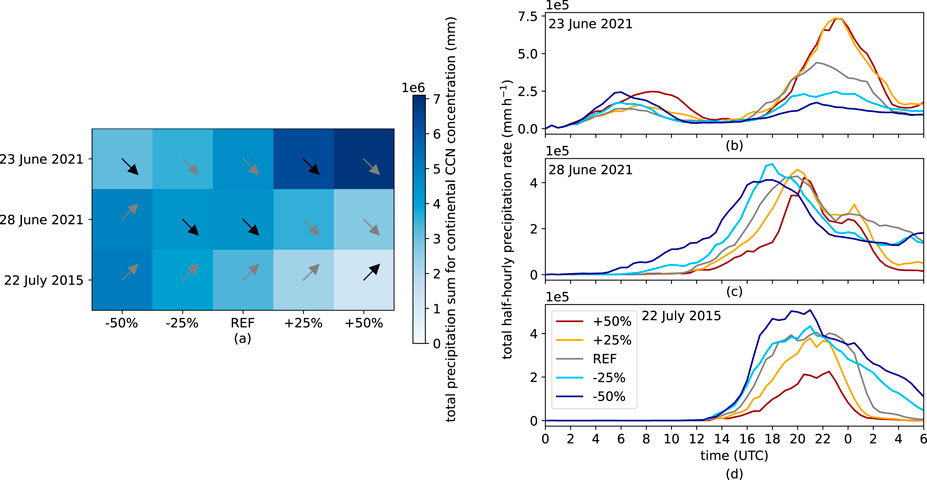
Figure 5. (a) Grid showing in each box one simulation of a specific date and wind shear case. Colors herein indicate the accumulated precipitation over the entire DE-domain when simulating with continental CCN concentration. The arrow inside the box indicates whether the precipitation sum is increasing or decreasing with increasing CCN concentration. For black arrows, the increase or decrease is systematic, while it is not for the gray arrows. Exact values can be taken from Figure A1 in the appendix. Other plots show the diurnal cycle of the total half-hourly precipitation rate, only for the continental CCN conditions, but for all different shear cases on (b) 23 June 2021, (c) 28 June 2021, and (d) 22 July 2015.
The CCN dependency of the total precipitation sum is similar for the different shear cases of a simulation day, but not for the different days: on 23 June 2021, in all shear cases, the precipitation sum is smaller for polluted conditions than for maritime ones (Figure 5a). On 22 July 2015, it is exactly the opposite, with a larger precipitation sum for polluted than for maritime conditions in all shear cases. The CCN dependency of 28 June 2021 is similar to 23 June 2021, except for the −50%-simulation in which a higher CCN concentration leads to more precipitation (Figure 5a). The magnitude of the precipitation differences between CCN concentrations remains similar across all shear cases. Overall, the effect of changed CCN concentration is much lower than the effect of changed wind shear (Figure A1). To explain the partly opposite dependencies on wind shear and CCN concentrations in the different simulations, the environmental conditions are presented day by day in the following subsections.
3.1.1 23 June 2021
On 23 June 2021, the systematic shear dependency of the precipitation sum is a consequence of the increased convection potential with increasing shear. Convection potential is represented by the mixed-layer CAPE, which is, according to Trapp (2013), calculated as the vertical integral of the buoyancy
The mixed-layer CAPE considers the buoyancy of an air parcel of the mixed lower 500 m of the atmosphere. In our simulations, the spatially averaged mixed-layer CAPE for the higher shear cases reaches significantly higher values during the day compared to the lower shear cases (Figure 6a). There is a linear correlation between CAPE and low-level (lowest 25 hPa) equivalent potential temperature
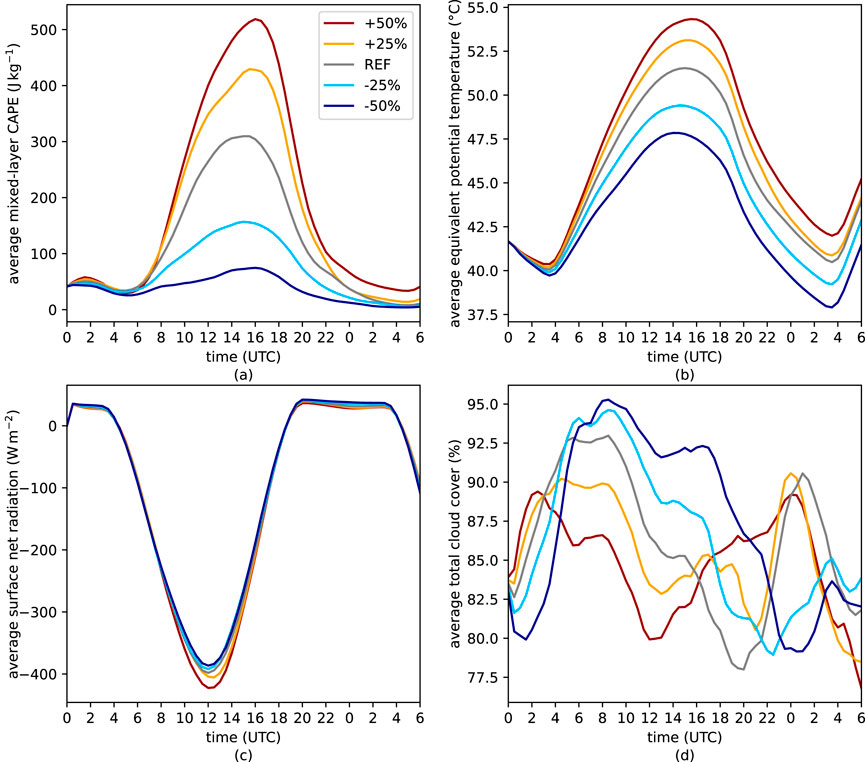
Figure 6. (a) Mixed-layer CAPE, (b) 2-m equivalent potential temperature, (c) net radiation on the surface, and (d) total cloud cover averaged over the DE-domain on 23 June 2021. All simulations were performed with continental CCN concentrations.
From around 0500 to 1500 UTC, a period covering the maximum insolation, the total cloud cover is lower the higher the initial shear is. This also applies individually to low-, medium-, and high-level clouds (not shown). In the late afternoon and evening, the behavior of the total cloud cover is no longer as systematic as before. The reason for the systematic behavior in simulated cloud cover during these hours remains unclear. This behavior occurs even before noon, despite the precipitation rate being highest at this time in the +50%-simulation. Since the share of grid points with precipitation follows a similar pattern to the precipitation rate, there are more non-precipitating clouds in the simulations with weaker vertical wind shear (not shown). To a certain extent, this contradicts the assumption that a stronger wind shear could increase the overlap of clouds and thus cloud cover (e.g., Di Giuseppe and Tompkins, 2015; Sulak et al., 2020).
For explaining the CCN dependency, hydrometeor contents, and microphysical process rates can be used (Figure 7). In agreement with previous findings (e.g., Barthlott et al., 2022b), a systematic increase in total cloud water (tqc) and a systematic decrease in total rain water (tqr) can be found for increasing CCN concentrations (Figure 7a). This is explained by a more efficient collision-coalescence for fewer but larger cloud droplets in the case of low pollution which fits with the decrease in autoconversion and accretion1 for increasing CCN concentrations (Figure 7b). This decrease is stronger for stronger shear cases. In tqr, the decrease, however, tends to be slightly stronger the smaller the shear is, since cold rain processes and subsequent phase changes also determine the rain water amount in the atmosphere. As in Barthlott et al. (2022b), deposition increases for increasing CCN concentrations while riming decreases. The latter one is a consequence of a smaller graupel-drop collision kernel in environments of higher CCN concentrations (Cui et al., 2011). Both processes, deposition and riming, tend to be more CCN-dependent in the stronger than in the weaker shear cases on this simulation day; however, not in a systematic way. The strongest increase in deposition takes place in the reference simulation.
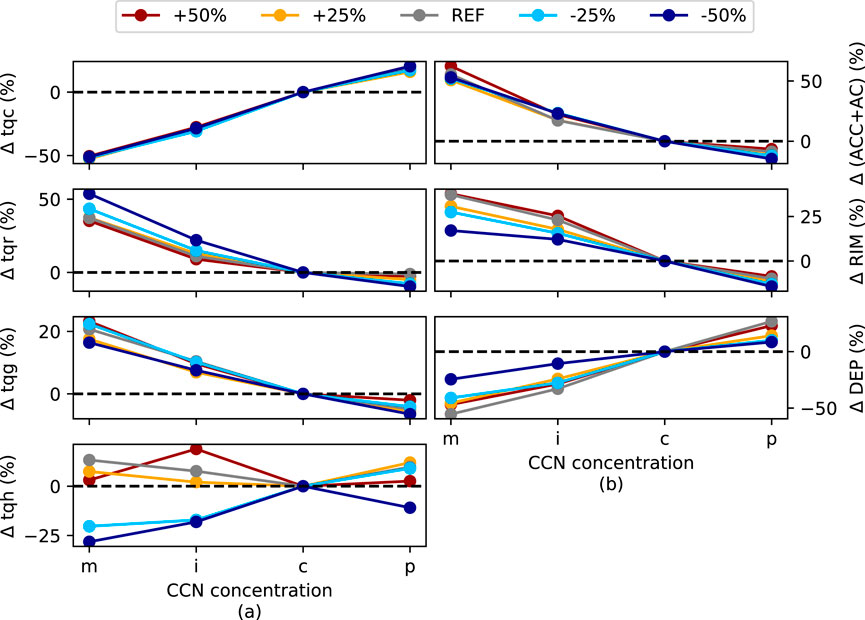
Figure 7. Percentage deviations from continental CCN concentration of spatio-temporal averages of (a) total cloud water (tqc), rain water (tqr), graupel (tqg), and hail (tqh), and of (b) the vertically integrated microphysical process rates accretion (ACC) and autoconversion (AC) together, where the latter one is the smaller contributor, riming (RIM), and deposition (DEP). Different colors indicate the different wind shear cases. All simulations were averaged over the DE-domain on 23 June 2021.
The decreasing riming rate and its different CCN sensitivities for the different shear cases explain the behavior of the total amount of graupel (tqg). The integrated amount of hail (tqh) is two magnitudes smaller (tqg:
3.1.2 28 June 2021
As mentioned above, the shear dependency on 28 June 2021 is contrary to 23 June 2021. More precipitation is modeled the lower the wind shear is (Figure 5a), even if the convection potential is again larger the larger the wind shear is (Figure 8a). The result in the averaged CAPE can be explained on the one hand again with the difference in
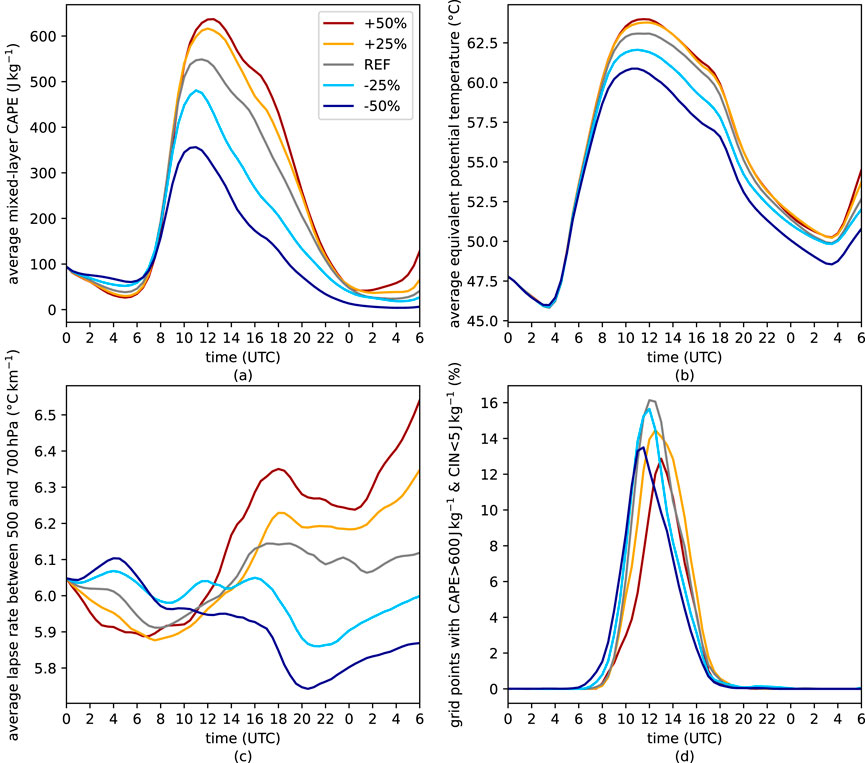
Figure 8. (a) 2-m equivalent potential temperature, (b) mixed-layer CAPE, (c) lapse-rate between 500 and 700 hPa averaged over the DE-domain, and (d) share of grid points with a mixed-layer CAPE larger than 600 J
However, the combination of CAPE and convective inhibition (CIN) - an energy barrier that must be overcome before releasing the CAPE in convective energy - is different compared to 23 June 2021. When looking at the number of gridpoints exceeding a specific CAPE threshold (
Considering the vertically integrated microphysical process rates and hydrometeor contents alone (Figure 9), a similar CCN dependency as on 23 June 2021 would be assumed. The warm rain formation processes of autoconversion and accretion decrease with increasing CCN concentrations (stronger the stronger the wind shear is), as does riming (weaker for the reduced shear cases), and deposition increases (smallest for reference shear, but similar for all other cases). The behavior of the process rates again leads to a decrease of tqr and tqg with increasing CCN load, while tqc increases. The only weak decrease in tqg fits with the weak decrease in riming. For tqh, the CCN dependency of the several shear cases is very different: for the reference case and the +25%-simulation, there is a clear decrease from maritime to continental conditions, however, then an increase to polluted conditions. In the +50%-simulation, there is a slight decrease, while in the −25%-simulation, the smallest tqh amount takes place in intermediate conditions. For further aerosol loading, more tqh can be observed in the simulations. For the −50%-simulation, there is generally an increase with CCN concentration, however, with the maximum value at continental conditions.
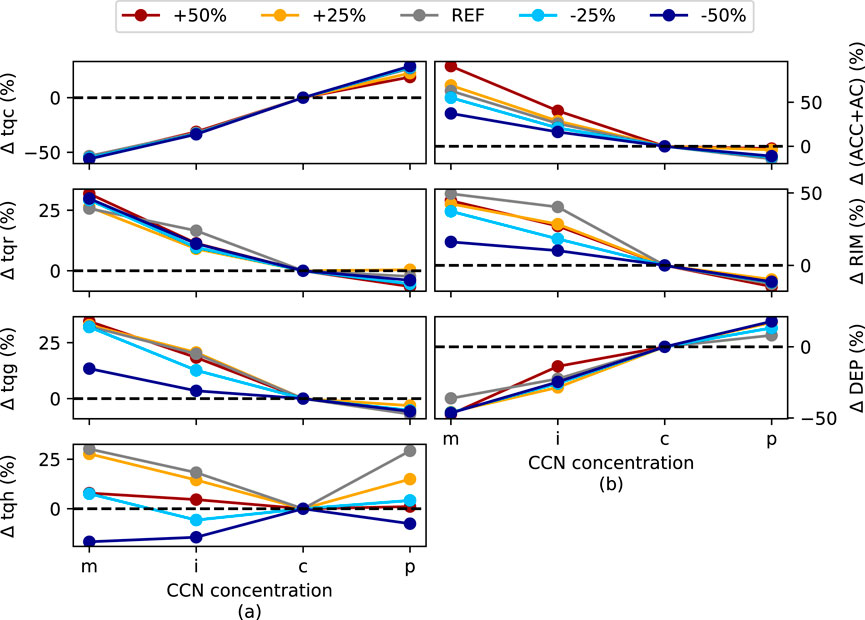
Figure 9. Percentage deviations from continental CCN concentration of spatio-temporal averages of (a) total cloud water (tqc), rain water (tqr), graupel (tqg), and hail (tqh), and of (b) the vertically integrated microphysical process rates accretion (ACC) and autoconversion (AC) together, where the latter one is the smaller contributor, riming (RIM), and deposition (DEP). Different colors indicate the different wind shear cases. All simulations were averaged over the DE-domain on 28 June 2021.
Despite the decrease of the spatio-temporal averages of the more dominant hydrometeor variables tqr and tqg in all simulations, it is visible from Figure 5b; Figure A1B that not for all shear cases the amount of precipitation is monotonically decreasing when the CCN concentration is increased. The most significant deviation occurs in the −50%-simulation, where even an increase is observed. It is also worth noting that the two simulations with reduced initial shear (−50% and −25%) are quite different in their CCN dependency on 28 June. Similar to 23 June 2021, the CCN dependency of the simulations is weaker than the shear dependency in most cases. Only the reference shear simulation has almost the same precipitation sum as the −25%-simulation for continental conditions, but changes a lot over the different CCN concentrations.
The reason for the different CCN dependency in the −50%-simulation compared to the other shear cases can be found in the earlier onset of precipitation, which is even earlier the lower the CCN concentration is (Figure 10a). Therefore, the mixed-layer CAPE is higher in the stronger polluted cases between 1,000 and 1600 UTC (not shown). This results in a higher precipitation rate in the late afternoon and evening in these simulations. For this reason, the lines in Figure 10b, indicating the accumulated precipitation sums in the simulations with different CCN concentrations, intersect slightly at about 1900 UTC for the continental conditions and at about 2100 UTC for the polluted conditions. The precipitation amount in the continental cases stays highest since the rate is similar to the one in polluted conditions later in the day. Thus, this simulation serves as an important case study, demonstrating that the precipitation dependency on different CCN concentrations can vary with the simulation period. When examining the CCN dependency at 18 h, it is almost inversely related to that at 24 h or also 30 h for this case of −50% initial wind shear.
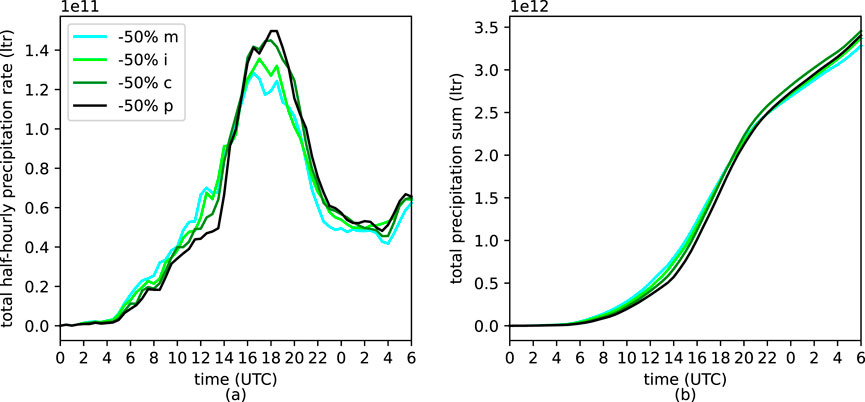
Figure 10. (a) Half-hourly precipitation rate and (b) accumulated precipitation sum inside the DE-domain on 28 June 2021, both figures for the −50%-simulations. Different colors indicate different CCN concentrations.
3.1.3 22 July 2015
Given the environmental conditions averaged over the whole of Germany (not shown), a result contrary to the actual one for precipitation totals on 22 July 2015 would have been expected: higher convective potential and also a higher share of grid points with low CIN values at the same time in the higher shear cases would lead to the assumption of more precipitation. However, the opposite is the case, and less precipitation occurs in these simulations. This is explainable by regional differences in the decisive variables CAPE and CIN. Most convective cells in all shear cases are formed in or close to the MOSES domain before they move toward other regions. Inside this area, the mixed-layer CAPE and also the share of grid points exceeding the CAPE and CIN thresholds are larger when the wind shear is smaller (Figure 11). This explains why more intense convective cells are initiated in these cases, leading to higher precipitation rates over the day (Figure 5d). This is then reflected in the higher precipitation sums (Figure 5a). Additionally, still relatively high precipitation rates in the last simulation hours further increase the precipitation sums of the decreased shear cases. However, this precipitation is no longer from distinct convective cells, but from stratiform precipitation areas.
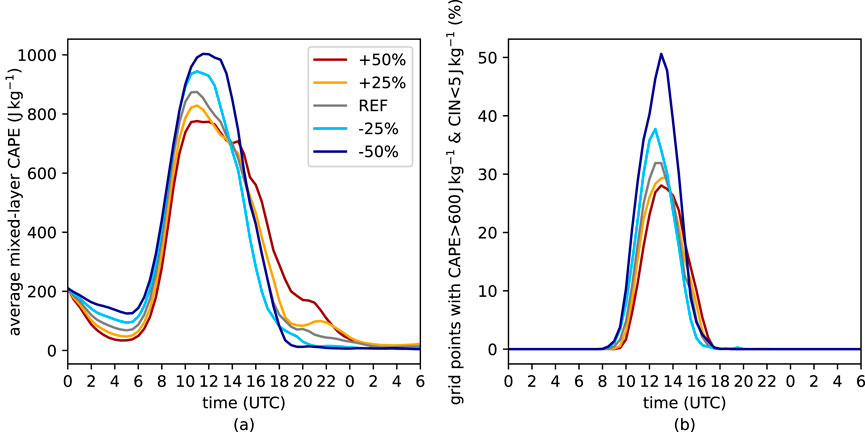
Figure 11. (a) Mixed-layer CAPE and (b) share of grid points with a mixed-layer CAPE larger than 600 J
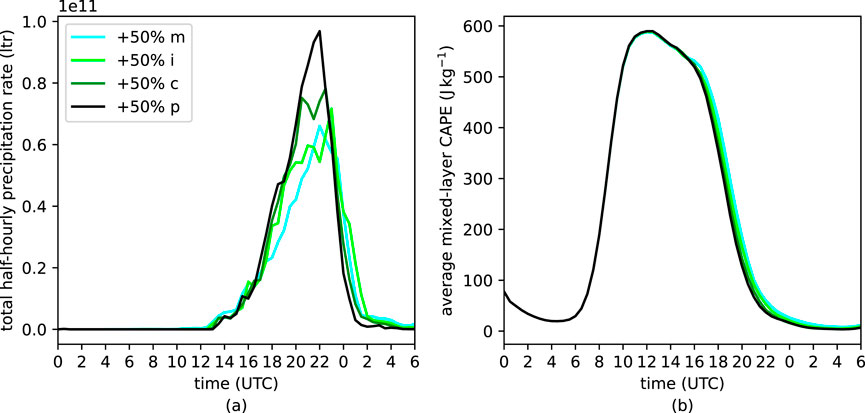
Figure 12. (a) Half-hourly precipitation rate and (b) averaged mixed-layer CAPE inside the DE-domain in the +50%-simulations on 22 July 2015. Different colors indicate different CCN concentrations.
Microphysical process rates and spatio-temporal averages of vertically integrated hydrometeors rain and graupel again show the same CCN dependency as on the other days (not shown). However, on this day, all shear cases show increasing precipitation amounts for higher CCN concentrations (as on the other days, not systematically dependent on the initial wind shear). The increase is not large in most cases, largest in the +50%-simulations. For this initial shear, a signal like that stated in the convective invigoration hypothesis proposed by Rosenfeld et al. (2008) can be observed. Even if very similar averaged maximum CAPE values take place, clearly higher precipitation rates occur for more pollution, and CAPE therefore goes down earlier (Figure 8). For the other shear cases, this effect is only faintly visible or not visible at all. In case of the −50%-simulation, the slight increase is more caused by an effect like described for 28 June 2021: For higher concentrations, a slightly earlier start of precipitation and higher rates lead to a stronger consumption of CAPE. In contrast, the simulations with lower concentrations have some more CAPE left later in the day, which can lead to higher convective precipitation rates. Thus, an intersection of the lines of the precipitation sums appears (not shown, but in a weakened form similar to Figure 8 on 28 June 2021).
The fact that tqr decreases with increasing CCN concentration, even if the rainfall at the surface increases, can be explained by a double maximum structure in the vertical profile of the rain water (not shown). Above 5 km, more rain water is in the simulations with low CCN concentrations. However, below this level, the trend tends to reverse because, in the case of high CCN concentrations, the invigorated convection has produced more ice hydrometeors. Consequently, a slightly higher 0°C level for several hours in the afternoon increases melting, resulting in more rain water in the lowest layers of the atmosphere for higher pollution. Only for maritime conditions, the rain water amount is still the largest at a height of 2 km but decreases strongly in the surface-near layers. The melting level height is generally clearly different on the third simulation day compared to the other two (not shown): On the first 2 days, there is a diurnal cycle in the melting level, on the third day, the melting level is in the early simulation hours very high and is lowering over the course of the day. The melting level, however, is the whole time clearly higher than on the other days. This may be influenced by a different general synoptic situation, causing an opposite result in CCN dependency.
3.1.4 Concluding remarks
The goal of the three real-case simulation days presented above was to investigate if the influence of wind shear and aerosols on convective precipitation is similar to that found in idealized simulations (e.g., Fan et al., 2009). However, the present study shows that the impact of wind shear on ACI and convective precipitation is case-dependent, different from those suggested by idealized simulations.
All simulations show that the convection potential increases with increasing shear. However, this does not lead to a systematic dependency of convective precipitation on the vertical wind shear, as it was shown that CIN or regional variations in the convection-relevant variables CAPE and CIN also play an important role.
The vertically integrated hydrometeor contents and microphysical process rates show a similar response to changing CCN concentrations. The warm rain processes of accretion and autoconversion and the cold rain process of riming decrease for increasing CCN concentrations on all simulation days, whereas depositional growth increases. The decrease in the warm rain processes and riming and the increase in deposition tend to be stronger the stronger the wind shear is. The hydrometeor process rates lead to decreasing amounts of tqg and tqr while tqc increases, and tqh is very case-dependent. However, similar behavior in microphysical process rates and hydrometeor contents on changing CCN concentrations does not result in a systematic dependency of the convective precipitation on the CCN concentration. In some simulations, the accumulated precipitation sum increases with increasing CCN concentrations; in others, it decreases. The magnitude of this decrease or increase for the changed CCN amount is not systematically dependent on the vertical wind shear. Important to note is that the CCN sensitivity was shown to be simulation period-dependent in some cases, which makes it difficult to make generally valid statements about the influence of CCN concentration on convective precipitation from the present results. In general, the vertical wind shear has a larger impact on the convective precipitation than the CCN concentration.
3.2 Effect of changing wind shear and CCN concentration on precipitation efficiency
Above, it was shown that the dependency of the precipitation generation processes autoconversion, accretion, deposition, and riming on the CCN concentration is similar on each of the three simulation days. Only the depositional growth increases with increasing CCN concentrations, and the others decrease. If the terms are summed up to a generation term

Figure 13. Relative change to the respective simulation with continental CCN concentration for precipitation efficiency (a,c,e) and generation terms (b,d,f) on the three simulation days (a and b) 23 June 2021 (c,d) 28 June 2021, and (e,f) 22 July 2015. The calculation is performed with 30-h precipitation totals and generation term values. Different colors indicate different shear cases. Note the different ranges on the y-axis.
The CCN sensitivity of precipitation was shown in the previous section, as well as a clear CCN dependency in the generation of precipitation particles. Therefore, the question arises as to how the precipitation varies in the different simulations in relation to the processes that generate the precipitation particles. For this purpose, the precipitation efficiency
It describes the relation between the precipitation amount
On the first simulation day, 23 June 2021, the actual values of
On 28 June 2021, the actual values of
On 22 July 2015, the actual values of
A monotonous increase with CCN concentration in precipitation efficiency was also shown in Baur et al. (2022). In the present study, it was observed across all simulated days that the greater the initial vertical wind shear is, the greater this increase tends to be. This is particularly interesting since the sensitivity of precipitation to changing aerosol loading was not systematically dependent on the wind shear.
4 Summary and conclusion
The goal of the present work was to study the impact of wind shear on aerosol-cloud interactions and convective precipitation. Therefore, 3 days with widespread convective activity were simulated with the ICON model at a horizontal resolution of 1 km. Simulations for each day were performed with four different CCN concentrations (maritime, intermediate, continental, and continental polluted) and five different wind shear cases (−50%, −25%, reference, +25%, +50%). From the output of these simulations, the following conclusions can be drawn.
The results of our real-case simulations are contrasted with idealized simulations such as those by Fan et al. (2009). Of course, there are differences between the present study and the study by Fan et al. (2009). Only four CCN concentrations are used in our study, which makes it hard to resolve a potential maximum in convective precipitation for weak wind shear cases, as it occurs in the cited study. In Fan et al. (2009), simulations were run for 3 h only. In contrast, convective days are simulated for 30 h in the present work. Since organized convective cells can last for more than 3 hours, and it was demonstrated in this study that the simulation period can impact the precipitation sensitivity to different CCN concentrations (by changes in precipitation intensities late in the day), this is an important difference in the methodology. However, our methodology also has a weakness in that we do not focus on individual convective cells and their development. Since individual cells develop in completely different areas over 30 h when initial conditions change, our results are mainly based on accumulations and averages over large domains.
The output of the real-case simulations in this study gives an overview of the overall atmospheric conditions, leading to variations in precipitation amounts. From the present work, it becomes clear that the impact of wind shear on ACI and convective precipitation is more individual than suggested from the idealized simulations in Fan et al. (2009). This makes it difficult to transfer the results to other days. There are patterns of the atmospheric conditions that occur on all 3 days and can be transferred. This is true for the uniform CCN dependencies of most hydrometeorological variables and microphysical process rates described above, which are also consistent with previous studies (e.g., Barthlott et al., 2022b). In addition, the convection potential is always greater when stronger shear occurs. However, these consistent results do not allow us to make a general statement about precipitation. The situation is different for precipitation efficiency: the increase in precipitation efficiency with increasing aerosol concentration already shown in Baur et al. (2022) was confirmed. A new result is that this increase in precipitation efficiency is larger the stronger the wind shear. This seems to be generally valid, but one must bear in mind that only 3 days were simulated, and the results could also be regionally and seasonally dependent. Overall, the findings of the present work demonstrate that the impact of wind shear on aerosol–cloud interactions and convective precipitation is complex, and previous results from idealized simulations cannot be transferred to realistic simulations.
Data availability statement
The raw data supporting the conclusions of this article will be made available by the authors, without undue reservation.
Author contributions
MT: Writing – original draft, Writing – review and editing, Data curation, Investigation, Methodology, Software, Visualization. CB: Writing – review and editing, Conceptualization, Data curation, Methodology, Software, Supervision. MK: Writing – review and editing, Methodology, Supervision. CH: Writing – review and editing, Conceptualization, Methodology, Supervision.
Funding
The author(s) declare that financial support was received for the research and/or publication of this article. This work has been funded by the Helmholtz program “Changing Earth – Sustaining our Future”.
Acknowledgments
The authors would like to express their sincere thanks to the German Weather Service (DWD) for providing the ICON model code, the initial and boundary data for 2 days, as well as RADOLAN data. Also, the authors want to thank the European Center for Medium-Range Weather Forecasts (ECMWF) for providing the initial and boundary data of the third simulation day. The authors gratefully acknowledge the computing time provided on the high-performance computer HoreKa by the National High-Performance Computing Center at KIT (NHR@KIT). This center is jointly supported by the Federal Ministry of Education and Research and the Ministry of Science, Research and the Arts of Baden-Württemberg, as part of the National High-Performance Computing (NHR) joint funding program (https://www.nhr-verein.de/en/our-partners). HoreKa is partly funded by the German Research Foundation (DFG). The authors acknowledge support by the state of Baden-Württemberg through bwHPC.
Conflict of interest
The authors declare that the research was conducted in the absence of any commercial or financial relationships that could be construed as a potential conflict of interest.
The author MK was an editorial board member of Frontiers, at the time of submission. This had no impact on the peer review process and the final decision.
The reviewer TK declared a past collaboration with the author CH to the handling editor.
Generative AI statement
The author(s) declare that no Generative AI was used in the creation of this manuscript.
Publisher’s note
All claims expressed in this article are solely those of the authors and do not necessarily represent those of their affiliated organizations, or those of the publisher, the editors and the reviewers. Any product that may be evaluated in this article, or claim that may be made by its manufacturer, is not guaranteed or endorsed by the publisher.
Footnotes
1Even if the term accretion is sometimes used as a synonym for riming, in the present paper it is used in the same way as in the ICON model code where it means the warm rain growth process of liquid rain droplets collecting cloud droplets.
References
Abbott, T. H., and Cronin, T. W. (2021). Aerosol invigoration of atmospheric convection through increases in humidity. Science 371, 83–85. doi:10.1126/science.abc5181
Albrecht, B. A. (1989). Aerosols, cloud microphysics, and fractional cloudiness. Science 245, 1227–1230. doi:10.1126/science.245.4923.1227
Altaratz, O., Koren, I., Reisin, T., Kostinski, A., Feingold, G., Levin, Z., et al. (2008). Aerosols’ influence on the interplay between condensation, evaporation and rain in warm cumulus cloud. Atmos. Chem. Phys. 8, 15–24. doi:10.5194/acp-8-15-2008
Altaratz, O., Koren, I., Remer, L., and Hirsch, E. (2014). Cloud invigoration by aerosols—coupling between microphysics and dynamics. Atmos. Res. 140, 38–60. doi:10.1016/j.atmosres.2014.01.009
Barthlott, C., Czajka, B., Kunz, M., Saathoff, H., Zhang, H., Böhmländer, A., et al. (2024). The impact of aerosols and model grid spacing on a supercell storm from swabian moses 2021. Q. J. R. Meteorological Soc. 150, 2005–2027. doi:10.1002/qj.4687
Barthlott, C., and Hoose, C. (2018). Aerosol effects on clouds and precipitation over central Europe in different weather regimes. J. Atmos. Sci. 75, 4247–4264. doi:10.1175/JAS-D-18-0110.1
Barthlott, C., Zarboo, A., Matsunobu, T., and Keil, C. (2022a). Impacts of combined microphysical and land-surface uncertainties on convective clouds and precipitation in different weather regimes. Atmos. Chem. Phys. 22, 10841–10860. doi:10.5194/acp-22-10841-2022
Barthlott, C., Zarboo, A., Matsunobu, T., and Keil, C. (2022b). Importance of aerosols and shape of the cloud droplet size distribution for convective clouds and precipitation. Atmos. Chem. Phys. 22, 2153–2172. doi:10.5194/acp-22-2153-2022
Bauer, P., Thorpe, A., and Brunet, G. (2015). The quiet revolution of numerical weather prediction. Nature 525, 47–55. doi:10.1038/nature14956
Baur, F., Keil, C., and Barthlott, C. (2022). Combined effects of soil moisture and microphysical perturbations on convective clouds and precipitation for a locally forced case over Central Europe. Q. J. R. Meteorological Soc. 148, 2132–2146. doi:10.1002/qj.4295
Brunet, G., Parsons, D. B., Ivanov, D., Lee, B., Bauer, P., Bernier, N. B., et al. (2023). Advancing weather and climate forecasting for our changing world. Bull. Am. Meteorological Soc. 104, E909–E927. doi:10.1175/.BAMS-D-21-0262.1
Buizza, R. (2018). “Ensemble forecasting and the need for calibration,” in Statistical postprocessing of ensemble forecasts (Elsevier), 15–48.
Bunkers, M. J., Barber, D. A., Thompson, R. L., Edwards, R., and Garner, J. (2014). Choosing a universal mean wind for supercell motion prediction. J. Operational Meteorology 2, 115–129. doi:10.15191/nwajom.2014.0211
Bunkers, M. J., Klimowski, B. A., Zeitler, J. W., Thompson, R. L., and Weisman, M. L. (2000). Predicting supercell motion using a new hodograph technique. Weather Forecast. 15, 61–79. doi:10.1175/1520-0434(2000)015<0061:psmuan>2.0.co;2
Cotton, W. R., and Walko, R. (2021). Examination of aerosol-induced convective invigoration using idealized simulations. J. Atmos. Sci. 78, 287–298. doi:10.1175/JAS-D-20-0023.1
Cui, Z., Davies, S., Carslaw, K., and Blyth, A. (2011). The response of precipitation to aerosol through riming and melting in deep convective clouds. Atmos. Chem. Phys. 11, 3495–3510. doi:10.5194/acp-11-3495-2011
Dagan, G., and Stier, P. (2020). Ensemble daily simulations for elucidating cloud–aerosol interactions under a large spread of realistic environmental conditions. Atmos. Chem. Phys. 20, 6291–6303. doi:10.5194/acp-20-6291-2020
DWD (2023). Radargestützte Analysen stündlicher Niederschlagshöhen im Echtzeitbetrieb für Deutschland (RADOLAN) und Mitteleuropa (RADOLAN-ME). Available online at: https://www.dwd.de/DE/leistungen/radolan/radarniederschlagsprodukte/radolankurzbeschreibung_pdf.pdf?__blob=publicationFile&v=8 (accessed on January 16, 2025).
Di Giuseppe, F., and Tompkins, A. M. (2015). Generalizing cloud overlap treatment to include the effect of wind shear. J. Atmos. Sci. 72, 2865–2876. doi:10.1175/JAS-D-14-0277.1
Doswell III, C. A. (1987). The distinction between large-scale and mesoscale contribution to severe convection: a case study example. Weather Forecast. 2, 3–16. doi:10.1175/1520-0434(1987)002<0003:tdblsa>2.0.co;2
Fan, J., Leung, L. R., Rosenfeld, D., Chen, Q., Li, Z., Zhang, J., et al. (2013). Microphysical effects determine macrophysical response for aerosol impacts on deep convective clouds. Proc. Natl. Acad. Sci. 110, E4581–E4590. doi:10.1073/pnas.1316830110
Fan, J., Rosenfeld, D., Ding, Y., Leung, L. R., and Li, Z. (2012). Potential aerosol indirect effects on atmospheric circulation and radiative forcing through deep convection. Geophys. Res. Lett. 39. doi:10.1029/2012GL051851
Fan, J., Rosenfeld, D., Zhang, Y., Giangrande, S. E., Li, Z., Machado, L. A., et al. (2018). Substantial convection and precipitation enhancements by ultrafine aerosol particles. Science 359, 411–418. doi:10.1126/science.aan8461
Fan, J., Wang, Y., Rosenfeld, D., and Liu, X. (2016). Review of aerosol–cloud interactions: mechanisms, significance, and challenges. J. Atmos. Sci. 73, 4221–4252. doi:10.1175/JAS-D-16-0037.1
Fan, J., Yuan, T., Comstock, J. M., Ghan, S., Khain, A., Leung, L. R., et al. (2009). Dominant role by vertical wind shear in regulating aerosol effects on deep convective clouds. J. Geophys. Res. Atmos. 114. doi:10.1029/2009JD012352
Gunn, R., and Phillips, B. (1957). An experimental investigation of the effect of air pollution on the initiation of rain. J. Atmos. Sci. 14, 272–280. doi:10.1175/1520-0469(1957)014<0272:aeiote>2.0.co;2
Hande, L., Engler, C., Hoose, C., and Tegen, I. (2015). Seasonal variability of Saharan desert dust and ice nucleating particles over Europe. Atmos. Chem. Phys. 15, 4389–4397. doi:10.5194/acp-15-4389-2015
Heise, E., Ritter, B., and Schrodin, R. (2006). Operational implementation of the multilayer soil model. Tech. Rep. 9. doi:10.5676/DWD_pub/nwv/cosmo-tr_9
Junghänel, T., Brendel, C., Winterrath, T., and Walter, A. (2016). Towards a radar-and observation-based hail climatology for Germany. Meteorol. Z 25, 435–445. doi:10.1127/metz/2016/0734
Kalina, E. A., Friedrich, K., Morrison, H., and Bryan, G. H. (2014). Aerosol effects on idealized supercell thunderstorms in different environments. J. Atmos. Sci. 71, 4558–4580. doi:10.1175/JAS-D-14-0037.1
Kärcher, B., Hendricks, J., and Lohmann, U. (2006). Physically based parameterization of cirrus cloud formation for use in global atmospheric models. J. Geophys. Res. Atmos. 111. doi:10.1029/2005JD006219
Kärcher, B., and Lohmann, U. (2002). A parameterization of cirrus cloud formation: homogeneous freezing of supercooled aerosols. J. Geophys. Res. Atmos. 107, 4–10. doi:10.1029/2001JD000470
Khain, A., BenMoshe, N., and Pokrovsky, A. (2008). Factors determining the impact of aerosols on surface precipitation from clouds: an attempt at classification. J. Atmos. Sci. 65, 1721–1748. doi:10.1175/2007JAS2515.1
Kirshbaum, D. J., Adler, B., Kalthoff, N., Barthlott, C., and Serafin, S. (2018). Moist orographic convection: physical mechanisms and links to surface-exchange processes. Atmosphere 9, 80. doi:10.3390/atmos9030080
Kohler, M., Kalthoff, N., and Kottmeier, C. (2010). The impact of soil moisture modifications on CBL characteristics in West Africa: a case-study from the AMMA campaign. Q. J. R. Meteorological Soc. 136, 442–455. doi:10.1002/qj.430
Kron, W., Löw, P., and Kundzewicz, Z. W. (2019). Changes in risk of extreme weather events in europe. Environ. Sci. and Policy 100, 74–83. doi:10.1016/j.envsci.2019.06.007
Kunz, M., Abbas, S. S., Bauckholt, M., Böhmländer, A., Feuerle, T., Gasch, P., et al. (2022). Swabian MOSES 2021: an interdisciplinary field campaign for investigating convective storms and their event chains. Front. Earth Sci. 10. doi:10.3389/feart.2022.999593
Kunz, M., Wandel, J., Fluck, E., Baumstark, S., Mohr, S., and Schemm, S. (2020). Ambient conditions prevailing during hail events in central europe. Nat. Hazards Earth Syst. Sci. 20, 1867–1887. doi:10.5194/nhess-20-1867-2020
Leuenberger, D., Koller, M., Fuhrer, O., and Schär, C. (2010). A generalization of the SLEVE vertical coordinate. Mon. Weather Rev. 138, 3683–3689. doi:10.1175/2010MWR3307.1
Magnusson, L., and Källén, E. (2013). Factors influencing skill improvements in the ecmwf forecasting system. Mon. Weather Rev. 141, 3142–3153. doi:10.1175/MWR-D-12-00318.1
Markowski, P., and Richardson, Y. (2010). Mesoscale meteorology in midlatitudes. Publication, Chichester, Vereinigtes Königreich: John Wiley and Sons, Ltd., 407.
Mlawer, E. J., Taubman, S. J., Brown, P. D., Iacono, M. J., and Clough, S. A. (1997). Radiative transfer for inhomogeneous atmospheres: RRTM, a validated correlated-k model for the longwave. J. Geophys. Res. Atmos. 102, 16663–16682. doi:10.1029/97JD00237
Mulholland, J. P., Nowotarski, C. J., Peters, J. M., Morrison, H., and Nielsen, E. R. (2024). How does vertical wind shear influence updraft characteristics and hydrometeor distributions in supercell thunderstorms? Mon. Weather Rev. 152, 1663–1687. doi:10.1175/MWR-D-23-0166.1
Noppel, H., Blahak, U., Seifert, A., and Beheng, K. D. (2010). Simulations of a hailstorm and the impact of ccn using an advanced two-moment cloud microphysical scheme. Atmos. Res. 96, 286–301. doi:10.1016/j.atmosres.2009.09.008
Öktem, R., Romps, D. M., and Varble, A. C. (2023). No warm-phase invigoration of convection detected during GoAmazon. J. Atmos. Sci. 80, 2345–2364. doi:10.1175/JAS-D-22-0241.1
Pacey, G., Pfahl, S., Schielicke, L., and Wapler, K. (2023). The climatology and nature of warm-season convective cells in cold-frontal environments over Germany. Nat. Hazards Earth Syst. Sci. Discuss. 2023, 3703–3721. doi:10.5194/nhess-23-3703-2023
Piper, D., and Kunz, M. (2017). Spatiotemporal variability of lightning activity in europe and the relation to the north atlantic oscillation teleconnection pattern. Nat. Hazards Earth Syst. Sci. 17, 1319–1336. doi:10.5194/.nhess-17-1319-2017
Piper, D. A., Kunz, M., Allen, J. T., and Mohr, S. (2019). Investigation of the temporal variability of thunderstorms in central and western europe and the relation to large-scale flow and teleconnection patterns. Q. J. R. Meteorological Soc. 145, 3644–3666. doi:10.1002/qj.3647
Púčik, T., Castellano, C., Groenemeijer, P., Kühne, T., Rädler, A. T., Antonescu, B., et al. (2019). Large hail incidence and its economic and societal impacts across europe. Mon. Weather Rev. 147, 3901–3916. doi:10.1175/.MWR-D-19-0204.1
Puskeiler, M., Kunz, M., and Schmidberger, M. (2016). Hail statistics for Germany derived from single-polarization radar data. Atmos. Res. 178, 459–470. doi:10.1016/j.atmosres.2016.04.014
Raschendorfer, M. (2001). The new turbulence parameterization of LM. COSMO-Newsletter. Available online at: http://www.cosmo-model.org/content/model/documentation/newsLetters/newsLetter01/newsLetter_01.pdf.
Rosenfeld, D., and Lensky, I. M. (1998). Satellite-based insights into precipitation formation processes in continental and maritime convective clouds. Bull. Am. Meteorological Soc. 79, 2457–2476. doi:10.1175/1520-0477(1998)079<2457:sbiipf>2.0.co;2
Rosenfeld, D., Lohmann, U., Raga, G. B., O’Dowd, C. D., Kulmala, M., Fuzzi, S., et al. (2008). Flood or drought: how do aerosols affect precipitation? Science 321, 1309–1313. doi:10.1126/science.1160606
Schmidberger, M. (2018). Hagelgefährdung und Hagelrisiko in Deutschland basierend auf einer Kombination von Radardaten und Versicherungsdaten, vol. 78 of Wissenschaftliche Berichte des Instituts für Meteorologie und Klimaforschung des Karlsruher Instituts für Technologie (KIT). Karlsruhe, Deutschland: KIT Scientific Publishing, 258. doi:10.5445/KSP.1000086012
Schneider, L., Barthlott, C., Hoose, C., and Barrett, A. I. (2019). Relative impact of aerosol, soil moisture, and orography perturbations on deep convection. Atmos. Chem. Phys. 19, 12343–12359. doi:10.5194/acp-19-12343-2019
Segal, Y., and Khain, A. (2006). Dependence of droplet concentration on aerosol conditions in different cloud types: application to droplet concentration parameterization of aerosol conditions. J. Geophys. Res. Atmos. 111. doi:10.1029/2005JD006561
Seifert, A., and Beheng, K. D. (2006). A two-moment cloud microphysics parameterization for mixed-phase clouds. Part 1: model description. Meteorology Atmos. Phys. 92, 45–66. doi:10.1007/s00703-005-0112-4
Seifert, A., Köhler, C., and Beheng, K. (2012). Aerosol-cloud-precipitation effects over Germany as simulated by a convective-scale numerical weather prediction model. Atmos. Chem. Phys. 12, 709–725. doi:10.5194/.acp-12-709-2012
Stier, P., van den Heever, S. C., Christensen, M. W., Gryspeerdt, E., Dagan, G., Saleeby, S. M., et al. (2024). Multifaceted aerosol effects on precipitation. Nat. Geosci. 17, 719–732. doi:10.1038/s41561-024-01482-6
Storer, R. L., Van Den Heever, S. C., and Stephens, G. L. (2010). Modeling aerosol impacts on convective storms in different environments. J. Atmos. Sci. 67, 3904–3915. doi:10.1175/2010JAS3363.1
Sulak, A. M., Calabrase, W. J., Ryan, S. D., and Heus, T. (2020). The contributions of shear and turbulence to cloud overlap for cumulus clouds. J. Geophys. Res. Atmos. 125, e2019JD032017. doi:10.1029/2019JD032017
Tao, W.-K., Li, X., Khain, A., Matsui, T., Lang, S., and Simpson, J. (2007). Role of atmospheric aerosol concentration on deep convective precipitation: cloud-resolving model simulations. J. Geophys. Res. Atmos. 112. doi:10.1029/2007JD008728
Tonn, M., Wilhelm, J., and Kunz, M. (2023). Evaluating Bunkers’ storm motion of hail-producing supercells and their storm-relative helicity in Germany. Meteorol. Z. 32, 229–243. doi:10.1127/metz/2023/1165
Trapp, R. J. (2013). Mesoscale-convective processes in the atmosphere. Cambridge, Vereinigtes Königreich: Cambridge University Press, 346. doi:10.1017/CBO9781139047241
Twomey, S. (1977). The influence of pollution on the shortwave albedo of clouds. J. Atmos. Sci. 34, 1149–1152. doi:10.1175/1520-0469(1977)034<1149:tiopot>2.0.co;2
Wapler, K., and James, P. (2015). Thunderstorm occurrence and characteristics in central europe under different synoptic conditions. Atmos. Res. 158, 231–244. doi:10.1016/j.atmosres.2014.07.011
Wilhelm, J., Mohr, S., Punge, H. J., Mühr, B., Schmidberger, M., Daniell, J. E., et al. (2021). Severe thunderstorms with large hail across Germany in june 2019. Weather 76, 228–237. doi:10.1002/wea.3886
Wilhelm, J., Wapler, K., Blahak, U., Potthast, R., and Kunz, M. (2023). Statistical relevance of meteorological ambient conditions and cell attributes for nowcasting the life cycle of convective storms. Q. J. R. Meteorological Soc. 149, 2252–2280. doi:10.1002/qj.4505
Zängl, G., Reinert, D., Rípodas, P., and Baldauf, M. (2015). The icon (icosahedral non-hydrostatic) modelling framework of dwd and mpi-m: description of the non-hydrostatic dynamical core. Q. J. R. Meteorological Soc. 141, 563–579. doi:10.1002/qj.2378
Appendix A
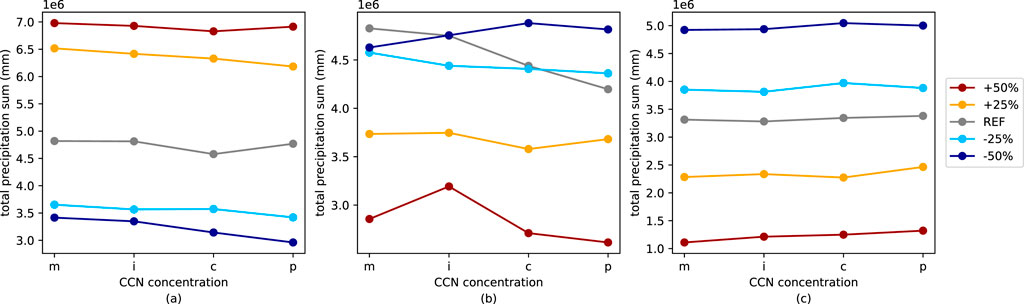
FIGURE A1. Total precipitation sum over the entire DE-domain on (a) 23 June 2021, (b) 28 June 2021, and (c) 22 July 2015 for different initial wind shear (indicated by different colors) and different CCN concentrations.
Keywords: convective storms, real-case simulations, wind shear impact, convective precipitation, aerosol-cloud interactions
Citation: Tonn M, Barthlott C, Kunz M and Hoose C (2025) Impact of wind shear on aerosol–cloud interactions and convective precipitation. Front. Environ. Sci. 13:1566365. doi: 10.3389/fenvs.2025.1566365
Received: 24 January 2025; Accepted: 12 May 2025;
Published: 30 May 2025.
Edited by:
Devaraju Narayanappa, CSC - IT Center for Science, FinlandReviewed by:
Jianfeng Li, Pacific Northwest National Laboratory (DOE), United StatesTheresa Kiszler, CSC - IT Center for Science, Finland
Copyright © 2025 Tonn, Barthlott, Kunz and Hoose. This is an open-access article distributed under the terms of the Creative Commons Attribution License (CC BY). The use, distribution or reproduction in other forums is permitted, provided the original author(s) and the copyright owner(s) are credited and that the original publication in this journal is cited, in accordance with accepted academic practice. No use, distribution or reproduction is permitted which does not comply with these terms.
*Correspondence: Mathis Tonn, bWF0aGlzLnRvbm5Aa2l0LmVkdQ==