 Graeme Troxell
 Steve Conrad
 Reuven Sussman
- 1Department of Systems Engineering, Blue-Green Decision Lab, Colorado State University, Fort Collins, CO, United States
- 2Behavior, Health and Human Dimensions Program, American Council for an Energy-Efficient Economy, Washington, DC, United States
Introduction: The transition to clean heating systems in rental housing is crucial for achieving net-zero emissions goals, yet current policy frameworks lack systematic understanding of how renter preferences vary across different market contexts. While existing research acknowledges split incentive barriers between landlords and tenants, analysis of their manifestation across diverse demographic groups and market conditions remains notably absent.
Methods: This study employs latent class analysis of discrete choice experiment data from the American Council for an Energy-Efficient Economy to identify distinct renter segments and their responses to energy-efficient rental options. Our study combines demographic analysis with market valuation techniques to examine how renter segments distribute across three diverse metropolitan areas—San Diego, Houston, and Durham.
Results: The analysis identifies six differentiated renter classes, characterized by systematic variation in demographic factors, housing preferences, and economic indicators. We find that while initial return multipliers exhibit significant sensitivity to assumptions about rent and energy cost differentials, the financial burden for energy-inefficient rentals is considerably larger than the premium one might pay for efficient rentals (presenting a penalty-to-premium of 1.35–1.42). The proportion of housing costs captured by landlords versus utilities varies significantly by market, increasing from 78.4% to 87.1% in San Diego, 74.9%–89.1% in Houston, and 88.5%–94.1% in Durham as properties move from poor to high efficiency, highlighting how regional characteristics shape the distribution of improvement costs between landlords and tenants.
Discussion: The study demonstrates how demographic composition systematically influences clean heating transition opportunities across rental markets, provides empirical evidence of geographic variation in renter segment distribution, and quantifies market-specific responses to efficiency improvements. These findings also underscore a market asymmetry that can impede extensive energy retrofits and enable policymakers to develop targeted approaches for accelerating clean heating adoption while maintaining affordability across diverse renter populations.
1 Introduction
The transformation and upgrading of residential energy systems constitutes a critical component of achieving net-zero emissions targets. In the United States, residential properties account for over 20% of total carbon dioxide emissions, with single-family homes generating approximately 12 tons annually per household (EIA, 2015). Although significant attention has focused on owner-occupied housing, the rental sector - comprising 37% of U.S. residential stock - remains notably underserved by existing energy efficiency policies and programs (Malekpour Koupaei and Cetin, 2021; Im et al., 2017). This gap is particularly concerning given evidence that rental properties tend to have fewer energy-efficient features compared to owner-occupied homes, resulting in missed savings of $200–400 annually for lower-income renters (Pivo, 2014).
The persistence of this energy efficiency gap in rental housing stems largely from the well-documented split incentive problem between landlords and tenants (Bird and Hernández, 2012; Nie et al., 2020; MacAskill et al., 2021; Reames, 2021). Property owners face limited financial motivation to invest in energy-efficient upgrades since the benefits, primarily through lower utility bills, typically accrue to tenants (Farsi, 2010; Gillingham et al., 2012; Wrigley and Crawford, 2015; Carroll et al., 2016). This misalignment of incentives is further complicated by information asymmetries and power imbalances between landlords and tenants that make it difficult for renters to effectively advocate for improvements (Collins and Curtis, 2018; Melvin, 2018). Recent research has shown these barriers contribute to systematically lower adoption of efficient technologies in rental properties, with renters more likely than homeowners to have less efficient electric appliances and heating systems (Davis, 2024).
While existing research acknowledges these market failures, systematic analysis of how split incentive barriers manifest across diverse demographic groups and market conditions remains notably absent. Understanding these patterns is crucial because factors such as income, education, age, and household composition significantly shape renters’ housing preferences and constraints. Lower-income households may focus primarily on immediate affordability rather than long-term energy costs, while those with greater financial security might have more flexibility to prioritize efficiency. These socio-economic factors can also affect access to information about energy efficiency benefits and ability to act on that information.
The need to understand heterogenous preferences across rental markets is particularly crucial for developing effective localized policy interventions. While national and state-level frameworks provide important guidelines for clean heating transitions, the success of specific programs often depends on their alignment with local conditions and stated preferences. For instance, localized assessment of individual preferences may demonstrate greater system performance with less accepted policies (Rogers et al., 2008; Conrad and Yates, 2018). Previous research has demonstrated that failing to account for preference heterogeneity can lead to policy misalignment, where well-intentioned interventions fail to generate anticipated adoption rates or produce uneven distributional impacts across different renter (Collins and Curtis, 2018; Lang et al., 2022). This geographical variation in preferences and constraints becomes especially relevant when considering that energy efficiency improvements often require significant upfront investments from landlords, whose willingness to undertake such investments may vary systematically with local market conditions and tenant demographics (Marmolejo-Duarte and Chen, 2019). Understanding these nuanced patterns of preference heterogeneity can help policymakers develop more targeted and effective approaches that account for both the economic and behavioral factors influencing clean heating adoption across diverse urban contexts.
The objectives of this research are twofold. First, we aim to investigate how three key factors—regional climate characteristics, demographic patterns, and market conditions—shape renters’ preferences and willingness-to-pay for energy efficiency improvements, measured through return multipliers that quantify the expected increase in monthly rental value when upgrading between different efficiency tiers. Understanding these preferences is crucial because our analysis reveals that although initial return multipliers (i.e., upgrading from Home Energy Score of 2 to Home Energy Score of 5) are highly sensitive to assumptions about rent and energy cost differentials, secondary return multipliers (i.e., upgrading from Home Energy Score of 5 to Home Energy Score of 8) exhibit consistent patterns across diverse markets, with ratios between secondary and initial returns remaining stable within a narrow range of 1.15–1.17 in regions with more stable climates. Second, we seek to translate these insights into actionable policy recommendations by developing a decision-support tool that aids energy efficiency policy reforms through estimating the distributional impacts of interventions across these three dimensions.
This study contributes to existing literature by providing systematic evidence of how demographic composition influences clean heating transition opportunities across rental markets, quantifying geographic variation in renter segment distribution, and measuring market-specific responses to more efficient rental units. These findings enable policymakers to develop targeted approaches for accelerating clean heating adoption while maintaining affordability across diverse renter populations. The following sections present our analytical framework, empirical findings, and resulting policy implications for addressing the persistent energy efficiency gap in rental housing markets.
2 Methods
2.1 Discrete choice experiment
We analyzed data from a discrete choice experiment (DCE) conducted by researchers at the American Council for an Energy-Efficient Economy (ACEEE), as detailed in their May 2022 report “Energy Labels Affect Behavior on Rental Listing Websites: A Controlled Experiment” (Sussman et al., 2022). The original study focused on the impact of energy labels and this study leverages the underlying choice data to examine demographic drivers of renter preferences for energy efficiency.
The DCE included a nationally representative sample of 2,455 current U.S. renters, recruited through survey panels with quota sampling to ensure demographic representativeness across age, income, race, and geographic region (Sussman et al., 2022). While the final sample showed slight deviations in educational attainment (underrepresenting those with less than high school education and overrepresenting those with bachelor’s degrees), it remained broadly reflective of the U.S. renter population.
The DCE design was optimized to mirror real-world rental decision-making. Prior to viewing the choice sets, participants specified their preferences for key housing criteria (property type, desired number of bedrooms, and target rent range). These inputs were used to customize the choice scenarios, enhancing the realism and relevance of the experiment. Participants were shown six sets of three rental listings (Sussman et al., 2022). In each set, they chose the rental unit they thought they would most prefer living in. An example task is shown in Figure 1.

Figure 1. Example choice set from original choice experiment conducted by Sussman et al. (2022).
The rental listings were characterized by six attributes identified through analysis of real estate listing data as the most salient factors in rental housing decisions:
• Property photo
• Monthly rent
• Number of bedrooms
• Number of bathrooms
• Square footage
• Energy efficiency information
The choice experiment approach is grounded in Lancaster’s attribute theory of value and consumer choice (Lancaster, 1966) and has an econometric foundation in random utility theory (Mcfadden, 1973). Lancaster holds that consumers derive satisfaction from the attributes contained in a good. Thus, for a rental choice it is assumed that the total utility that renter obtains from the purchase is the sum of the utility obtained from each of the rental property’s attributes. Random utility theory posits that choices can be modeled as a function of the attributes of the alternatives given, as shown in Equation 1 (Mcfadden, 1973; Train, 2009). It is assumed that an individual selects the alternative (i) that has the greatest overall utility and that each attribute contributes to a part of the compound utility of the alternative. This type of selection of compound part-worth utilities (ai = ai1,…, ain) indicates that the overall utility (Ui) of the alternative chosen is greater than the utility of the other alternatives. The higher the part-worth the higher the impact the attribute has on overall utility. The total utility of the alternative (Ui) can be represented with a deterministic component (V(ai)) and stochastic (error) component (ℇi):
An alternative (i) is chosen over alternative (j) if and only if Ui > Uj for all of j and i. The probability of choosing i over j can be calculated as shown in Equation 2.
To examine how different presentations of energy efficiency information influence renter choices, the original study employed a between-subjects design with seven experimental conditions. Each condition used identical listings but varied in how energy efficiency information was displayed, with one control group receiving no energy information. This design enables us to isolate the impact of energy efficiency labeling while controlling for other housing attributes.
The ACEEE study prepared a random utility framework to estimate renters’ willingness-to-pay for energy efficiency improvements. Our present research builds on these willingness-to-pay estimates by examining how preferences systematically vary across demographic groups through novel latent class analysis and market valuation analysis.
2.2 Latent class analysis (LCA)
To systematically analyze how demographic and socioeconomic factors influence renters’ willingness-to-pay for energy efficiency, we employed Latent Class Analysis using Latent Gold 6.0. LCA represents an extension of the traditional multinomial logit model that enables examination of preference heterogeneity through a mixed logit form (Train, 2009). This approach assumes the sample population comprises a finite number of relatively homogeneous but unobserved (latent) classes, with preferences that are homogeneous within classes but heterogeneous between them (Boxall and Adamowicz, 2002).
Under the latent class framework as expressed in Equation 3, the probability P of individual i choosing alternative j can be expressed as conditional on membership in class y:
Where
In implementing the LCA, we excluded two experimental conditions from the ACEEE dataset: the control group (which received no energy efficiency information) and an additional condition where the presentation of energy information was ambiguous. Using the remaining data, we identified six distinct latent classes of renters, each characterized by unique combinations of demographics, housing conditions, and willingness-to-pay for energy efficiency improvements. The latent class model is available as Supplementary Material S1 to this study.
The statistical fit of our Latent Class model was strong, validating our segmentation approach. The dissimilarity index of 0.9770 indicates well-separated classes with minimal overlap, while the entropy R-squared value of 0.6335 confirms that the model effectively captured the underlying heterogeneity in renters’ preferences. These fit statistics suggest that our six-class solution provides a robust foundation for understanding how different renter segments value energy efficiency and for developing targeted policy recommendations.
The latent classes were used to estimate class membership probabilities for each case study city based on demographic and housing characteristics available in U.S. Census data. This step enables us to estimate the distribution of renter classes across different geographic areas, informing the development of our market valuation analysis. By linking class membership to observable characteristics, we create a bridge between our experimental findings and real-world policy implications.
2.3 Market response analysis framework
2.3.1 Market-level impact estimation
Our analytical approach transforms individual willingness-to-pay (WTP) estimates into population-level market impacts through a comprehensive methodology that prioritizes regional demographic characteristics over individual-level data. This transformation enables analysis of both absolute market responses and relative patterns, such as the relationship between penalties for poor efficiency and premiums for improvements. The model specifically examines these relationships through the lens of three key dimensions: climate conditions, demographic patterns, and market structures.
The foundation of our market-level estimation framework rests on the characterization of regional populations through demographic proportions, including household size and income levels. Rather than relying on individual covariates, the model employs population-level percentages to capture the broader market dynamics. These proportions serve as weights in calculating class membership probabilities across the region, following Equation 4:
This calculation ensures that class membership predictions reflect the actual demographic distribution within each metropolitan area. Building on these class membership probabilities, the model estimates regional willingness-to-pay for different energy efficiency levels. For each effciency level m, the expected population-level WTP is calculated as shown in Equation 5,
which aggregates class-specific WTP values
The aggregated WTP values allow us to examine the direct value gains associated with energy efficiency improvements. These are assessed for Home Energy Score (HES) improvements across two key transitions included in the original choice experiment: from level 2 to 5 and from level 5 to 8. The calculations account for variations in local housing market conditions, providing insight into how different markets value efficiency improvements relative to baseline conditions. This approach reveals both absolute valuations and relative patterns in how markets respond to efficiency gains.
2.4 Case study cities
To validate and demonstrate our model’s applicability across diverse market conditions, we selected three metropolitan areas representing distinct combinations of climate conditions and market characteristics. These cities—San Diego, Houston, and Durham—provide a robust test of the model’s ability to account for regional variation while offering insights into how local conditions influence energy efficiency intervention outcomes.
San Diego, ranking 13th on the 2024 ACEEE clean energy scorecard (Samarripas et al., 2024), represents a high-cost housing market in a marine climate zone. The city’s moderate heating and cooling demands create a distinctive environment for studying energy efficiency improvements in rental properties. The marine climate zone creates unique opportunities and challenges for energy efficiency upgrades, particularly in the rental sector where split incentives between landlords and tenants often complicate improvement decisions.
Houston, positioned at 34th on the ACEEE scorecard (Samarripas et al., 2024), offers a contrasting example of a moderate-cost market in a hot-humid climate zone with substantial cooling demands. Houston’s climate conditions create distinct imperatives for energy efficiency improvements, although its rental market structure and demographic composition present different challenges and opportunities compared to San Diego’s market environment.
Durham, ranked 67th (Samarripas et al., 2024), rounds out our case studies by providing perspective from a lower-cost market in a mixed-humid climate zone. The city’s varied heating and cooling demands create a distinct context for understanding how energy efficiency improvements might be valued and implemented in a market with different cost pressures than either San Diego or Houston.
These three cities were specifically selected to represent variation across key dimensions affecting energy efficiency upgrade potential: climate zones, market conditions, and cost of living. This diversity enables examination of how different combinations of factors influence the effectiveness and market impact of energy efficiency interventions, providing valuable insights for policy design across varied urban contexts.
2.5 Sensitivity analysis
To assess the robustness of our market response findings and account for uncertainty in WTP estimates across different Home Energy Score (HES) levels, we first estimated the standard errors for WTP for each latent class using the Delta method (Equation 6),
where
Here,
For each HES level (2, 5, and 8), we calculated weighted standard errors that incorporate both within-class variation and uncertainty in class membership probabilities. This approach yielded standard errors of 54.29 for HES 2, 18.35 for HES 5, and 54.72 for HES 8, revealing important patterns in the precision of our estimates across efficiency levels. The notably smaller standard error for HES 5 suggests greater precision in estimating WTP for moderate efficiency levels, while the larger standard errors for both HES 2 and HES 8 indicate more uncertainty in valuing extremes of energy performance.
Using these weighted standard errors, we constructed 95% confidence intervals for WTP estimates at each HES level. These confidence intervals provide a systematic framework for understanding the range of plausible market responses to energy efficiency differences, accounting for both sampling variability and heterogeneity in renter preferences. By examining these confidence intervals across our three case study cities, we can assess how the precision of WTP estimates varies with market conditions while maintaining statistical rigor that grounds our comparisons.
In parallel with our WTP analysis, we examined the sensitivity of market responses to varying assumptions about energy cost differentials across efficiency levels, as shown in Table 1. Energy Penalty and Premium Scenarios per Home Energy Score. We modeled three scenarios representing different intensities of energy performance impacts: a conservative case assuming 5% cost changes per HES point (±15% from baseline), a base case with 7% changes (±21%), and an aggressive case with 10% changes (±30%). This systematic variation in the energy cost-performance relationship, combined with our WTP confidence intervals, provides a foundation for understanding how market responses vary under different assumptions about both willingness-to-pay and actual cost differentials across efficiency levels.

Table 1. Energy penalty and premium scenarios per home energy score.
This statistical approach to sensitivity analysis directly quantifies uncertainty in our estimates while accounting for the complex structure of latent class analysis. The resulting combined scenarios energy, willingness-to-pay, and Home Energy Score scenarios provide policymakers with clear metrics for assessing the reliability of market response estimates across different efficiency levels and market contexts.
3 Results
The results of our analysis unfold in three stages. First, we identify and characterize six distinct classes of rental market participants that emerged from the latent class analysis of the discrete choice experiment data, examining how demographic characteristics, housing preferences, and economic indicators systematically vary across these segments. We then analyze how the demographic composition and rental market characteristics of San Diego, Houston, and Durham influence class membership probabilities within each metropolitan area. Finally, we examine how these regionally specific class distributions, combined with local climate conditions and market structures, generate distinct patterns in the valuation and capitalization of energy efficiency improvements. This progression allows us to trace how underlying demographic patterns manifest in market-level responses to efficiency interventions while accounting for local conditions that may amplify or dampen these effects.
3.1 Renter segment characteristics
Our analysis revealed six distinct classes of renters whose responses to energy efficiency interventions vary systematically with climate conditions, demographic characteristics, and market factors. Understanding these segments and their geographic distribution is crucial for calibrating clean heating reforms to local conditions. Figure 2 below shows utility graphs for covariates Household Size, Housing Type, Employment, Income, and Energy Burden.
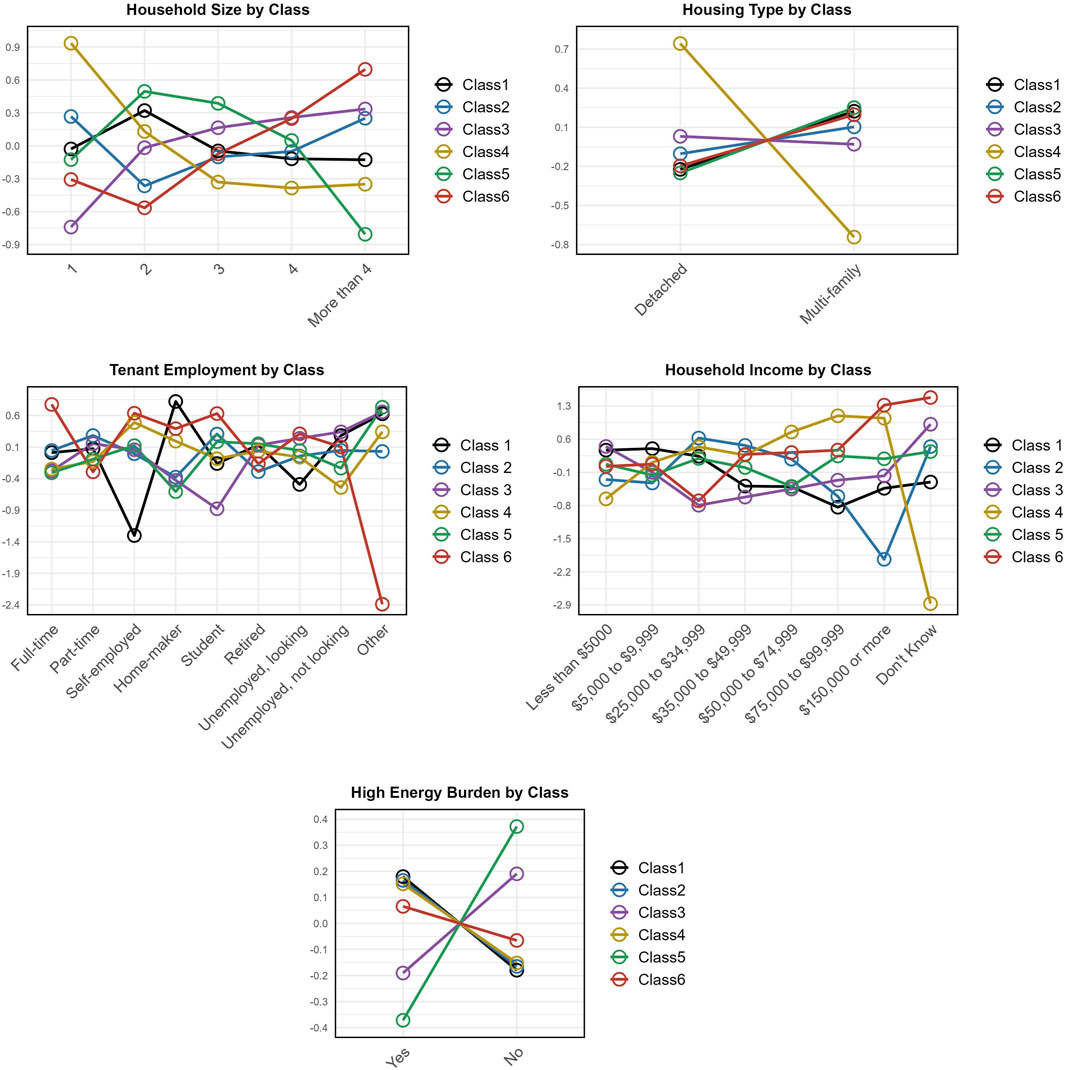
Figure 2. Utility graphs of key renter segment characteristics: Household Size, Housing Type, Tenant Employment, Household Income, and High Energy Burden.
3.1.1 Class 1: mixed-housing small households with mixed incomes
This large segment (24.57%) is characterized by two-person households (β = 0.3215) showing clear preference for multi-family over detached housing (β = 0.2231 for multi-family, β = −0.2231 for detached). Employment patterns distinguish the class, with strong positive association with homemaker status (β = 0.8219) and negative association with self-employment (β = −1.3006). The income distribution spans both low and middle brackets, with positive associations for lower income ranges ($5,000-$9,999: β = 0.6746) and negative associations with higher brackets ($75,000-$99,999: β = −0.8359). Despite assumptions often made about rental patterns, this segment shows moderate rather than high energy burden (β = 0.1797), suggesting relative stability in their housing costs.
3.1.2 Class 2: urban single-person households with lower incomes
The data reveals this segment (19.02%) as predominantly single-person households (β = 0.2673) with a slight preference for multi-family housing (β = 0.1031). They show significant association with low-income status (β = 0.3312) and positive associations with lower income brackets ($10,000-$14,999: β = 0.8752). Employment patterns show moderate positive associations with part-time employment (β = 0.2827) and student status (β = 0.3061). The class demonstrates modest energy burden (β = 0.1650), suggesting some vulnerability to energy costs.
3.1.3 Class 3: larger households with mixed economic status
The segment (18.33%) shows a strong negative association with single-person households (β = −0.7408) and positive associations with larger household sizes (β = 0.2578 for 4-person, β = 0.3358 for 4+ person households). Housing type preferences are minimal (β = 0.0303 for detached), suggesting other factors drive their housing decisions. Income patterns show positive associations with both very low income ranges ($5,000-$9,999: β = 0.4375) and uncertainty about income (“Don’t Know”: β = 0.9157), indicating economic diversity. Notably, this segment shows negative association with energy burden (β = −0.1904), suggesting they may manage energy costs effectively despite larger household sizes.
3.1.4 Class 4: high-income single occupants in detached housing
This segment (18.11%) shows the strongest association with single-person households (β = 0.9352) and demonstrates the most pronounced preference for detached housing (β = 0.7431) among all classes. Income patterns reveal strong positive associations with higher income brackets ($75,000-$99,999: β = 1.0936, $150,000 or more: β = 1.0429). Employment characteristics show notable association with self-employment (β = 0.4897). The class exhibits positive association with energy burden (β = 0.1521), though this may reflect higher overall energy consumption rather than financial strain given their income levels.
3.1.5 Class 5: small multi-family households with low energy burden
This class (14.12%) shows strong positive association with two-person households (β = 0.496) and negative association with larger households (β = −0.8064 for 4+ persons). They demonstrate clear preference for multi-family housing (β = 0.2509). Income patterns show mixed effects, with notably negative association with very low incomes ($5,000-$9,999: β = −1.2408). Most distinctively, this segment shows the strongest negative association with energy burden (β = −0.3719) among all classes.
3.1.6 Class 6: larger households with stable employment
This segment, though smallest in size (5.85%), shows several distinctive characteristics. These households show strong association with larger household sizes (β = 0.6969 for 4+ persons), and a slight preference for multi-family housing (β = 0.1963). Income patterns for this class demonstrate association with the highest income tiers (β = 1.3208 for $100,000 to $149,000, β = 1.3183 for $150,000 or more), and also the strongest association with full-time employment (β = 0.7753) of all the classes, suggesting stable employment. Despite this financial stability, the segment shows a nominal positive association with high energy burden (β = 0.0654), which may be a reflection of higher income brackets clustering in high cost-of-living areas.
These class profiles emerge from our latent class analysis, which reveals systematic patterns in how demographic factors, housing characteristics, and energy consumption behaviors intersect to create distinct renter segments. The following sections present the statistically significant relationships identified through this analysis, quantifying the demographic composition, housing preferences, economic indicators, and energy burden distributions that characterize each segment. These empirical patterns provide an insightful backdrop for developing targeted clean heating policies that account for heterogeneous renter characteristics and market conditions.
3.1.7 Primary demographic patterns
Our analysis reveals several statistically significant demographic patterns across segments. In Class 1, there is a notable prevalence of two-person households (β = 0.3215, p < 0.05) alongside a strong association with homemaker status (β = 0.8219, p < 0.001). Class 2 is characterized by a significant tendency toward single-occupancy living (β = 0.2673, p < 0.05). Class 4 presents the most robust association with single-person households (β = 0.9352, p < 0.001), while Class 6 is strongly linked with larger household configurations (β = 0.6969, p < 0.01).
3.1.7.1 Housing characteristics
Housing type preferences vary systematically across segments. Class 4 exhibits a pronounced inclination toward detached housing (β = 0.7431, p < 0.001), in contrast to Class 5, which is significantly associated with multi-family housing (β = 0.2509, p < 0.01). Class 1 also shows a moderate preference for multi-family housing (β = 0.2231, p < 0.001), although this effect is less dominant compared to the stronger housing tendencies observed in other classes.
3.1.7.2 Economic indicators
Income patterns reveal complex economic patterns cross classes. Class 1 shows significant negative associations with higher income brackets ($75,000-$99,999: β = −0.8359, p < 0.05), while demonstrating positive association with lower income categories ($5,000-$9,999: β = 0.6746, p < 0.05). Class 2 is significantly tied to low-income status (β = 0.3312, p < 0.001), and Class 4 demonstrates positive association with middle-income categories ($50,000-$74,999: β = 0.7519, p < 0.05).
3.1.7.3 Energy burden distribution
Energy burden patterns show significant variation across segments. Class 5 is distinguished by the strongest negative association with high energy burden (β = −0.3719, p < 0.01). In contrast, Classes 1 and 2 show moderate positive associations (β = 0.1797, p < 0.05 and β = 0.1650, p < 0.05 respectively) while Class 3 shows a significant negative association with high energy burden (β = −0.1904, p < 0.05), suggesting lower energy cost impacts relative to income.
These patterns reveal distinct combinations of demographic, housing, and economic characteristics across renter segments, providing an empirical foundation for understanding the composition of the rental market. The next section examines how these segments manifest across different metropolitan areas, providing insight into the geographic distribution of renter characteristics.
3.2 Cross-segment analysis
Analysis across segments reveals three key empirical patterns. First, the relationship between housing type and household size shows systematic variation. While larger households demonstrate positive association with detached housing (Class 6: β = −0.1963 for multi-family, p < 0.05), single-person households show an even stronger association (Class 4: β = 0.7431 for detached, p < 0.001). This pattern suggests that housing type preferences are not solely determined by household size. Second, income effects demonstrate nonlinear relationships with other characteristics. Despite expectations of clear income stratification, the data reveals more complex patterns. For example, Class 4’s positive association with middle-income brackets ($50,000-$74,999: β = 0.7519, p < 0.05) coexists with significant associations with detached housing (β = 0.7431, p < 0.001). Similarly, Class 1’s negative association with higher income brackets ($75,000-$99,999: β = −0.8359, p < 0.05) appears alongside significant employment effects (homemaker status: β = 0.8219, p < 0.001). Third, employment status emerges as a key differentiating factor across segments. Full-time employment shows strongest association with Class 6 (β = 0.7753, p < 0.05), while homemaker status most strongly characterizes Class 1 (β = 0.8219, p < 0.001). Self-employment demonstrates particular significance for Class 4 (β = 0.4897, p < 0.05), suggesting distinct relationships between employment patterns and other household characteristics.
These cross-segment patterns highlight the multidimensional nature of renter characteristics, where demographic, economic, and housing factors combine in ways that extend beyond simple linear relationships. The next section examines how these complex combinations manifest across different metropolitan areas.
3.3 Geographic distribution of renter classes
Analysis of rental market segmentation across San Diego, Houston, and Durham reveals systematic variation in how renter classes manifest across different urban contexts. The data demonstrates distinct patterns in class membership probabilities, influenced by local demographic and housing market characteristics.
3.3.1 Market-specific class distribution patterns
Each metropolitan area shows distinct patterns in expected class membership. Houston demonstrates the strongest household size effects across all segments (ranging from 0.049 for Class 1 to 0.011 for Class 6), while Durham shows notably smaller coefficients for the same characteristic (ranging from 0.006 to 0.001). These differences suggest varying importance of household composition across markets. The most pronounced demographic effect across all three cities appears in gender distribution, with coefficients ranging from 0.132 to 0.032, showing consistent patterns across markets but varying in magnitude. Employment status emerges as another stable predictor, with coefficients ranging from 0.064 to 0.017 across segments in all three markets.
3.3.2 Housing market characteristics
San Diego demonstrates distinct demographic stratification across renter segments. Gender characteristics show the strongest effect on class membership (coefficients 0.132–0.032), followed by employment status (0.064–0.017). The city shows moderate household size effects (0.027–0.006), with climate and moisture regime coefficients (0.041–0.011) suggesting environmental factors play a consistent role in segment distribution. Housing type effects vary by class, with Class 4 showing positive association with detached housing (0.049) while Classes 1 and 5 demonstrate negative associations (−0.015 and −0.017 respectively).
Houston exhibits the strongest household size effects among the three cities, with coefficients ranging from 0.049 to 0.011 across segments. The city maintains similar gender-based differentiation (0.132–0.032) as San Diego, but shows stronger variation in housing type associations across segments. Income effects remain moderate (0.021–0.007), with consistent patterns across segments reflecting the city’s economic structure. Environmental factors maintain similar importance to San Diego, with moisture regime coefficients ranging from 0.041 to 0.011.
Durham shows the most moderate household size effects (0.006–0.001), suggesting less segmentation based on household composition compared to the other cities. The city maintains similar patterns of gender-based differentiation (0.132–0.032) and employment effects (0.064–0.017) as the other markets, but with distinct housing type associations. Climate and moisture regime effects remain consistent with other markets (0.041–0.011), indicating regional environmental conditions influence segment distribution similarly across different urban contexts.
3.3.3 Market-specific economic patterns
Analysis reveals complex interactions between economic indicators, housing characteristics, and demographic factors across the three markets. In San Diego, housing type produces distinct segmentation patterns, with Class 4 showing strong positive association with detached housing (0.049) while Classes 1 and 5 demonstrate negative associations (−0.015 and −0.017). This housing type distribution interacts with income patterns (coefficients 0.021–0.007) and energy burden effects (0.009–0.001) to create distinctive market segments. The city shows substantial age-based stratification (0.045–0.012), suggesting that life-cycle effects may influence housing market participation.
Houston demonstrates the strongest household size effects (0.049–0.011) among all markets, indicating that family composition plays a particularly important role in market segmentation. This pattern combines with employment effects (0.064–0.017) to create distinct economic submarkets. Regional climate and moisture regime coefficients (0.041–0.011) suggest environmental factors may influence energy consumption patterns and associated economic burdens. The city shows similar age-based stratification (0.045–0.012) to San Diego, but with stronger interaction between household size and economic indicators.
Durham exhibits more moderate effects across most dimensions, with notably smaller household size coefficients (0.006–0.001) suggesting less segmentation based on family composition. However, the city maintains similar employment (0.064–0.017) and age (0.045–0.012) effects to other markets, indicating that work status and life-cycle stage remain important determinants of market position. Energy burden patterns (0.009–0.001) remain consistent with other markets despite different climate conditions, suggesting that regional energy cost structures may compensate for environmental differences.
Across all three markets, gender-based stratification remains notably consistent (0.132–0.032), interacting with employment patterns and income effects to shape market segments. The persistence of these demographic effects across different market sizes and regional contexts suggests fundamental patterns in how household characteristics influence housing market participation and economic outcomes.
3.4 Market response analysis and results
Analysis of energy efficiency improvements across the three metropolitan statistical areas reveals significant heterogeneity in both the scale and distribution of potential market impacts. The results demonstrate varying degrees of effectiveness in addressing the well-documented split incentive problem between landlords and tenants in rental housing markets, while offering insights for broader policy application across diverse metropolitan contexts.
3.4.1 Market-specific impacts and value creation
Analysis of energy efficiency improvements across three metropolitan statistical areas reveals distinct patterns in how different markets value and capitalize energy efficiency improvements. These patterns demonstrate systematic variation shaped by climate conditions, market characteristics, and local cost structures.
Houston’s hot-humid climate zone produces the strongest market response to initial efficiency improvements, with an initial return multiplier of 0.337 indicating substantial value creation potential. Under base conditions, properties with poor efficiency ratings (HES 2) face a monthly penalty of -$341.76, while high efficiency (HES 8) commands a premium of $250.71. Moderate efficiency improvements (HES 5) generate $91.04 in monthly value. The relationship between rental value and efficiency is particularly pronounced in Houston’s market distribution, where landlord share of total housing costs ranges from 74.5% for HES 2 properties to 88.3% for HES 8 properties under base energy cost assumptions, suggesting strong market recognition of efficiency differences.
Durham’s mixed-humid climate generates distinct but substantial market responses, with an initial return multiplier of 0.204. The efficiency penalty in Durham (-$376.50 under base conditions) represents the largest absolute penalty across studied markets, while moderate efficiency improvements generate significant value gains. Market distribution analysis reveals that landlords capture between 87.7% and 94.7% of total housing costs depending on efficiency level, the highest proportion across studied markets. This pattern suggests that Durham’s market structure allows property owners to retain a larger share of efficiency-driven value creation.
San Diego’s temperate climate produces more moderate but still meaningful market responses, with an initial return multiplier of 0.089. Poor efficiency generates a penalty of -$246.80 under base conditions, while moderate efficiency improvements create $73.26 in monthly value. The market distribution in San Diego shows the most compressed range, with landlord share varying from 77.5% to 87.0% across efficiency levels, reflecting the region’s more stable energy demands. This compressed but consistent pattern suggests that even in temperate climates, markets systematically value efficiency improvements.
These market-specific responses demonstrate how local conditions shape the absolute value creation potential of efficiency improvements. Sensitivity analysis confirms the robustness of these patterns, with weighted standard errors of 54.29 for HES 2, 18.35 for HES 5, and 54.72 for HES 8 indicating consistent precision in estimating value across efficiency levels. The notably smaller standard error for moderate efficiency levels suggests particular reliability in estimating the value creation potential of initial improvements across different market contexts.
These findings reveal that while markets consistently capitalize energy efficiency improvements into rental values, the magnitude of this capitalization varies systematically with local conditions. The strong market responses in Houston and Durham, despite their different climate conditions, suggest that market structures and local cost patterns play crucial roles alongside climate factors in determining how efficiency improvements translate into value creation.
3.4.2 Value creation and improvement returns
Analysis across the three metropolitan areas reveals striking differences between the value creation potential of initial improvements (HES 2–5) versus secondary improvements (HES 5–8), suggesting fundamental patterns in how rental markets value progressive efficiency gains.
In Houston, where the hot-humid climate creates substantial cooling demands, initial improvements generate an exceptionally strong return multiplier of 0.337, the highest among studied markets. This robust initial return reflects the market’s particular sensitivity to efficiency differences in a high-energy-demand environment. However, Houston’s secondary improvements show a notably lower but still substantial multiplier of 0.291, suggesting that while returns diminish for higher-level improvements, the market continues to value additional efficiency gains. This relatively high secondary return multiplier distinguishes Houston from other markets, potentially reflecting the ongoing value of efficiency improvements in meeting substantial cooling requirements.
Durham presents a distinct pattern, with an initial return multiplier of 0.204 followed by a stronger secondary multiplier of 0.319. This unusual pattern, where secondary improvements generate higher returns than initial ones, suggests unique market dynamics in Durham’s mixed-humid climate zone. The strengthening returns may reflect a market premium for achieving higher efficiency levels, possibly driven by the region’s need to address both heating and cooling demands. This pattern is particularly evident in the market distribution data, where landlord share of total housing costs shows the most substantial increases between HES 5 and HES 8 levels.
San Diego demonstrates the most pronounced difference between initial and secondary returns, with an initial multiplier of 0.090 dropping to a secondary multiplier of 0.026. This sharp decline in returns suggests that in temperate climates, markets place significantly higher value on escaping poor efficiency than on achieving exceptional performance. The market distribution data supports this interpretation, showing the largest shifts in landlord share occurring between HES 2 and HES 5 levels, with more modest gains for further improvements.
These patterns, shown in Table 2. Return Multipliers by City, reveal four fundamental characteristics in how rental markets value efficiency improvements.
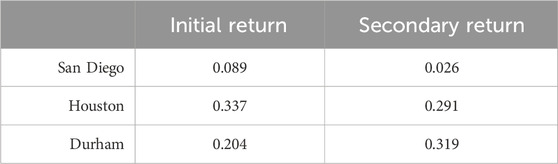
Table 2. Return multipliers by city.
First, initial improvements generate consistently positive returns across all markets, though with magnitude varying substantially by climate zone and market conditions. Even in San Diego’s temperate climate, where absolute returns are lowest, the positive initial multiplier indicates reliable value creation potential. Second, the relationship between initial and secondary returns varies systematically with climate conditions. Markets with more extreme climate conditions (Houston and Durham) maintain stronger secondary returns, while temperate markets show sharp declines in improvement returns past moderate efficiency levels. Third, market distribution patterns suggest that efficiency improvements systematically shift cost structures toward higher landlord shares, though with varying intensity. Under base conditions, landlord share increases range from 9.5 percentage points in San Diego to 13.8 percentage points in Durham across the full improvement range. Fourth, the patterns of return decay between initial and secondary improvements show remarkable consistency within climate zones, even as absolute returns vary with market conditions. This consistency suggests fundamental market dynamics in valuing progressive efficiency gains that transcend local market characteristics.
These findings indicate that while markets consistently value efficiency improvements, the optimal improvement strategy may vary substantially by location. In temperate climates like San Diego, the sharp decay in returns past moderate efficiency levels suggests focusing resources on initial improvements. Conversely, markets with more extreme climate conditions demonstrate value creation potential across the full range of efficiency improvements, though still with generally higher returns for initial gains.
3.5 Policy design implications
The market-specific impacts and cross-market patterns revealed through our analysis suggest principles for policy design that can effectively address rental market inefficiencies while responding to local conditions. Our findings, represented in Table 3, indicate that effective policy frameworks must address three fundamental market characteristics: the pronounced asymmetric valuation of efficiency levels, the predictable but varying returns on improvements, and the market-specific dynamics of cost redistribution.
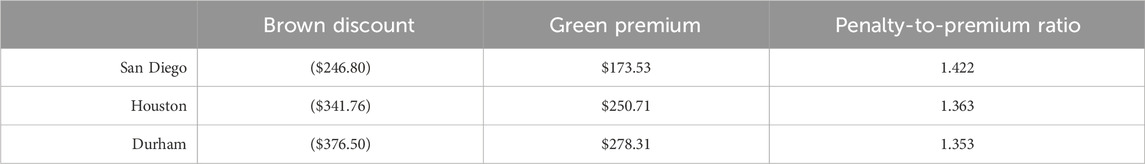
Table 3. Regional variations in efficiency penalties and premiums.
The asymmetric relationship between efficiency penalties and premiums across markets provides crucial insights for policy calibration. In Durham, the substantial -$376.50 monthly penalty for poor efficiency (HES 2) significantly exceeds the $278.31 premium for high efficiency (HES 8), yielding a penalty-to-premium ratio of 1.35. This asymmetry appears even more pronounced in San Diego (1.42 ratio) and Houston (1.36 ratio), despite significant variations in absolute valuations. This persistent and substantial asymmetry indicates that market mechanisms alone may not provide sufficient incentives for property owners to undertake efficiency improvements, particularly given substantial upfront costs. The consistency of these ratios across markets with varying climate conditions and economic characteristics suggests that this asymmetry represents a fundamental market feature requiring systematic policy intervention.
The stark differences between initial and secondary return multipliers carry critical implications for policy structure. In San Diego, an initial return multiplier of 0.090 drops sharply to 0.026 for secondary improvements, suggesting that policies in temperate climates should prioritize incentives for basic efficiency improvements. Conversely, Houston’s more balanced pattern (0.337 initial, 0.291 secondary) indicates opportunities for policies that promote comprehensive improvements in high-demand climate zones. Durham’s unique pattern, where the secondary multiplier (0.319) exceeds the initial multiplier (0.204), suggests potential for policies that explicitly incentivize achieving exceptional efficiency levels in mixed-climate regions.
Market distribution patterns provide essential context for policy design, particularly regarding affordability impacts. Under base conditions, the landlord’s share of total housing costs increases systematically with efficiency improvements - from 78.3% to 88.4% in San Diego, 74.5%–88.3% in Houston, and 87.7%–94.7% in Durham. This consistent pattern of increasing landlord share suggests that while efficiency improvements create value, they may also shift cost burdens in ways that require careful policy attention to maintain affordability. Tables 4–6 contain market distribution estimates across HES, Energy Cost, and WTP scenarios for each city.
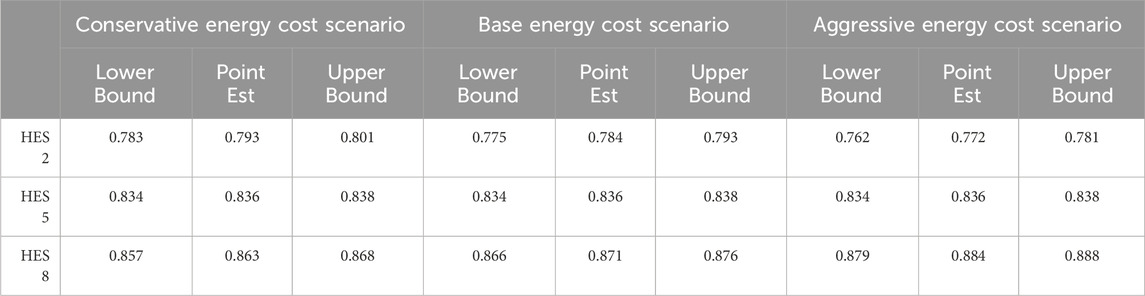
Table 4. San Diego Market distribution, home energy score and energy cost scenarios.
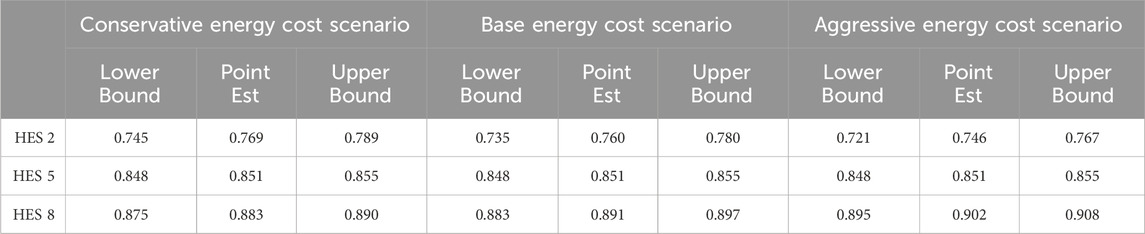
Table 5. Houston Market distribution, home energy score and energy cost scenarios.
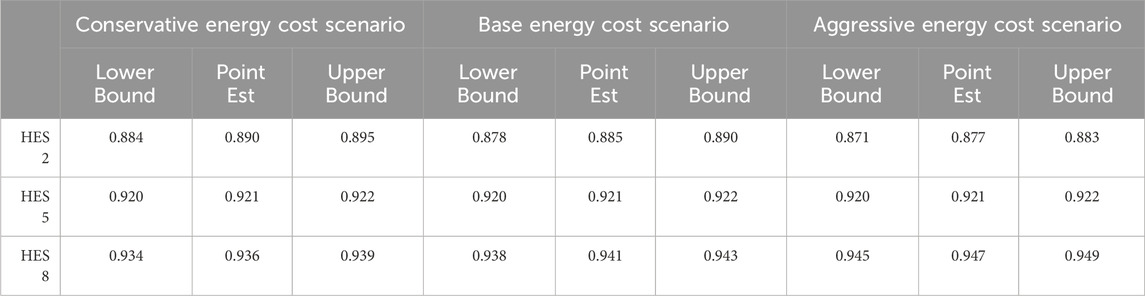
Table 6. Durham market distribution, home energy score and energy cost scenarios.
These findings suggest a framework for policy design with four essential components:
1. Climate-Calibrated Support Structure: Base support levels should reflect the dramatic variation in return multipliers across climate zones. Markets like Houston, with high initial returns (0.337) and sustained secondary returns (0.291), may require less aggressive incentives than markets like San Diego where sharp return decay (0.090–0.026) could deter comprehensive improvements.
2. Tiered Improvement Incentives: Programs should align incentive structures with demonstrated market returns. In markets showing sharp return decay like San Diego, higher incentives for initial improvements could help overcome market friction. Conversely, markets like Durham with strong secondary returns might benefit from incentives that explicitly reward achieving exceptional efficiency levels.
3. Affordability Protection Mechanisms: Policies must address both initial cost barriers and the systematic shift in cost distribution through efficiency improvements. Markets showing the largest increases in landlord share (like Durham’s 7.0 percentage point gain) may require specific provisions to maintain affordability as cost structures shift.
4. Market-Specific Implementation Flexibility: While certain patterns (like penalty-to-premium ratios) show remarkable consistency across markets, the substantial variation in return multipliers demands flexible implementation frameworks that can accommodate local market dynamics while maintaining program consistency.
Implementation of these components requires careful attention to local conditions while leveraging the predictable patterns observed across markets. In regions like Houston, where both initial and secondary improvements show strong returns, policies might emphasize removing implementation barriers over basic incentives. Conversely, in markets like San Diego where return decay is pronounced, enhanced support for initial improvements may be necessary to overcome market friction.
This framework allows policymakers to develop targeted interventions that address local market conditions while maintaining program consistency across regions. By aligning support structures with empirically demonstrated return patterns and accounting for systematic shifts in cost distribution, policies can more effectively promote efficiency improvements while managing affordability impacts and ensuring equitable access to energy efficiency benefits.
3.6 Sensitivity analysis results
The sensitivity analysis reveals complex patterns in how market responses vary under different assumptions about rent and energy cost differentials. Using a variance-based approach, we calculated weighted standard errors for each home energy score, finding values of 54.29 for HES 2, 18.35 for HES 5, and 54.72 for HES 8. The notably smaller standard error for HES 5 suggests greater precision in estimating WTP for moderate efficiency levels, while the larger standard errors for both HES 2 and HES 8 indicate more uncertainty in valuing extremes of energy performance.
Initial return multipliers demonstrate substantial sensitivity to underlying assumptions, with particularly pronounced variation in how markets translate efficiency improvements into value creation. Under conservative assumptions with smaller rent and energy cost differentials, return multipliers decrease significantly across all markets: San Diego’s initial return multiplier drops to 0.052, Houston’s to 0.056, and Durham’s to 0.081. Conversely, aggressive scenarios with larger differentials produce notably higher multipliers, ranging from 0.110 in San Diego to 0.177 in Durham, with Houston showing an intermediate value of 0.118. This variation suggests that the magnitude of market responses to initial efficiency improvements depends critically on how strongly rent and energy costs reflect efficiency differences.
Secondary return multipliers demonstrate remarkably consistent patterns across all markets and scenarios. The ratio between secondary and initial improvement returns maintains a narrow range from 1.113 to 1.170 in San Diego, 1.100 to 1.150 in Houston, and 1.036 to 1.055 in Durham. This stability suggests that the relationship between initial and subsequent improvements remains highly consistent even as absolute returns vary with local market conditions. This finding provides strong evidence for fundamental market dynamics in valuing progressive efficiency improvements that persist across diverse climate zones and market structures.
The analysis reveals particularly robust patterns in cost distribution across efficiency levels and scenarios (Figure 3). For San Diego, the landlord’s share of total housing costs ranges from 78.3%–80.1% for HES 2 properties to 86.3%–88.8% for HES 8 properties, with the spread widening under more aggressive energy cost scenarios (Figure 3). Houston shows a similar pattern but with lower initial shares, ranging from 74.5%–78.9% for HES 2% to 88.3%–90.8% for HES 8 (Figure 3). Durham demonstrates the highest overall shares but narrowest spreads, with HES 2 properties ranging from 87.7%–89.5% and HES 8 properties from 93.8%–94.9% (Figure 3).
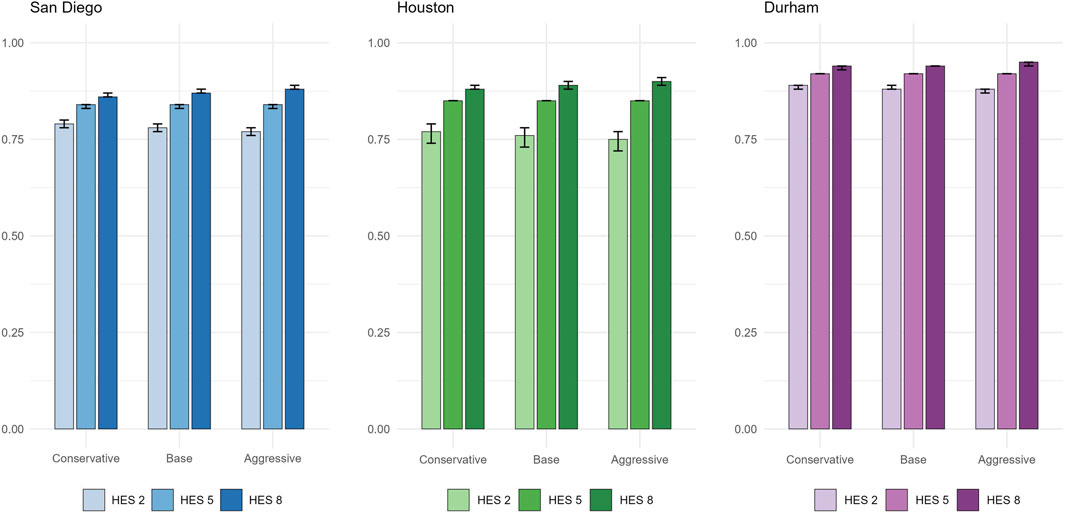
Figure 3. Landlord share of total monthly unit value in San Diego, Houston, and Durham.
These market distribution patterns maintain remarkable consistency even as scenarios vary. Under conservative energy cost assumptions, the increase in landlord share from HES 2 to HES 8 ranges from 7.2 to 8.1 percentage points across markets. This spread expands to 9.5–10.8 points under base assumptions and 10.4–11.4 points in aggressive scenarios. The preservation of these systematic relationships across scenarios suggests fundamental dynamics in how efficiency improvements redistribute housing costs between landlords and utilities.
The relationship between efficiency penalties and premiums shows moderate sensitivity to underlying assumptions, though important structural patterns persist (Figure 4). San Diego exhibits a penalty-to-premium ratio of 1.42 ($246.80 penalty to $173.53 premium) (Figure 4), Houston shows a ratio of 1.36 ($341.76 to $250.71) (Figure 4), and Durham demonstrates a ratio of 1.35 ($376.50 to $278.31) (Figure 4). The consistency of these ratios across markets suggests a fundamental relationship between penalties and premiums that transcends local market conditions. Under conservative assumptions, these ratios compress slightly, while aggressive scenarios reveal more pronounced asymmetry, indicating that market valuations may amplify inefficiency penalties more than efficiency premiums as the magnitude of differentials increases.
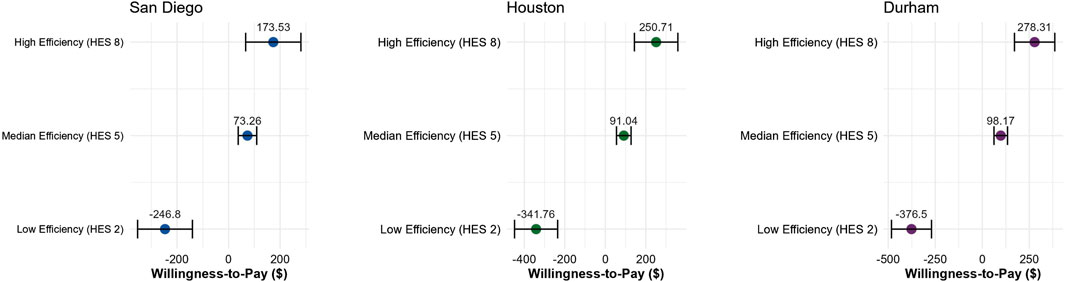
Figure 4. Penalties and Premiums for home energy efficiency in San Diego, Houston, and Durham.
These sensitivity analysis results indicate that while absolute market responses vary with underlying assumptions, key structural relationships—particularly in secondary returns and cost redistribution patterns—demonstrate important stability. The persistence of these patterns across different scenarios provides crucial guidance for policy design, suggesting that certain fundamental market dynamics remain reliable even when specific magnitudes prove more uncertain. This stability in structural relationships, combined with our understanding of how different assumptions affect absolute returns, offers a foundation for developing robust policy approaches that can accommodate varying market conditions while maintaining effectiveness.
4 Discussion
4.1 Implications for clean heating policy design
Our empirical analysis reveals both robust patterns and areas of significant uncertainty in how rental markets respond to efficiency improvements. These findings, shaped by the interaction of climate conditions, demographic characteristics, and market structures, provide crucial insights for addressing the persistent split incentive problem between landlords and tenants, while highlighting where policy approaches must account for uncertainty.
The relationship between climate conditions and market valuations demonstrates more complexity than initially apparent. While relative market responses show consistent ordering across climate zones, the absolute valuations exhibit substantial sensitivity to underlying assumptions. Initial return multipliers vary significantly - from 0.090 in San Diego to 0.337 in Houston - suggesting that policies must carefully calibrate financial incentives to local conditions rather than adopting standardized approaches across regions. Notably, our weighted standard error analysis reveals greater precision in estimating WTP for moderate efficiency levels (SE = 18.35 for HES 5) compared to both low and high efficiency extremes (SE = 54.29 for HES 2 and SE = 54.72 for HES 8), indicating where policy approaches may need to build in additional flexibility to account for valuation uncertainty.
The market distribution data reveals systematic patterns in how efficiency improvements affect cost allocation between landlords and utilities, with important implications for policy design. Under base conditions, landlord share of total housing costs increases from 78.3% to 88.4% in San Diego, 74.5%–88.3% in Houston, and 87.7%–94.7% in Durham across the full range of efficiency improvements. These shifts suggest that while efficiency improvements create value, they also systematically redistribute costs in ways that require careful policy attention to maintain affordability.
Demographic characteristics emerge as crucial determinants of policy needs through several channels, particularly in shaping how efficiency improvements affect different market segments. Household size shows particularly strong effects in shaping energy consumption patterns and technology requirements. Class 6’s negative association with multi-family housing (β = −0.1963, p < 0.05) alongside Class 4’s strong positive association with detached housing (β = 0.7431, p < 0.001) indicates that household composition systematically influences both housing type selection and associated efficiency needs. Employment patterns create another critical demographic dimension, with full-time employment strongly associated with Class 6 (β = 0.7753, p < 0.05) and homemaker status significant in Class 1 (β = 0.8219, p < 0.001).
The complex relationship between efficiency levels and market returns suggests the need for carefully structured incentive programs. Durham’s unique pattern, where secondary improvements generate higher returns (0.319) than initial improvements (0.204), contrasts sharply with San Diego’s dramatic return decay (0.090–0.026). This variation indicates that policies must move beyond simple incentive structures to address market-specific barriers and opportunities. The remarkable consistency in penalty-to-premium ratios across markets (1.35–1.42) suggests opportunities for standardized approaches to addressing poor efficiency, while the varying patterns in secondary returns indicate where market-specific calibration is essential.
Market characteristics and structures create distinct patterns of constraints and opportunities, most evident in the systematic variation in landlord share increases across efficiency levels. The persistence of these patterns across sensitivity scenarios - with increases ranging from 7.2 to 11.4 percentage points depending on market and scenario - suggests fundamental dynamics in how improvements affect cost distribution. This consistency provides a foundation for policy design while highlighting the need to address affordability impacts as improvements shift cost burdens.
Our analysis reveals that effective policies must balance robust structural relationships against areas of significant uncertainty. While the stability in cost distribution patterns and consistent penalty-to-premium relationships suggests opportunities for standardized policy frameworks, the dramatic variation in return multipliers across markets indicates where careful local calibration is essential. The persistence of demographic effects across sensitivity scenarios, combined with systematic but varying market responses, suggests that policies can build upon consistent underlying relationships while maintaining flexibility for both local conditions and uncertainty in market responses.
These patterns suggest a policy framework that combines standardized approaches to addressing poor efficiency with market-calibrated support for advanced improvements. The consistency in penalty-to-premium ratios provides a foundation for basic efficiency requirements, while the varying patterns in secondary returns indicate where market-specific incentives may be necessary to promote comprehensive improvements. This balanced approach, combined with careful attention to cost distribution dynamics, offers a path toward addressing both the split incentive problem and broader clean heating policy goals while maintaining affordability across diverse renter populations.
4.2 Net zero transition considerations
The market-specific impact analysis across three diverse metropolitan areas reveals how climate, demographic, and market characteristics shape opportunities and challenges for achieving net zero goals in residential heating, particularly in the rental sector where split incentives have historically complicated energy transitions.
The consistency in relative market responses across different climate zones provides a crucial foundation for developing standardized approaches to clean heating technology deployment. While absolute valuations vary significantly with climate conditions, initial return multipliers demonstrate notable consistency in their patterns across markets (ranging from 0.052 to 0.177), suggesting fundamental dynamics in market responses to efficiency gains. The interaction between these market responses and energy burden patterns provides important insights for designing climate-specific technology interventions for net zero transitions. This predictability in market-related patterns offers opportunities for regional coordination in incentive design, potentially allowing markets within similar climate zones to standardize certain program elements while maintaining flexibility for local conditions.
Demographic characteristics systematically influence potential pathways to net zero through multiple channels. The pronounced household size effects observed in Houston (coefficients ranging from 0.049 for Class 1 to 0.011 for Class 6) demonstrate how family composition shapes energy consumption patterns and, consequently, the potential impact of heating system transitions. The persistence of gender-based stratification effects across all three markets (coefficients 0.132–0.032) and employment status impacts (coefficients 0.064–0.017) suggests that occupancy patterns and daily usage behaviors must be central considerations in planning heating system transitions. Age-based stratification (coefficients 0.045–0.012) further indicates that life-cycle effects influence both housing market participation and potential receptiveness to heating system changes. These demographic patterns interact with housing type associations to create complex requirements for technology deployment strategies.
Market characteristics, particularly valuation patterns and cost distribution dynamics, reveal both opportunities and constraints for net zero transitions. The rent differentials across efficiency levels (ranging from 85% to 115% of baseline under base assumptions) combined with energy cost differentials (ranging from 75% to 130% of baseline) suggest that standardized approaches to clean heating technology deployment might be feasible when properly calibrated to local conditions. Initial improvements generate substantial monthly value creation, though with significant variation across markets - from $317.19 in San Diego to $474.67 in Durham - providing a clear baseline for structuring financial incentives. Housing type segmentation patterns, particularly evident in San Diego where Class 4 shows strong positive association with detached housing (0.049) while Classes 1 and 5 demonstrate negative associations (−0.015 and −0.017), interact with income patterns (coefficients 0.021–0.007) to create distinct market dynamics that must inform implementation strategies.
The systematic pattern of diminishing returns between initial and secondary improvements provides important guidance for prioritizing net zero investments. Secondary return multipliers show remarkable consistency (1.036–1.17) across markets and scenarios, suggesting that initial decarbonization efforts should target the worst-performing units to maximize both economic and environmental returns. This targeting strategy aligns with observed market responses to efficiency differences, where conservative estimates still show meaningful return multipliers (0.052–0.081) even under the most constrained assumptions. The systematic shifts in cost distribution through improvements—with landlord shares increasing by 4.8–11.4 percentage points—indicate that financing strategies must carefully balance improvement incentives with affordability considerations.
These empirical patterns suggest that successful net zero transitions in rental housing will require carefully calibrated approaches that account for the interplay between climate, demographic, and market characteristics. While the consistency in secondary return multipliers and cost distribution patterns across markets provides a foundation for standardized approaches, the variation in initial return multipliers (0.052–0.177) and demographic patterns indicates the need for flexible implementation strategies that can accommodate local contexts and constraints. This balance between standardization and flexibility, combined with targeted incentive structures that address split incentive barriers, will be crucial for achieving net zero goals in the rental housing sector.
4.3 Limitations and future research
While our study provides valuable insights into renter preferences and policy design, several important limitations warrant acknowledgment. Despite employing sensitivity analysis across different scenarios of rent and energy cost differentials (ranging from conservative to aggressive assumptions), we cannot fully explain certain persistent patterns in market responses. The stability of secondary return ratios (1.036–1.17) across scenarios suggests complex market dynamics that our current analytical framework cannot fully capture.
The sensitivity analysis itself faces limitations. While our scenarios test plausible assumptions based on empirical evidence, they treat rent and energy cost differentials as independent rather than acknowledging potential interdependencies. Additionally, the linear nature of our differential assumptions may oversimplify the relationship between efficiency improvements and market responses.
Data limitations constrain our analysis in several ways. Reliance on self-reported energy burden data and limited access to actual utility billing records restricts our ability to precisely estimate improvement costs and benefits. The cross-sectional nature of our data also prevents examination of whether observed patterns persist over time. While our study encompasses diverse market conditions through three carefully selected metropolitan areas, the findings’ generalizability to markets with substantially different regulatory environments or energy pricing structures remains uncertain.
These limitations suggest several directions for future research. Studies incorporating more sophisticated modeling of interdependencies between rent and energy cost differentials could improve understanding of market responses. Longitudinal studies could help track how sensitivity to efficiency improvements evolves over time. Additionally, research examining how different policy designs perform under various sensitivity scenarios could help develop more robust intervention strategies, particularly valuable for policymakers working to promote efficiency improvements in uncertain market conditions.
5 Conclusion
This study demonstrates that renter preferences for energy-efficient housing vary systematically with demographic and socioeconomic characteristics, suggesting the need for more targeted approaches to energy efficiency policy in rental markets. Through latent class analysis of discrete choice experiment data, we identified six distinct renter segments, each characterized by different combinations of constraints, preferences, and housing market experiences. Our analysis of three diverse metropolitan areas—San Diego, Houston, and Durham—reveals how these segments manifest differently across housing markets, influenced by local climate conditions, energy prices, and demographic patterns.
These findings have important implications for policy design and implementation. Traditional approaches to rental housing energy efficiency have often failed to account for the heterogeneity of renter needs and constraints, limiting their effectiveness in addressing the persistent split-incentive problem between landlords and tenants. Our research suggests that more nuanced, targeted interventions could help bridge this gap while advancing both efficiency and equity goals. By adjusting policy approaches to different renter segments and local market conditions, policymakers can better align incentives across stakeholders while ensuring that benefits reach those most in need of energy cost relief.
Data availability statement
The original contributions presented in the study are included in the article/Supplementary Material, further inquiries can be directed to the corresponding author.
Author contributions
GT: Conceptualization, Formal Analysis, Investigation, Methodology, Validation, Visualization, Writing – original draft, Writing – review and editing. SC: Conceptualization, Investigation, Methodology, Project administration, Software, Supervision, Writing – review and editing. RS: Data curation, Resources, Writing – review and editing.
Funding
The author(s) declare that no financial support was received for the research and/or publication of this article.
Acknowledgments
We sincerely thank Hannah Bastian for her work developing the original dataset that was instrumental in this research.
Conflict of interest
The authors declare that the research was conducted in the absence of any commercial or financial relationships that could be construed as a potential conflict of interest.
Generative AI statement
The authors declare that no Generative AI was used in the creation of this manuscript.
Publisher’s note
All claims expressed in this article are solely those of the authors and do not necessarily represent those of their affiliated organizations, or those of the publisher, the editors and the reviewers. Any product that may be evaluated in this article, or claim that may be made by its manufacturer, is not guaranteed or endorsed by the publisher.
Supplementary material
The Supplementary Material for this article can be found online at: https://www.frontiersin.org/articles/10.3389/fenvs.2025.1566904/full#supplementary-material
References
Bird, S., and Hernández, D. (2012). Policy options for the split incentive: increasing energy efficiency for low-income renters. Energy Policy 48, 506–514. doi:10.1016/j.enpol.2012.05.053
Boxall, P. C., and Adamowicz, W. L. (2002). ’Understanding heterogeneous preferences in random utility models: a latent class approach. Environ. Resour. Econ. 23 (4), 421–446. doi:10.1023/A:1021351721619
Carroll, J., Aravena, C., and Denny, E. (2016). Low energy efficiency in rental properties: asymmetric information or low willingness-to-pay? Energy Policy 96, 617–629. doi:10.1016/j.enpol.2016.06.019
Collins, M., and Curtis, J. (2018). Rental tenants’ willingness-to-pay for improved energy efficiency and payback periods for landlords. Energy Effic. 11 (8), 2033–2056. doi:10.1007/s12053-018-9668-y
Conrad, S. A., and Yates, D. (2018). Coupling stated preferences with a hydrological water resource model to inform water policies for residential areas in the Okanagan Basin, Canada. J. Hydrology 564, 846–858. doi:10.1016/j.jhydrol.2018.07.031
Davis, L. W. (2024). The economic determinants of heat pump adoption. Environ. Energy Policy Econ. 5, 162–199. doi:10.1086/727881
EIA (2015). Drivers of U.S. Household energy consumption, 1980-2009. U.S. Energy Information Administration. (Washington, DC: US. Department of Energy).
Farsi, M. (2010). Risk aversion and willingness to pay for energy efficient systems in rental apartments. Energy Policy 38 (6), 3078–3088. doi:10.1016/j.enpol.2010.01.048
Gillingham, K., Harding, M., and Rapson, D. (2012). Split incentives in residential energy consumption. Energy J. 33 (2), 37–62. doi:10.5547/01956574.33.2.3
Im, J., Seo, Y., Cetin, K. S., and Singh, J. (2017). Energy efficiency in U.S. residential rental housing: adoption rates and impact on rent. Appl. Energy 205, 1021–1033. doi:10.1016/j.apenergy.2017.08.047
Lancaster, K. J. (1966). A new approach to consumer theory. J. Political Econ. 74 (2), 132–157. doi:10.1086/259131
Lang, M., Lane, R., Zhao, K., and Raven, R. (2022). Energy efficiency in the private rental sector in Victoria, Australia: when and why do small-scale private landlords retrofit? Energy Res. & Soc. Sci. 88, 102533. doi:10.1016/j.erss.2022.102533
MacAskill, S., Stewart, R. A., Roca, E., Liu, B., and Sahin, O. (2021). Green building, split-incentives and affordable rental housing policy. Hous. Stud. 36 (1), 23–45. doi:10.1080/02673037.2019.1677861
Malekpour Koupaei, D., and Cetin, K. (2021). Smart thermostats in rental housing units: perspectives from landlords and tenants. J. Archit. Eng. 27 (4), 04021042. doi:10.1061/(ASCE)AE.1943-5568.0000516
Marmolejo-Duarte, C., and Chen, A. (2019). The uneven price impact of energy efficiency ratings on housing segments. Implications for public policy and private markets. Sustainability 11 (2), 372. doi:10.3390/su11020372
Mcfadden, D. (1973). Conditional logit analysis of qualitative choice behavior. Front. Econ., 105–142.
Melvin, J. (2018). The split incentives energy efficiency problem: evidence of underinvestment by landlords. Energy Policy 115, 342–352. doi:10.1016/j.enpol.2017.11.069
Nie, H., Kemp, R., Xu, J. H., Vasseur, V., and Fan, Y. (2020). Split incentive effects on the adoption of technical and behavioral energy-saving measures in the household sector in Western Europe. Energy Policy 140, 111424. doi:10.1016/j.enpol.2020.111424
Pivo, G. (2014). Unequal access to energy efficiency in US multifamily rental housing: opportunities to improve. Build. Res. & Inf. 42 (5), 551–573. doi:10.1080/09613218.2014.905395
Reames, T. G. (2021). Exploring residential rooftop solar potential in the United States by race and ethnicity. Front. Sustain. Cities 3, 666411. doi:10.3389/frsc.2021.666411
Rogers, J. C., Simmons, E., Convery, I., and Weatherall, A. (2008). Public perceptions of opportunities for community-based renewable energy projects. Energy Policy 36 (11), 4217–4226. doi:10.1016/j.enpol.2008.07.028
Samarripas, S., Jarrah, A., Runge, E., Nakajima, C., Tolentino, C., Morales, D., et al. (2024). City clean energy scorecard. American Council for an Energy Efficient Economy. (ACEEE).
Sussman, R., Bastian, H., Conrad, S., Cooper, E., Tong, E., Sherpa, A., et al. (2022). Energy labels affect behavior on rental listing Websites: a controlled experiment. American Council for an Energy Efficient Economy. (ACEEE).
Keywords: energy efficiency preferences, energy transition, localized policy design, scenario planning, market segmentation, climate adaptation
Citation: Troxell G, Conrad S and Sussman R (2025) Localized policy design for clean heating transitions: a multi-city analysis of renter preferences for energy efficiency. Front. Environ. Sci. 13:1566904. doi: 10.3389/fenvs.2025.1566904
Received: 26 January 2025; Accepted: 08 April 2025;
Published: 30 April 2025.
Edited by:
Bowen Xiao, Northeastern University, ChinaReviewed by:
Zhenyu Li, Shanghai University, ChinaHongyan Su, Chinese Academy of Social Sciences (CASS), China
Copyright © 2025 Troxell, Conrad and Sussman. This is an open-access article distributed under the terms of the Creative Commons Attribution License (CC BY). The use, distribution or reproduction in other forums is permitted, provided the original author(s) and the copyright owner(s) are credited and that the original publication in this journal is cited, in accordance with accepted academic practice. No use, distribution or reproduction is permitted which does not comply with these terms.
*Correspondence: Graeme Troxell, Zy50cm94ZWxsQGNvbG9zdGF0ZS5lZHU=