 Ammar Kazem
 Guillaume Pierre
 Laurent Longuevergne2
- 1 University Rennes, Inria, CNRS, IRISA, Rennes, France
- 2 University Rennes – CNRS, Géosciences Rennes-UMR 6118, Rennes, France
The exploitation of natural resources by humans and the generation of waste have transformed the environment, raising concerns about the habitability of our planet for all life forms, as evidenced by the ongoing collapse of biodiversity. In this context, environmental observatories play a crucial role in documenting the state and evolution of socio-ecological systems by capturing inter-linkages between matter, energy and biota at relevant scales, in inter-connected compartments (surface, subsurface). The ultimate goal remains to understand and model the past and future trajectories of our habitats. Classical observation systems rely on a wide range of sensors of heterogeneous nature distributed over a domain, based on manual observations (manual gauges, water sampling) and/or transferred to a cloud. However effective continuous monitoring in any condition without data gap is challenged by the remote location of observatories, including limited access to energy, the large dynamic range in environmental signals, the necessity of maintenance and the need to limit our impact. In this work, we surveyed a set of environmental observatories belonging to three research infrastructures in France and Germany: the French network of critical zone observatories (OZCAR), the Réseau Zone Atelier (RZA) and the TERrestrial ENvironmental Observatories network (TERENO). The site managers and personnel express clearly the need to ensure continuous operations, adapt sampling strategy to effective in-situ events, in a context of decreasing technical staff onsite. The results of our survey highlight the critical need for bringing data processing near the sensors before the data are sent to a cloud platform. Adding in situ local computational power in the observatories themselves may improve reactivity and robustness of observation systems, while taking into account available energy at the same time. Therefore, in this review, we propose to introduce Fog Computing technologies in environmental monitoring systems, highlight its advantages and draft its main characteristics. We explore and review the value of Fog Computing, a technical solution bringing intelligence to operate adaptive heterogeneous sensor networks and comply with the challenge to capture intermittent to long-term temporal variability with an intermittent source of energy.
1 Introduction
Humans have significantly altered the environment by exploiting resources and generating waste, leading to concerns about the habitability of our planet for all life forms. This is starkly evidenced by the ongoing collapse of biodiversity (Elhacham et al., 2020; Leclère et al., 2020). The 2019 IPBES (Intergovernmental Science-Policy Platform on Biodiversity and Ecosystem Services) Global Assessment Report underscores that current trajectories are insufficient for conserving and sustainably using nature, and achieving long-term sustainability goals will require transformative changes across economic, social, political, and technological dimensions (IPBES, 2019).
In this context, environmental observatories are essential for documenting the state and evolution of Socio-Ecological Systems (SES) (Richter and Billings, 2015) and they play a crucial role in understanding and modeling the past and future trajectories of our territories. Different types of observatories, such as Critical Zone Observatories (White et al., 2015; Brantley et al., 2017) and ILTER (International Long-Term Ecological Research Network) observatories (Mirtl et al., 2018), exist with varied affiliations and objectives but they are united by the common goal of collecting relevant data.
Over the past decades, environmental monitoring technologies have advanced from simple data logging to sophisticated systems such as Environmental Sensor Networks (Martinez et al., 2004; Hart and Martinez, 2006), Environmental Wireless Sensor Networks (Corke et al., 2010), and the environmental Internet-of-Things (Hart and Martinez, 2015). These advancements have enabled remote communication with monitoring systems, thus reducing delays in data collection and interpretation. However, despite their availability for over 2 decades, simple data logging remains widely used in observatories, when specific sensors are not available (e.g., hydrochemical sampling to be analyzed in lab), but also because observatories are built in an incremental and ad-hoc manner. Therefore, it is imperative to understand the reasons for the slow adoption of modern monitoring technologies in environmental observatories. To address this, we need to identify current monitoring practices, define the unique challenges faced by observatories, and understand the user needs that newer technologies could not address. We therefore conducted a survey with observatories affiliated with the French Network of Critical Zone Observatories (OZCAR) (Gaillardet et al., 2018), Réseau Zone Atelier (RZA) (Lévêque et al., 2000; Bretagnolle et al., 2019) and TERrestrial Environmental Observatories network (TERENO) which consist of a set of nested or juxtaposed observatories dedicated to biophysical variables (Bogena, 2016). This survey was followed by in-person interviews with a smaller group of participants to gain further insights.
The results of our survey show that monitoring systems in observatories are based either on simple data logging or on sensor networks. In both cases, these systems exploit off-the-shelf hardware consisting of data loggers and a heterogeneous mix of sensors. All the surveyed observatories use these systems to sample-and-store or sample-and-send applications. Most of the data processing and interpretation is done later on remote servers after the data reaches them. However, many observatories expressed the need for more dynamic systems with the ability to perform timely event detection and response, generating alerts in case of hardware failures, and monitoring data quality, among other functions. This requires the processing and interpretation of the collected data in near real-time. With the current existing systems, analysis is feasible only after the data reach the servers due to the lack of in situ computational capabilities. However, with the energy and communication constraints imposed by the remote location of observatories, constant raw data transmission is always possible. This highlights the need for processing sensor data in situ, before sending them to remote servers for further analysis.
This need for in situ data processing suggests the usage of “Fog Computing” technologies, which precisely aim to support and manage computing, data storage and communication resources in the near proximity of sources of data (Yousefpour et al., 2019). However, Fog Computing technologies were mostly designed for smart city and Industry 4.0 scenarios, which significantly differ from the peculiarities of environmental observatories.
This study examines the current state of environmental monitoring systems deployed in French observatories, motivated by the urgent need to improve monitoring capabilities amid intensifying climate change impacts and ecosystem degradation. It highlights their key characteristics and limitations to identify critical requirements for enhanced systems. The analysis concludes by proposing a framework for a future environmental monitoring network incorporating Fog Computing technologies.
The paper is organized as follows. Section 2 details the survey and interview methodology, including participant data. Section 3 reviews the current state of environmental monitoring systems in the surveyed observatories. Section 4 addresses challenges in the current systems and proposes potential solutions. Section 5 introduces Fog Computing, explores implementation challenges specific to observatories, and outlines the primary features of a future fog-based monitoring system. Section 6 provides concluding remarks.
2 Methodology
This study examines the current state, challenges, and needs of environmental monitoring systems in French observatories. Data collection occurred in two steps: an online survey, followed by in-person interviews. All observatories affiliated with the French network of Critical Zone Observatories (OZCAR) (Mirtl et al., 2018) and the Réseau Zone Ateliers (RZA) (Lévêque et al., 2000) were invited to participate in the survey.Out of 133 observatories, 34 responded, yielding a response rate of approximately 25.6%. Details of the participants’ affiliations are presented in Table 1. Of the 34 respondents, 22 (65%) completed all survey questions. These observatories are located across five countries: France, Germany, Laos, Morocco, and Nepal. The geographical distribution is shown in Table 2.

Table 1. Affiliation of the surveyed observatories.

Table 2. Location of the participating monitoring sites.
The survey is designed with a mix of closed questions to gather quantitative responses and open questions to capture qualitative insights. It consists of five main parts:
• Sensors: In this section, the questions focus on the sensors deployed in situ and their characteristics. We inquire about the number of sensors, their power sources, and the type of connectivity they use. These results are later used to identify the challenges that will be faced in the implementation of an improved environmental monitoring system.
• Data processing infrastructure: This section is shown to participants only if their observatory site is equipped with an IT infrastructure in situ. We ask the participants about the composition of their IT infrastructure, including its energy sources, connectivity type (if any), and storage capability.
• Collected data: Participants are requested to answer quantitative questions regarding the collected data. This section includes questions about delays in receiving data from the sensors to the laboratory, delays in data processing before publication, and the number of personnel involved on the site.
• Current environmental monitoring systems: The questions in this section aim to gather qualitative and quantitative data on the implementation of four main characteristics that compose an environmental monitoring system: (1) predicting and detecting events; (2) responding to events; (3) real-time data; and (4) monitoring the system’s health. These characteristics were identified after studying the publications, websites, and Data Management Plans (DMP) of OZCAR’s and RZA’s observatories.
• Future environmental monitoring systems: The questions asked in this section aim to gather information about the needs and ideas for future improvements related to the four characteristics detailed previously.
Survey results were analyzed 1 and displayed on a public website 2 . While the survey provides valuable insights, the data have several limitations. The response rate of approximately 25% may not fully represent the diversity of OZCAR and RZA observatories, potentially skewing findings toward more motivated sites. Additionally, incomplete responses from 12 of the 34 participants (35%) limit the depth of data for some questions, particularly those on IT infrastructure and future needs. Self-reported data also introduce potential bias, as participants may overestimate capabilities or underestimate challenges. Furthermore, this study reflects only French-affiliated observatories, not a global sample, constraining its broader applicability. Based on these findings, a smaller group of observatories was selected for in-person interviews to explore future improvement options in greater depth. Raw data of these in-person interviews are given in Supplementary Appendix SB.
3 Current environmental monitoring systems
This section evaluates the current state of environmental monitoring systems in French observatories, leveraging our survey’s data. The general information about the surveyed observatories is presented in Section 3.1. Two different types of observatories, observed in the set of participants, are described in Section 3.2. The different types of monitoring systems are then documented in Section 3.3. Finally, four additional capabilities that characterize environmental monitoring systems are explored in Section 3.4.
3.1 General information
The hardware of the environmental monitoring systems is typically composed of a heterogeneous set of sensors, data loggers, and power sources. The number of sensors in the surveyed observatories varies from a couple per observatory to over 200, with an average of 59 sensors (Figure 1). These sensors are either wired to a data logger or are standalone, and are distributed across geographical areas that can span tens of square kilometers (e.g., forests, rivers, watersheds). The participants declared connecting up to 15 sensors per data logger. The most frequently used data loggers in our survey are from Campbell Scientific 3 . Other manufacturers also provide data loggers for the surveyed observatories such as scan 4 , SigmaSud 5 and Hobo 6 .
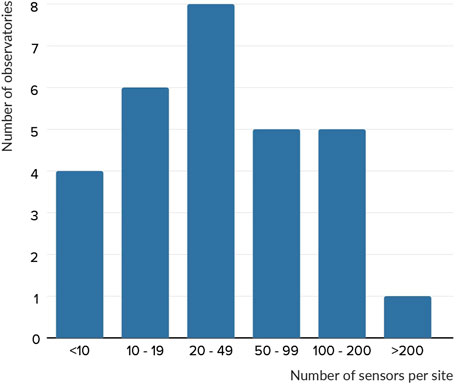
Figure 1. Distribution of sensors per observatory based on survey responses from 34 OZCAR, RZA, and TERENO sites. The figure illustrates a wide range, with some observatories deploying fewer than 10 sensors and others exceeding 200, reflecting varied monitoring scales. This variability necessitates Fog Computing platforms adaptable to any number of sensors, ensuring effective in-situ processing across diverse observatory configurations.
This hardware is powered by different power sources shown in Table 3. As we can see, most power comes from solar energy or internal batteries, and the electrical grid powers only 13% of the hardware in the environmental monitoring systems. In addition, 62% of the surveyed observatories do not have access to a power grid at all. This highlights an energy availability challenge that will have to be considered in any future system.
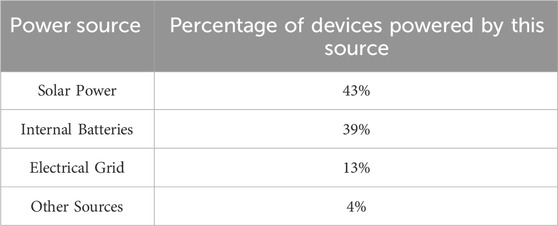
Table 3. Power sources in the surveyed observatories.
3.2 Types of observatories
According to our survey results, observatories can be classified in two main categories depending on their scientific objectives and monitoring strategies.
1. Long-term monitoring observatories: Long-term monitoring observatories aim to collect measurement data over extended periods of time such as multiple years or even decades. They typically maintain a static configuration for their monitoring systems, with consistent data collection frequency, transmission frequency, and data collection purposes over extended periods. These observatories account for 46% of the surveyed observatories.
2. Event-driven observatories: Event-driven observatories aim at observing specific events such as floods, heavy rains, and heat waves, when they take place. An event refers to any natural phenomenon that causes a change in the environment’s state. Event durations may range from minutes to years. Event-driven observatories monitor environmental changes before, during, and after such events. Certain measurements become crucial only during these events and can be disregarded when no event is occurring, which suggests dynamically adapting the monitoring systems to the current conditions. Event-driven observatories account for 54% of the surveyed observatories.
3.3 Environmental monitoring systems
The surveyed observatories rely on two types of environmental monitoring systems to collect data.
1. Manual data logging: Data logging goes back to the first automated weather station that was developed in 1940 by the US Navy’s Bureau of aeronautics (Brooks, 1940; Wood, 1946). It consists of data logger devices where sensors are plugged. data are collected at specific intervals and saved on local storage or SD cards. The data are later retrieved by a maintenance team during regular site visits. In our survey such visits occur on average every 71 days. A representation of a data logging system in an observatory is shown in Figure 2. The usage of data logging in the observatories we have surveyed is shown in Figure 3.
2. Environmental sensor network: Environmental sensor networks consist of an array of sensor nodes and a communication system which allows their data to reach a remote server (Martinez et al., 2004; Hart and Martinez, 2006; Corke et al., 2010). Sensor nodes also have the capacity to store data temporarily in the event of a communication system failure. Data are sent once a day on average. A representation of environmental sensor networks is shown in Figure 2. The usage of environmental sensor networks in the surveyed observatories is described in Figure 3.
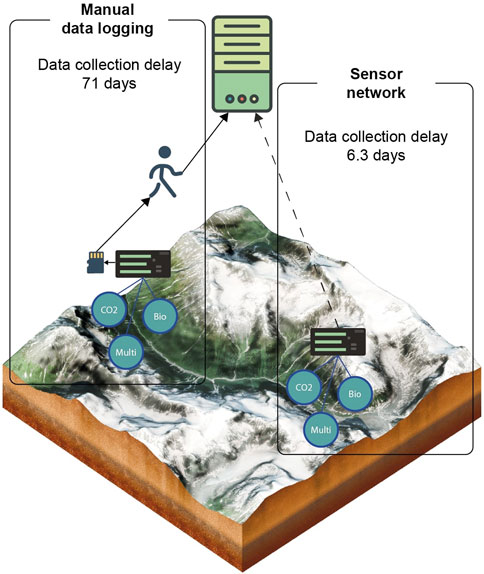
Figure 2. Comparison of data collection strategies in environmental observatories based on survey responses from 34 OZCAR, RZA, and TERENO sites. The figure contrasts manual data logging, with a delay of 71 days, against sensor networks, which reduce the delay to 6.3 days. While sensor networks improve efficiency, this delay remains too high for real-time adaptation, such as detecting and responding to events, highlighting the need for in-situ Fog Computing to enable rapid data processing.
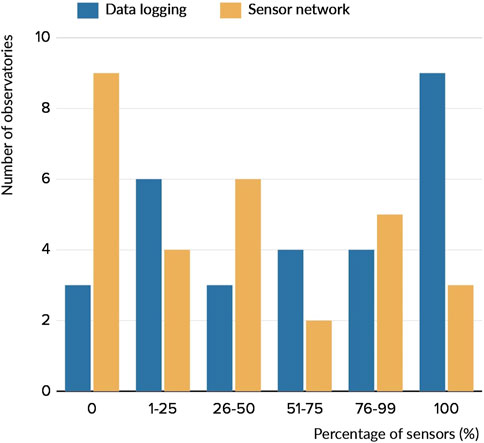
Figure 3. Distribution of environmental monitoring systems across 34 OZCAR, RZA, and TERENO observatories based on survey data. The bar chart compares the usage of data logging (blue) and sensor networks (orange), with the x-axis representing the percentage of sensors per site (0%, 1%–25%, 26%–50%, 51%–75%, 76%–99%, 100%) and the y-axis showing the number of observatories (up to 10). Notably, 9 observatories rely entirely on data logging, while only 3 utilize sensor networks for 100% of sensors, indicating a skewed adoption toward data logging. This heavy reliance, coupled with data logging delays (e.g., up to 71 days as per Figure 2) and sensor network limitations (6.3 days delay), highlights current systems’ inefficiencies in real-time processing. This supports the need for Fog Computing to enable rapid in-situ data processing and improve event detection across diverse observatory setups.
In the observatories we have surveyed, communication systems predominantly use broadband cellular network technologies, including 2G, 3G, 4G, and GPRS. Typically, modern data loggers are equipped with modems to enable wireless data transmission. In special scenarios where the equipment is in close proximity to the final server, alternative technologies such as Bluetooth and WiFi are sometimes employed for data transmission. Additionally, two observatories have reported experimenting with transmission over LoRaWAN (Long-Range Wide Area Network).
3.4 Additional capabilities
Besides collecting data and transmitting them for long-term archival, the surveyed observatories feature a number of other capabilities to accommodate their specific requirements. We now outline these capabilities and their implementation in current systems, discuss their significance, and present a usage scenario for the two distinct types of environmental monitoring systems.
3.4.1 Event prediction and detection
Event-driven observatories need to adapt their monitoring system behavior (e.g., by increasing data collection frequency) in response to predicted or detected events. Event detection relies on real-time analysis of data collected by the monitoring system. For example, a flood in a river can be identified by analyzing water height data. Additionally, data from various sources can be combined with sensor data to improve event prediction and identification.
Event prediction and detection are crucial for event-driven observatories. Many of the monitored parameters gain value if they can be measured just before, during, and after an event, making timely event detection essential for adapting monitoring strategies. Conversely, some parameters might be irrelevant outside of event periods. In such cases, the system should adapt by potentially reducing data collection frequency to preserve networking and storage resources. Additionally, certain actuators, like samplers, can only take a limited number of measurements. Predicting the duration of an event is important for better planning and response in such scenarios.
For instance, at the “Olivier de Serres” site 7 of the OHMCV observatory (Nord et al., 2017) an important research question is understanding the formation of flash floods. Hydrochemistry is used to trace the origin of water and water transfer times in the environment. This involves taking automatic samples of river water just before the water rises, throughout the flood and after the end of the flood at a frequency suited to the dynamics of the physical phenomenon. The optimisation of automatic sampling involving a limited number of available bottles requires the use of complementary data from other points in the catchment area, such as rainfall measurement by rain gauges or measurement of the water level in the river upstream of the sampling point in order to be able to anticipate the water rise downstream and the recession of the flood.
In current monitoring systems, data loggers can be programmed with proprietary languages such as CRBasic 8 to perform some local data analysis. We found that 38% of surveyed observatories employ data loggers for automating event detection in situ. Figure 4 describes different event detection scenarios found in the surveyed observatories.
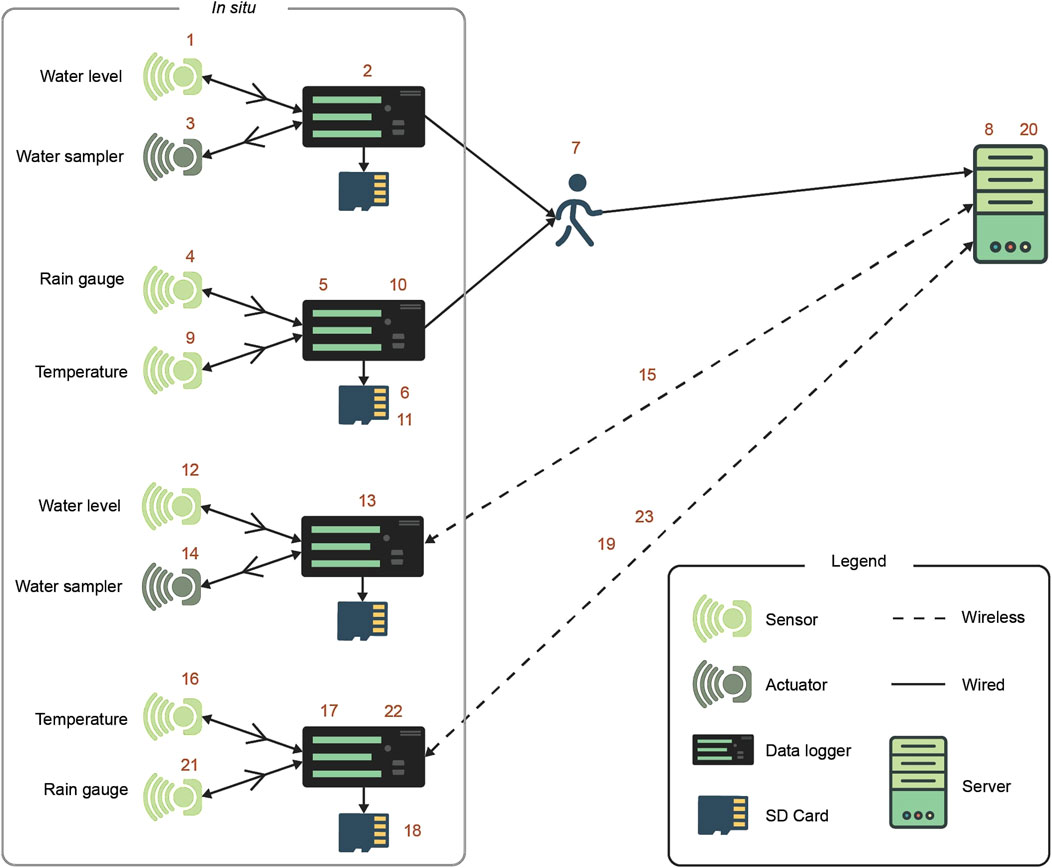
Figure 4. Data logging scenarios: Event prediction and detection: 1) Water level measures are taken at a set interval; 2) an increase of water height is detected by a data logger: 3) the data logger actuates a water sampler. Real-time data: 4) A sensor takes a measurement; 5) a data logger receives the measurement; 6) data are saved on an SD card; 7) they are later retrieved by a maintenance team during site visits; 8) finally data are transmitted to a server for further processing and storage. Sensor health monitoring: 9) A temperature measurement is taken; 10) a data logger detects an out-of-range temperature after comparing the measurement with a predefined range and flags it as corrupt; 11) the flagged measurement is saved in local storage. Sensor network scenarios: Event prediction and detection: 12) Water level measures are taken at a set interval, 13) an increase of water height is detected by a data logger, 14) the data logger actuates a water sampler, 15) the data logger sends a notification notifying about the event. Real-time data: 16) A sensor takes a measurement, 17) a data logger receives the measurement, 18) data are saved on an SD card, 19) data are transmitted at a set interval, 20) data are received by a server for further processing and storage. Sensor health monitoring: 21) The battery power is on the sensor is low, 2) a data logger detects the low power tension, 23) a notification about the low power tension of the sensor is sent.
Note that data loggers were primarily designed for data collection, storage and transmission. Extending them to perform complex data analysis risks exceeding their limited computational resources and memory. This limitation, highlighted in our interviews, restricts the number and complexity of data analysis operations that can be performed. For instance, predicting the future occurrence of an interesting event would require running a model of the monitored environment. Such forms of event prediction are not done currently in any of the surveyed observatories. This constitutes an opportunity for future improvement of the monitoring systems that we discuss in Section 4.
3.4.2 Event response
When an event-driven observatory detects or predicts a relevant event, a response should be taken according to the scientific objectives of the observatory. Such responses may include increasing or decreasing data collection frequencies, or activating idle devices in the system. Taking the flood example discussed above, responding to a flood event may require capturing water samples before, during and after the flood. It is important for an event response to be performed in a timely fashion to avoid missing any relevant parts of the detected event. This requires a tight control over the sensors and the ability to dynamically reconfigure them.
In current monitoring systems, data loggers can control the sensors that are wired to them. This enables them to activate certain sensors, or change their acquisition frequency after a certain condition is met. In our survey, 27% of the observatories declared using data loggers to respond to events after detecting them.
3.4.3 Real-time data transmission
Transmitting collected data in near real-time is a necessity for certain observatories depending on their specific objectives. In particular, observatories which share their data with operational entities such as prefectures or syndicates for decision-making purposes often require real-time or near real-time data transmission.
Using data logging, data are stored locally and later retrieved during site visits, making real-time data availability impossible. Using environmental sensor networks, data can be transmitted immediately, thus reducing the data collection delay.
3.4.4 System health monitoring
Observatories are composed of complex systems with multiple sensors, data loggers, gateways, and power sources such as solar panels and internal batteries. They are often located in remote locations. As a result, any failure in these components may have damaging consequences such as data gaps, inaccurate measurements, and missed relevant events.
We identify two main types of failures:
• Complete failure: this occurs when one or more devices (sensors, data loggers etc.) stop working altogether, often due to power shortages. This results in gaps within the data set.
• Partial failure: sensors may still take measurements, but these measurements do not reflect reality. For example, leaves and debris accumulating around a water level sensor can lead to incorrect readings and, consequently, a misinterpretation of reality.
It is important to detect failures as quickly as possible, to minimize data loss and ensure the accuracy of readings. However, as observatories grow in size, often spanning over tens of square kilometers, manually checking the health of all equipment during a site visit becomes increasingly difficult. The objectives of site visits today in large observatories are limited to data recovery (if data are not automatically transmitted), and to system maintenance in case a failure was previously detected. Detecting failures early, or predicting them, would help the observatory personnel in planning visits in advance, reducing the time needed for system maintenance.
Continuous monitoring of the system’s health, by analyzing the sensor measurements, allows for rapid failure detection. In current environmental monitoring systems, health checks are done either by manual analysis of the data once they reach the servers, or by programming data loggers to perform continuous data analysis. The first method is time consuming especially if data are not automatically transmitted, as is the case in most of the surveyed observatories (see Figure 3). The failure detection delays are also strongly related to availability of observatory personnel for conducting these analyses. The second method (in-situ failure detection) is implemented in only two of the observatories we have surveyed and for specific types of failures, by programming data loggers to send a text message in case the internal battery voltage drops below a certain level.
4 Current limitations and requirements for future improvements
This section aims to highlight the current limitations of environmental monitoring systems, and to identify potential directions for future improvements.
4.1 Event detection and prediction
Detecting or predicting relevant events in event-driven observatories may require advanced analysis which potentially combines the measurement data from one or more sensors with external data sources. We identified three potential sources for such data:
• In-situ data from multiple data loggers: Measurements collected by separate data loggers deployed within the same site, such as water level sensors upstream of a river detecting a rapid rise indicative of a flood, enabling downstream predictions of a flood.
• External data: Information obtained from sources beyond the deployed sensors, such as weather forecasts predicting heavy rainfall, which provide critical context to anticipate flood events.
• Manually measured data: User-provided observations and measurements, such as a field worker’s report of rising water levels or debris flow at a specific point, offering supplementary data to validate sensor readings and enhance flood detection accuracy.
Table 4 shows the declared interest of survey participants in each of these data sources. We see a strong interest in leveraging both external data (79%) and in-situ data from multiple data loggers (68%) for event detection. However, limitations of current systems hinder this integration:
• Limited communication between data loggers: Data logger systems operate in isolation, analyzing data only from the sensors that are directly connected to them. This restricts event detection to a small area around each logger (typically a few meters).
• Lack of internet connectivity and external data access: Data logging systems lack Internet connectivity, preventing them from accessing external sources like weather forecasts. Additionally, data loggers’ proprietary programming languages are not designed to fetch external data.
• Challenges with remote manual data integration: Integrating manual data often require remote access, which necessitates Internet connectivity and a reliable platform. While some data loggers offer software for remote control and manual data input, these were not found to be in use due to reported reliability issues.
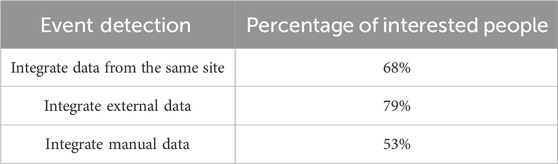
Table 4. Declared interest in different methods for event detection.
As highlighted in Section 3.4.1, event detection in current monitoring systems is limited to basic operations on individual data loggers. Advanced event detection would require deeper analysis of collected data combined with the aforementioned data sources that may be beyond the computational capabilities of the data loggers.
4.2 Event response
Responding to an event may require a variety of techniques. Table 5 highlights the declared interest of survey participants in different types of responses.
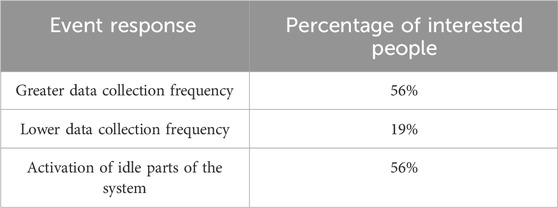
Table 5. Declared interest in different ways of responding to an event.
Regardless of the chosen response method, effective control over in situ hardware is essential. As discussed in Section 3.4.2, in current systems sensor and actuator operations are managed by data loggers. However, the lack of communication between data loggers limits such control to the sensors directly wired to them. This significantly limits the response possibilities, as only sensors and actuators connected to the same data logger where an event has been detected can be controlled.
4.3 Real-time data
Our survey indicates that 60% of respondents who share data with operational entities expressed a need for real-time monitoring, while the remaining 40% did not answer the question. Additionally, 70% of all surveyed observatories indicated a desire to transmit at least some of their collected data in near real time, citing various reasons.
However, implementing real-time data transmission presents significant challenges related to cost and energy efficiency. Currently, environmental sensor networks often rely on adding cellular modems to existing data loggers. This approach suffers from several drawbacks:
• High cost: The proprietary nature of data loggers restricts modem selection to those from the same manufacturer, leading to higher expenses. Additionally, each modem necessitates a separate cellular subscription, resulting in ongoing costs. These financial constraints often limit observatories’ adoption of wireless data transmission and push them towards data logging and manual data collection.
• Energy consumption: Cellular modems are power-hungry, making continuous data transmission incompatible with the energy limitations of many observatories (see Table 3). Deploying a modem for each data logger may not be a viable solution.
Instead of equipping every data logger with a modem, a more efficient solution would involve designating specific data loggers for real-time transmission. This approach requires enabling communication between data loggers. Low-power radio technologies like LoRa, Zigbee, or long-range WiFi offer more energy-efficient alternatives than cellular networks for this inter data logger communication.
4.4 System health monitoring
The critical importance of system health monitoring is evident from our survey results as almost all surveyed observatories (17 out of 18) indicated the need for sophisticated system health monitoring. Manual data logging scenarios reveal a lengthy failure detection delay of 109 days on average, whereas wireless data transmission significantly reduces these delays to 6.3 days, depending on Internet connectivity and the availability of dedicated personnel for manual data inspection. These limitations emphasize the need for in-situ health check capabilities.
As Table 6 shows, a strong preference exists for comparing measurements with similar data from external sources. This approach leverages data from other entities taking measurements in the same geographic location, such as MeteoFrance 9 for weather data or HydroPortail 10 for watercourse flow information. By comparing these external measurements with in-situ sensor data, anomalies and potential failures can be identified.
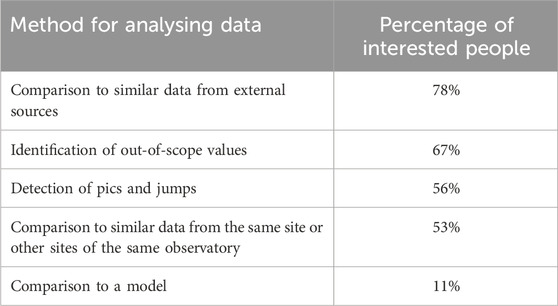
Table 6. Declared interest in different methods for detecting corrupt data.
Identification of out-of-scope values and detection of spikes and jumps in measurement data are also popular choices due to their relatively simple implementation. Notably, comparison of measurements with the output of pre-defined models is the least requested method.
Table 7 summarizes the technical requirements for providing various functionalities within environmental monitoring systems. Although each has its own specificities, a common requirement is to extend current systems with greater in situ computational capabilities than current systems can support, and where advanced data analysis techniques may be implemented. Additionally, a global in-situ view of the collected data are crucial for effective system health monitoring. To address these requirements, we propose to introduce and adapt so-called “Fog Computing” technologies in environmental observatories, as we discuss next.
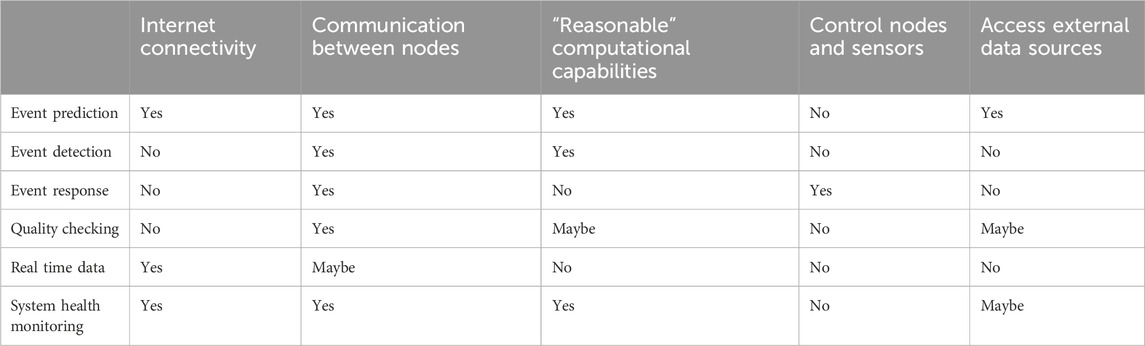
Table 7. Technical requirements needed for each characteristic.
5 Contribution of fog computing
Fog Computing technologies were introduced in 2012 as a way to extend classical Cloud Computing platforms with additional computing capabilities located out of Data Centers, in close proximity with the sources of data (Bonomi et al., 2012). This is particularly interesting in the context of the Internet of Things (IoT) where data produced by sensors must be processed and analyzed in a timely manner to deliver actionable insights. Instead of sending data to distant cloud centers for processing, adding processing power near the sensors and actuators can speed up response times and cut down on data sent over long distances. This is especially helpful when network connections to the cloud are slow, costly, or unreliable.
Fog Computing technologies are now a well-established component of the computing continuum between the Internet-of-Things and Cloud Computing layers. However, to our best knowledge, they have not yet been exploited in environmental observatories. This study argues that integrating Fog Computing, adapted to the demands of environmental monitoring, could greatly improve observatories. The analysis herein explores domains of successful Fog Computing implementation, identifies requirements derived from our survey and interviews, and outlines future research necessary to achieve enhanced observatories with in-situ data processing and communication capabilities.
5.1 Use cases
In recent years, Fog Computing technologies have been exploited in numerous application domains (Ahmed et al., 2019). The first use cases belonged to the domain of smart cities where a variety of sensors deployed in urban areas collect data to manage assets, resources and services efficiently (Perera et al., 2017). The authors identify a number of benefits compared to processing smart-city data in cloud platforms:
• Intelligent Sensing: The ability to sense only useful data.
• Selective Data Processing: The ability to analyze and transmit only relevant data, reducing unnecessary data traffic towards the cloud.
• Reduced Latency: Lower latency between edge devices and processing nodes, enabling faster response times to critical events.
• Increased Availability: Enhanced system availability even in the case of network failures as a continuous cloud connection is not always required.
Thanks to these interesting properties, Fog Computing has been applied in numerous domains such as transportation (Giang et al., 2016), healthcare (Quy et al., 2022; Rahmani et al., 2018), waste management (Esmaeilian et al., 2018) and marina management (Battulga et al., 2022). Fog Computing has also become a key enabler for Industry 4.0 (Rani et al., 2022) and smart agriculture (Zamora-Izquierdo et al., 2019).
5.2 Technical requirements, challenges and limitations
The benefits of Fog Computing, as presented in Section 5.1, align with the requirements for future environmental monitoring systems identified in Section 4. For instance, intelligent sensing resonates with our earlier discussion on event prediction, detection, and response within the environmental monitoring context.
Figure 5 presents the architecture of a future environmental observatory making use of Fog Computing. It relies on the same types of sensors, actuators and data loggers as current systems. We refer to them as “edge devices” in the rest of this article. The system is extended with one or more “fog nodes” which bring computational capabilities in-situ. In addition to their usual tasks, data loggers are configured to send any new measurement data to the fog servers, and to convey any reconfiguration requests back to the sensors and actuators. The fog nodes are thus able to process sensor data and take timely action when an interesting event happens or a failure is detected.
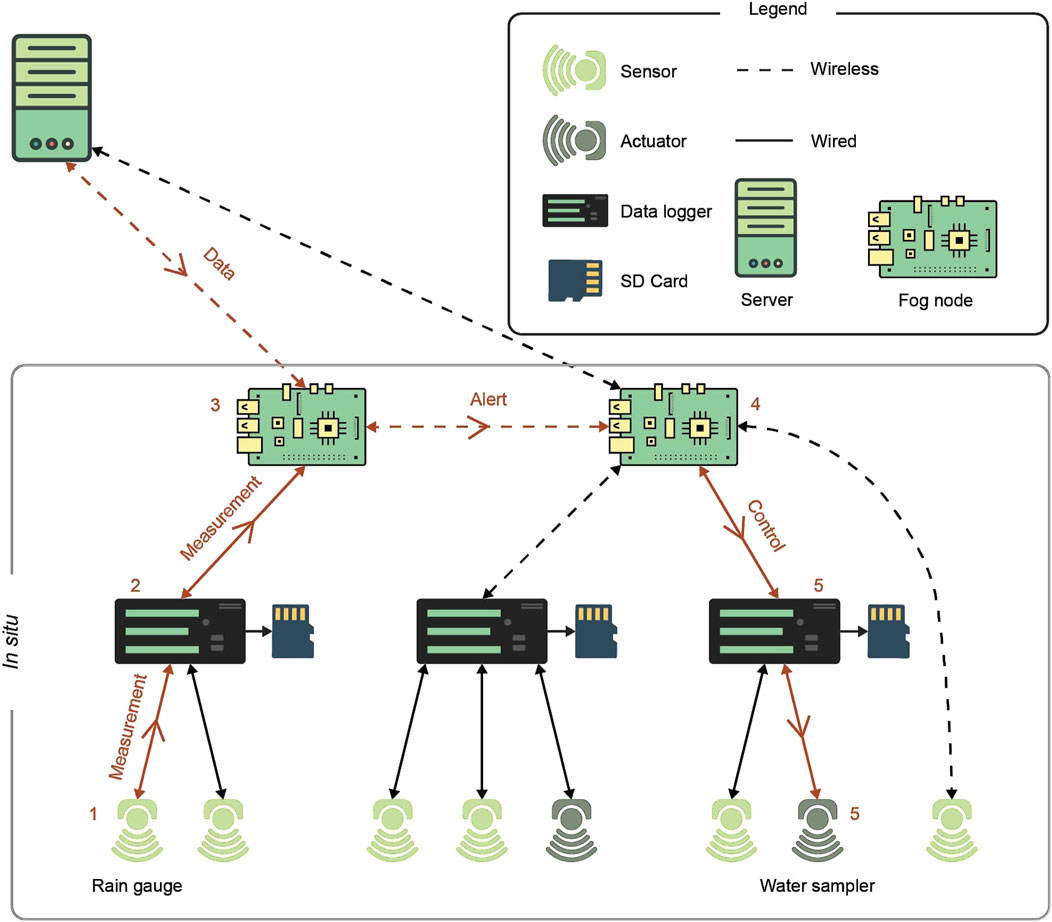
Figure 5. A representation of an event detection and response in a future environmental monitoring system based on Fog Computing. 1) Rain is detected using the rain gauge sensor and transmitted to the data logger to which the sensor is connected, 2) the data logger transforms the signal from an analogical one to a numerical one and transmits the data to a fog node, 3) an application on the fog node uses the data from the rain gauge and combines it with data fetched from a weather API sending an alert to another fog node after detecting a flood event, 4) the fog node receives a flood alert and orders the data logger to get ready, 5) the data logger receives the orders from the fog node and orders in its turn a water sampler to take samples, 6) the water sampler receives the order and takes a water sample.
Environmental monitoring systems can operate without fog or cloud, with both fog and cloud, or with only cloud, each presenting distinct trade-offs. Systems without fog or cloud depend solely on edge devices, which lack advanced processing power, resulting in a static system unable to process complex real-time data or integrate external sources effectively, as observed in some current observatory setups. Cloud-only systems centralize processing but introduce high latency and reliance on stable internet–challenges noted in Section 4. Combining fog with cloud, as proposed, enables local processing for rapid response and selective cloud transmission, addressing latency, bandwidth, and connectivity issues critical to observatories. However, environmental monitoring systems also have peculiarities that distinguish them from smart-city or Industry 4.0 scenario due to the remote locations of observatories and the harsh environments in which they are deployed. Designing a fog platform for observatories will therefore require rethinking some parts of the classical fog architecture.
5.2.1 Internal connectivity
Event detection, prediction, and response require integrating data which originate from multiple sensors, which in turn implies that fog nodes must centralize these data in a single location and return action triggers. This translates to a requirement for bidirectional communication between edge devices and the fog layer. In particular, edge devices should be able to send their collected data to the fog layer and receive data and commands from it.
In current environmental monitoring systems, sensors are typically connected to a nearby data logger via wired networking. This implies that any connectivity between the edge devices and the fog layer is likely to occur between data loggers and the fog nodes. Depending on practical considerations, this communication may be realized through wired or wireless networking.
In the event that the connection is established via wires, it may be necessary to use specific communication protocols such as MODBUS (Swales, 1999). In the case of a wireless connection, it is necessary to install additional hardware in both the data loggers and the Fog Computing layer. Multiple long-range radio technologies may be used for this such as Wi-Fi HaLow, LoRa and Zigbee. However, such technologies are fundamentally limited by stringent tradeoffs between the achievable communication range, data rate, and required energy consumption. The capability of supporting any existing or future network technology should be part of the future environmental monitoring system.
5.2.2 Connectivity to the cloud
Future environmental fog platforms will also need bidirectional Internet connectivity to communicate with the cloud and/or the researchers’ private servers. This connectivity is important for many purposes such as bringing external data to the fog, carrying alerts from the field to the researchers, and supporting remote platform control and reconfiguration. This may be difficult to achieve considering the limitations of current 2G/3G/4G cellular networks. During our interviews, several observatory managers mentioned intermittent Internet connectivity as a challenge they had to face frequently.
5.2.3 Programmability
The fog platform requires robust programmability to accommodate diverse applications in environmental monitoring. It must support concurrent data processing tasks, enabling scientists across disciplines to analyze real-time data for purposes such as detecting system failures, integrating external data, and responding to discipline-specific events. The platform should also offer flexibility in programming languages and libraries to meet varied user needs. Additionally, its programs must be adaptable, allowing updates to reflect changing conditions, such as disabling flood detection during dry seasons when water flow is absent.
5.2.4 Energy availability
Interview findings indicate that environmental monitoring systems require a minimum autonomy of 6 months and preferably power self-sufficiency. Limited energy resources in observatories, detailed in Table 3, pose a substantial constraint, with 43% of surveyed sites relying solely on solar power due to lack of grid access. The variability and unpredictability of renewable energy sources challenge fog platform design. These platforms must adapt to short- and medium-term energy forecasts (Hadjur et al., 2020), reducing operations during low-energy periods–such as nighttime or adverse weather–by adjusting data processing quality, delaying tasks, or suspending non-critical functions. Unlike energy-rich smart cities and Industry 4.0, observatories face unpredictable energy availability, driving the need for specialized fog platforms and further investigation.
6 Conclusion
Environmental observatories are crucial for enhancing our understanding of the natural environment, especially in the presence of significant human-induced changes. However, French observatories have traditionally been built in an incremental and ad-hoc manner, with limited knowledge reuse between them. This article aims to provide a comprehensive understanding of the current environmental monitoring systems in these observatories, their limitations, and the common needs they share.
The results shown in this article are based on a national survey we have conducted and the interviews that have followed it. The survey shows that despite the diversity among observatories in terms of their environmental focus, they all share common needs in terms of monitoring capabilities. Our study also reveals that these needs cannot be fully met with the existing monitoring systems due to several key challenges: the lack of in situ computational capabilities, limited Internet access, and the absence of reliable power grid connections. These limitations hinder the ability to perform real-time data processing, event detection, and system health monitoring.
To address these limitations, we demonstrate the potential benefits that a monitoring system based on Fog Computing technologies could bring to observatories. Fog Computing can enhance the efficiency and responsiveness of environmental monitoring by providing more computational power closer to the data sources. However, the unique conditions of observatories, such as remote locations and harsh environments, present significant challenges that must be addressed before environmental Fog Computing platforms can be effectively implemented.
Author contributions
AK: Formal Analysis, Investigation, Methodology, Software, Writing – original draft, Writing – review and editing. GP: Supervision, Writing – original draft, Writing – review and editing. LL: Supervision, Writing – original draft, Writing – review and editing.
Funding
The author(s) declare that financial support was received for the research and/or publication of this article. This research was supported by funding from the French government, administered by the National Agency for Research (ANR) through the Future Investment Program, integrated into France 2030, with grant reference ANR-21-ESRE-0014.
Conflict of interest
The authors declare that the research was conducted in the absence of any commercial or financial relationships that could be construed as a potential conflict of interest.
Generative AI statement
The author(s) declare that no Generative AI was used in the creation of this manuscript.
Publisher’s note
All claims expressed in this article are solely those of the authors and do not necessarily represent those of their affiliated organizations, or those of the publisher, the editors and the reviewers. Any product that may be evaluated in this article, or claim that may be made by its manufacturer, is not guaranteed or endorsed by the publisher.
Supplementary material
The Supplementary Material for this article can be found online at: https://www.frontiersin.org/articles/10.3389/fenvs.2025.1568016/full#supplementary-material
Footnotes
1 https://github.com/Ammar96399/survey-data-transformation/
2 https://survey-results.kazem.fr/
3 https://www.campbellsci.com/
7 https://deims.org/249ac142-c0d3-4818-b521-ddcf5609ec0f
8 https://help.campbellsci.com/crbasic/cr6/
9 https://donneespubliques.meteofrance.fr/
10 https://hydro.eaufrance.fr/
References
Ahmed, A., Arkian, H., Battulga, D., Fahs, A. J., Farhadi, M., Giouroukis, D., et al. (2019). Fog computing applications: taxonomy and requirements. Corr. abs/1907, 11621 doi:10.48550/arXiv.1907.11621
Battulga, D., Farhadi, M., Tamiru, M. A., Wu, L., and Pierre, G. (2022). “LivingFog: leveraging fog computing and LoRaWAN technologies for smart marina management (experience paper),” in Proceedings of the 25th conference on innovation in clouds, internet and networks (ICIN), 1–8. doi:10.1109/ICIN53892.2022.9758124
Bogena, H. R. (2016). TERENO: German network of terrestrial environmental observatories. 2, A52. doi:10.17815/jlsrf-2-98
Bonomi, F., Milito, R., Zhu, J., and Addepalli, S. (2012). “Fog computing and its role in the internet of things,” in Proceedings of the first edition of the MCC workshop on mobile cloud computing. Helsinki, Finland: (ACM), 13–16. doi:10.1145/2342509.2342513
Brantley, S. L., McDowell, W. H., Dietrich, W. E., White, T. S., Kumar, P., Anderson, S. P., et al. (2017). Designing a network of critical zone observatories to explore the living skin of the terrestrial Earth. Earth Surf. Dyn. 5, 841–860. doi:10.5194/esurf-5-841-2017
Bretagnolle, V., Benoit, M., Bonnefond, M., Breton, V., Church, J., Gaba, S., et al. (2019). Action-orientated research and framework: insights from the French long-term social-ecological research network. Ecol. Soc. 24, art10. doi:10.5751/ES-10989-240310
Corke, P., Wark, T., Jurdak, R., Hu, W., Valencia, P., and Moore, D. (2010). Environmental wireless sensor networks. Proc. IEEE 98, 1903–1917. doi:10.1109/JPROC.2010.2068530
Elhacham, E., Ben-Uri, L., Grozovski, J., Bar-On, Y. M., and Milo, R. (2020). Global human-made mass exceeds all living biomass. Nature 588, 442–444. doi:10.1038/s41586-020-3010-5
Esmaeilian, B., Wang, B., Lewis, K., Duarte, F., Ratti, C., and Behdad, S. (2018). The future of waste management in smart and sustainable cities: a review and concept paper. Waste Manag. 81, 177–195. doi:10.1016/j.wasman.2018.09.047
Gaillardet, J., Braud, I., Hankard, F., Anquetin, S., Bour, O., Dorfliger, N., et al. (2018). OZCAR: the French network of critical zone observatories. Vadose Zone J. 17, 1–24. doi:10.2136/vzj2018.04.0067
Giang, N. K., Leung, V. C., and Lea, R. (2016). “On developing smart transportation applications in Fog Computing paradigm,” in Proceedings of the 6th ACM symposium on development and analysis of intelligent vehicular networks and applications, 91–98. doi:10.1145/2989275.2989286
Hadjur, H., Ammar, D., and Lefèvre, L. (2020). “Analysis of energy consumption in a precision beekeeping system,” in Proceedings of the 10th international conference on the internet of Things. doi:10.1145/3410992.3411010
Hart, J. K., and Martinez, K. (2006). Environmental Sensor Networks: a revolution in the earth system science? Earth-Science Rev. 78, 177–191. doi:10.1016/j.earscirev.2006.05.001
Hart, J. K., and Martinez, K. (2015). Toward an environmental internet of things. Earth Space Sci. 2, 194–200. doi:10.1002/2014EA000044
IPBES (2019). Summary for policymakers of the global assessment report on biodiversity and ecosystem services. Tech. Rep. Zenodo. doi:10.5281/zenodo.3553579
Leclère, D., Obersteiner, M., Barrett, M., Butchart, S. H. M., Chaudhary, A., De Palma, A., et al. (2020). Bending the curve of terrestrial biodiversity needs an integrated strategy. Nature 585, 551–556. doi:10.1038/s41586-020-2705-y
Lévêque, C., Pavé, A., Abbadie, L., Weill, A., and Vivien, F.-D. (2000). Les zones ateliers, des dispositifs pour la recherche sur l’environnement et les anthroposystémes: Une action du programme « environnement, vie et sociétésdu CNRS. Natures Sci. Sociétés 8, 43–52. doi:10.1016/S1240-1307(01)80005-4
Martinez, K., Hart, J., and Ong, R. (2004). Environmental sensor networks. IEEE Comput. 37, 50–56. doi:10.1109/MC.2004.91
Mirtl, M., T. Borer, E., Djukic, I., Forsius, M., Haubold, H., Hugo, W., et al. (2018). Genesis, goals and achievements of Long-Term Ecological Research at the global scale: a critical review of ILTER and future directions. Sci. Total Environ. 626, 1439–1462. doi:10.1016/j.scitotenv.2017.12.001
Nord, G., Boudevillain, B., Berne, A., Branger, F., Braud, I., Dramais, G., et al. (2017). A high space–time resolution dataset linking meteorological forcing and hydro-sedimentary response in a mesoscale Mediterranean catchment (Auzon) of the Ardèche region, France. Earth Syst. Sci. Data 9, 221–249. doi:10.5194/essd-9-221-2017
Perera, C., Qin, Y., Estrella, J. C., Reiff-Marganiec, S., and Vasilakos, A. V. (2017). Fog computing for sustainable. Smart Cities A Surv. doi:10.48550/arXiv.1703.07079
Quy, V. K., Hau, N. V., Anh, D. V., and Ngoc, L. A. (2022). Smart healthcare IoT applications based on fog computing: architecture, applications and challenges. Complex and Intelligent Syst. 8, 3805–3815. doi:10.1007/s40747-021-00582-9
Rahmani, A. M., Gia, T. N., Negash, B., Anzanpour, A., Azimi, I., Jiang, M., et al. (2018). Exploiting smart e-Health gateways at the edge of healthcare Internet-of-Things: a fog computing approach. Future Gener. Comput. Syst. 78, 641–658. doi:10.1016/j.future.2017.02.014
Rani, S., Kataria, A., and Chauhan, M. (2022). Fog computing in Industry 4.0: applications and challenges—a research roadmap. Springer Singapore, 173–190. doi:10.1007/978-981-16-3448-2_9
Richter, D. d., and Billings, S. A. (2015). “One physical system”: tansley’s ecosystem as Earth’s critical zone, New Phytol. 206, 900–912. doi:10.1111/nph.13338
White, T., Brantley, S., Banwart, S., Chorover, J., Dietrich, W., Derry, L., et al. (2015). “The role of critical zone observatories in critical zone science,”. Developments in earth surface processes. Editors J. R. Giardino, and C. Houser (Elsevier), 19, 15–78. doi:10.1016/B978-0-444-63369-9.00002-1
Wood, L. E. (1946). Automatic weather stations. J. Atmos. Sci. 3, 115–121. doi:10.1175/1520-0469(1946)003<0115:aws>2.0.co;2
Yousefpour, A., Fung, C., Nguyen, T., Kadiyala, K., Jalali, F., Niakanlahiji, A., et al. (2019). All one needs to know about fog computing and related edge computing paradigms: a complete survey. J. Syst. Archit. 98, 289–330. doi:10.1016/j.sysarc.2019.02.009
Keywords: environmental observatories, fog computing, critical zone, data logging, Environmental sensor network
Citation: Kazem A, Pierre G and Longuevergne L (2025) Enhancing environmental observatories with fog computing. Front. Environ. Sci. 13:1568016. doi: 10.3389/fenvs.2025.1568016
Received: 29 January 2025; Accepted: 21 March 2025;
Published: 04 April 2025.
Edited by:
Manish Pandey, Marwadi University, Rajkot, IndiaReviewed by:
Vikas Kamal, Bernard Consultants Private Limited, IndiaI Made Murwantara, University of Pelita Harapan, Indonesia
Copyright © 2025 Kazem, Pierre and Longuevergne. This is an open-access article distributed under the terms of the Creative Commons Attribution License (CC BY). The use, distribution or reproduction in other forums is permitted, provided the original author(s) and the copyright owner(s) are credited and that the original publication in this journal is cited, in accordance with accepted academic practice. No use, distribution or reproduction is permitted which does not comply with these terms.
*Correspondence: Ammar Kazem, YW1tYXIua2F6ZW1AaXJpc2EuZnI=