 Lina Liu
 Fen Ouyang
- Jiangxi Provincial Key Laboratory of Water Resources Allocation and Efficient Utilization, Nanchang Institute of Technology, Nanchang, China
Investigating the spatiotemporal dynamics and underlying determinants of water consumption structure is of great importance for the strategic allocation of regional water resources and the promotion of economic and societal sustainability. This study, using Jiangxi province located in the Central China as a case study, employed information entropy and the center of gravity model to explore the spatiotemporal variations in water consumption patterns from 1999 to 2015. Additionally, the principal driving forces behind these changes were elucidated through factor analysis and grey correlation methods. The results indicated a consistent upward trajectory in Jiangxi’s total water consumption over the past two decades, with agricultural water accounting for the majority but gradually decreasing. The water consumption structure in Jiangxi province remained relatively stable, evolving towards a more equitable distribution. Notably, the spatial configuration of water consumption revealed obvious regional disparities, with high information entropy values predominantly in the northern areas, including Nanchang, Jingdezhen, and Jiujiang, while lower values in the southeastern regions. The epicenter of water consumption gradually shifted towards southern Jiangxi. Concurrently, the agricultural water use center migrated toward the northern, whereas the industrial and domestic water use centers moved southwards. Contrasting natural influences, socioeconomic factors, exemplified by population, urban population proportion, total output value of agriculture, forestry, animal husbandry, and fisheries, industrial output value, GDP, effective irrigation area, grain output value, and urban green coverage area, emerged as predominant, contributing to 67.7% of the alterations in water consumption patterns.
1 Introduction
With the rapid economic development, burgeoning population dynamics, and the obvious impacts of global climate change, the supply-demand contradiction of water resources is becoming more pronounced, especially in developing countries (Gondim et al., 2018); Yao et al., 2019; Rondinel-Oviedo and Sarmiento-Pastor, 2020). As a limited natural resource, water has gradually become a key factor restricting sustainable development of regional economic society (Hanjra and Qureshi, 2010; Zhou et al., 2017). How to achieve reasonable water resources utilization to promote a harmonious balance between economic-social development and water resource sustainability has attracted wide attention from the public and governments all over the world (Katila et al., 2019; Ravar et al., 2020).
The water consumption structure, usually defined as the proportion of production, domestic and ecological water use in a nation’s or region’s total water use within a certain period, is a crucual indicator. It reflects the diverse demands of socio-economic development for water resources and shows the differences in regional water use systems (He et al., 2016; Wei et al., 2018). Consequently, rational water consumption structure is critical to alleviate the supply-demand contradiction of water resources, thereby facilitating the sustainable management of water resources. Moreover, due to the regional differences in economic development, industrial structure, population dynamic, and water use practices, each region needs to develop a water consumption policy suitable for its specific hydrological conditions (Kampas et al., 2012; Murwirapachena, 2021). However, the effectiveness of these policies depends on a comprehensive understanding of the factors influencing water consumption dynamics (Yang and Chen, 2019). Therefore, with the incresing pressures of growing water demand for various purposes, exploring the spatiotemporal variations of water consumption structure and identifying its driving factors are crucial for understanding the characteristics of water use system, formulating differentiated resource policies, and achieving rational water resources allocation and coordinated socio-economic development.
In response to the growing water crisis, an increasing number of studies have focused on the complexities of water consumption structure. This body of research mainly analyzed the evolving characteristics and determinants of water consumption patterns (Liu et al., 2006; Su et al., 2008; Wang et al., 2013; Liu and Zuo, 2014; He et al., 2016; Wu et al., 2016; Zhang et al., 2016; Chen et al., 2020b), predicted future water consumption trends (Donkor et al., 2014; Chhipi-Shrestha et al., 2017; Roushangar and Alizadeh, 2018; Wei et al., 2018; Dong et al., 2022), explored the relationship between water and industrial structure (Reynaud, 2003; Mall et al., 2006; Jiao et al., 2021), and other related topics (Hussien et al., 2016; Pastor and Fullerton, 2020). Many of these studies examined shifts in water consumption patterns using various methods. Notably, over the past several decades, methods like information entropy (Liu et al., 2006), Lorenz curves and Gini coefficients (Liu and Zuo, 2014), and ecological niche (Chen et al., 2020b) have been proposed. Of these, the information entropy method is the most widely used due to its straightforward computational process and the lucid conveyance of outcomes. For example, Liu et al. (2006) first applied information entropy theory to analyze the water use system, studying the dynamics of water use structure in the Guanzhong region of the Weihe River basin by constructing information entropy and equilibrium indices. Wang et al. (2013) used information entropy to explore the evolution and causes of water use structure in Haihe River basin. In addition, to better understand the water consumption structure, research on its driving factors has been carried out using various mathematical and statistical methods, such as the logarithmic mean Divisia index (LMDI) (Yang and Chen, 2019), principal component analysis (Su et al., 2008), grey correlation analysis (Zhang et al., 2016), and regression analysis (Da Veiga et al., 2022). For example, Su et al. (2008) used principal component analysis to identify the driving factors behind water consumption structure in Guanzhong region of Weihe River basin. Similarly, Wu et al. (2016) conducted a correlation degree analysis between various factors and water consumption in domestic, industrial, agricultural, and ecological sectors in Nanjing, China through grey correlation analysis. In Brazil, Da Veiga et al. (2022) built a multiple linear regression model to elucidate the impact of related factors such as society, economy, population, climate, geography, and water supply services on the per capita water consumption.
Due to the spatiotemporal heterogeneity of water resources and social-economic development, water consumption structure usually exhibits distinct spatiotemporal variations during its evolution (Shi et al., 2021). However, most existing studies have mainly focused on its temporal changes in water consumption (Liu et al., 2022), thus ignoring the crucial spatial variations. This oversight limits a comprehensive understanding of the evolutionary characteristics of water consumption structures. Recently, some scholars have conducted research on exploring variations of water consumption structure from a spatial perspective (He et al., 2016; Wu et al., 2021; Sun et al., 2022; Zheng et al., 2022), but most of these studies are limited to comparative analyses across different regions, lacking sufficient attention to spatial evolutionary dynamics. Consequently, such studies fail to fully clarify the complex spatial evolution characteristics of water consumption structure, such as migration patterns and spatial distribution. In addition, current research has primarily focused on regions characterized by water scarcity, with a notable shortage of studies related to water-abundant regions.
Located on the southern bank of the middle and lower Yangtze River, Jiangxi Province has relatively abundant water resources compared to other provinces in China. However, influenced by terrain and the monsoon climate, it suffers from severely uneven temporal and spatial water resource distribution. This leads to limited seasonal water availability, hindering sustainable water resource management (Liu et al., 2020; Lu et al., 2022). As a typical Central China province with an economy less developed than those of the Pearl River Delta and eastern regions, Jiangxi has an agriculture-dominated and unbalanced, evolving industrial structure (Cheng et al., 2022). In recent years, traditional industries are undergoing reform and upgrading. In 2015, Jiangxi’s total water consumption was 24.58 billion m3, with agricultural water use accounting for 15.49 billion m3 (63% of the total). Economic growth and accelerated urbanization have increased industrial and domestic water demands. This continuous rise in water demand exacerbates the water resource supply-demand gap across the province, severely limiting the sustainable development of the regional economic society (Hu et al., 2019b; Hu et al., 2020).
Numerous studies have investigated Jiangxi’s water resources. Lu et al. (2022) used the DPSIR framework to evaluate water resources security, revealing significant differences in water security among cities, particularly in pressures and Response factors. Hu et al. (2020) used the principal component analysis to analyze the trends in Jiangxi’s water resources carrying capacity. Further, Hu et al. (2019b) explored the decoupling relationship between water consumption and economic growth, employing LMDI to identify the driving forces. In recent years, an increasing number of researchers have employed the gravity center model in the analysis of water use structures. Yin et al. (2017) harnessed the gravity center analysis model to meticulously examine the time-series movement trajectories of water use structures across 31 provinces in China from 2004 to 2015. This study delved into exploring and analyzing the structural changes in various types of water resource utilization. Zhou et al. (2017) adopted the gravity center model, offering an in-depth exploration of the spatial changes in the water use structure of Hubei Province from 2003 to 2012. The findings of this research revealed that the agricultural water use pattern exhibited distinct spatial dependence, providing valuable insights into regional water use characteristics. Meanwhile, Hu et al. (2019a) innovatively applied the gravity center migration model in conjunction with the panel quantile regression analysis method. With this approach, they conducted a detailed investigation on the spatio-temporal patterns, developmental processes, and underlying mechanisms of the structural transformation from agricultural to non-agricultural water use across different Chinese provinces during the period from 2003 to 2015. Furthermore, Wang et al. (2023) leveraged the gravity center model to comprehensively calculate the evolutionary paths of the centers of gravity for water use, population, and economic development in China spanning from 1965 to 2019. However, studies on the evolution of Jiangxi’s water consumption structure, especially its spatial characteristics like moving trajectories and distribution patterns, remain scarce. This study, focusing on Jiangxi as a representative Central China province, aims to fill this gap by examining the temporal and spatial variations of its water consumption structure and identifying the driving factors.
This study aims to: (1) use the information entropy and gravity center model to explore the spatial and temporal dynamics of Jiangxi’s water consumption structure; (2) identify the main driving factors through factor analysis and grey correlation methods. These efforts aim to provide practical insights for Jiangxi’s water resource management and strategy development.
2 Study area and data
2.1 Study area
Jiangxi Province is situated on the southern bank of the middle and lower Yangtze River between 24°29′-30°04′N and 113°34′-118°28′E (Figure 1). It serves as a critical juncture connecting the economic powerhouses of the Pearl River Delta, the Yangtze River Delta, and the Southern Fujian Delta, as well as an integral component of Yangtze River Economic Belt. The total area of Jiangxi is 16.69 × 10⁴ km2 with a total population exceeding 46.47 million, covering 11 cities, namely, Nanchang, Ganzhou, Fuzhou, Shangrao, Yichun, Jiujiang, Ji’an, Jingdezhen, Yingtan, Xinyu and Pingxiang. The topography of Jiangxi is characterized by a diverse landscape, with high mountainous and hilly regions predominating the west, east, and south, transitioning to alluvial plains in the north. Specifically, mountains constitute 36%, hills 42%, and plains 22% of the province’s total land area. In addition, Jiangxi is famous for Poyang Lake, China’s largest freshwater lake, located in the province’s northern part. This lake is fed by five major rivers—Ganjiang, Xinjiang, Xiuhe, Fuhe, and Raohe—and then finally discharges into the Yangtze River.
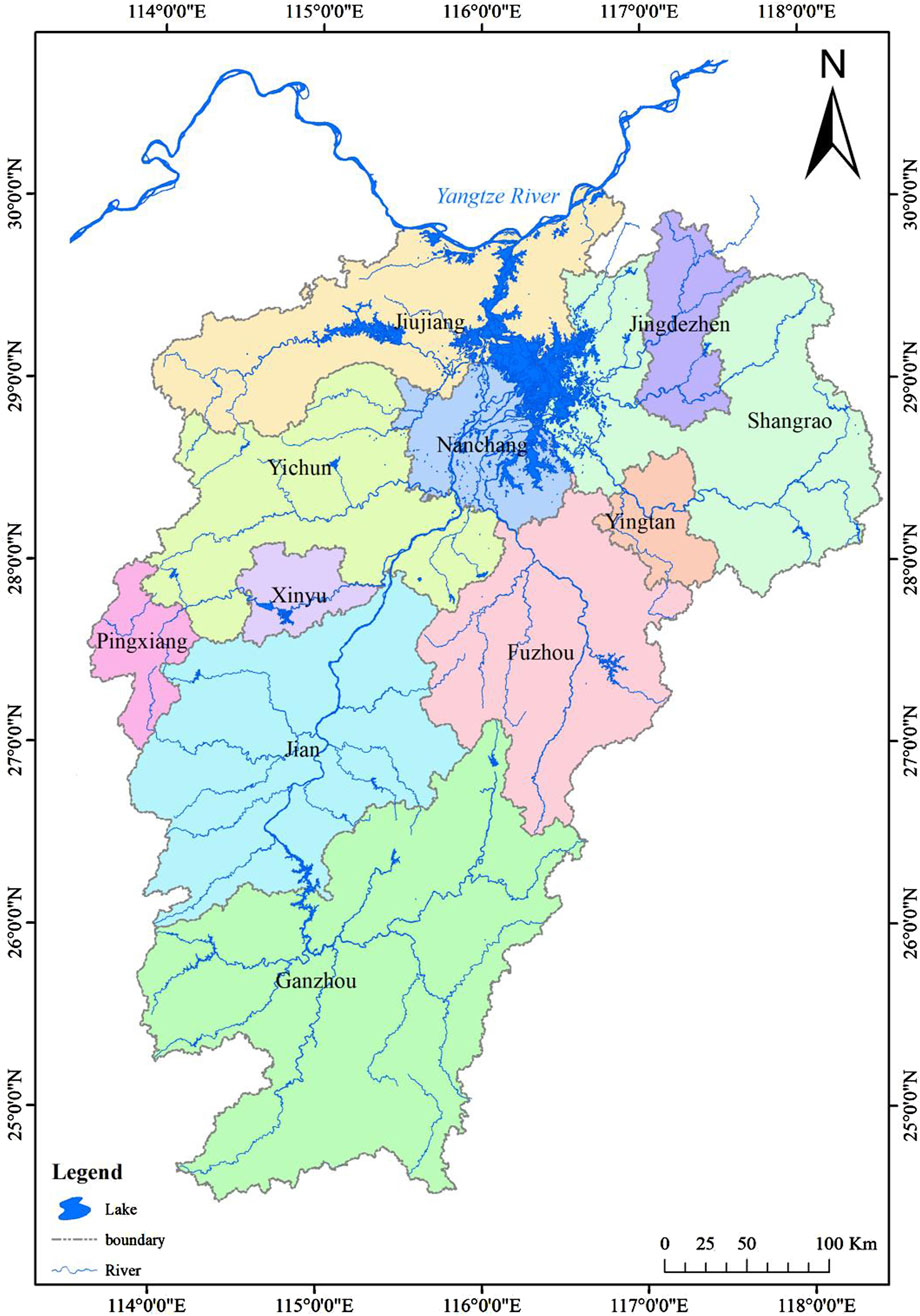
Figure 1. Location map of Jiangxi Province, China.
The climate of Jiangxi Province is distinguished by typical subtropical humidity, primarily influenced by the East Asian monsoon and South Asian monsoon. It records an average annual temperature of 18.4°C and the average annual precipitation of 1,638 mm. Influenced by its climate and geography, precipitation distribution exhibits significant unevenness, with nearly 50% of annual precipitation concentrated from March to June. Moreover, the province experiences significant inter-annual variability in precipitation, which leads to the frequent occurrence of drought and flood disasters in Jiangxi. Despite possessing relatively abundant water resources, estimated at an annual average of 156.5 billion m3, Jiangxi faces challenges in water resources distribution due to differences in terrain. This results in significant disparities in water availability across different regions and seasons.
2.2 Data sources
Water consumption data within this investigation were obtained from the Jiangxi Water Resources Bulletin. Meteorological data, including monthly precipitation and temperature records, were acquired from the China Meteorological Data Network (http://data.cma.cn). Additionally, socio-economic indicators, such as the gross domestic product (GDP) and effective irrigation area, were collected from the Jiangxi Statistical Yearbook, accessible via China’s economic and social big data research platform. To ensure the integrity and accessibility of the dataset, the timeframe from 1999 to 2015 was selected for the analysis of Jiangxi’s water consumption structure.
3 Methods
3.1 Information entropy
Originally a thermodynamic concept, entropy was first proposed by Shannon in 1948 and introduced into information theory to describe the uncertainty within a system (Shanno, 1938; Liu et al., 2006). Therefore, in this study, information entropy was employed to delineate the evolutionary dynamics of the water consumption system in Jiangxi Province, which can explore the water consumption distribution across various sectors. Let the total water consumption within a specific region or basin be denoted as Q (m3), with qi (m3) representing the water consumption by the ith sector. According to Shannon formula, the information entropy of the water consumption system of this region or basin, is calculated as follows:
where H represents the information entropy; n denotes the number of water consumption sectors; pi is the proportion of water consumption by the ith sector, that is, pi = qi/Q, and there are
The higher the H value is, the more evenly distributed the water consumption across various sectors is, and the higher the stability of water consumption system is, and vice versa.
Considering that the information entropy values of water consumption structure calculated across various sectors n is not comparable at different time scales, the equilibrium degree is introduced, and can be written as follows:
where J is the equilibrium degree of water consumption system; Hm is the maximum information entropy. A higher value of J denotes a more balance among water consumption sectors, which indicates a more complex and stable structure in the water consumption system of a region or basin.
3.2 Factor analysis
Factor analysis is a multivariate statistical technique aimed at dimensionality reduction. It seeks to identify a large number of observed variables into a concise set of factors, thereby elucidating the most significant variables that account for the majority of observed variance (DeCoster, 1998). The core principle of factor analysis involves distilling essential information from a dataset, thereby achieving data compression with minimal loss of original information. This method enables the grouping of variables based on their correlations, facilitating an understanding of underlying patterns (Shrestha and Kazama, 2007). Therefore, factor analysis serves as an instrumental tool in simplifying the complexity of datasets comprising numerous interrelated variables. It achieves this by employing common factors to represent the aggregate of linear combinations and a specific factor to describe each variable originally observed, thus explaining their interrelations and substantially reducing the dataset’s dimensionality (Singh et al., 2004).
Water consumption structure is influenced by various factors, including industrial structure, population, development level, and so on, and there is also a certain correlation between various factors (Chen et al., 2020a). Therefore, this study utilized factor analysis to extract the most paramount factors from the different variables present within the dataset, thereby determining the main driving force behind changes in water consumption structure (DeCoster, 1998).
3.3 Grey correlation analysis
Introduced by Deng in 1982, grey system theory represents a novel methodology designed to address issues associated with small sample sizes and insufficient information (Deng, 1982). A key component of this theory, grey correlation analysis, facilitates the assessment of correlation degrees among various factors within a system (Wu et al., 2016). This method judges whether the relationship between factors is close according to the similarity of the changes of their data series. In this study, grey correlation analysis was utilized to identify the predominant factors affecting water consumption structure and to elucidate the interrelationships among these factors, thereby enabling a deeper understanding of the dynamics influencing water consumption patterns.
The water use data series X0 = {x01,x02, … x0m} is set as the reference sequence and influencing factors data series Yi = {yi1,yi2, … ,yim} is set as the comparison sequence. After dimensionless processing, the correlation coefficientγi(k) between x0 and yi at k can be computed using the following equation:
Where ρ represents the resolution coefficient, ρ∈(0,1). Generally, the value of ρ is taken as 0.5.
The grey correlation degree between X0 and Yi can be obtained from Equation 4.
Generally, the larger the grey correlation degreeγi is, the greater the influence from ith factors on the water use structure is, and vice versa.
3.4 Gravity center model
As a physical concept derived from classical mechanics, the gravity center refers to the point in the gravitational field where the combined force of the gravity in all directions passes and can maintain a balance (Fu et al., 2011; Li et al., 2018). Extending the concept of the gravity center to water consumption studies, the gravity center represents a hypothetical point where, by considering water consumption volumes as analogs for mass, forces associated with water consumption achieve a relative balance within a defined spatial domain. Gravity center analysis is a pivotal tool in mapping the directional movement and migration distance of targeted objects towards or away from this equilibrium point, thereby delineating their spatial evolution over time. This method has found extensive application across various disciplines, including land use, urban planning, and drought management (Liang et al., 2021). In this study, gravity center model was employed to explore the spatial evolutionary trajectory of the water use structure’s barycenter in Jiangxi Province from 1999 to 2015.
The formula used to calculate the gravity centers for water consumption can be described as follows:
where Xj, Yj are the longitude and latitude coordinates of the center of gravity for water consumption in the year j, respectively; xi, yi are the longitude and latitude coordinates of the geographic center of spatial unit i, respectively; Ti denotes the percentage values of water consumption by the ith sector; n is the total number of the spatial units in the study area, and here is the number of counties in Jiangxi Province (n = 11).
A change in the value of water consumption indicates a shift in the water consumption’s center of gravity, with the movement direction oriented towards regions experiencing an increase in water consumption. The magnitude of this displacement serves as an indicator of the spatial disparity in water consumption distribution. Therefore, the trajectory traced by the center of gravity encapsulates the spatial variations in water consumption within the region, thus offering insights into the evolving patterns of water use and the resultant spatial difference.
4 Results and discussion
4.1 Variation of water consumption
Figure 2 illustrated the changes in water consumption among different sectors within Jiangxi Province. The total water consumption in Jiangxi Province gradually increased from 21.71 billion m3 in 1999 to 24.58 billion m3 in 2015, corresponding to an average annual growth rate of 13.2%. However, this period was characterized by variability in trends: from 1999 to 2003, the total water consumption experienced a decline, falling from 21.71 billion m3 to 17.26 billion m3—a reduction of 4.458 billion m3. Subsequently, from 2003 onwards, the total water consumption presented an increasing trend with an average annual growth rate of 2.2%, despite a decrease in the last 3 years.
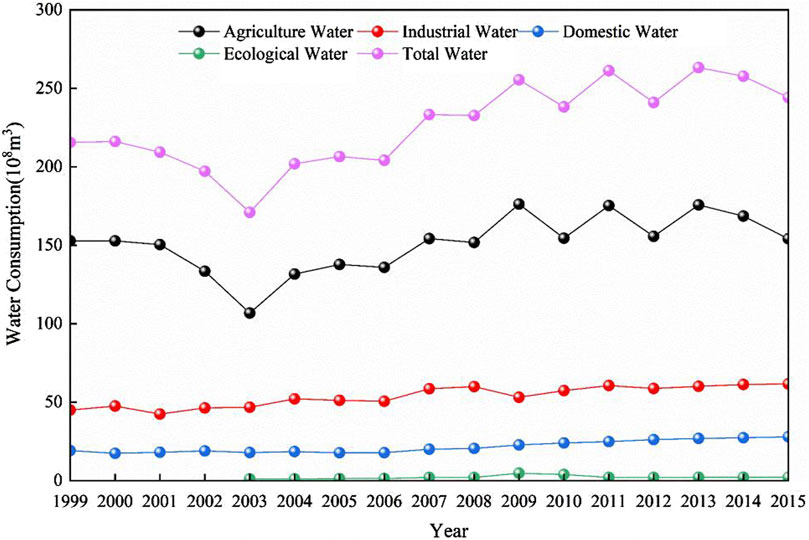
Figure 2. Changes of water consumption in Jiangxi Province.
In Jiangxi Province, agriculture was the main water use sector, constituting over 60% of the total water consumption. The change of agricultural water consumption was consistent with that of total water consumption, decreasing from 15.29 billion m3 in 1999 to 10.68 billion m3 in 2003, and then kept increasing after 2003.From 2009 to 2015, it fluctuated slightly and tended to be stable. However, the proportion of the agricultural water consumption in the total decreased from 70.4% in 1999 to 63.1% in 2015. Concurrently, economic development and population growth led to increases in both industrial and domestic water use. From 1999 to 2015, industrial water consumption increased by 1.66 billion m3, and domestic water consumption grew by 872 million m3, elevating their shares of total water consumption from 20.7% to 25.1% and from 8.8% to 11.5%, respectively. The ecological water consumption generally exhibited an upward trend, with a total increase of 104 million m3 from 2003 to 2015, yet its proportion in the total water consumption remained minimal, shifting from 1.0% to 2.0%.
As shown in Table 1, agricultural water consumption remained the predominant water use across all cities within Jiangxi. Notably, in cities such as Ganzhou, Ji’an, Fuzhou and Shangrao, the proportion of agricultural water consumption exceeded 74.0% of the total, though its average growth rate was minimal or even declines. Conversely, the shares of industrial, domestic, and ecological water consumption were comparatively modest. The proportion of industrial water use showed an increasing trend, constituting over 25.0% of the total water consumption in these cities, with the highest proportion in Xinyu. For domestic and ecological water use, the proportion was relatively small, with the sum of the two less than 20.0%. In contrast, the water consumption structure in Nanchang, Pingxiang, Jingdezhen, Jiujiang, Xinyu and Yichun was relatively balanced with agricultural water use falling below 60.0%, especially in Nanchang and Pingxiang.
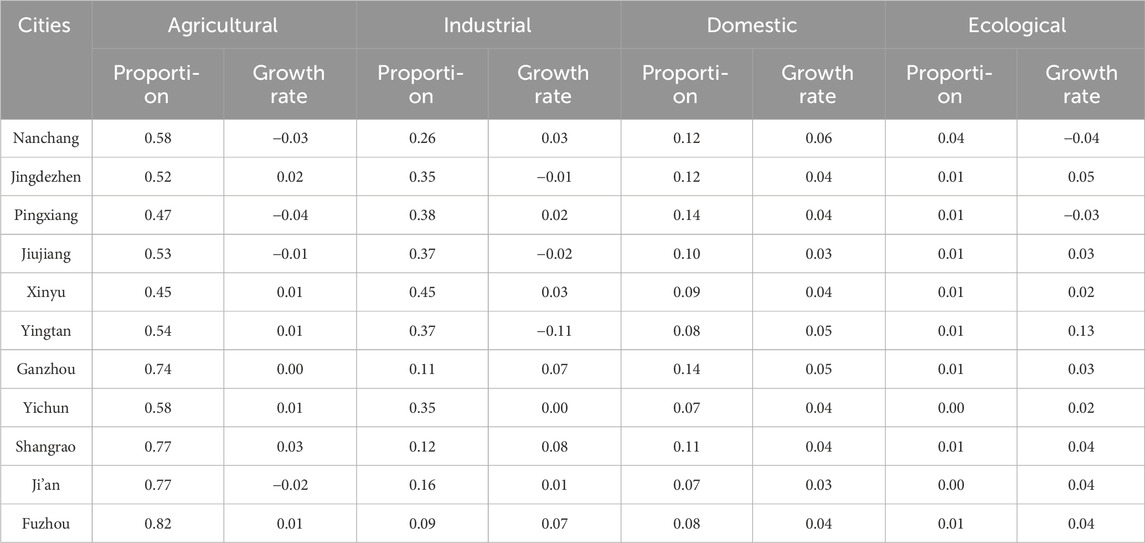
Table 1. The proportion and growth rate of water consumption in various sectors of Jiangxi Province.
4.2 Entropy value analysis of water consumption
4.2.1 Temporal evolution analysis of water consumption
The information entropy and equilibrium degree of water consumption system in Jiangxi Province were illustrated in Figure 3. The information entropy value in Jiangxi Province exhibited a fluctuating upward trend. Before 2001, the information entropy value was relatively small, below 0.8 nat. During 2001–2003, the information entropy value increased rapidly, with an increase of 0.15 nat within 2 years; after 2004, the information entropy value remained balanced between 0.86 and 0.90 nat. From Figure 3, it can be seen that the equilibrium degree did not change significantly in 1999–2001, and remained between 0.56–0.57. In 2002, the equilibrium degree increased to 0.60, and from 2002 to 2015, the equilibrium degree first slowly decreased and then fluctuated with a slight increase trend. Overall, the change of equilibrium degree was basically similar with that of information entropy. From the changes in information entropy and equilibrium degree, the Jiangxi’ total water use structure was relatively stable from 1999 to 2015. The dominance of water consumption by a single water use sector gradually declined, reflected in the reduction of the proportion of agricultural water use and the rise in that of non-agricultural water use, especially after 2010. This change was the result of implementing the strictest water resources management system in the province. The details of the strictest water resources management policies are as follows: Firstly, strictly enforce the control of total water consumption and the water intake permit system, implement the policy of paid use of water resources, and make reasonable adjustments to the standards for collecting water resource fees. Secondly, strengthen the strict management and protection of groundwater, and enhance the unified scheduling of water resources. Thirdly, comprehensively promote water conservation efforts, implement water consumption quota management, and accelerate the advancement of water-saving technological transformation. Which was reflected in improving water use efficiency, in turn promoting the adjustment of water consumption structure, and thus making the water use system develop in a more balanced direction.
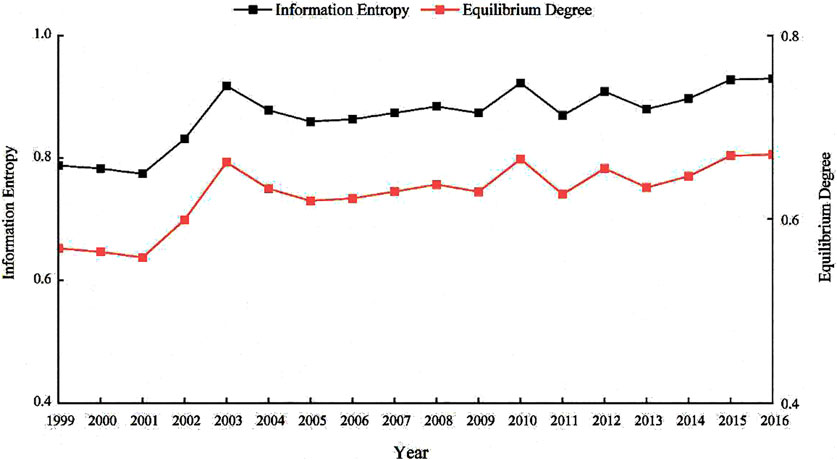
Figure 3. Changes of information entropy and equilibrium degree of water consumption system in Jiangxi province.
4.2.2 Spatial evolution analysis of water consumption
The spatial distribution of information entropy of Jiangxi’s water consumption system from 2007 to 2015 was obtained through ArcGIS technology, as shown in Figure 4. Based on the information entropy value, Jiangxi was divided into two parts: high and low value areas, demarcated by a northeast-southwest boundary. The high-value areas of the information entropy were primarily concentrated in the northwest Jiangxi such as Jingdezhen, Jiujiang, Nanchang, Xinyu and Pingxiang. Conversely, the low-value areas were mostly distributed in southeast, including Fuzhou, Ji’an and Shangrao. In 2011, the range of low-value areas decreased, mostly concentrated in Ji’an and Fuzhou. From 2013 to 2015, there was no obvious change in the high and low value areas of information entropy.
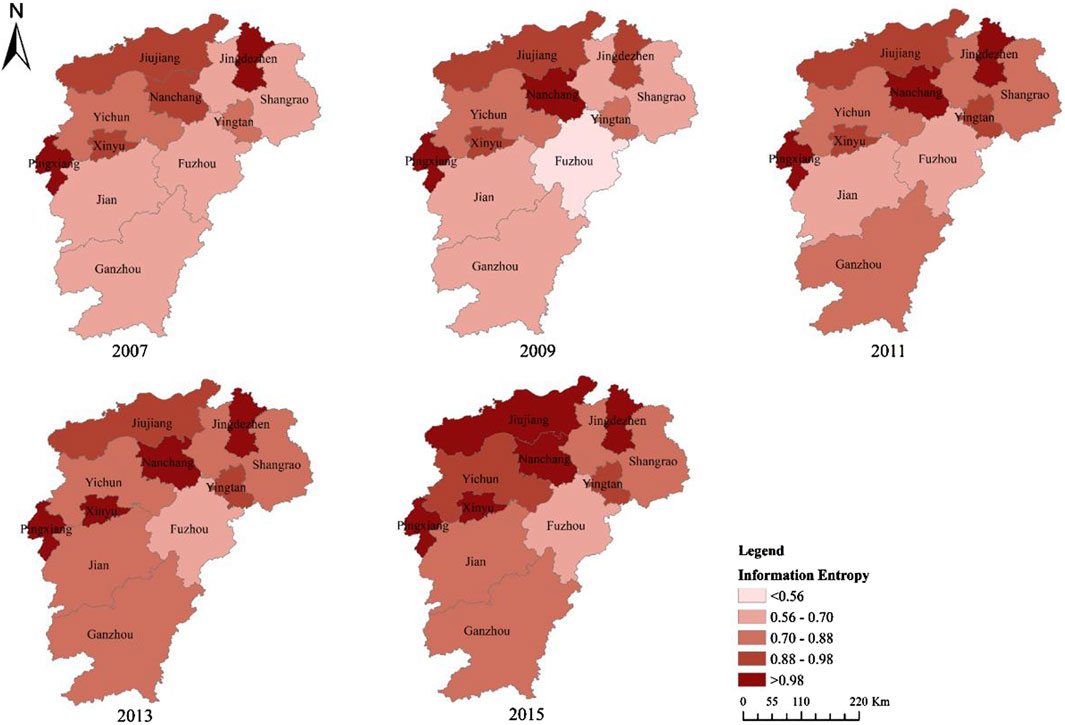
Figure 4. Spatial distribution of information entropy of water consumption system in Jiangxi province.
In general, the information entropy values in Nanchang, Jingdezhen, Pingxiang, Jiu jiang, Xinyu, Yingtan and Yichun consistently exceeded the provincial average, while the information entropy in Ganzhou, Shangrao, Ji’an and Fuzhou was below the average. This indicated that the northwest regions had a more balanced water consumption structure than other regions. This is mainly because the economy in the northwest region was relatively developed, and there was a balance in water use for different sectors. In contrast, regions such as Ji’an, Fuzhou and Shangrao, were dominated by agriculture, which meant that agricultural water use in these regions had a large proportion in the water consumption system, combined with less industrial development, leading to unbalanced water use. Compared to other cities, the water use in Ganzhou has undergone notable changes in recent years. The rising information entropy suggests a more even distribution of water consumption across industries, enhancing the stability of the water use system. It was primarily driven by urban population growth and enhancements of living quality. The data from the Jiangxi Provincial Bureau of Statistics showed that the urban population proportion in Ganzhou increased from 36.8% in 2007 to 37.5% in 2010 and further to 46.3% in 2015. This aligns with the conclusion in “4.4.1 Factor analysis” that the urban population ratio and urban green coverage area are the two key determinants of the water use structure. These factors have contributed to an increase in domestic water use in Ganzhou, resulting in a continuous improvement in the water consumption system’s equilibrium degree and a movement towards a more balanced state.
4.3 Analysis of gravity center migration trajectory of water consumption
To further explore the spatiotemporal variations of water consumption structure in Jiangxi Province, we adopted the gravity center model to investigate evolutionary migration of the gravity center for the information entropy, agricultural, industrial, and domestic water use over time. The trajectory of the gravity center movement was shown in Figure 5.
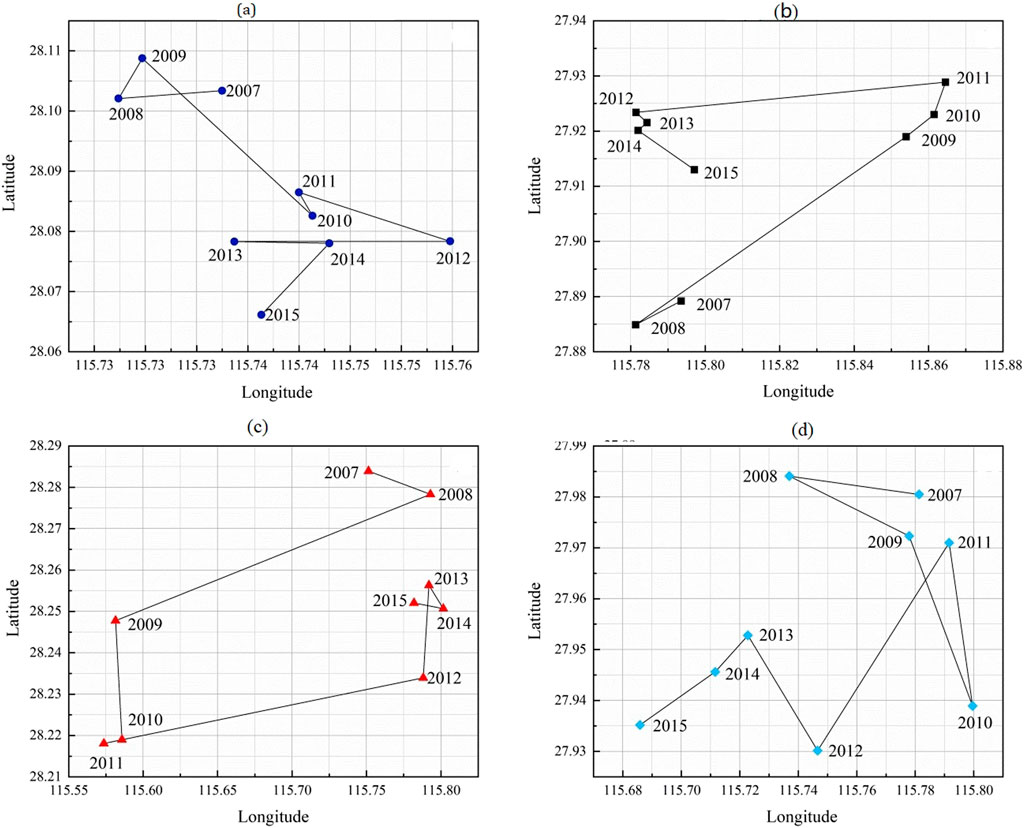
Figure 5. The trajectory of the gravity center movement for the (a) information entropy, (b) agricultural water, (c) industrial water, and (d) domestic water percentages in Jiangxi province from 2007 to 2015.
As illustrated in Figure 5A, the information entropy center of water consumption structure in Jiangxi gradually shifted to the northwest from 2007 to 2009, indicating a rapid increase in information entropy within the northwest region during this period. At this stage, the high-value areas of information entropy were principally concentrated in Nanchang, Jingdezhen, Jiujiang, Xinyu and Pingxiang. Among them, the information entropy of water consumption structure in Nanchang increased from 0.93 in 2007 to the highest information entropy value of 1.09 in 2009. During the period 2009–2011, the information entropy center of water consumption in Jiangxi gradually migrated towards the south. At this stage, the information entropy of water structure in Ganzhou increased from 0.70 in 2009 to 0.79 in 2011. Compared with other cities in southern Jiangxi, the information entropy of water consumption structure in Ganzhou was the highest and the growth rate was the fastest. One of the reasons was that permanent residents in Ganzhou increased rapidly during this period, and the rapid increase in the income level of residents led to an increase in domestic water consumption. From 2011 to 2015, the information entropy center of water consumption in Jiangxi continued to move southward and remained relatively stable in this region. The information entropy of water consumption structure in Nanchang, Jingdezhen, Yingtan and Shangrao experienced a slight decrease, from 1.07, 1.04, 0.97, and 0.79 in 2012 to 1.06, 1.03, 0.95, and 0.77 in 2015, respectively. Conversely, in Pingxiang, Jiujiang, Xinyu, Ganzhou, Ji’an and Fuzhou, the information entropy increased from 1.06, 0.94, 1.00, 0.84, 0.70, and 0.64 in 2012 to 1.08, 1.01, 1.01, 0.86, 0.78, and 0.69 in 2015. The main reason lied in the optimization and adjustment of the industrial structure of the cities in southern Jiangxi after 2012, which was mainly manifested in the accelerated upgrading of the industry and the accelerated development of the service industry.
Figure 5B showed the trajectory of the gravity center movement for agricultural water consumption. From 2007 to 2008, it moved slowly to the southwest; then, it rapidly moved to the northeast from 2008 to 2011; after 2011, it shifted to the southwest again; by 2012, it turned to the southeast. In general, the gravity center of the agricultural water consumption moved northward with a distance of 2.67 km from 2007 to 2015. The central and northern regions of Jiangxi, characterized by their fertile land, are ideally suited for agriculture development, hosting the province’s major grain-producing areas including the Poyang Lake Plain, Ganfu Plain, and Jitai Basin. However, in the context of the national strategy of the rise in central China, the provincial government put forward the strategic goal of striving for Jiangxi’s rise in the central region in December 2001, which promoted industrial upgrading and urbanization development, leading to a gradual decrease in the proportion of agricultural water after 2002. Subsequently, with the implementation of the land use red line policy in 2008, the General Plan of Land Use in Jiangxi Province (2006–2020) was issued by the government, designating the central and northern Jiangxi as the main grain producing areas. These areas account for over 60.0% of the province’s total cultivated land area, with the Poyang Lake Plain in northern Jiangxi comprising nearly half of this area. This was the possible reason for the northward migration of the agricultural water use center.
As shown in Figure 5C, the variation in the gravity center for the industrial water consumption was opposite to that in the agricultural water consumption, with the center shifting from the southeast, then to the southwest, and finally to the northeast from 2007 to 2015. Overall, the gravity center of the industrial water consumption shifted to the southeast with a distance of 4.64 km from 2007 to 2015. The policy to promote industrial development played an important role in the migration of the industrial water consumption center. The two regions, the Poyang Lake Ecological Economic Zone and the former Central Soviet Area in southern Jiangxi, had risen to national strategic areas, respectively, which promoted the industrial development of the Poyang Lake Region and southern Jiangxi. This led to the southeastward migration of the industrial water consumption center after 2008.
The gravity center of the domestic water consumption at first moved to the northwest, then shifted to the southeast and finally moved to the southwest from 2007 to 2015 (Figure 5D). In general, the center of gravity shifted southwest by approximately 10.64 km from 2007 to 2015, indicating an increase in the percentage of domestic water usage in the southwestern region. Under the background of the two national strategies of the revitalization and development of the Soviet area and the rise of central China, the process of urbanization and industrialization in Jiangxi had accelerated significantly. For example, Jiangxi actively promoted the construction of Nanchang metropolitan area and Ganzhou metropolitan area, which accelerated the improvement of urban and rural public services and infrastructure construction, leading to an increase in the proportion of domestic water after 2002 and the complex migration of the domestic water consumption center from 2007 to 2015.
4.4 Driving force analysis
4.4.1 Factor analysis
The change of water consumption structure was the result of the combined influence of socio-economic and natural environmental factors. The former was predominantly governed by human activities, while the latter encompassed climate change and the conditions of water resources (Liu et al., 2017). Through comparative analysis, 11 indicators that had significant impacts on the water consumption were chosen to analyze changes in water consumption structure in Jiangxi Province, including GDP, population, urban population proportion, total output value of agriculture, forestry, animal husbandry and fishery, industrial output value, effective irrigation area, grain output, urban greening coverage area, precipitation, temperature, and evaporation.
To elucidate the contributions of various factors to changes in water consumption structure, factor analysis was employed. Preliminary assessments, including the KMO measure and Bartlett’s test of sphericity, were conducted to evaluate the data’s suitability for this analysis. The KMO measure returned a value of 0.739, exceeding the threshold of 0.5, and the chi-square statistic for Bartlett’s test was 357.64, with a degree of freedom of 78 (P < 0.001). These results indicated that the data was not an identity matrix, which rejected the hypothesis that the factors were independent of each other, thereby suggesting interrelations among the factors. Consequently, the above analysis showed that the data met the prerequisites for factor analysis and could be used for its further application. Then, factor analysis was performed to calculate the eigenvalues and contribution rates of the principal factors, as detailed in Table 2. It was observed that the cumulative contribution rate of the first two factors after rotation reached 87.7% (more than 80%), indicating that the two common factors covered most of the information of 11 factors. Specifically, the eigenvalue of the first factor was 7.637, which explained 67.7% of the total variation and was the predominant influence on Jiangxi’ water use structure. The second factor, with an eigenvalue of 2.016, contributed to 20.0% of the total variation, serving as a secondary influence on the region’s water use structure. The eigenvalues of the remaining factors were below 1, indicating that only the first two common factors needed to be selected for analysis.
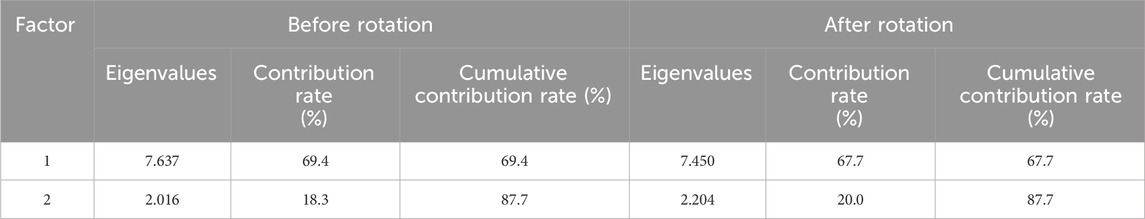
Table 2. Eigen values and cumulative contribution rate before and after rotation.
Based on the score coefficient matrix derived from principal component analysis, and in conjunction with the contribution rates of each factor, the two factors with the highest contribution rates were selected and denoted as F1 and F2, respectively. The details of the weight scores were shown in Table 3. The comprehensive multiple linear regression formula for the driving forces of water use structure in Jiangxi Province defined as F, and the specific mathematical relationship is as follows:
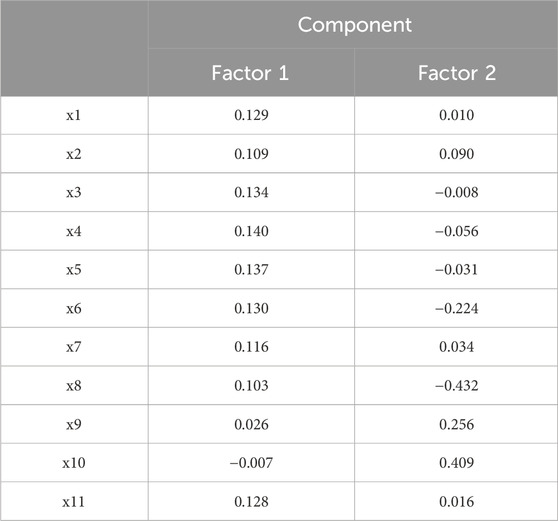
Table 3. Component coefficient matrix.
As shown in Figure 6, the first common (F1) factor exhibited a higher load on population, urban population proportion, total output value of agriculture, forestry, animal husbandry and fishery, industrial output value, GDP, effective irrigation area, grain output value and urban green coverage area. These indicators underscored the role of socio-economic determinants in shaping the water consumption pattern. Therefore, Factor 1 was defined as the socio-economic factor. In contrast, the second common factor (F2) had a significant load on evaporation, precipitation, and temperature, reflecting the effects of climatic variables on Jiangxi’s consumption structure. Thus, Factor 2 was designated as the climate factor. Factor analysis, therefore, categorized the influences on Jiangxi’s water consumption structure into two main groups: socio-economic and climatic factors.
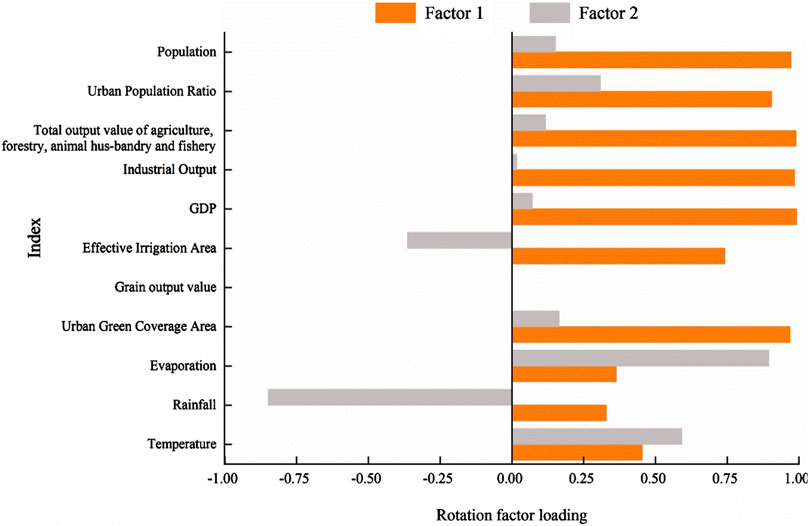
Figure 6. The rotated factor matrix diagram.
The above factor analysis indicated that socio-economic factors significantly influenced the evolution of the water consumption structure, accounting for a 69.4% contribution rate. The key socio-economic indicators—population, urban population ratio, total output value of agriculture, forestry, animal husbandry, and fisheries, industrial output value, GDP, effective irrigation area, grain output value, and urban green coverage area—played a critical role in shaping the Jiangxi’ water consumption structure, with a notable impact from agricultural development. Conversely, climate factors had a minimal influence on the water consumption structure, contributing only 18.3%. Although factors such as evaporation, precipitation, and temperature had a modest overall contribution, they directly affected agricultural water consumption, thereby exhibiting a direct impact on the water consumption structure.
According to the calculation of the comprehensive contribution rate (shown as the expression of F), the factors affecting the water use structure in Jiangxi Province were ranked as follows: the proportion of urban population, the urban green coverage area, the total output value of agriculture, forestry, animal husbandry and fishery, the population, the GDP, the industrial output value, the grain output value, evaporation, temperature, the effective irrigation area, and the precipitation.
4.4.2 Correlation degree analysis
The analysis of grey correlation between the equilibrium degree of water consumption structure and the common factors in Jiangxi Province was conducted, and the results were shown in Figure 7. The grey correlation degrees for the equilibrium degree of water consumption structure with the common factors were 0.646 and 0.567, respectively, demonstrating a strong correlation with socio-economic factors. These factors included population, urban population proportion, total output value of agriculture, forestry, animal husbandry, and fisheries, industrial output value, GDP, effective irrigation area, grain output value, and urban green coverage area. Climate factors, specifically precipitation and evaporation, also played a role but to a lesser extent. These findings indicated that socio-economic factors were the predominant drivers in affecting the water use structure, whereas climate factors were secondary. The evolution of the water use structure in Jiangxi Province was primarily driven by economic restructuring, demographic changes, and the demand for production-related water.
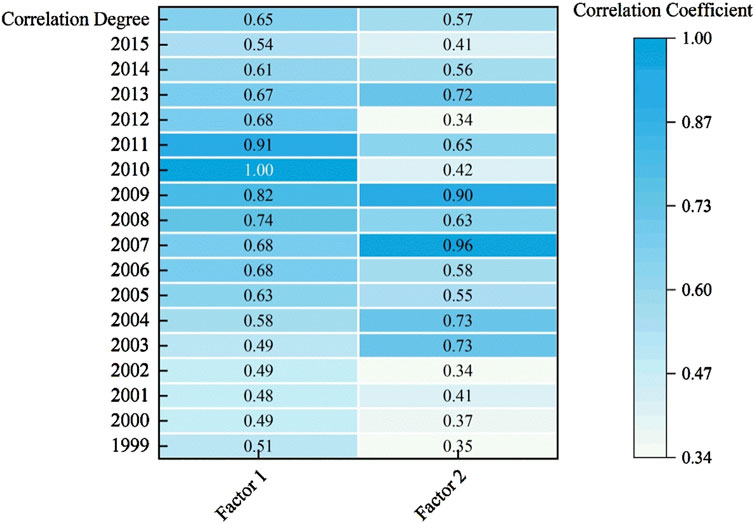
Figure 7. The degree of grey correlation between the water structure equilibrium and the common factor.
5 Conclusion
This study applied information entropy and gravity center model to investigate the spatiotemporal variations of the water consumption structure in Jiangxi Province during the period 1999–2015. Additionally, it explored the underlying driving forces through factor analysis and grey correlation. The main conclusions are as follows:
(1) The total water consumption in Jiangxi exhibited a general increasing trend from 1999 to 2015, and its phased changes were relatively obvious. Within the water consumption structure, agriculture accounted for the largest share, albeit with a gradual decline, while the proportion of industrial, domestic and ecological water was smaller, but showing an upward trend.
(2) The equilibrium degree variation in Jiangxi’s water consumption structure was basically similar with that of information entropy, both showing a slow increasing trend as a whole. This trend indicated that Jiangxi’s water consumption structure remained relatively stable over the past two decades, gradually shifting towards a more equitable distribution. Initially dominated by a single sector, water consumption had progressively moved towards a balanced allocation across various sectors. This change was principally influenced by the strictest water resources management system implemented in Jiangxi Province, which enhanced water use efficiency, in turn promoting the adjustment of water consumption structure, and thus making the water use system develop in a more balanced direction.
(3) The spatial variations of water consumption structure across Jiangxi Province revealed significant regional differences. The high values were mainly concentrated in the north regions including Nanchang, Jingdezhen and Jiujiang, whereas the low values were distributed in the southeast. Notably, the gravity center of the total water consumption gradually shifted to southern Jiangxi. Concurrently, the agricultural water use center gradually migrated toward the northern, while the gravity centers of industrial and domestic water use moved southwards.
(4) The socio-economic factors, exemplified by population, urban population proportion, total output value of agriculture, forestry, animal husbandry, and fisheries, industrial output value, GDP, effective irrigation area, grain output value, and urban green coverage area, emerged as predominant, contributing to 67.7% of the variations in water consumption pattern. In contrast, climate factors-specifically precipitation, temperature, and evaporation-served as secondary driving factors, contributing 20.0%. Notably, climate factors directly affected water consumption structure, due to the impact direct of climate factors on agricultural water use.
(5) Analyzing the spatio-temporal changes in Jiangxi Province’s water use structure offers scientific insights for rational water resource development, allocation, and protection, enhancing utilization efficiency. It also serves as a crucial basis for regional coordinated development, facilitating the optimized distribution of water resources and promoting harmonious economic and social progress. In water-scarce areas, for instance, adjusting the water use structure and fostering water-saving industries can drive sustainable regional growth. This research is especially significant for mitigating regional seasonal droughts. By understanding the temporal variation in water use structure, we can anticipate peak water demand periods during dry seasons. This foresight enables the development of targeted water - storage strategies, such as optimizing reservoir operation schedules to retain sufficient water during wet seasons for release during droughts. Additionally, identifying sectors with high water consumption in dry periods allows for the implementation of water - saving technologies and the promotion of alternative water sources, like rainwater harvesting and treated wastewater reuse. These measures can effectively alleviate the impacts of seasonal droughts on local communities, agriculture, and industries.
Data availability statement
Publicly available datasets were analyzed in this study. This data can be found here: http://www.mwr.gov.cn/sj/tjgb/szygb/; http://data.cma.cn.
Author contributions
LL: Conceptualization, Methodology, Writing – original draft. FO: Conceptualization, Methodology, Writing – review and editing. WL: Conceptualization, Funding acquisition, Methodology, Supervision, Writing – review and editing. ZZ: Data curation, Investigation, Writing – original draft. BY: Investigation, Writing – original draft
Funding
The author(s) declare that financial support was received for the research and/or publication of this article. This research was funded by the National Natural Science Foundation of China (No. 52069015) and the Jiangxi High level - High skilled Leading Talent Training Project (2023).
Conflict of interest
The authors declare that the research was conducted in the absence of any commercial or financial relationships that could be construed as a potential conflict of interest.
Generative AI statement
The authors declare that no Generative AI was used in the creation of this manuscript.
Publisher’s note
All claims expressed in this article are solely those of the authors and do not necessarily represent those of their affiliated organizations, or those of the publisher, the editors and the reviewers. Any product that may be evaluated in this article, or claim that may be made by its manufacturer, is not guaranteed or endorsed by the publisher.
References
Chen, M., Luo, Y., Shen, Y., Han, Z., and Cui, Y. (2020a). Driving force analysis of irrigation water consumption using principal component regression analysis. Agric. Water Manag. 234 (C), 106089. doi:10.1016/j.agwat.2020.106089
Chen, Y. J., Jin, B. M., Jin, J. L., Wang, G. Q., and Xu, H. (2020b). Ecological niche theory-based analysis on water consumption structure in Yellow River Basin. WRHE 51 (12), 36–46. (In Chinese). doi:10.13928/j.cnki.wrahe.2020.12.005
Cheng, J., Xie, Y., and Zhang, J. (2022). Industry structure optimization via the complex network of industry space: a case study of Jiangxi Province in China. J. Clean. Prod. 338, 130602. doi:10.1016/j.jclepro.2022.130602
Chhipi-Shrestha, G., Hewage, K., and Sadiq, R. (2017). Water–energy–carbon nexus modeling for urban water systems: system dynamics approach. J. Water Resour. Plan. Manag. 143 (6), 04017016. doi:10.1061/(ASCE)WR.1943-5452.0000765
Da Veiga, F., Kalbusch, A., and Henning, E. (2022). Drivers of urban water consumption in Brazil: a countrywide, cross-sectional study. Urban Water J. 20 (10), 1462–1470. doi:10.1080/1573062X.2022.2041049
DeCoster, J. (1998). Overview of factor analysis. Available online at: https://www.researchgate.net/publication/255620387_Overview_of_Factor_Analysis.
Deng, J. L. (1982). Control problems of grey systems. Syst. Control Lett. 1 (5), 288–294. doi:10.1016/S0167-6911(82)80025-X
Dong, Y. N., Ren, Z., and Li, L. H. (2022). Forecast of water structure based on GM (1, 1) of the gray system. Sci. Program 2022, 1–7. doi:10.1155/2022/8583959
Donkor, E. A., Mazzuchi, T. A., Soyer, R., and Alan Roberson, J. (2014). Urban water demand forecasting: review of methods and models. J. Water Resour. Plan. Manag. 140 (2), 146–159. doi:10.1061/(ASCE)WR.1943-5452.0000314
Fu, J., Gao, Z. G., Huang, L. Y., and Zhang, L. (2011). The movement route of consumption gravity center of Xinjiang from 1965 to 2009 based on GIS. Prog. Earth Planet. Sci. 2, 321–326. doi:10.1016/j.proeps.2011.09.050
Gondim, R., Silveira, C., de Souza Filho, F., Vasconcelos, F., and Cid, D. (2018). Climate change impacts on water demand and availability using CMIP5 models in the Jaguaribe basin, semi-arid Brazil. Environ. Earth Sci. 77 (15), 550–614. doi:10.1007/s12665-018-7723-9
Hanjra, M. A., and Qureshi, M. E. (2010). Global water crisis and future food security in an era of climate change. Food Policy 35 (5), 365–377. doi:10.1016/j.foodpol.2010.05.006
He, Y. H., Li, S. L., Yang, J., Xu, Y. Y., Wen, Z. W., and Tu, C. P. (2016). Change of water use structure and its driving factors in different regions of China. J. Water Resour. Water Eng. 27 (4), 1–6. doi:10.1016/j.jclepro.2023.139263
Hu, M., Li, Z., Ding, Z., Zhou, N., and Shen, Y. (2019a). The spatio-temporal heterogeneity and driving mechanism of China's water transfer from agriculture to non-agriculture. Geogr. Res. 38 (6), 1542–1554. (In Chinese). doi:10.11821/dlyj020171262
Hu, M. H., Hu, Y. L., Yuan, J. H., and Lu, F. C. (2019b). Decomposing the decoupling of water consumption and economic growth in Jiangxi, China. J. Water Reuse Desalin. 9 (1), 94–104. doi:10.2166/wrd.2018.003
Hu, Y. C., Yao, L., and Hu, Q. F. (2020). Evaluation of water resources carrying capacity in Jiangxi province based on principal component analysis. J. Coast Res. 105 (SI), 147–150. doi:10.2112/JCR-SI105-031.1
Hussien, W. e. A., Memon, F. A., and Savic, D. A. (2016). Assessing and modelling the influence of household characteristics on per capita water consumption. Water Resour. Manag. 30, 2931–2955. doi:10.1007/s11269-016-1314-x
Jiao, S. x., Li, Q. y., Wang, A. z., Liu, Y. q., Yin, Y. x., Zhao, R. q., et al. (2021). Dynamic evolution analysis of water consumption structure and industrial structure based on niche in Anyang City. Water Resour. Prot. 37 (1), 79–85. doi:10.3880/j.issn.1004-6933.2021.01.011
Kampas, A., Petsakos, A., and Rozakis, S. (2012). Price induced irrigation water saving: Unraveling conflicts and synergies between European agricultural and water policies for a Greek Water District. Agric. Syst. 113, 28–38. doi:10.1016/j.agsy.2012.07.003
Katila, P., Pierce Colfer, C. J., de Jong, W., Galloway, G., Pacheco, P., and Winkel, G. (2019). Sustainable development goals: their impacts on forests and people. Cambridge: Cambridge University Press. Available online at: https://www.cambridge.org/core/product/5F6FCE5727E5E666867EBFC947C89A65.
Li, H., Song, Y., and Zhang, M. (2018). Study on the gravity center evolution of air pollution in Yangtze River Delta of China. Nat. Hazard. 90, 1447–1459. doi:10.1007/s11069-017-3110-1
Liang, L. W., Chen, M. X., Luo, X. Y., and Xian, Y. (2021). Changes pattern in the population and economic gravity centers since the Reform and Opening up in China: the widening gaps between the South and North. J. Clean. Prod. 310, 127379. doi:10.1016/j.jclepro.2021.127379
Liu, B., He, X. L., Zhang, S. B., Peng, F., and Zhang, Y. (2017). Analysis of water use structure evolution and driving force in arid irrigated areas. CRWH 4, 12–14. Available online at: https://www.cnki.com.cn/Article/CJFDTotal-ZNSD201704005.htm.
Liu, H., and Zuo, Q. T. (2014). Analysis of water consumption structure in Zhengzhou based on Lorenz curves and Gini coefficients. Resour. Sci. 36 (10), 2012–2019. Available online at: https://www.cnki.com.cn/Article/CJFDTOTAL-ZRZY201410003.htm.
Liu, W. L., Zhu, S. N., Huang, Y. P., Wan, Y. F., Wu, B., and Liu, L. N. (2020). Spatiotemporal variations of drought and their teleconnections with large-scale climate indices over the Poyang Lake Basin, China. Sustainability 12 (9), 3526. doi:10.3390/su12093526
Liu, X., Wu, X., Yan, X., Wen, T., and Wu, J. (2022). Spatio-temporal characteristics of water resources development and utilization in the Poyang Lake Basin. J. Water Resour. Water Eng. 4, 72–78. doi:10.11705/j.issn.1672-643X.2022.04.10
Liu, Y., Hu, A. Y., and Deng, Y. Z. (2006). Study on the evolution of water resource structure based on information entropy. J. Northwest A&F Univ.(Nat. Sci. Ed.). 34 (6), 141–144. doi:10.3321/j.issn:1671-9387.2006.06.030
Lu, M. T., Wang, S. Y., Wang, X. Y., Liao, W. H., Wang, C., Lei, X. H., et al. (2022). An assessment of temporal and spatial dynamics of regional water resources security in the DPSIR framework in Jiangxi Province, China. Int. J. Environ. Res. Public Health 19 (6), 3650. doi:10.3390/ijerph19063650
Mall, R. K., Gupta, A., Singh, R., Singh, R. S., and Rathore, L. (2006). Water resources and climate change: an Indian perspective. Curr. Sci. 90 (12), 1610–1626. Available online at: https://www.researchgate.net/publication/235916232_Water_resources_and_climate_change_An_Indian_perspective.
Murwirapachena, G. (2021). Understanding household water-use behaviour in the city of Johannesburg, South Africa. Water Policy 23 (5), 1266–1283. doi:10.2166/wp.2021.157
Pastor, D. J., and Fullerton, T. M. (2020). Municipal water consumption and urban economic growth in El Paso. Water 12 (10), 2656. doi:10.3390/w12102656
Ravar, Z., Zahraie, B., Sharifinejad, A., Gozini, H., and Jafari, S. (2020). System dynamics modeling for assessment of water–food–energy resources security and nexus in Gavkhuni basin in Iran. Ecol. Indic. 108, 105682. doi:10.1016/j.ecolind.2019.105682
Reynaud, A. (2003). An econometric estimation of industrial water demand in France. Environ. Resour. Econ. 25, 213–232. doi:10.1023/A:1023992322236
Rondinel-Oviedo, D. R., and Sarmiento-Pastor, J. M. (2020). Water: consumption, usage patterns, and residential infrastructure. A comparative analysis of three regions in the Lima metropolitan area. Water Int. 45 (7-8), 824–846. doi:10.1080/02508060.2020.1830360
Roushangar, K., and Alizadeh, F. (2018). Investigating effect of socio-economic and climatic variables in urban water consumption prediction via Gaussian process regression approach. Water Sci. Technol. Water Supply 18 (1), 84–93. doi:10.2166/ws.2017.100
Shanno, C. E. (1938). A mathematical theory of communication. Bell Syst. Tech. J. 196, 519–520. doi:10.1002/j.1538-7305.1948.tb01338.x
Shi, C. F., Zeng, X. Y., Yu, Q. W., Shen, J. Y., and Li, A. (2021). Dynamic evaluation and spatiotemporal evolution of China’s industrial water use efficiency considering undesirable output. Environ. Sci. Pollut. 28, 20839–20853. doi:10.1007/s11356-020-11939-x
Shrestha, S., and Kazama, F. (2007). Assessment of surface water quality using multivariate statistical techniques: a case study of the Fuji river basin, Japan. Environ. Modell. Softw. 22 (4), 464–475. doi:10.1016/j.envsoft.2006.02.001
Singh, K. P., Malik, A., Mohan, D., and Sinha, S. (2004). Multivariate statistical techniques for the evaluation of spatial and temporal variations in water quality of Gomti River (India)—a case study. Water Res. 38 (18), 3980–3992. doi:10.1016/j.watres.2004.06.011
Su, X. L., Zhao, C., and Ma, L. H. (2008). Water consumed structure evolvement and its driving forces for guanzhong region in the past 20 years. J. Irrig. Drain. 5, 71–73. (In Chinese). doi:10.13522/j.cnki.ggps.2008.05.001
Sun, J. Q., Wang, X. J., Shahid, S., Yin, Y. X., and Li, E. K. (2022). Spatiotemporal changes in water consumption structure of the Yellow River Basin, China. Phys. Chem. Earth. 126, 103112. doi:10.1016/j.pce.2022.103112
Wang, S., Qin, C., Zhao, Y., Zhao, J., and Han, Y. (2023). The evolutionary path of the center of gravity for water use, the population, and the economy, and their Decomposed contributions in China from 1965 to 2019. Sustainability 15, 9275. doi:10.3390/su15129275
Wang, X. J., Zhang, J. Y., Yang, Z. F., Shahid, S., He, R. M., Xia, X. H., et al. (2013). Historic water consumptions and future management strategies for Haihe River basin of Northern China. Mitig. Adapt. Strateg. Glob. Chang. 20 (3), 371–387. doi:10.1007/s11027-013-9496-5
Wei, Y. G., Wang, Z. C., Wang, H. W., Yao, T., and Li, Y. (2018). Promoting inclusive water governance and forecasting the structure of water consumption based on compositional data: a case study of Beijing. Sci. Total Environ. 634, 407–416. doi:10.1016/j.scitotenv.2018.03.325
Wu, H., Wang, X. J., Shahid, S., and Ye, M. (2016). Changing characteristics of the water consumption structure in Nanjing City, Southern China. Water 8 (8), 314. doi:10.3390/w8080314
Wu, X., Tao, T., Wu, R. Z., and Wang, X. L. (2021). Analysis on the temporal and spatial dynamic evolution characteristics of water structure in North China-Taking Handan City as an example. Sci. Technol. Engng. 21, 11768–11775. Available online at: https://cstj.cqvip.com/Qikan/Article/Detail?id=7105706806&from=Qikan_Article_Detail.
Yang, J., and Chen, X. H. (2019). Quantification of the driving factors of water use in the productive sector change using various decomposition methods. Water Resour. Manag. 33 (12), 4105–4121. doi:10.1007/s11269-019-02338-0
Yao, L. Q., Zhang, H. Q., Zhang, C. J., and Zhang, W. L. (2019). Driving effects of spatial differences of water consumption based on LMDI model construction and data description. Clust. Comput. 22 (3), 6315–6334. doi:10.1007/s10586-018-2038-x
Yin, S., Ma, Z., Huang, P., and Wu, Q. (2017). The spatial-temporal distribution pattern of water resources utilization in China. J. Cent. China Norm. Univ. Nat. Sci. . 6 (51), 841–848. Available online at: https://journal.ccnu.edu.cn/zk/CN/Y2017/V51/I6/841.
Zhang, C. L., Dong, L. H., Liu, Y., and Qiao, H. J. (2016). Analysis on impact factors of water utilization structure in Tianjin, China. Sustainability 8 (3), 241. doi:10.3390/su8030241
Zheng, X. K., Peng, S. M., Wang, Y., and Jiang, G. Q. (2022). Evolution law and spatial distribution of water use structure in the Yellow River Basin based on information entropy. J. Water Resour. Water Eng. 33 (1), 8–14. doi:10.11705/j.issn.1672-643X.2022.01.02
Keywords: water consumption structure, spatiotemporal characteristics, driving factor, gravity center model, information entropy, factor analysis
Citation: Liu L, Ouyang F, Liu W, Zhou Z and Yin B (2025) Spatiotemporal dynamics and driving forces of water consumption patterns: insights from Jiangxi Province, China. Front. Environ. Sci. 13:1568294. doi: 10.3389/fenvs.2025.1568294
Received: 30 January 2025; Accepted: 07 May 2025;
Published: 19 May 2025.
Edited by:
Miao Zhang, Shaanxi Normal University, ChinaReviewed by:
Ying Zhu, Xi’an University of Architecture and Technology, ChinaXianwei Song, Guangxi University, China
Copyright © 2025 Liu, Ouyang, Liu, Zhou and Yin. This is an open-access article distributed under the terms of the Creative Commons Attribution License (CC BY). The use, distribution or reproduction in other forums is permitted, provided the original author(s) and the copyright owner(s) are credited and that the original publication in this journal is cited, in accordance with accepted academic practice. No use, distribution or reproduction is permitted which does not comply with these terms.
*Correspondence: Weilin Liu, d2VpbGluX2xpdUBuaXQuZWR1LmNu