 Habtamu Alemayehu
 Wassie Haile2‡†
- 1College of Dryland Agriculture, Samara University, Samara, Ethiopia
- 2School of Plant and Horticultural Sciences, College of Agriculture, Hawassa University, Hawassa, Ethiopia
Introduction: Soil characterization and classification is a vital tool for classifying soil, identifying soil types, managing nutrient, and transferring research findings. Jara Gelalicha in the Hawassa Zuria district and Aruma in the Wondo Genet district of the Sidama Region require soil characterization and classification. Therefore, this study was carried out in the specified locations to characterize the morphological and physicochemical properties as well as identify the types of soil in the studied areas.
Methods: For this study, extensive preliminary site observations, reconnaissance surveys, and 30 auger observations were conducted before opening the profile pits in each location. One representative pedon was opened at each site to a depth of 2 × 2 × 2 m, and the profiles were described using the Guidelines for Field Soil Descriptions. A total of 12 disturbed and 12 undisturbed soil samples were collected from each diagnostic horizon of both locations.
Results: The soil analysis result showed that the surface horizon textural class of pedon of Jara Gelalicha was sandy loam; whereas, the textural class of the pedon at Aruma was sandy clay loam. In the Jara Gelalicha and Aruma locations, the OC content in the surface horizons was 2.39% and 3.57%, respectively. In the Jara Gelalicha and Aruma locations, the total nitrogen content of the surface soil horizons was 0.23% and 0.32%, respectively.
Discussion: Based on the World Reference Base for Soil Resources, the soils of the study areas classified as Eutric Cambisols (Loamic) in Jara Gelalicha and Eutric Andosols (Loamic) in Aruma area. Therefore, the soil fertility management and land use decision should consider such soil variability. The findings could offer crucial information for designing soil management options to increase soil productivity and to make appropriate land use decision.
1 Introduction
Soils have various morphological, physical, chemical, and biological properties, leading to different reactions to management practices, abilities to provide ecosystem services naturally, resilience to disturbance, and susceptibility to deterioration (FAO, 2017). Therefore, it is crucial to characterize and classify soils to utilize these resources according to their capacities and manage them sustainably. Soil information gathered through systematic identification and grouping provides insight into the potential and limitations of the property, enabling efficient planning of various land uses (Lufega and Msanya, 2017). Soil characterization is essential for understanding the physical, chemical, mineralogical, and biological properties of soil, as well as for organizing knowledge and facilitating the transfer of experience and technology (Chekol and Mnalku, 2012; Adhanom and Teshome, 2016). According to Buol et al. (2003), soil classification is a vital tool for classifying soil, identifying soil types, managing property, and transferring research findings. To achieve the highest level of crop productivity, a comprehensive understanding of a nation’s soil nature and characteristics is crucial for managing it according to its potential (Abayeneh and Berhanu, 2000). Soil characterization studies are fundamental for understanding, classifying, and gaining the best understanding of the environment (Onyekanne and Nnaji, 2012; Yitbarek et al., 2018). Soil categorization is critical for understanding soil behavior and establishes the foundation for effectively assessing soil suitability and maintaining fertility (Desalegn et al., 2014). However, previous soil assessments in Ethiopia were generally limited to certain areas (Yitbarek et al., 2018). As a result, many sections of the country continue to lack accurate soil information, despite its enormous size and wide range of soil types. In Ethiopia, the consideration of soil types has influenced agricultural production and methods for ecologically sound land management (Assen and Yilma, 2010). However, existing regional and small-scale studies on soil characterization and classification in Ethiopia have not adequately supplied essential soil data to support soil management practices tailored to local variations (Hailu et al., 2015; Mathwos and Mesfin, 2024).
In Ethiopia, most studies conducted so far have been at a small scale, which may not be applicable for site-specific land use and soil management. Therefore, comprehensive knowledge of soil characteristics at a large scale, local watershed, or farm level is essential for addressing specific and local problems in agricultural production (Hailu et al., 2015). These various soil types were not fully characterized in the study locations, and their characteristics for soil fertility purposes were not well characterized. Because diverse soil types have varied physicochemical and morphological properties, alternative farming methods and inputs have been proposed in different parts of Ethiopia (Getahun, 2015). Soil types and properties in Ethiopia vary significantly due to factors such as climate, topography, parent material, and vegetation, which vary in their influence across regions (Chemeda et al., 2017; Mengiste et al., 2025). This diversity emphasizes the importance of soil classification as a instrument for facilitating technology transfer and information exchange across stakeholders (Fekadu et al., 2018). Despite these needs, Ethiopia’s soil information database remains limited due to insufficient survey activities, attributed to the country’s expansive area and complex topography (Mulugeta and Sheleme, 2010).
Sustainable soil usage needs an accurate understanding of soil composition and fertility control. These characteristics provide critical information about soil type, fertility, and productivity, all of which are important for sustaining livelihoods, ensuring food security, and decreasing the risk of malnutrition (Uwitonze et al., 2016; Mohamed et al., 2021; Merumba et al., 2024). Obtaining information about soils requires classifying and categorizing them because of their diverse morphological, physical, chemical, and biological characteristics (Mathewos and Mesfin, 2024). In order to identify the chemical, physical, and mineralogical characteristics of soil, a scientific method for collecting soil data is soil categorization (Sharu et al., 2013). The Sidama region’s soils are classified into major Reference Soil Groups (RSG), which include Luvisols, Cambisols, Nitisols, Vertisols, Andosols, Fluvisols, Regosols, and Leptosols (Bizunhe, 2023).
In the Sidama region, specifically in the study areas of Jara Gelalicha in Hawassa Zuria and Aruma in Wondo Genet districts, there is a problem of lack information on soil characterization and classification. The soil type remains unknown, leading to a lack of knowledge among agricultural experts regarding the available and deficient nutrients in the soil. Information on the morphological and physicochemical characteristics of the soil, as well as its fertility status, is inadequate. Previous soil resource studies in the national level have been conducted at small scales with a high level of generalization. However, the soils of Aruma in the Wondo Genete district and Jara Gelalicha in the Hawassa Zuria district of the Sidama region have yet to be characterized or classified. In the study areas agricultural field experiments have been carried out, which need soil information to interpret results and recommend appropriate soil management strategies for optimum and sustainable agricultural production. Generally, the current soil information of the country is not exhaustive to support appropriate land use decision and sustainable land management strategies for every area of the country. Therefore, the aim of the study was to characterize and classify soils of Aruma and Jara Gelalicha areas of Sidama Region, Southern Ethiopia.
2 Materials and methods
2.1 Description of study areas
2.1.1 Location and climate of the study areas
The study was conducted in farmers’ fields in Jara Gelalicha Kebele in Hawassa Zuria district and Aruma Kebele in Wondo Genet district of the Sidama Regional State, Southern Ethiopia. Jara Galalicha Kebele is located 290 km south of Addis Ababa and 16 km from Hawassa town. Geographically, the area lies at 7°0′13.7″to 7°48′11.5″N and 38°21′21.1″to 38°63′30.5″E, with a mean altitude of 1712 m above sea level (masl) and slope ranges from 0.2% to 0.5% (gentle). It receives a mean annual rainfall of 952 mm with mean minimum and maximum temperatures of 12.1°C and 26.7°C, respectively (Hawassa Meteorological Center, 2018). The major crops grown in the study area are maize (Zea mays L.), common bean (Phaseolus vulgaris L.), cabbage (Brassica oleracea L.), tomato (Lycopersicon esculentum L.), wheat (Triticum aestivum L.), enset (Ensete ventricosum (Welw.), beetroot (Beta vulgaris L.), lettuce (Lactuca sativa L.), sweet potato (Ipomoea batata L.), khat (Catha edulis L.), and chili (Capsicum annuum L.).
Aruma Kebele, in the Wondo Genet district is located 264 km south of Addis Ababa and 27 km southwest of Hawassa town. Geographically, the area is located at 6°16′to 7°45′N and 38°31′to 38°63′E. The altitude of the district ranges from 1,001 to 1780 m above sea level. The mean annual rainfall in the district ranges from 801 to 1,221 mm, and the mean annual temperature ranges from 17.6°C to 22.5°C (SNNPRS, BoFED, 2018). The major crops grown in the study area are khat (C. edulis L.), sugarcane (Saccharum officinarum L.), maize (Z. mays L.), enset (E. ventricosum (Welw.) Cheesman), cabbage (B. oleracea L.), tomato (L. esculentum L.), and potato (Solanum tuberosum L.). Both locations exhibit a landscape characterized by a mix of agricultural land, natural vegetation, and forest cover. The soil pedons of the experimental sites were excavated in the cultivated land. In both locations, the natural vegetation cover prior to cultivation was forest. The map of the study areas is presented in Figure 1. The 10-year annual climate data (2013–2022) for Hawassa Zuria district and Wondo Genet district are presented in Figures 2, 3, respectively.
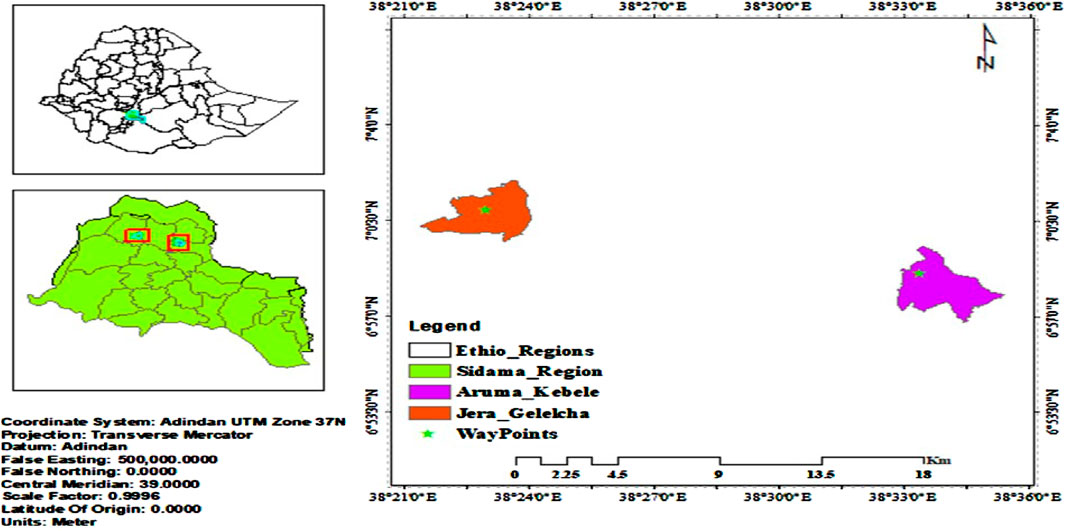
Figure 1. Location map of study areas.
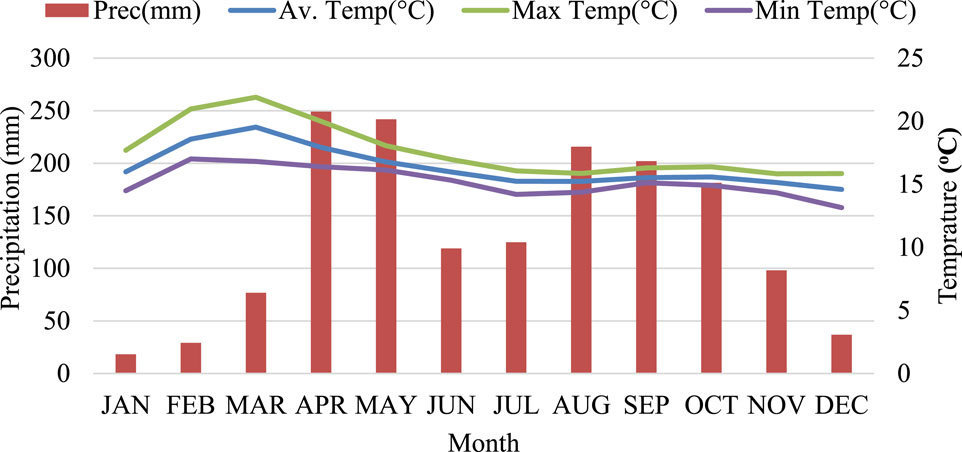
Figure 2. Annual climate data hawassa Zuria district (2013–2022) (Source: hawassa meteorology station).
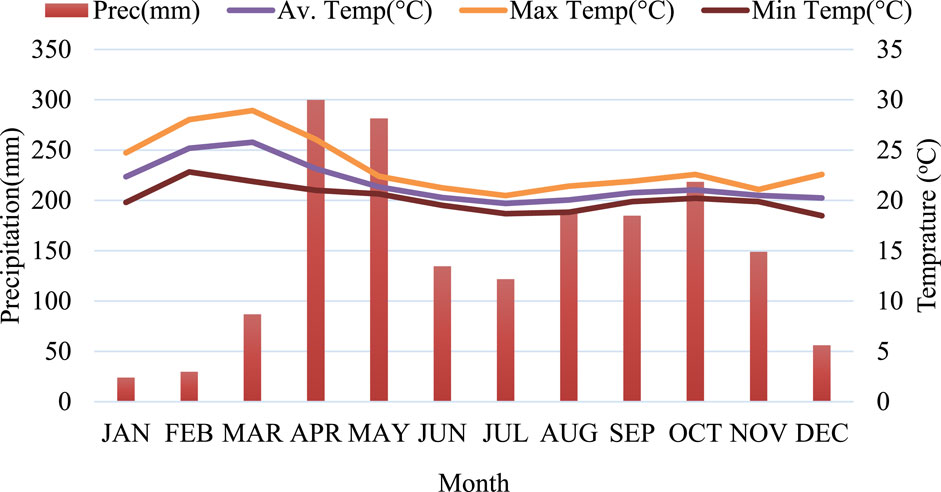
Figure 3. Annual climate data Wondo Genet (2013–2022 average) (Source: hawassa meteorology station).
2.1.2 The geology and geomorphology of the study area
The Hawassa area is morphologically part of the rift floor zone (Bizunhe, 2023). It is a depression that was created by volcano-tectonic collapse phenomena (Temesgen et al., 1999). According to Ayele et al. (2022), the Hawassa area contains fluvial sediments, alluvial sediments, Wondo Koshe pumice fall and flow deposits, scoria cones, tuff cones, Hawassa basalts, and Hawassa rhyolitic ignimbrites. According to Temesgen et al. (1999), the Wondo Genet area is characterized by tertiary and quaternary geological formations. The area mainly consists of ignimbrites, pumiceous tuff, and volcano lacustrine deposits interbedded with basaltic lava.
2.2 Field survey, soil profile selection, and soil sample preparation
A preliminary site and auger observation was carried out prior to opening the pedons. For each study area, thirty auger inspections were made and a representative site was selected. In each study area, a representative pedon of 2 × 2 × 2 m in length, width, and depth was opened and described based on guideline for soil description (FAO, 2006). General site information was recorded based on standard profile description sheet. From each identified horizon, about 1 kg soil samples were taken with plastic bags delivered to Hawassa university Soil Science laboratory for soil physical and chemical parameters analysis. The Munsell Color Chart (KIC, 2000) was used to identify the color of each horizon (both moist and dry).
2.3 Soil analysis
The physical and chemical properties which were considered for the study were texture, bulk density, particle density, total porosity, soil water retention capacity at field capacity (FC) and permanent wilting point (PWP), available water content (AWC), pH, electric conductivity, organic matter, total nitrogen, phosphorus, CEC, exchangeable bases, and micronutrients. Particle size distribution was analyzed using the hydrometer method (Bouyoucos, 1962). Bulk density was calculated from undisturbed soil samples collected with a core sampler, weighed for field moisture content, and dried in an oven at 105°C, following the method described by Sahlemedhin and Taye (2000). Particle density was determined using the pycnometer method (Blake, 1965). Total porosity was calculated from the bulk density and particle density values. The bulk density was calculated by dividing the mass of the oven-dried soils by their natural volumes in the field. Bulk density (BD) and particle density (PD) were used to calculate total porosity, which was as follows Equation 1.
The water content of each soil horizon was measured at field capacity (FC) at −1/3 bar and permanent wilting point (PWP) at −15 bars using the Ktues (1965) pressure plate apparatus. Hillel (1980) calculated the soil’s available water-holding capacity by subtracting the PWP water content from the FC water content. The depth of the available water content (AWC; mm m−1) was determined using Equation 2:
Where AWC is the available water content (mm m−1), FC is the gravimetric water content in field capacity (% weight), PWP is the gravimetric water content at the permanent wilting point (% weight), and AS is the apparent specific gravity (the ratio of soil BD to the density of water) (Asawa, 2006). Soil pH and electrical conductivity (EC) was measured in a 1: 2.5 soil-to-water suspension; water mixture using pH meter. Soil organic carbon was determined using the Walkley and Black wet oxidation method (Walkley and Black, 1934). Total nitrogen was determined using the Kjeldahl procedure (Wilke, 2005). Available soil phosphorus (P) was analyzed using the standard procedure of the Olsen (1954) extraction method. The cation exchange capacity was determined following ammonium acetate method (Sarkar and Haldar, 2005). From the aliquots of the same extract, Exchangeable bases were extracted with 1 M ammonium acetate at pH 7 (Sahlemeden and Taye, 2000). Exchangeable Ca and Mg were measured from the extract using an atomic absorption spectrophotometer (AAS), while exchangeable K and Na were determined from the same extracts using a flame photometer, as described by Rowell-Fuller et al. (1994). Percent base saturation (PBS) was calculated as the percentage of total exchangeable bases to cation exchange capacity (CEC) of the soil. Calcium carbonate content was determined following the acid neutralization method in which the soil carbonate was decomposed by excess standard HCl solution and back-titrated with standard NaOH after filtering it (Jackson, 1958). Available iron (Fe), Mn, Zn, and Cu were extracted from the soil samples with Diethylene triamine pentaacetic acid (DTPA) as described by Lindsay and Norvell (1978), and the contents in the leachate were measured using atomic absorption spectrophotometer (AAS).
2.4 Soil classification
A preliminary soil classification was carried out in the field using field analysis of site features and profile descriptions. The soils were finally classified into two major soils units based on their morphological, physical and chemical properties according to the IUSS Working Group WRB (2022).
2.5 Statistical analysis
Data obtained from physical and chemical analysis were analyzed using the general linear model procedure of the Statistical Analysis System (SAS Institute, 2016) for the Pearson correlation analysis of soil properties in both study areas.
3 Results and DISCUSSION
3.1 Morphological and physical properties of the soil in the study areas
3.1.1 Morphological properties
Table 1 summarizes the site characteristics and physiographic settings of pedons in the study sites, which were found to be very deep (>200 cm) in both locations. According to Moshago et al. (2022) and Mengiste et al. (2025), the depth of the soil affects root development as well as water and nutrient storage in plants. Table 2 provides a summary of the profiles’ morphological features. While the subsurface ranged in color from reddish brown (5YR4/3) to light brown (7.5YR6/3) and dark brown (7.5YR3/2) to brown (7.5YR4/4), the moist color of the surface horizons was dark gray (5YR4/1) and very dusky red (2.5YR2.5/2). The Aruma area showed a darker surface horizon compared to Jara Gelalicha, possibly due to the accumulation of high organic matter. Color variations within a soil profile and between two pedons are most likely caused by differences in parent material types, drainage conditions, organic matter concentration, and iron oxide forms (Abate et al., 2014; Alemu and Buraka, 2018; Dinssa and Elias, 2021; Mathwos and Mesfin, 2024). The surface horizon was darker in color at the Aruma location than at the Jara Gelalicha location, which could be attributed to significant organic matter buildup. Mulugeta and Sheleme (2010) found similar observations, in which the surface horizons were darker than the subsurface horizons, due mostly to organic material buildup and breakdown.
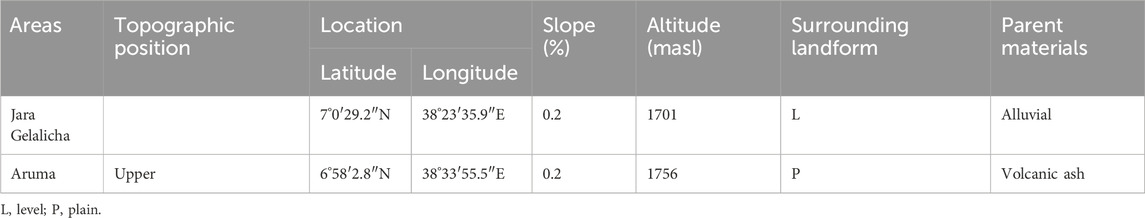
Table 1. The site characteristics and physiographic settings of the pedons in the study sites.
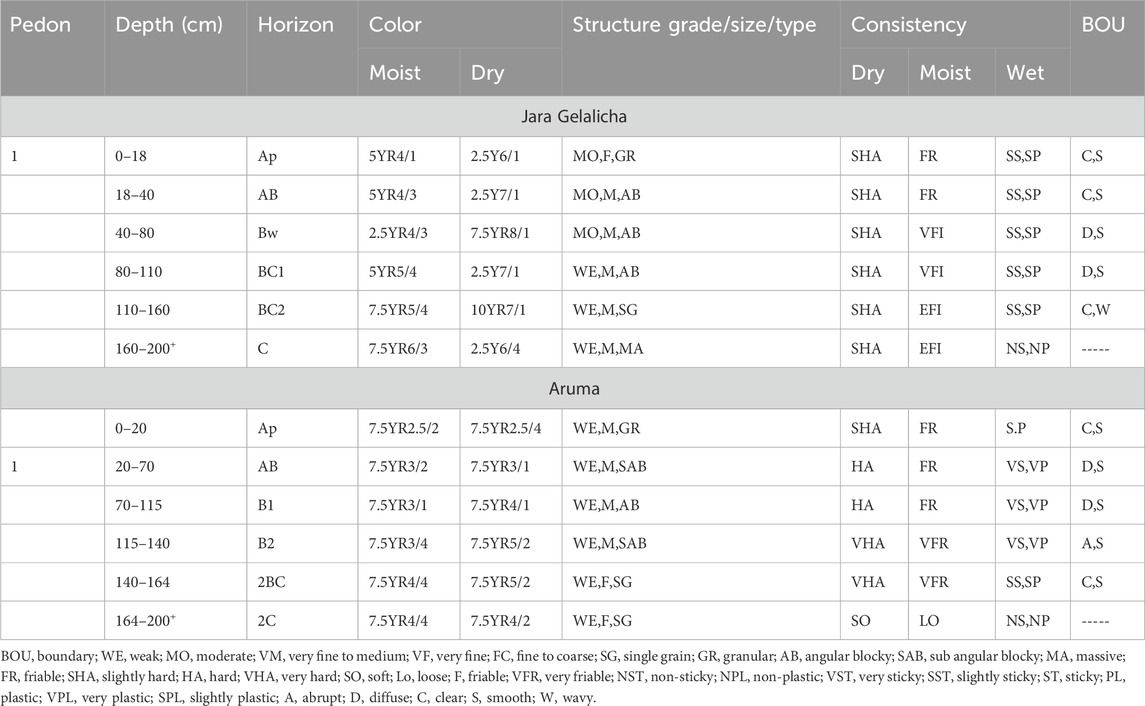
Table 2. Selected morphological characteristics of cultivated soils of Jara Gelalicha and Aruma Areas.
Similar findings were reported by Mulugeta and Sheleme (2010), where the surface horizons were darker compared to the subsurface horizons, mainly due to the accumulation and decomposition of organic materials. Soil color variations in pedons may be due to variations in clay, organic matter content, parent material, and drainage conditions, which influence redoximorphic reactions. This study aligns with Hailu et al. (2015) findings on soil color. The surface layers in both pedons were darker in color than the underlying horizons (Table 2). Furthermore, compared to Jara Gelalicha, the surface soil of Aruma pedon had a comparatively dark and moist color; this could be due to the higher content of organic matter (Hailu et al., 2015).
3.1.2 Physical properties of soils in the study areas
3.1.2.1 Particle size distribution, bulk density, total porosity, and soil moisture content
The proportion of sand was highest in both profile horizons at the Aruma and Jara Gelalicha locations. The sand and silt content of the Jara Gelalicha pedon was relatively higher than the Aruma pedon (Table 3). However, the clay content of Aruma pedon was relatively higher. The surface horizon textural of pedon of Jara Gelalicha was sandy loam; whereas, the textural class of the pedon at Aruma was sandy clay loam. Regarding the subsurface horizons, most of the textural class of the horizons at Jara Gelalicha pedon was sandy loam. In the case of the Aruma pedon, most of the subsurface horizons textural class was sandy clay loam. Clay, sand, and silt percentages were classified by Hazelton and Murphy (2016) as very high, high, moderate, low, and very low categories, respectively, >50, 40–50, 25–40, 10–25, and <10. According to this classifications, the Jara Gelalicha soils had sand content ranged from very high to high, the silt contents had ranged from moderate to low, and the clay contents had ranged from low to very low (Table 3). In the Aruma soils had sand content had ranged from very high to high, silt contents had low, and clay contents had ranged from moderate to low, respectively. The sand concentrations of both soil profiles reveal an unsystematic trend with increasing depth. Similar findings were published by Sebnie et al. (2021), who found that the amount of sand increased inconsistently with depth. Soils with a silt/clay ratio greater than 0.15 are relatively younger and have a higher intensity of weathering potential. This indicator is crucial for assessing soil weathering rates and determining a specific soil profile’s relative growth stage (Debele et al., 2018; Mathwos and Mesfin, 2024). Additionally, a similar result was reported by Ahukaemere et al. (2017). Soils with a silt/clay ratio of 0.15 are regarded as highly weathered. Young parent materials usually have a silt/clay ratio above 0.15 (Sharu et al., 2013). These results indicate that the soils in Jara Gelalicha are relatively young and have a high degree of weathering potential. Similar results have been reported for other soils in similar ecological settings (Kebeney et al., 2014; Kalala et al., 2017; Hundessa, 2020; Walche et al., 2023). Additionally, Giday et al. (2015) reported a similar result in Southern Tigray, finding that silt-to-clay ratios were greater than 0.38. The silt-to-clay ratio in the soil of the Jara Gelalicha site was higher compared to the Aruma site, indicating that the soils are relatively young with a high degree of weathering potential (Asomoa, 1973). This could be due to the volcanic parent materials surrounding Hawassa, consisting of alkaline lavas, ash, and ignimbrites, primarily from tertiary and younger ages (Meron, 2007), which can lead to the formation of young soils with a coarser texture.
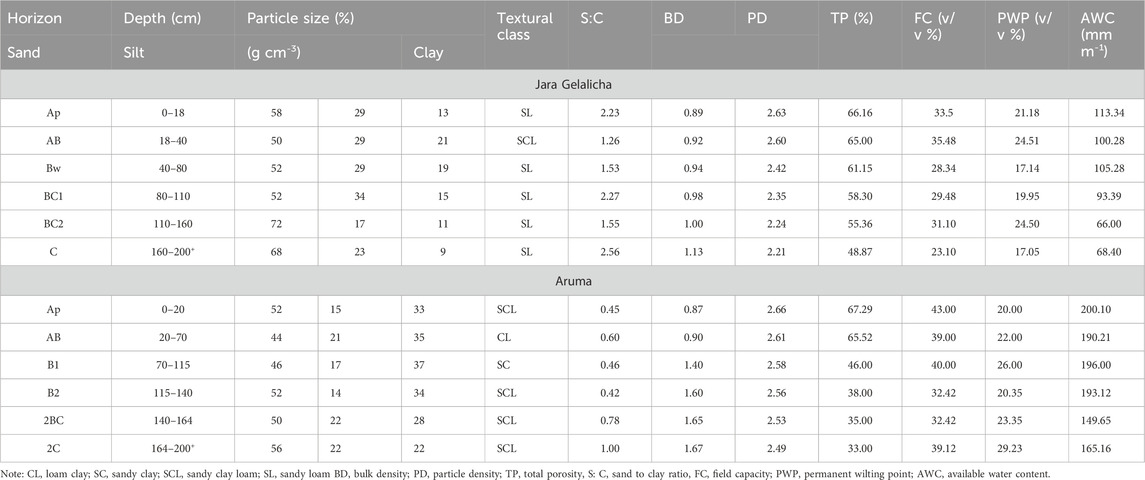
Table 3. Selected physical characteristics of soil horizons in pedon at study areas.
In the Jara Gelalicha and Aruma locations, the bulk densities of the surface horizon were 0.89 g/cm3 and 0.87 g/cm3, respectively (Table 3), whereas the bulk densities of the sub-surface horizons ranged from 0.92 to 1.13 g/cm3 and 0.90-1.67 g/cm3, respectively (Tables 3). According to Hazelton and Murphy (2007), bulk density (BD) values < 1, 1–1.30, 1.30–1.60, 1.60–1.90, and >1.90 g/cm3 are classified as very low, low, medium, high, and very high, respectively. The study supports Brady et al. (2008) and Sebnie et al. (2021) findings that soil bulk density increases with soil depth. Higher soil bulk densities in sub-surface horizons are due to higher soil organic matter content compared to surface horizons (Wakene, 2001; Achalu Chimdi et al., 2012; Abera et al., 2016). Soils with low bulk density exhibit favorable and soil physical conditions, whereas, high bulk density exhibit poor soil physical conditions (Hajabbasi, 2005; Patil and Prasad, 2004). The lower bulk density in surface horizon may be due to cultivation, high organic matter content and biotic activities (Sekhar et al., 2014).
The total porosity (TP) of the surface horizons of Jara Gelalicha and Aruma soils was 66.16% and 67.29%, respectively. The total porosity of the subsurface horizons ranged from 48.87% to 65% and 33%-65.52%, respectively (Table 3). Therefore, the total porosity typically falls within the range of 30%–70% (Hazelton and Murphy, 2007). However; it decreased consistently with soil depth in both areas of the pedons. This decrease could be the decrease in soil organic matter down the soil depth. The pressure of the overlaying horizons could also have impact on the porosity of the soils. These findings are consistent with Hailu et al. (2015), who also observed a decrease in total porosity with increasing soil depth due to compaction, reduced rooting effects, and lower organic matter content.
The surface soils of Jara Gelalicha and Aruma had available water content (AWC) values of 113.34 mm m-1 and 200.10 mm m-1, respectively. In contrast, the subsurface soils had values ranging from 66 mm m-1–100.28 mm m-1 and 149.65 mm m-1–196.00 mm m-1 (Table 3). As soil depth increases, its ability to retain moisture decreases. This is because topsoil contains more soil organic matter than subsoil (Achalu Chimdi et al., 2012) which increases the porosity of the soils. Sebnie et al. (2021) discovered similar findings, demonstrating that surface horizons had a greater amount of available water than subsurface horizons.
3.2 Chemical properties of soils in the study areas
3.2.1 Soil pH and electrical conductivity
In the Jara Gelalicha and Aruma locations, the surface soil pH (H2O) values were 7.7 and 7.1, respectively (Table 4), while the subsurface values varied from 8.2 to 9.3 and 7.3 to 7.6, respectively (Table 4). Both profiles mostly showed regular variations with depth in pedons, with an increasing trend observed in both locations. Soil reaction generally revealed an increasing trend throughout the soil depth in the pits. At each site, the surface soils had the lowest pH values, while the subsurface soils had greater pH values (Sharu et al., 2013; Yitbarek et al., 2018; Mathewos and Mesfine, 2024). According to Ayalew and Beyene (2012), lower organic matter content with depth results in less H+ ion discharge from the breakdown of organic matter, and a rise in soil pH along soil depth may suggest the existence of vertical explorations of exchangeable bases. Similar findings were reported by Senbie et al. (2021), confirming that an increase in soil pH with depth could indicate leaching of exchangeable basic cations, and the decomposition of organic matter releases fewer H+ ions as the organic matter content decreases with depth.
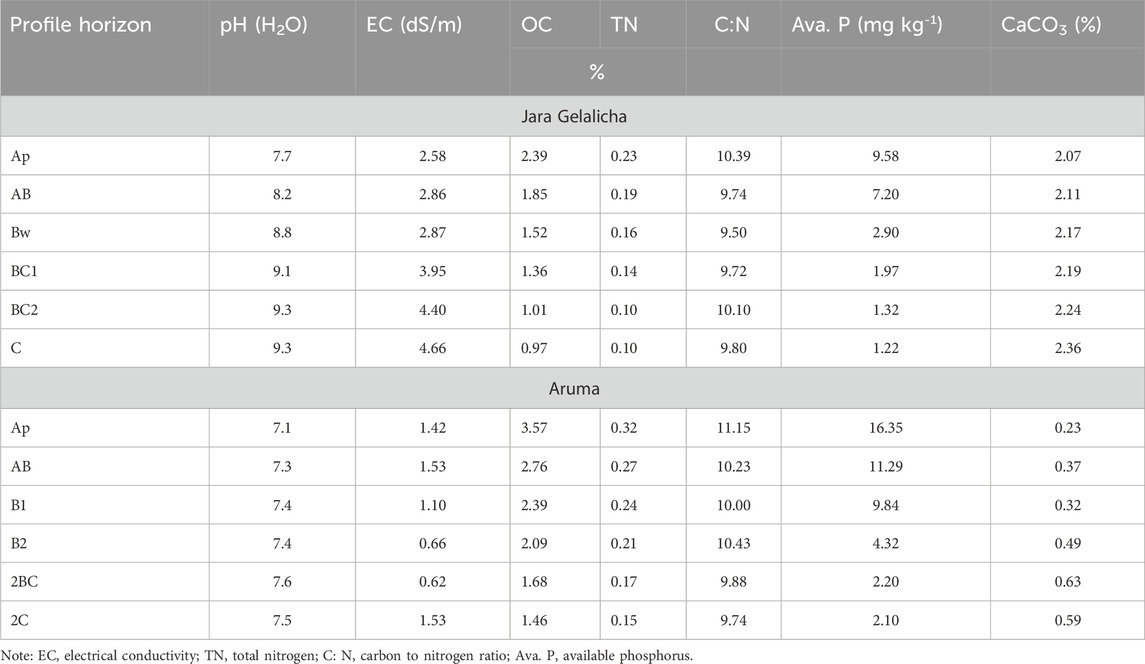
Table 4. Selected chemical properties of Jara Gelalicha and Aruma area soils.
In the Jara Gelalicha and Aruma locations, the electrical conductivity (EC) of surface horizon was 2.58 dS/m and 1.42 dS/m, respectively (Table 4). The subsurface horizons ranged from 2.86 to 4.66 dS/m and 0.62 to 1.53 dS/m, respectively (Table 4). Generally, in the Jara Gelalicha study area, the electrical conductivity of the soil horizons increased with depth. The soils in the Aruma area had very low electrical conductivity values ranging from 0.62 to 1.53 dS/m, indicating non-saline soils (Debele et al., 2018). Electrical conductivity content in the Aruma area showed irregular patterns with increasing depth in parts of the pedon horizon, indicating a low level of leaching in the area. Both the surface and subsurface EC values of the Aruma soils are less than 2 dS/m, indicating that they are not saline. Electrical conductivity measurements in the soils under investigation show that the soluble salt content is below the thresholds where soil salinity has no negative effects on crop development and productivity (Mathewos and Mesfin, 2024; Sebnie et al., 2021).
According to Lal and Shukla (2004), the soil’s electrical conductivity in the research area was less than 2 dS/m, indicating no decrease in yield. The electrical conductivity values measured in Jara Gelalicha soils revealed that soluble salt concentrations are below the threshold at which soil salinity affects crop growth and yield (United States Salinity Laboratory Staff, 1954). The soils in the Jara Gelalicha location had alkaline reactions with a pH of over 7.7 and electrical conductivity (EC) of >2.58 dS/m, similar to results reported by Ayelew and Beyene (2012).
3.2.2 Organic carbon, total nitrogen, carbon to nitrogen ratio, available phosphorus, and calcium carbonate content
In the Jara Gelalicha and Aruma locations, the organic carbon (OC) content in the surface horizons was 2.39% and 3.57%, respectively (Table 4). In the subsurface horizons, it varied from 0.97% to 1.85% and 1.46%–2.76%, respectively (Table 4). Maria and Yost (2006) classified organic carbon content of <1.5%, 1.5%–2.5%, and >2.5% as low, medium, and high, respectively. The high organic carbon content in the surface soil was attributed to the significant amount of rainfall that promotes high biomass production, resulting in a high amount of organic matter in the soil. However, the profiles of both soils revealed that the OC content declined with soil depth, indicating that top soils accumulate more organic materials (Sebnie et al., 2021; Mathwos and Mesfin, 2024). There have been reports of low levels of organic carbon in several parts of Ethiopia (Beyene, 2017; Zewide et al., 2018; Mathwos and Mesfin, 2024; Mengiste et al., 2025). Surface horizons have a higher addition of decomposable organic materials and higher levels of organic carbon, according to Dinssa and Elias (2021). Additional, comparable findings were reported by Ashokkumarid and Jagdish (2010) and Sekhar et al. (2017), who discovered that higher organic matter in surface soils was attributable to continual addition of organic matter from leaf fall, stubbles, roots, and organic manures applied solely to the surface layers.
In the Jara Gelalicha and Aruma locations, the total nitrogen content of the surface soil horizons was 0.23% and 0.32%, respectively (Table 4). In the subsurface horizons, the range was from 0.10% to 0.19% and 0.15%–0.27%, respectively (Table 4). Similar to organic carbon, total nitrogen content decreased with depth in both pedons (Table 4). The Landons (1991) rating system was used to categorize total nitrogen as low (0.2), medium (0.2–0.5), and high (0.5). The amount of total nitrogen varied within and between profiles depending on the amount of organic matter present. The surface horizon had a high total nitrogen content that gradually decreased through the profiles of Jara Gelalicha and Aruma. Compared to the Aruma area soils, the Jara Gelalicha soil contained less total surface nitrogen. These findings are consistent with those of Yitbarek et al. (2018) and Demiss and Beyene (2010), who found that the total nitrogen content at their study sites decreased with depth. Additionally, similar results were reported by Dash et al. (2019), Dorji et al. (2014), Kumar et al. (2012), and Khanday et al. (2018). A regular trend of decreasing organic carbon with depth was observed in the soil profiles. According to Hartz (2007), soils with less than 0.07% total nitrogen have limited nitrogen mineralization potential, while those with greater than 0.15% total nitrogen would be expected to mineralize a significant amount of nitrogen during the succeeding crop cycle, indicating that most of the soils have good potential for nitrogen mineralization. In the Jara Gelalicha and Aruma areas, the Pearson correlation also revealed a strong and significant positive correlation (r = 0.892*** and 0.981***, P ≤ 0.001) between total nitrogen (N) and organic carbon (OC) contents, respectively. This indicating that organic carbon is the principal source of nitrogen in the soil. These results in line with the findings of Mengiste et al. (2025), who found that TN concentration dropped as profile depth increased.
Surface horizons of the C:N were 10.39 and 11.15 in the Jara Gelalicha and Aruma areas, respectively, while in the subsurface horizons, it ranged from 9.50 to 10.10 and 9.74 to 10.23 in the Jara Gelalicha and Aruma areas, respectively (Table 4). In comparison to their underlying horizons, the C/N ratio values of both studied pedon surfaces were consistently higher as soil depth increased. In both locations, the C/N ratio in the surface horizons is generally larger than 10:1, which implies a considerably better decomposition rate, improved nitrogen availability to plants, and potential for incorporating agricultural leftovers into the soil (Lelago and Buraka, 2019).
Surface horizons of the carbon to nitrogen ratio is an indicator of nutrient immobilization and mineralization, whereby a low C/N ratio indicates a higher mineralization rate and a higher C/N ratio indicates a higher immobilization rate (Anbessa, 2018). In general, a C/N ratio of about 10: 1 suggests a comparatively better decomposition rate that serves as an index of enhanced N availability to plants and the possibilities of incorporating crop residues into the soil without having any adverse effect on N immobilization (Assen and Yilma, 2010). Accordingly, C: N ratio of the surface soils in all areas was not far from the optimum range in all soils for microbial needs. The C: N ratio of the soils showed a decreasing trend with increasing soil depth in both areas of the soil profiles. Achalu Chimidi et al. (2012) found a narrow C:N ratio in cultivated land soils due to increased organic carbon mineralization and temperature-induced aeration during tillage.
In the Jara Gelalicha and Aruma areas, the available phosphorus content in the surface horizons was 9.58 mg kg-1 and 16.35 mg kg-1, respectively (Table 4). According to Ayalew (2010), surface soils in some southern Ethiopian locations contained a moderate amount of available phosphorus (5–15 mg kg-1). In the subsurface horizons, available P contents ranged from 1.22 to 7.20 mg kg-1 and 2.10–11.29 mg kg-1, respectively (Table 4), which could be classified as very low to medium (Hazelton and Murphy, 2007; Jones, 2003). The authors classified Hazelton and Murphy (2007) classified soils with phosphorus values less than 5, 5–9, 10–17, 18–25, and <25 mg kg–1 as very low, low, medium, high, and very high, respectively. The available P content of the soils decreased as they moved down the profile. Sekhar et al. (2017) reported similar results, finding that surface horizons had the highest accessible phosphorus levels, which decreased with depth. This may be due to crop cultivation being confined to the rhizosphere, leading to the need for external fertilizers to restore depleted phosphorus levels. Higher available P values in the surface horizon compared to subsurface horizons may be attributed to differences in the OM content and optimum soil pH.
According to Carrow (2004), P-Olsen levels between 12 and 18 mg kg-1 are considered sufficient, indicating that the available P in the surface horizons of Jara Gelalicha falls within the insufficient range. Available P content decreased with increasing depth, likely due to a decrease in soil organic matter. In high pH conditions where calcium is the dominant cation, phosphate tends to precipitate with calcium (Rishid, 2019). The soil in these locations was saline, with a pH consistently above 8. Due to the high pH of saline soil, more than 75% of phosphorus fertilizer combined with calcium in the soil, forming phosphates with low solubility. This resulted in reduced phosphorus availability and utilization of phosphorus fertilizer (Liu et al., 2024). Soil pH is a crucial factor that influences the occurrence and transformation of phosphorus forms in soil, affecting processes such as chemical fixation and precipitation dissolution of phosphorus in soil (Zhang et al., 2014). This finding is consistent with Debele et al. (2018) in the Muger sub watershed, who found that the available phosphorus ranged from medium to high. Due to the decreasing soil organic matter content, the available phosphorus showed a declining trend for all soil profiles throughout the soil depth (Ayalew et al., 2015; Debele et al., 2018). This conclusion aligns with that of Ali et al. (2010), who discovered that the surface horizon had the highest concentration of available phosphorus in the soil.
In the Jara Gelalicha and Aruma locations, the calcium carbonate (CaCO3) content with in pedons varied from 2.07% to 2.36% and 0.23%–0.61%, respectively (Table 4). In the Jara Gelalicha pedon, the increase can be attributed to the movement of calcium carbonate solutes downwards from the surface horizon to the subsurface horizon and soil parent material As a result; there was a visible presence of calcaric soil material in the Jara Gelalicha profile. Generally, the results revealed that all layers of the profiles had greater than 2% CaCO3, resulting in the absence of calcaric soil material (Hazelton and Murphy, 2007). In Aruma, the amount of CaCO3 contents showed an irregular pattern in the soil horizons with increasing depth, indicating a low degree of leaching process in the area. In the Aruma soil profile, the amount of CaCO3% showed no visible presence of calcaric soil materials at any horizons, as the results showed that all horizons in the profile were less than 2%, resulting in the absence of calcaric soil material (Hazelton and Murphy, 2007).
3.2.3 Cations exchange capacity, exchangeable bases, percent base saturation, and total exchangeable base of soils
The CEC values of the surface horizon at Aruma and Jara Gelalicha were 24.08 cmol (+)/kg and 15.83 cmol (+)/kg, respectively (Table 5). The subsurface horizons had CEC values ranging from 13.07 to 39.32 cmol (+)/kg and 23.12–27.14 cmol (+)/kg, respectively (Table 5). The soils under investigation have CEC values ranging from medium to very high (Hazelton and Murphy, 2016), which suggests sufficient buffering and nutrient retention. But across soil depths, there was no consistent trend in the cation exchange capacity beneath the four pedons. A comparison of the Jara Gelalicha and Aruma surface horizons revealed that the latter has a higher cation exchange capacity (CEC). This difference in CEC can be attributed to the presence of organic carbon in the soil, as well as the relatively high clay concentration. The soil in the research area, with its high CEC, has an excellent capacity to buffer and retain nutrients. However, CEC did not show a consistent pattern at various soil depths. According to Landon (1991), soils with CEC values less than 5, 5–15, 15–25, 25–40, and <40 cmol (+)/kg are classified as very low, low, medium, high, and very high, respectively. The CEC values of the soils were studied were typically in the low to high range (Hazelton and Murphy, 2016) indicating strong nutrient retention and buffering capability. However, the cation exchange capacity under the two pedons showed an unsystematic tendency along soil depths.

Table 5. Exchangeable bases, cation exchange capacity, total exchangeable base, Ca: Mg ratio and percent base saturation of soil profiles of the study areas.
In decreasing sequence, Ca2+ > Mg2+ > K+ > Na+ were the predominant cations filling the exchange sites. The calcium (Ca) concentration decreased with increasing soil depth in the Jara Gelalicha and Aruma locations (Table 5). In the surface layer of Jara Gelalicha and Aruma, exchangeable calcium values were 8.23 cmol (+)/kg and 10.95 cmol (+)/kg, respectively (Table 5). In the sub-surface horizons, exchangeable Ca ranged from 11.78 cmol (+)/kg to 14.91 cmol (+)/kg and 10.95 to 4.32 cmol (+)/kg (Table 5). In Jara Gelalicha, exchangeable Ca increased with depth, while at Jara Gelalicha, Ca had no systematic trend with depth. The pH value of five–nine was the most ideal pH ranges for the obtainability of Ca2+, and the highest concentration of Ca2+ showed the status of weathering (Hazelton and Murphy, 2016; Dinssa and Elias, 2021; Mathwos and Mesfin, 2024). The Ca: Mg ratios of the surface layers in the Jara Gelalicha and Aruma areas were 3.9: 1 and 3.8:1, respectively, falling within the (1–4:1) low Ca value range for most crop production. According to Hazelton and Murphy (2016), Ca: Mg ratio less than 4:1 resulted in low Ca availability, indicating a scarcity of Ca uptake due to an excess of Mg or washing away basic cations due to the high amount of rainfall. According to Hazelton and Murphy (2016), the Ca: Mg ratio in both pedons of the surface soils was less than 4:1, which meant that there was a limited supply of calcium. This might be because excessive magnesium prevents the body from absorbing calcium, or excessive rainfall can wash out the basic cations (Sebnie et al., 2021; Mathwos and Mesfin, 2024). Calcium and magnesium were the main basic cations found in the soils, these findings are consistent with previous studies by Sharu et al. (2013), Paramasivan and Jawahar (2014), and Kebede et al. (2017). In Jara Gelalicha profile, there was an increase in trends in the value of exchangeable calcium related to soil depth. This could be a result of parent materials containing calcium being distributed regularly throughout the soil profiles (Sebnie et al., 2021). The Aruma soils had lower values of exchangeable bases, while the Jara Gelalicha soils showed higher values (Table 5). The Aruma area generally showed a irregular trend in cation exchange capacity with profile depth, which may have resulted from a strong correlation between OC and cation exchange capacity. This result is consistent with Kedir’s (2015), who reported that variations in organic matter account for variations in cation exchange capacity, i.e., an increase in organic matter led to an increase in CEC.
Exchangeable potassium (K) and sodium (Na) in Jara Gelalicha ranged from 1.17 to 2.77 and 0.85–1.76 cmol (+)/kg, respectively, while the contents of exchangeable calcium and magnesium changed from the surface to subsurface from 11.78 to 14.91 cmol (+)/kg and 3.17–11.84 cmol (+)/kg, respectively (Table 5). This finding aligns with Kedir’s (2015) research, which indicated that variations in organic matter contribute to changes in cation exchange capacity, meaning an increase in organic matter leads to a higher CEC. According to Hazelton and Murphy (2007), the exchangeable calcium in the Jara Gelalicha soils was rated as high, while the values in the Jara Gelalicha and Aruma soils ranged from high to medium to high (Table 5). Exchangeable calcium was the most dominant cation at the exchange site in Jara Gelalicha, followed by magnesium (Mg), potassium (K), and sodium (Na) across the pedon horizon (Table 5), demonstrating a suitable basic cation distribution according to Food and Agricultural Organization of the United Nations/World Reference Base for Soil Resources (2014).
3.2.4 Extractable micronutrient contents of soils
The available micronutrient contents all showed irregular trends with increasing soil depth in both areas, except for Mn, which showed a decreasing trend with increasing depth in Aruma (Table 6). In the both area pedons, the extracted micronutrient concentrations were Mn > Fe > Zn > Cu. In the Jara Gelalicha, available iron (Fe) ranged from 1.14 to 3.06 mg kg−1 in subsurface horizons and 2.27 kg−1 in the surface soil horizon. In the Aruma, Fe available in the surface horizons was 3.78 mg kg-1, while available Fe in the irregular trend in Fe concentration as the depth increased. In the Jara Gelalicha area, available manganese (Mn) ranged from 2.87 to 7.68 mg kg−1 in subsurface horizons and 6.02 mg kg−1 in the surface soil horizon. In the Aruma area, available Mn ranged from 1.397 to 24.51 mg kg-1 in subsurface horizons and 34.11 mg kg-1 in surface horizons. Many factors influence soil micronutrient content, with the most important being soil organic matter, moisture, soil aeration, soil pH, and clay content (Ashenafi et al., 2010). According to Jones (2003), the available Zn concentrations extracted from the surface horizons of the Jara Gelalicha and Aruma locations were considered moderate (marginal) and high (sufficient), respectively. Zinc content below 0.5 mg Zn kg-1 was considered insufficient by the authors, possibly due to the high pH that leads to zinc sorption caused by the presence of high CaCO3 (Najafi-Ghiri et al., 2013).
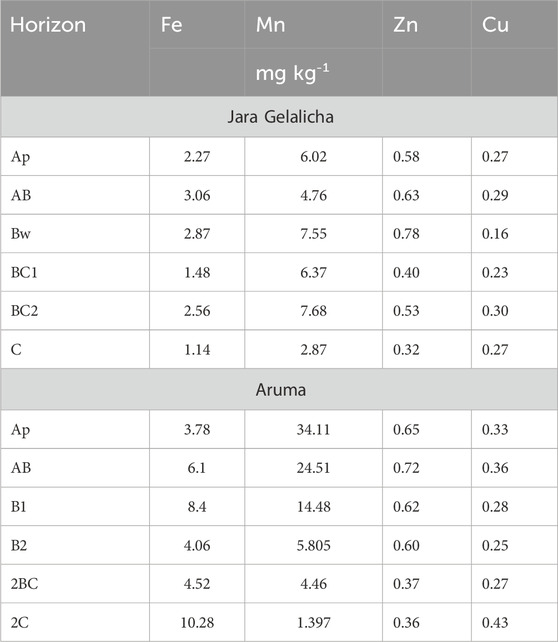
Table 6. Extractable micronutrient contents of Jara Gelalicha and Aruma areas of soil.
3.3 Pearson correlation coefficients
The research revealed that certain soil physicochemical properties had substantial associations with one another, whilst others did not have relevant relationships in both sites (Table 7). In the Jara Gelalicha and Aruma areas, among the positively correlated parameters, organic carbon (OC) was significantly correlated with clay (r = 0.738*, 0.831**), total nitrogen (TN) (r = 0.892***, 0.981***), available phosphorus (Av.P) (r = 0.984****, 0.973***), calcium with CEC, and Mg with CEC and pH, respectively (Table7). These positive associations indicate that organic carbon improves the soil’s ability to retain nutrients and overall soil fertility. For example, TN and Av. P, both important for plant growth, have strong positive associations with OC, showing that higher organic content improves nutrient availability in the soil. On the other hand, some parameters showed negative correlations. In Jara Gelalicha and Aruma sites, clay showed a significant negative correlation with bulk density (BD) (r = −0.110, −0.421), respectively (Table 7). Bulk density indirectly measures soil porosity, indicating that higher clay content tends to reduce the total pore space in the soil, possibly due to the smaller size of clay particles and their tendency to compact. Similarly, Ca showed a negative correlation with sand (r = −0.040, −0.023), suggesting that an increase in calcium might decrease sand. These relationships highlight how certain soil properties can inhibit or promote others, underlining the complex interdependence of soil chemistry and structure (Table 7). A similar result was reported by Mengiste et al. (2025). Therefore, this indicates that as organic carbon increases, the bulk density of soil decreases.
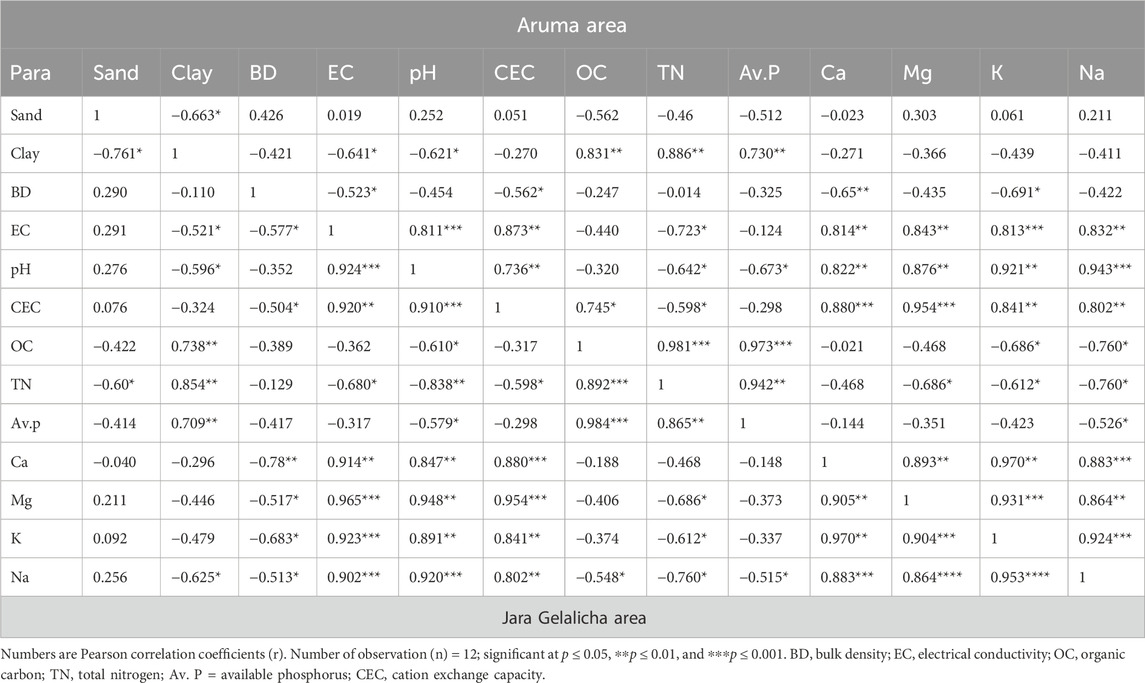
Table 7. Correlation matrix for linear relationships between soil physicochemical properties of the study areas.
3.4 Classification of soil of the study areas
3.4.1 Soil classification based on WRB legend
Using the IUSS Working Group WRB (2022) classification, the soils in the study areas were classified based on morphological and physiochemical characteristics. The pedon opened in Jara Gelalicha on level land, had silt/clay ratio of >1, showed evidence of pedogenic alteration without significant accumulation of illuviated materials like clay or organic matter, which is a typical feature of cambic subsurface diagnostic horizon. These characteristics met the criteria for Cambisols as a reference soil group. According to Dinnsa and Elias (2021) and Ahukaemere et al. (2017), soils with a silt/clay ratio of less than 0.15 are considered weathered, while Cambisols with a Si/C ratio of more than 0.15 are younger and have a higher potential for weathering. The silt/clay ratio is significant in determining soil weathering because soils with a higher silt/clay ratio are less weathered and contain more clay minerals like smectite, resulting in high water retention and plant-available water capacity (Ivory et al., 2014). The pedon had high (>50%) percent base saturation that qualify Eutric principal qualifier. The textural classes of the horizons of the pedon were sandy loam, sandy clay loam and loam which qualify the requirement of Loamic supplementary qualifier. Thus, the pedon was classified as Eutric Cambisols (Loamic).
The surface horizon of the pedon in Aruma area had high organic carbon (3.57%); a Munsell soil colour value of ≤3 moist, and ≤5 dry, and a chroma of ≤3 moist. As the result the pedon had mollic surface diagnostic horizon. The surface horizon of the pedon had low bulk density (0.87 g/cm3) and high (67.29%) porosity. According to Temesgen et al. (1999), the Aruma area contains volcano lacustrine deposits with basaltic lava. Therefore, the soil of the study area was classified as Andosols, volcanic ash soils. The pedon had high (>50%) percent base saturation that qualify Eutric principal qualifier. The textural classes of the horizons of the pedon were sandy clay loam and clay loam which qualify the requirement of Loamic supplementary qualifier. Therefore, the pedon was classified as Eutric Andosols (Loamic) (Table 8).
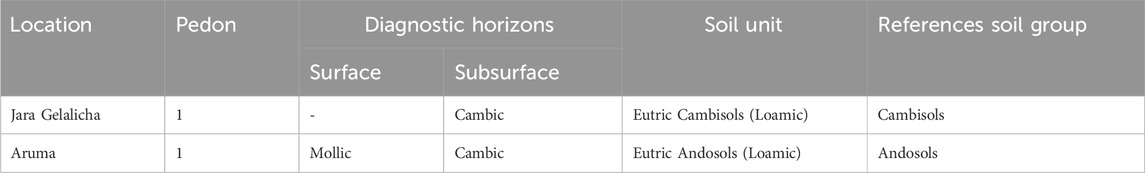
Table 8. Diagnostic horizons and soil units at two locations according to WRB (2022).
4 Conclusions
Soil characterization and classification was carried out in Sidama region of Jara Gelalicha (Hawassa Zuria) and Aruma (Wondo Genet) with the purpose of generating site specific soil information which could help for soil fertility management and land use decision. The soils of the two sites had different morphological, physical and chemical properties leading to different reactions to management practices, abilities to provide ecosystem services naturally, resilience to disturbance, and susceptibility to deterioration. The surface horizon textural class of pedon in Jara Gelalicha was sandy loam; whereas, the textural class of the pedon at Aruma was sandy clay loam. The surface horizon OC of Aruma (3.57%) was higher than Jara Gelalicha (2.39%). Likewise, the total nitrogen content of the surface horizon of Aruma (0.32%) was greater than Jara Gelalicha (0.23%). Similarly, the CEC value of the surface horizon at Aruma (24.08 cmol (+)/kg) was greater than Jara Gelalicha (15.83 cmol (+)/kg). The Jara Gelalicha pedon was classified as Eutric Cambisols (Loamic); whereas, the Aruma pedon was classified as Eutric Andosols (Loamic). Therefore, the soil fertility management and land use decision should consider such soil variability.
Data availability statement
The raw data supporting the conclusions of this article will be made available by the authors, without undue reservation.
Author contributions
HA: Conceptualization, Data curation, Formal Analysis, Investigation, Methodology, Software, Visualization, Writing – original draft. WH: Conceptualization, Data curation, Investigation, Supervision, Validation, Visualization, Writing – review and editing. AK: Conceptualization, Data curation, Formal Analysis, Funding acquisition, Investigation, Methodology, Resources, Software, Supervision, Visualization, Writing – review and editing.
Funding
The author(s) declare that no financial support was received for the research and/or publication of this article.
Acknowledgments
We would like to express our sincere appreciation to Samara and Hawassa Universities for support and provision of opportunity for one of the authors to attend PhD program. Additionally, we extend our thanks to the Hawassa University Soil Science laboratory experts for their substantial facility of equipment for sample collection and analysis.
Conflict of interest
The authors declare that the research was conducted in the absence of any commercial or financial relationships that could be construed as a potential conflict of interest.
Generative AI statement
The author(s) declare that no Generative AI was used in the creation of this manuscript.
Publisher’s note
All claims expressed in this article are solely those of the authors and do not necessarily represent those of their affiliated organizations, or those of the publisher, the editors and the reviewers. Any product that may be evaluated in this article, or claim that may be made by its manufacturer, is not guaranteed or endorsed by the publisher.
References
Abate, N., Kibret, K., Gebrekidan, H., and Esayas, A. (2014). Characterization and classification of soils along the toposequence at the wadla delanta massif, north central highlands of Ethiopia. J. Ecol. Nat. Environ. 6 (9), 304–320. doi:10.5897/jene2014.0463
Abayneh, E., and Berhanu, D. (2000). “Soil survey in Ethiopia: the past, present and future,” in Proceedings of the seventh conference of the Ethiopian Society of Soil Science on soils for sustainable Ali et al. 197 development, Addis Ababa, Ethiopia, April2006, 61–79.
Abera, T., Wegary, D., Semu, E., Msanya, B. M., Debele, T., and Kim, H. (2016). “Pedological characterization, fertility status and classification of the soils under maize production of bako tibe and toke kutaye districts of western showa,”. Ethiopia.
Achalu Chimdi, A. C., Heluf Gebrekidan, H. G., Kibebew Kibret, K. K., and Abi Tadesse, A. T. (2012). Status of selected physicochemical properties of soils under different land use systems of Western Oromia, Ethiopia. Available online at: http://www.innspub.net.
Adhanom, D., and Toshome, T. (2016). Characterization and classification of soils of aba-midan sub watershed in bambasi wereda, west Ethiopia. Int. J. Sci. Res. Publ. 6 (6), 390–399.
Ahukaemere, C. M., Osujieke, D. N., and Ndukwu, B. N. (2017). Horizon differences in micronutrient contents of soils of the Coastal plain sands in Imo State, South-east Nigeria. Micronutr. contents pedons Form. under Coast. plain sands.
Alemu, L., and Buraka, T. (2018). Soil classification and agricultural potentials of soils of tembaro district, kembata tembaro zone, southern Ethiopia. Environ. Sci. 10 (6), 75–91.
Ali, A., Esayas, A., and Beyene, S. (2010). Characterizing soils of Delbo Wegene watershed, Wolaita Zone, Southern Ethiopia for planning appropriate land management. J. Soil Sci. Environ. Manag. 1 (8), 184–199. Available online at: http://www.academicjournals.org/JSSEM.
Anbessa, B. (2018). Soil characterization and response of maize (Zeamays L.) to application of blended fertilizer types and rates in Asossa district, Western Ethiopia. Hawassa University. Sc Thesis.
Ashenafi, A., Esayas, A., and Beyene, S. (2010). Characterizing soils of Delbo Wegene watershed, Wolaita Zone, Southern Ethiopia for planning appropriate land management. J. Soil Sci. Environ. Manag. 1 (8), 184–199.
Ashokkumar, H. P., and Prasad, J. (2010). Some typical sugarcane-growing soils of Ahmadnagar district of Maharashtra: their characterization and classification and nutritional status of soils and plants. J. Indian Soc. Soil Sci. 58 (3), 257–266.
Asomoa, G. K. (1973). Particle-size free iron oxide distribution in some latosols and groundwater laterites of Ghana. Georderma 10, 285–297. doi:10.1016/0016-7061(73)90003-7
Assen, M., and Yilma, S. (2010). Characteristics and classification of the soils of gonde micro-catchment, Arsi highlands, Ethiopia. SINET Ethiop. J. Sci. 33 (2), 101–116.
Ayalew, A. (2010). Mycotoxins and surface and internal fungi of maize from Ethiopia. Afr. J. Food, Agric. Nutr. Dev. 10 (9). doi:10.4314/ajfand.v10i9.62890
Ayalew, A., and Beyene, S. (2012). Characterization of soils at Angacha district in southern Ethiopia. J. Biol. Agric. Healthc. 2 (1), 2224–3208.
Ayalew, A., Beyene, S., and Walley, F. (2015). Characterization and classification of soils of selected areas in southern Ethiopia. J. Environ. Earth Sci. 5 (11), 116–137.
Ayele, A., Woldearegay, K., and Meten, M. (2022). Multichannel analysis of surface waves (MASW) to estimate the shear wave velocity for engineering characterization of soils at Hawassa Town, Southern Ethiopia. Int. J. Geophys. 2022 (1), 1–22. doi:10.1155/2022/7588306
Beyene, S. (2017). Topographic positions and land use impacted soil properties along Humbo Larena-Ofa Sere toposequence, Southern Ethiopia. J. Soil Sci. Environ. Manag. 8 (8), 135–147. doi:10.5897/jssem2017.0643
Blake, G. R. (1965). Bulk density. Methods Soil Analysis Part 1 Phys. Mineralogical Prop. Incl. Statistics Meas. Sampl. 9 (1), 374–390. doi:10.2134/agronmonogr9.1.c30
BoFED, S. N. N. P. R. (2018). Southern nation nationality peoples regional state bureau of finance and economic development (SNNPR BoFED).
Bouyoucos, G. J. (1962). Hydrometer method improvement for making particle size analysis of soils. Agron. J. 54 (5), 179–186. doi:10.2134/agronj1962.00021962005400050028x
Brady, N. C., Weil, R. R., and Weil, R. R. (2008). The nature and properties of soils, 13. Upper Saddle River, NJ: Prentice Hall, 662–710.
Buol, S. W., Southard, R. J., Graham, R. C., and McDaniel, P. A. (2003). Soil genesis and classification. Ames: Iowa State Press Blackwell Publishing Co.
Carrow, R. N. (2004). Clarifying soil testing: III. SLAN sufficiency ranges and recommendations. Golf Course Manag. 72 (1), 194–198.
Chekol, W., and Mnalku, A. (2012). Selected physical and chemical characteristics of soils of the middle awash irrigated farm lands, Ethiopia. Ethiop. J. Agric. Sci. 22 (1), 127–142.
Chemeda, M., Kibret, K., and &Fite, T. (2017). Influence of different land use types and soil depths on selected soil properties related to soil fertility in Warandhab area, Horo Guduru Wallaga Zone, Oromiya, Ethiopia. Int. J. Environ. Sci. Nat. Resour. 4, 555634. doi:10.19080/ijesnr.2017.04.555634
Dash, P. K., Antaryami Mishra, A. M., and Subhashis Saren, S. S. (2019). Characterization and taxonomic classification of soils under a toposequence located in Eastern India.
Debele, M., Bedadi, B., Beyene, S., and Mohammed, M. (2018). Characterization and classification of soils of muger sub-watershed, northern oromia, Ethiopia. East Afr. J. Sci. 12 (1), 11–28.
Demiss, M., and Beyene, S. (2010). Characterization and classification of soils along the toposequence of Kindo Koye watershed. East Afr. J. Sci. 4, 65–77.
Dessalegn, D., Beyene, S., Ram, N., Walley, F., and Gala, T. S. (2014). Effects of topography and land use on soil characteristics along the toposequence of ele watershed in southern Ethiopia. Catena 115, 47–54. doi:10.1016/j.catena.2013.11.007
Dinssa, B., and Elias, E. (2021). Characterization and classification of soils of bako tibe district, west shewa, Ethiopia. Heliyon 7 (11), e08279. doi:10.1016/j.heliyon.2021.e08279
Dorji, T., Odeh, I. O., and Field, D. J. (2014). Vertical distribution of soil organic carbon density in relation to land use/cover, altitude and slope aspect in the eastern Himalayas. Land 3 (4), 1232–1250. doi:10.3390/land3041232
FAO (2006). “Guidelines for soil profile description,” in Soil resources, management and conservation service, land and water development division. Rome: FAO.
FAO (2017). Voluntary guidelines for sustainable soil management, 16p. Rome, Italy: Food and Agriculture Organization of the United Nations FAO. Available online at: http://www.fao.org/3/a-bl813e.pdf.
Food and Agricultural Organization of the United Nations/World Reference Base for Soil Resources. (2014). International soil classification system for naming soils and creating legends for soil maps (Report no. 106).
Fekadu, E., Kibret, K., Bedadi, B., and Melese, A. (2018). Characterization and classification of soils of yikalo subwatershed in Lay Gayint district, northwestern highlands of Ethiopia. Eurasian J. Soil Sci. (EJSS) 7 (2), 151–166. doi:10.18393/ejss.376267
Getahun, M. (2015). Characterisation of agricultural soils in CASCAPE intervention woredas of Amhara region. Bahir Dar. No. BDU-CASCAPE working paper 12.
Giday, O., Gibrekidan, H., and Berhe, T. (2015). Soil fertility characterization in Vertisols of southern Tigray, Ethiopia. Adv. Plants and Agric. Res. 2 (1), 7–13. doi:10.15406/apar.2015.02.00034
Hailu, A. H., Kibret, K., and Gebrekidan, H. (2015). Characterization and classification of soils of kabe subwatershed in south wollo zone, northeastern Ethiopia. Afr. J. Soil Sci. 3 (7), 134–146. Available online at: www.internationalscholarsjournals.org.
Hajabbasi, M. A. (2005). Soil physical properties due to different tillage systems in dryland regions of Northwestern Iran. Casp. J. Environ. Sci. 3 (2), 89–97.
Hartz, T. K. (2007). Soil testing for nutrient availability: procedures and interpretation for California vegetable crop production. Davis, CA, USA: Dept. of Plant Sciences.
Hazelton, P., and Murphy, B. (2007). Interpreting Soil Test Results: what do all the numbers mean? Second edition. Australia: CSIRO Publishing, 52p.
Hazelton, P., and Murphy, B. (2016). Interpreting soil test results: what do all the numbers mean? Australia; CSIRO publishing.
Hillel, D. (1980). Fundamentals of soil physics. San Diego: Harcourt Brace Jovanovich publisher, Academic press, Inc., 74–79.
Hundessa, M. (2020). Characterization of agricultural soils of meki and adamitulu in the central rift valley of Ethiopia. Acad. Res. J. Agric. Sci. Res. 8 (1), 12–23. doi:10.14662/ARJASR2019.146
IUSS Working Group WRB (2022). World reference base for soil resources. Vienna, Austria: International Union of Soil Sciences IUSS. Available online at: https://www.isric.org/sites/default/files/WRB_fourth_edition.
Ivory, S. J., McGlue, M. M., Ellis, G. S., Lézine, A. M., Cohen, A. S., and Vincens, A. (2014). Vegetation controls on weathering intensity during the last deglacial transition in southeast Africa. PloS one 9 (11), e112855. doi:10.1371/journal.pone.0112855
Jackson, M. (1958). Soil chemical analysis, prentice Hall, inc englewood cliffs NJ, 498. New Delhi: Prentice Hall of India, Private Limited, New Delh, 183–204. doi:10.1002/jpln.19590850311
Jones, J. B. (2003). Agronomic Handbook: management of crops, soils, and their fertility. Boca Raton, Florida, USA: CRC Press, 482p.
Kalala, A. M., Msanya, B. M., Amuri, N. A., and Semoka, J. M. (2017). Pedological characterization of some typical alluvial soils of Kilombero District. Tanzania. doi:10.11648/j.ajaf.20170501.11
Kebede, M., Shimbir, T., Kasa, G., Abera, D., and Girma, T. (2017). Description, characterization and classification of the major soils in jinka agricultural research center, south western Ethiopia. J. Soil Sci. Environ. Manag. 8 (3), 61–69. doi:10.5897/JSSEM2015.0498
Kebeney, S. J., Msanya, B. M., Ng’etich, W. K., Semoka, J. M. R., and Serrem, C. K. (2014). Pedological characterization of some typical soils of Busia County, Western Kenya: soil morphology, physico-chemical properties, classification and fertility trends. Int. J. Plant and Soil Sci. 4 (1), 29–44.
Kedir, A. F. (2015). Soil fertility assessment and mapping of amaregenda-abajarso sub-watershed in dessie Zuria district, north-eastern Ethiopia doctoral dissertation. Harmaya University.
Khanday, M., Wani, J. A., Ram, D., and &Kumar, S. (2018). Depth wise distribution of available nutrients of soils of horticulture growing areas of Ganderbal District of Kashmir Valley. J Pharmacogn. Phytochem 7 (1), 19–22.
Kumar, R. A. K. E. S. H., Rawat, K. S., and Yadav, B. (2012). Vertical distribution of physico-chemical properties under different topo-sequence in soils of Jharkhand. J. Agric. Phys. 12 (1), 63–69.
Landon, J. R. (1991). Booker tropical soil manual. A handbook for soil survey and agricultural land evaluation in the tropics and sub tropics. New York: John Wiley and Sons, 94–95.
Lelago, A., and Buraka, T. (2019). Determination of physico-chemical properties and agricultural potentials of soils in tembaro district, KembataTembaro zone, southern Ethiopia. KembataTembaro Zone Eurasian J. Soil Sci. 8 (2), 118–130. doi:10.18393/ejss.533454
Lindsay, W. L., and Norvell, W. (1978). Development of a DTPA soil test for zinc, iron, manganese, and copper. Soil Sci. Soc. Am. J. 42 (3), 421–428. doi:10.2136/sssaj1978.03615995004200030009x
Liu, T., Dong, X., Guo, K., Wang, J., Liu, X., and Sun, H. (2024). Effects of fertilizer types and application levels on phosphorus availability of saline soils and crops: a meta-analysis. Land Degrad. and Dev. 35 (13), 4068–4080. doi:10.1002/ldr.5205
Lufega, S., and Msanya, B. (2017). Pedological characterization and soil classification of selected soil units of Morogoro District, Tanzania. Int. J. Plant and Soil Sci. 16 (1), 1–12. doi:10.9734/ijpss/2017/32681
Maria, R. M., and Yost, R. (2006). A survey of soil fertility status of four agroecological zones of Mozambique. Soil Sci. 171 (11), 902–914. doi:10.1097/01.ss.0000228058.38581.de
Mathewos, M., and Mesfin, K. (2024). Characterization and classification of agricultural soils of ajacho lintala irrigation scheme, soro district, hadiya zone, southern Ethiopia. Sustain. Environ. 10 (1), 2318054. doi:10.1080/27658511.2024.2318054
Mengiste, W., Tsegaye, D., Dagalo, S., and Yitbareke, T. (2025). Characterization and classification of soils in the irrigable land of Achewa small-scale irrigation area, Itang special district, southwest Gambella, Ethiopia. Front. Soil Sci. 4, 1451271. doi:10.3389/fsoil.2024.1451271
Meron, N. (2007). Characterization of salt affected soils in the central Rift Valley and assessing salt tolerance of different plants: a case study at the southwestern shore of Lake Ziway Doctoral dissertation (Addis Abeba University), 75. MSc Thesis.
Merumba, M., Msanya, B. M., Semu, E., and Semoka, J. M. (2024). Pedological characterization and suitability assessment for cassava production in bukoba, missenyi and biharamulo districts, Tanzania. Available online at: https://papers.ssrn.com/abstract=4883961 (Accessed November 22, 2024).
Mohamed, S. H., Msanya, B. M., Tindwa, H. J., and &Semu, E. (2021). Pedological characterization and classification of selected soils of morogoro and mbeya regions of Tanzania. Int. J. Nat. Resour. Ecol. Manag. 2021 (6), 79–92.
Moshago, S., Regassa, A., and Yitbarek, T. (2022). Characterization and classification of soils and land suitability evaluation for the production of major crops at anzecha watershed, gurage zone, Ethiopia. Appl. Environ. Soil Sci. 2022, 1–22. doi:10.1155/2022/9733102
Mulugeta, D., and Sheleme, B. (2010). Characterization and classification of soils along the toposequence of kindo koye watershed in southern Ethiopia. East Afr. J. Sci. 4 (2), 65–77. doi:10.4314/eajsci.v4i2.71528
Najafi-Ghiri, M., Ghasemi-Fasaei, R., and Farrokhnejad, E. (2013). Factors affecting micronutrient availability in calcareous soils of Southern Iran. Arid land Res. Manag. 27 (3), 203–215. doi:10.1080/15324982.2012.719570
Olsen, S. R. (1954). Estimation of available phosphorus in soils by extraction with sodium bicarbonate (No. 939). U. S. Dep. Agric.
Onyekanne, C. F., and Nnaji, G. U. (2012). Characterization and classification of soils of Ideato North local government area. Niger. J. Soil Sci. 22 (1), 11–17.
Paramasivan, M., and Jawahar, D. (2014). Characterization, classification and crop suitability of some black cotton soils of southern Tamil Nadu. Agropedology (1), 111–118.
Patil, R. B., and Prasad, J. (2004). Characteristics and classification of some sal (shorea robusta)-supporting soils in dindori district of Madhya Pradesh. J. Indian Soc. Soil Sci. 52 (2), 119–125.
Rowell-Fuller, T. J., Codrescu, M. V., Moffett, R. J., and Quegan, S. (1994). Response of the thermosphere and ionosphere to geomagnetic storms. J. Geophys. Res. Space Phys. 99 (A3), 3893–3914. doi:10.1029/93ja02015
Sarkar, D., and Haldar, A. (2005). Physical and chemical methods in soil analysis: fundamental concepts of analytical chemistry and instrumental techniques. New Age International Limited Publishers, 176p.
Sebnie, W., Adgo, E., and Kendie, H. (2021). Characterization and classification of soils of zamra irrigation scheme, northeastern Ethiopia. Air, Soil Water Res. 14, 11786221211026577. doi:10.1177/11786221211026577
Sekhar, C., Naidu, M., Tata, R., and Balaguravaiah, D. (2017). Characterization and classification of soils in the central parts of Prakasam district in Andhra Pradesh, India. Int. J. Curr. Microbiol. Appl. Sci. 6, 2699–2712. doi:10.20546/ijcmas.2017.610.318
Sekhar, C. C., Balaguravaiah, D., and Naidu, M. V. S. (2014). Studies on genesis, characterization and classification of soils in central and Eastern parts of Prakasam district in Andhra Pradesh. Agropedology 24 (2), 125–137.
Sharu, M. B., Yakubu, M., Noma, S. S., and Tsafe, A. I. (2013). Characterization and classification of soils on an agricultural landscape in dingyadi district, sokoto state, Nigeria. Niger. J. Basic Appl. Sci. 21 (2), 137–147. doi:10.4314/njbas.v21i2.9
Temesgen, B., Umer, M., Asrat, A., Berakhi, O., Ayele, A., Franceco, D., et al. (1999). Landslide hazard on the slopes of dabicho ridge, Wondo Genet area: the case of june 18, 1996 event. Sinet . Ethiop.J. Sci. 22 (1), 127–140. doi:10.4314/sinet.v22i1.18138
U.S. (United States) Salinity Laboratory Staff (1954). Diagnosis and improvement of saline and alkali soils. U. S. Dep. Agric. 60, 145p.
Uwitonze, P., Msanya, B. M., Mtakwa, P. W., Uwingabire, S., and Sirikare, S. (2016). Pedological characterization of soils developed from volcanic parent materials of Northern Province of Rwanda. Agric For Fish 5 (6), 225–236. doi:10.11648/j.aff.20160506.13
Wakene, N. (2001). Assessment of important physicochemical properties of nitosols under different management systems in bako area, western Ethiopia (Alemaya .Ethiopia: Alemaya University), 109. Msc Thesis.
Walche, A., Haile, W., Kiflu, A., and Tsegaye, D. (2023). Assessment and characterization of agricultural salt-affected soils around abaya and chamo lakes, south Ethiopia rift valley. Appl. Environ. Soil Sci. 2023 (1), 1–18. doi:10.1155/2023/3946508
Walkley, A., and Black, I. A. (1934). An examination of the Degtjareff method for determining soil organic matter, and a proposed modification of the chromic acid titration method. Soil Sci. 37 (1), 29–38. doi:10.1097/00010694-193401000-00003
Wilke, B. M. (2005). “Determination of chemical and physical soil properties,” in Manual of soil analysis: monitoring and assessing soil bioremediation. Editors R. Margesin,, and F. Schinner (Berlin Heidelberg: Springer-Verlag), 5, 47–95. doi:10.1007/3-540-28904-6_2
Yitbarek, T., Jembere, A., and &Kerebeh, H. (2018). Characterization and classification of soils of Wolkite University research sites, Ethiopia. Soil Sci. 7 (4), 292–299. doi:10.18393/ejss.436186
Zewide, I., Tana, T., L, W., and Ibrahim, M. (2018). Soil morphology, physico-chemical properties and classification of typical soils of Abelo Area Masha district South Western Ethiopia. Adv. Crop Sci. Technol. 6 (2), 1–9. doi:10.4172/2329-8863.1000341
Keywords: morphological properties, soil horizons, soil profiles, soil properties, soil types
Citation: Alemayehu H, Haile W and Kiflu A (2025) Characterization and classification of soils at Jara Gelalicha and Aruma areas, Sidama region, southern Ethiopia. Front. Environ. Sci. 13:1569469. doi: 10.3389/fenvs.2025.1569469
Received: 31 January 2025; Accepted: 20 May 2025;
Published: 20 June 2025.
Edited by:
Gian Franco Capra, University of Sassari, ItalyReviewed by:
Mesfin Hailemariam Habtegebriel, Addis Ababa University, EthiopiaRafael Barroca Silva, São Paulo State University, Brazil
Antonio Ganga, University of Sassari, Italy
Copyright © 2025 Alemayehu, Haile and Kiflu. This is an open-access article distributed under the terms of the Creative Commons Attribution License (CC BY). The use, distribution or reproduction in other forums is permitted, provided the original author(s) and the copyright owner(s) are credited and that the original publication in this journal is cited, in accordance with accepted academic practice. No use, distribution or reproduction is permitted which does not comply with these terms.
*Correspondence: Habtamu Alemayehu, aGFidGFtdWFsZW1heWVodTc5QGdtYWlsLmNvbQ==
†ORCID: Wassie Haile, orcid.org/0000-0003-2352-3720; Alemayehu Kiflu, orcid.org/0000-0002-9227-3289
‡These authors share first authorship