 Lenin Esau Henriquez-Dole1,2*
 Jorge Gironás2,3,4,5
 Francisco Meza3,6Esthela Salazar7Cristian Henríquez3,5,8
- 1EcoAgsus: Interdisciplinary Network for Ecosystem Sustainability, Mendoza, Argentina
- 2Departamento de Ingeniería Hidráulica y Ambiental, Pontificia Universidad Católica de Chile, Santiago, Chile
- 3Centro Interdisciplinario de Cambio Global, Pontificia Universidad Católica de Chile, Santiago, Chile
- 4Centro Nacional de Investigación para la Gestión Integrada del Riesgo de Desastres, Santiago, Chile
- 5Centro de Desarrollo Urbano Sustentable, Santiago, Chile
- 6Departamento de Ecosistemas y Medio Ambiente, Pontificia Universidad Católica de Chile, Santiago, Chile
- 7Departamento de Ciencias de la Tierra y la Construcción, Universidad de Fuerzas Armadas ESPE, Sangolqui, Ecuador
- 8Instituto de Geografía, Pontificia Universidad Católica de Chile, Santiago, Chile
Ecosystems are vulnerable to water scarcity and human-induced landscape tranformations. This study evaluates how land use changes alter hydrological regimes in water-scarce regions, such as drylands, employing a novel framework integrating class-level landscape metrics (LM) and Indicators of Hydrologic Alteration (IHA). Historical (1990–2017) and future land use scenarios - Business as Usual (BAU) and Strategic Land Use Planning (PROT) - for two catchments within the Maipo River Basin in Chile were analyzed using LASSO regression to identify key LM, which reflects landscape patterns influencing hydrology. Results reveal that shape and aggregation metrics, particularly urban patch size (SHAPE_MN) and agricultural dispersion (SPLIT), could evidence strong connection between landscape dynamics and hydrology, where deviation explained in critical hydrological signatures ranges from 15% to 98% in monthly flows (IHA 1), and from 25% to 99% in extreme events (IHA 2). Urbanization in Rinconada de Maipú (RM) catchment amplifies peak flows and reduces baseflow, while rural abandonment in Los Almendros catchment stabilizes baseflow (+23%) through vegetation recovery. Future scenarios illustrate context-dependent outcomes. In Los Almendros, characterized by low anthropogenic intervention, PROT scenarios mitigate hydrological degradation more effectively than BAU. However, in the highly urbanized RM catchment, PROT’s benefits are limited, requiring more actions to limit hydrological impacts. Only 64% of LM (74/116) significantly relates to hydrology in the study catchments. This approach offers a replicable tool to identify the most influential landscape metrics over hydrology in a region, streamlining actionable metrics to bridge the work of land use planners and water resources planners by integrating spatial land use configuration with water resources management.
1 Introduction
Drylands, spanning over 40% of the Earth’s terrestrial surface (Luo et al., 2022), are ecosystems of critical ecological and socio-economic value, yet they remain acutely vulnerable to water scarcity and anthropogenic disruption (Berdugo et al., 2020). Hydrological signatures-quantitative measures of streamflow dynamics such as peak discharge, baseflow contributions, and flow seasonality-serve as essential indicators of water resource availability and ecosystem health (Botterill and McMillan, 2023; Gnann et al., 2020). These signatures are increasingly destabilized by human-induced landscape transformations, including urbanization, agricultural intensification, and deforestation, which modify land cover composition and spatial configuration. Such alterations cascade through hydrological systems, influencing infiltration capacity, runoff generation, and groundwater recharge (Liu et al., 2025). For example, impervious surface area (ISA), a metric quantifying urban expansion, has been directly tied to heightened surface runoff, as demonstrated in Turkey’s Terkos Basin, where a 15% increase in ISA elevated peak discharge by 45% (Dogan and Karpuzcu, 2022). Similarly, edge density, reflecting landscape fragmentation, exacerbates hydrological connectivity, accelerating runoff in disturbed catchments.
Landscape metrics, which quantify spatial patterns such as patch cohesion, contagion, and aggregation, provide a mechanistic understanding of how land use changes propagate hydrological impacts (Boongaling et al., 2018). Recent studies highlight specific causal pathways between these metrics and hydrological responses. The percentage of landscape (PLAND) dedicated to urban or croplands has been shown to increase flood frequency in Huang-Huai-Hai River Basin, China, from 1961 to 2020 compared to the pre-industrial period (Ren et al., 2023). In Chihuahua, Mexico, irregularly shaped agricultural patches, increased irrigation inefficiency, contributing up to 80 m groundwater depletion (Alatorre et al., 2019). Contagion, a metric assessing landscape clumpiness, inversely correlates with sediment yield, as observed in Ethiopia’s Upper Blue Nile Basin, where dispersed vegetation raised erosion rates by 40% during extreme rainfall events (Zheng, 2006). These findings underscore the role of spatial configuration in modulating hydrological processes, particularly in water-limited environments.
Despite advancements, significant knowledge gaps persist. Research on landscape–hydrology interactions continues to overlook dynamics that are specific to drylands, including ephemeral streamflow regimes and pulse-driven vegetation growth (Zhou et al., 2020; Langhammer and Bernsteinová, 2025). Furthermore, hydrological models often overlook class-level distinctions in landscape metrics, despite evidence that their impacts vary by land cover type. For instance, forest-edge density and urban-edge density differentially affect evapotranspiration and runoff, yet such nuances are rarely quantified (Ali and Roy, 2010). In Central Europe, deforestation-driven reductions in mean forest patch size diminished annual evapotranspiration, intensifying streamflow variability (Langhammer and Bernsteinová, 2025). Such context-dependent relationships highlight the need for systematic evaluations tailored to dryland ecosystems.
This study aims to address these gaps by identifying the most influential class-level landscape metrics—such as urban patch density, agricultural contagion, and vegetated connectivity—that govern hydrological signatures in drylands, including flow duration curves, recession rates, and low-flow frequency. By establishment of empirical relationships between these metrics and hydrological responses using LASSO regressions, this research shows a framework to select and prioritize metrics for integrations of land-use planning and water management. This framework will enable policymakers to anticipate hydrological trade-offs under future land use scenarios, such as balancing agricultural expansion with groundwater sustainability or mitigating urban flooding through green infrastructure. Ultimately, this work bridges landscape ecology and hydrology, offering actionable insights for sustainable water governance in regions where societal resilience hinges on the prudent management of water and land.
2 Materials and methods
2.1 Methodological framework
This study integrates multi-temporal Landsat imagery (November–January, 1990–2017) to analyze landscape dynamics and hydrological responses in two dryland catchments within the Maipo River Basin, Chile (Figure 1). Seventy cloud-free satellite scenes were processed using the System for Automated Geoscience Analyses (SAGA-GIS) to classify local climate zones (LCZs) following the World Urban Database and Access Portal Tools (WUDAPT) protocol (Ching et al., 2018), generating 54 spatial maps. Land use was initially classified into 17 categories but reclassified into five simplified groups—urban, agriculture, vegetation, bare soil, and water—to quantify anthropogenic modifications while maintaining analytical tractability.
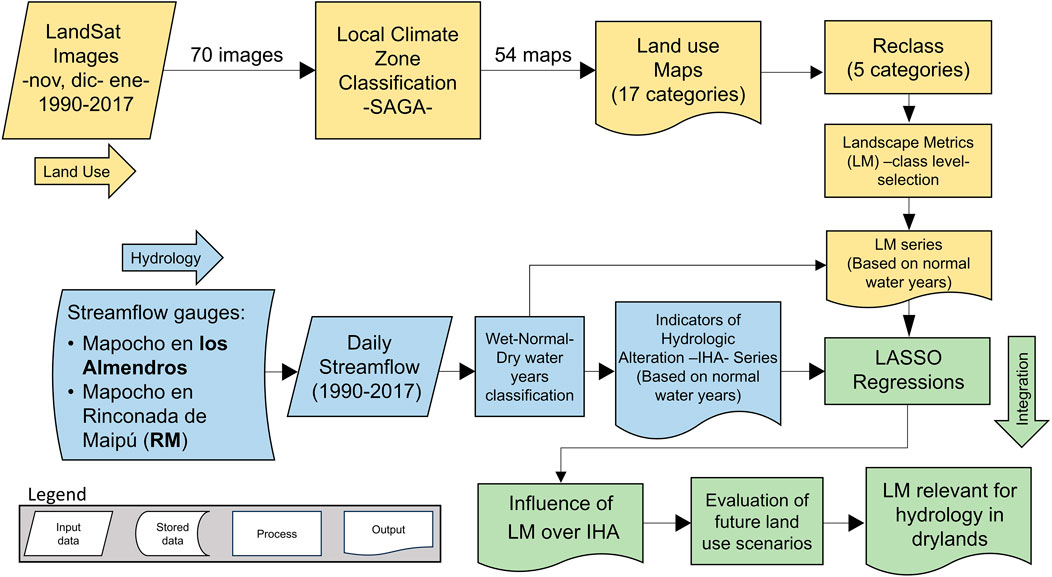
Figure 1. Methodological flamework.
Normal water years represent baseline hydrological conditions in which water withdrawals correspond to long-term average demands, thereby avoiding distortions caused by emergency rationing or excessive extraction that can obscure the impacts of land use change (Scanlon et al., 2023). To ensure that the analysis reflects landscape-driven hydrological alterations rather than transient responses to climatic extremes or atypical management, our study focused exclusively on these normal water years. Hydrological data, consisting of daily streamflow records from 1990 to 2017 collected at gauging stations on the Mapocho River at Los Almendros and Rinconada de Maipú, were stratified into wet, normal, and dry water years using exceedance probability thresholds (Benítez Girón, 1998). We used Indicators of Hydrologic Alteration (IHA) as Hydrologic Signatures derived from the normal year data to assess changes in flow regime characteristics, including peak flow timing and baseflow stability, enabling robust monitoring of hydrologic responses to landscape modifications.
We identified landscape metrics (e.g., impervious surface density, patch cohesion) with significant influence over IHAs using LASSO regression models (Tibshirani, 1996; Li and Zhou, 2015). LASSO regression is especially effective for variable selection in high-dimensional datasets (where many explanatory variables are present for potentially small datasets) because it introduces a penalty that shrinks some coefficient estimates to exactly zero, thereby excluding less relevant variables from the model. Unlike traditional regression methods, LASSO handles high-dimensional data efficiently by simultaneously performing variable selection and regularization, which helps prevent overfitting. Furthermore, LASSO effectively deals with multicollinearity by selecting among correlated variables, producing more stable and parsimonious models. It balances model fit and complexity by tuning the penalty parameter, ensuring robustness and better generalization to unseen data. As a result, LASSO is highly suitable for environmental studies involving many interrelated variables, identifying key predictors while avoiding overfitting and excessively complex models (Slater et al., 2023; Pak et al., 2025; Moosavi et al., 2022).
Finally, we applied these LASSO regression models to future land use scenarios from Henríquez-Dole et al. (2018) to evaluate hydrological impacts under varying urbanization and policy trajectories. Metrics prioritized through this analysis -such as connectivity index and mean patch size-provide actionable insights for sustainable water management in drylands, where balancing agricultural and urban demands remains critical to resilience (Ghahremani et al., 2024).
2.2 Study area
The Maipo River Basin is situated between 33°S and 34°S in central Chile. Encompassing an area of 15,157 km2, the basin spans an elevational gradient from sea level to 6,500 m above sea level (m.a.s.l.) within the Andes Mountain range. It lies within a Mediterranean bioclimatic zone characterized by semi-arid conditions, marked by hot, dry summers and cool, wet winters (Luebert and Pliscoff, 2006; Vogiatzakis et al., 2006). Mean annual temperatures range from 14 °C in lowland areas to below 0 °C at high elevations, with summer (December–February) maxima exceeding 30 °C in the central valley and winter (June–August) minima dropping to 3 °C–5 °C. Annual precipitation averages 300–400 mm, predominantly concentrated during the winter months (May–September), though spatial variability is significant due to orographic effects, with Andean regions receiving up to 1,000 mm annually, partly as snowfall (Garreaud, 2009). Humidity levels are generally low (<50% annual average), particularly during summer, exacerbating aridity in the basin’s lowland areas (MOP, 2021).
The basin spans three administrative regions, including the Metropolitan Region, which hosts Santiago, Chile’s capital. The Metropolitan Region supports a population exceeding 7 million residents across its 52 municipalities, with a population density of 430 individuals per km2 (Meza et al., 2014). Additionally, the region contributes approximately 40% of Chile’s Gross Domestic Product (Ocampo-Melgar et al., 2016).
This study focuses on two contrasting catchments within the Maipo River Basin: Los Almendros and Rinconada de Maipú (RM) (Figure 2). These catchments exhibit distinct landscape configurations and anthropogenic influences. The RM catchment encompasses 4,004 km2, whereas Los Almendros covers a smaller area of 637 km2. RM catchment is characterized by intensive human activity, including urbanization and agriculture, whereas Los Almendros remains predominantly undisturbed, with minimal anthropogenic impact. Given that human activity is a primary driver of land use change (Lambin and Geist, 2006), the RM catchment has historically undergone more significant landscape modifications compared to Los Almendros. Projections suggest this trend will persist, with continued land use transformations anticipated in RM (Henríquez-Dole et al., 2018).
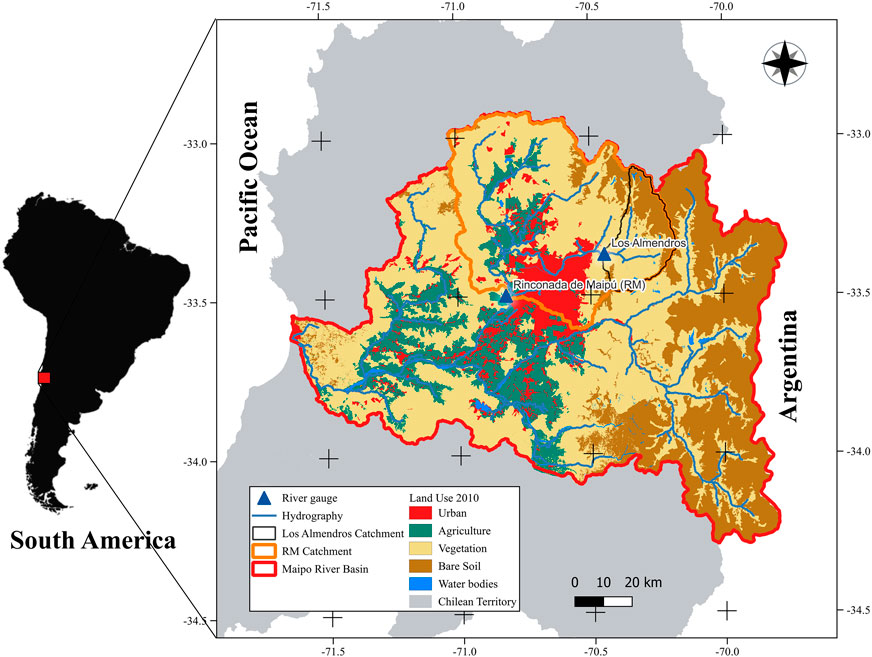
Figure 2. Maipo river basin and selected catchments: Los Almendros and Rinconada de Maipú.
2.3 Land use maps
2.3.1 Historical land use maps
To develop a time series of land use, we acquired 70 cloud-free Landsat Thematic Mapper (TM) scenes spanning late spring and summer (November–January) from 1990 to 2017 through NASA’s Earthdata archive. Landsat Thematic Mapper (TM) is preferable for constructing a 1990–2017 land use time series due to its uninterrupted data continuity since 1984, ensuring consistent spectral and spatial resolution (30 m) across decades -critical for long-term comparability. In contrast, Sentinel-2, launched in 2015, lacks historical coverage before its deployment, while other satellites often suffer from inconsistent sensor specifications or fragmented archives, undermining multi-decadal analysis. Additionally, two classified land use maps from 1999 (Puertas, Henríquez, and Meza, 2014) to 2010 (Henríquez-Dole et al., 2018) were integrated as reference baselines. These maps, previously validated in studies simulating future land use scenarios, ensured methodological consistency for comparative analysis.
The Local Climate Zone Classification (LCZC) framework (Stewart and Oke, 2012) was selected for land use classification due to its unique capacity to integrate microclimatic and structural landscape characteristics, a critical advantage for assessing hydrological responses in dryland environments. Unlike traditional land use classifications, which often rely on broad categories (e.g., “urban” or “agriculture”), the LCZC framework distinguishes 17 standardized zones based on surface structure, cover, and human activity, enabling granular analysis of how specific landscape configurations -such as compact low-rise urban areas versus sparsely vegetated bare soil-modulate hydrological processes like infiltration, runoff, and evapotranspiration (Ching et al., 2018). This precision is particularly vital in drylands, where subtle variations in land cover (e.g., patchy vegetation, impervious surfaces) disproportionately influence water retention and flow regimes (Zhou et al., 2020).
Implemented via the World Urban Database and Access Portal Tools (WUDAPT) within SAGA-GIS (Conrad et al., 2015; Ching et al., 2018), the LCZC framework ensures methodological reproducibility and global comparability, while SAGA-GIS’s advanced geo-computational tools streamline the processing of multi-temporal Landsat imagery into high-resolution land use maps. Recent studies demonstrate that LCZC-based classifications improve hydrological model accuracy by capturing microclimatic feedback-such as urban heat islands altering evaporation rates-that traditional systems overlook (Han et al., 2024; Lehnert et al., 2021; Robineau et al., 2022). By reclassifying LCZC outputs into five consolidated categories (urban, agriculture, vegetation, bare soil, and water), this study balances spatial detail with analytical tractability, ensuring landscape metrics (e.g., impervious surface density) directly aligned with Indicators of Hydrologic Alteration (IHA). This approach not only enhances the detection of anthropogenic impacts on dryland hydrology but also supports scalable water management strategies in regions facing escalating climate pressures. Of the initial 70 scenes, 54 met quality criteria and were retained for analysis (Table 1).
• Urban: Areas dominated by urban cores, peri-urban development, transportation infrastructure, utilities, and rural-industrial constructions (LCZC classes 1–10).
• Agriculture: Lands dedicated to crop cultivation, hay production, or livestock grazing (LCZC class D).
• Vegetation: Regions characterized by herbaceous cover, shrubs, native vegetation, or tree-dominated ecosystems (LCZC classes A–C).
• Bare Soil: Sparsely vegetated zones, exposed rock, fallowed agricultural land, and unpaved rural roads (LCZC classes E–F).
• Water: Open water bodies such as lakes and rivers (LCZC class G).
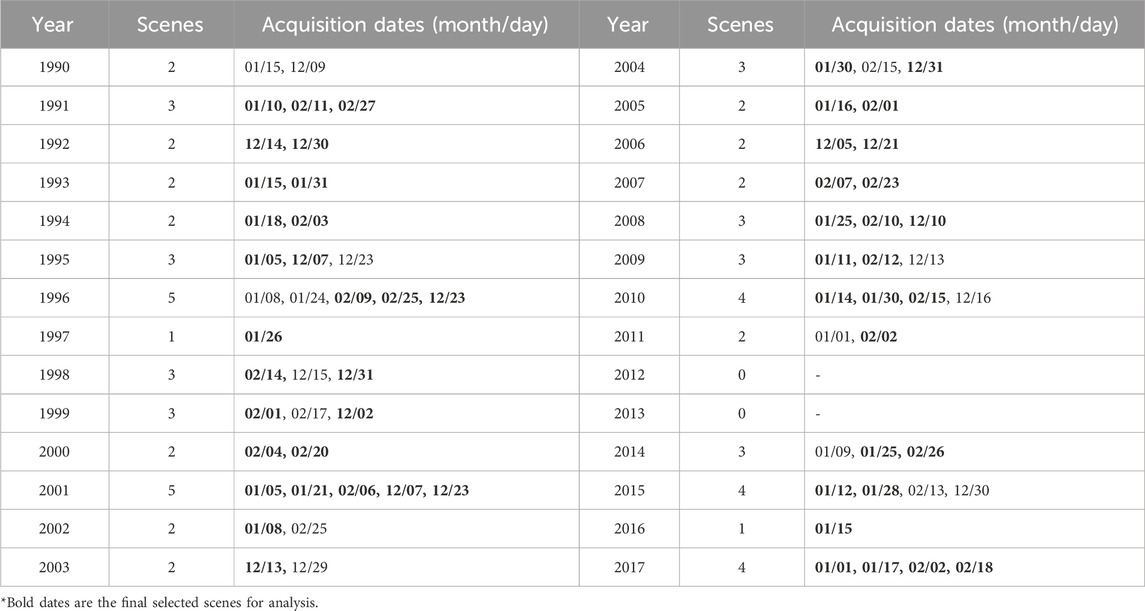
Table 1. List of landsat thematic mapper (TM) scenes used in the study.
The water category was subsequently merged with bare soil due to its limited spatial representation and distinct hydrological drivers compared to other classes. This aggregation minimized analytical complexity while maintaining focus on terrestrial land use dynamics.
2.3.2 Accuracy assessment
To assess classification accuracy, a proportional cross-tabulation matrix and the Kappa Index of Agreement (KIA) were computed for reference images (1999 and 2010). The proportional cross-tabulation quantifies category-wise correspondence between the classified and reference maps, where a higher proportion along the diagonal indicates stronger agreement between land use categories. The KIA, a robust statistical metric, evaluates the degree to which observed agreement between classifications exceeds that expected by random chance (Rosenfield and Fitzpatrick-Lins, 1986). KIA values range from 0 to 1, where 1 denotes perfect agreement and 0 reflects agreement no better than random allocation, ensuring rigorous validation of classification consistency over time.
2.3.3 Future land use maps
Eight (8) future land use scenarios developed for the study region (Henríquez-Dole et al., 2018) were used as future landscape configurations: four in 2030, and four in 2050. Under contrasting drivers of population growth and urban expansion, these scenarios are structured along two axes: urban demand (Low Urban Demand, LUD, vs. High Urban Demand, HUD) and policy frameworks (Business-as-Usual, BAU, vs. Strategic Land Use Planning of Plan Regional de Ordenamiento Territorial of Metropolitan Region of Santiago, PROT). Figure 3 shows two land use maps for 2030 and two for 2050 (four of the eight scenarios), which represent the extreme conditions of both axes on each year to highlight differences among scenarios: (1) a trending scenario with high urban demand (BAU HUD), and (2) a territorial planning with low urban demand (PROT LUD). Scenario narratives were co-developed through participatory workshops using the Open Space Approach (Owen, 2008) and guided by a Scenario Building Team (SBT) comprising over 30 stakeholders from public, private, and civil sectors within the Maipo River Basin (Ocampo-Melgar et al., 2016; Henríquez-Dole et al., 2018). All scenarios predict urban growth to concentrate in the northwestern periphery of Santiago City (RM catchment), though strategic planning (PROT) moderates its spatial extent by redistributing development to smaller towns. While PROT safeguards agricultural and natural areas, urban expansion persists, particularly in risk-prone zones adjacent to the city. Also, an increase in vegetation over bare soil areas in all scenarios is noticeable, specifically in the mountain region where Los Almendros catchment is located. This reflects trends of historical conversions for the whole region in the modelling, adding uncertainty to the effective representation of future scenarios in the mountains, mainly because the construction of future scenarios were focused on urban and agricultural lands (Henríquez-Dole et al., 2018).
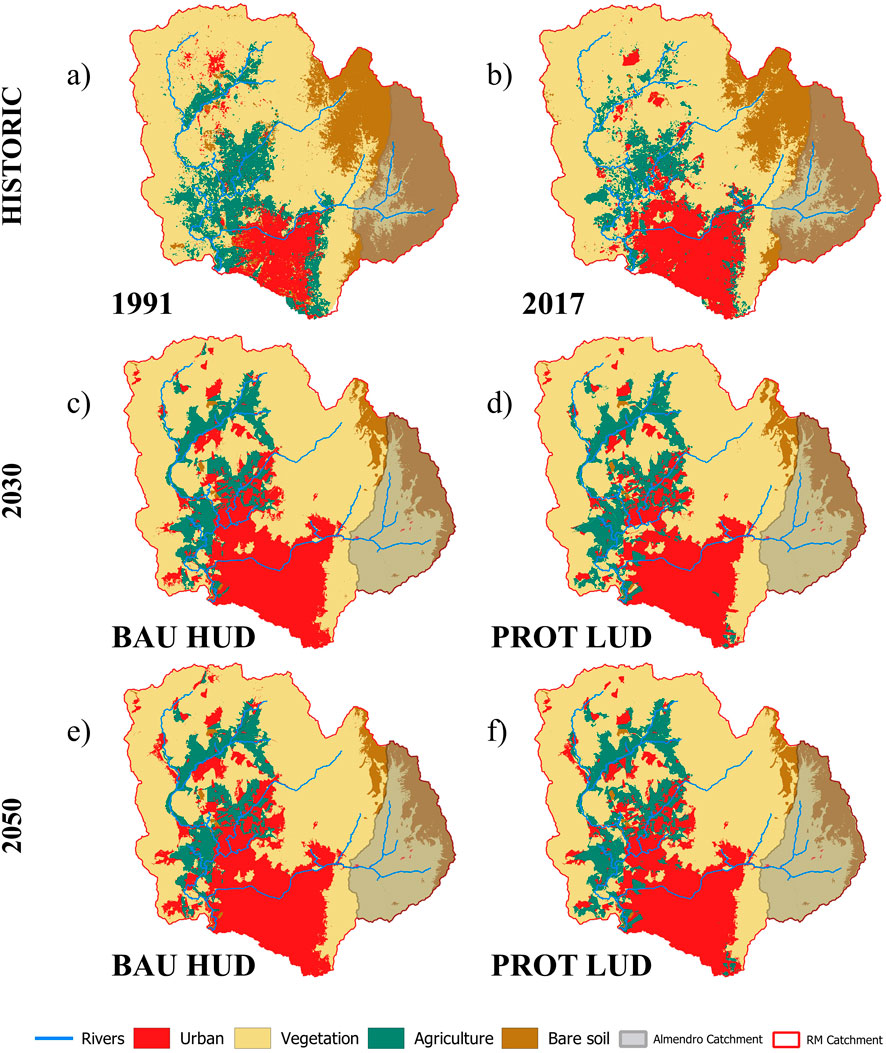
Figure 3. Historic (a) 1991, (b) 2017, and future ((c, e) BAU HUD, (d,f) PROT LUD) land use maps of Los Almendros and Rinconada de Maipú (RM) catchments. *Future scenarios were obtained from (Henriquez-Dole et al., 2018) supplementary data.
Landscape metric analysis reveals consistent trends across scenarios: urban and agricultural land uses exhibit increased patch density, reflecting fragmentation. The Large Patch Index (LPI) and Mean Patch Size (MPS) further demonstrate that (a) strategic planning fosters urban development in designated zones outside Santiago’s core, and (b) agricultural land continues to decline in all scenarios, with fragmentation intensifying even under protective policies.
2.4 Landscape metrics (LM)
Landscape metrics (LM) are widely employed to quantify spatial patterns in ecosystems, assess landscape configuration, and evaluate interactions between anthropogenic activities and land use dynamics. In this study, class-level LM were computed for each land use map using FRAGSTATS v4.2 (McGarigal and Marks, 1995; K. McGarigal et al., 2012) to systematically analyze temporal changes in land use patterns. A total of 60 LM were initially calculated per land use/cover category (aggregating to 240 LM per map), but due to inherent redundancy—where multiple metrics capture overlapping spatial attributes (Cushman et al., 2008; K. McGarigal et al., 2012; Zhang et al., 2017) -a subset was selected to ensure analytical independence. Detailed definitions and computational algorithms for all class-level LM are documented in FRAGSTATS v4.2 technical resources (McGarigal et al., 2015).
To mitigate collinearity, Pearson’s correlation coefficients (|r|) between all class-level LM (i.e., metrics specific to individual land use categories) were computed for the Maipo River Basin. Metrics exhibiting weak correlations (|r| < 0.3) with one another were retained, resulting in 29 non-redundant class-level LM (Table 2), or 116 LM per land use map. While this threshold minimized interdependencies, some metrics remained indirectly linked to excluded variables. Annual time series were constructed for each class-level landscape metric (LM). For cases where multiple maps corresponded to the same water year, LM values were averaged to ensure a single representative value per year.
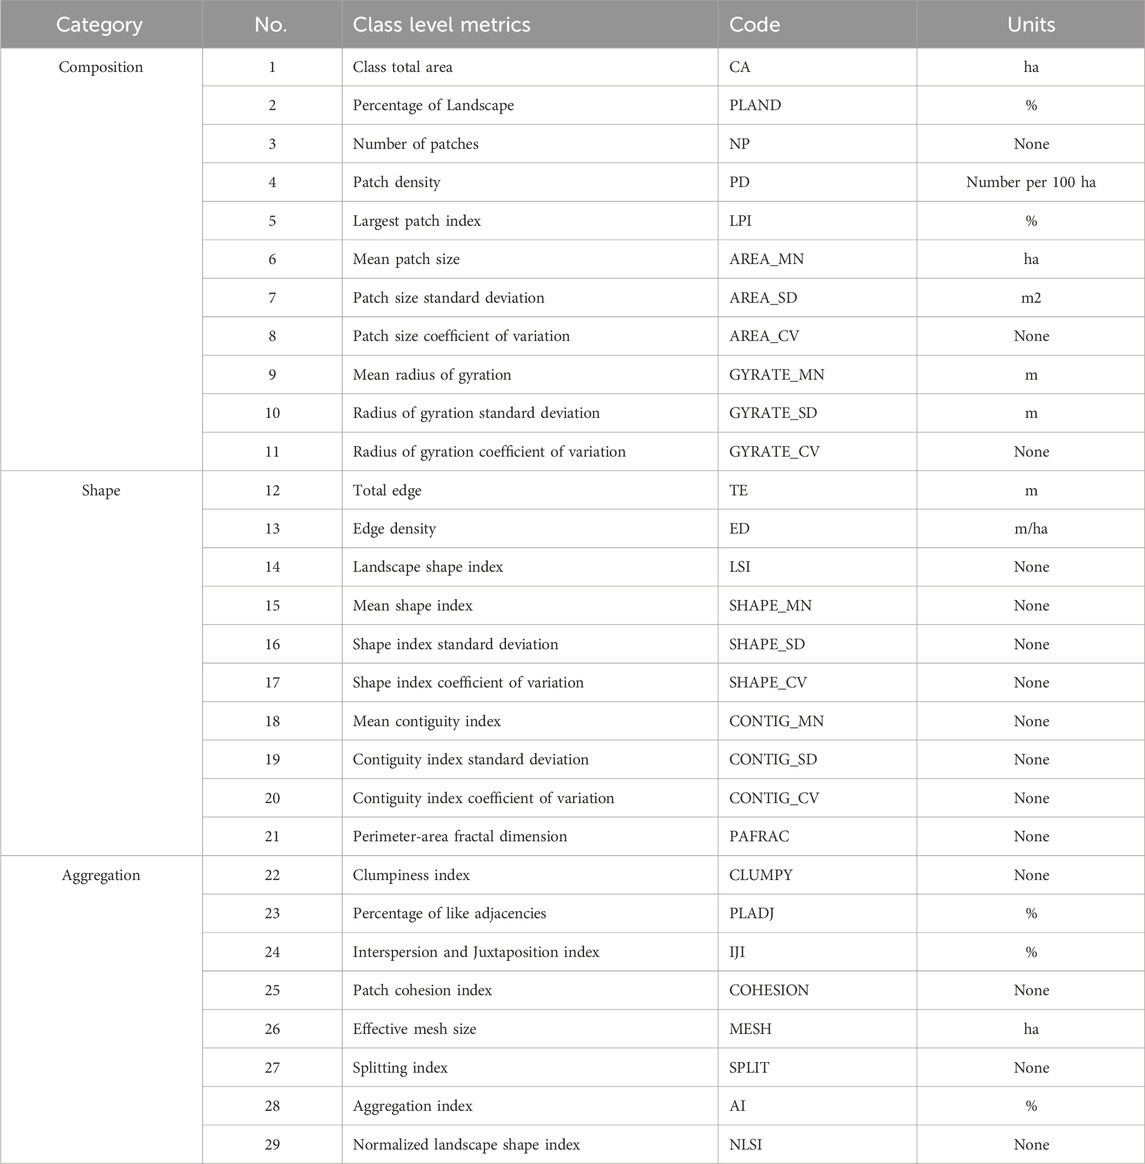
Table 2. Category, definition and code for selected landscape metrics (LM).
2.5 Streamflow data and normal water years classification
Daily streamflow data (1990–2017) were obtained from two gauging stations situated at the outlets of the study catchments (Figure 2). To isolate the influence of landscape configuration on hydrologic regimes, normal water years -defined as periods where streamflow reflects the integrated effects of land use and climatic conditions without extreme anomalies-were used for analysis. While multiple methodologies exist to classify wet, normal, and dry years based on annual streamflow exceedance probabilities (Tejada et al., 2015), the criteria established by Chile’s Dirección General de Aguas (DGA) (Benítez Girón, 1998) were applied to the Los Almendros catchment, which exhibits minimal anthropogenic influence. Under DGA guidelines, normal years correspond to annual streamflow volumes with exceedance probabilities between 30% and 85%. Using this threshold, 17 normal, 5 wet, and 5 dry water years were identified, with only normal water years exclusively incorporated into subsequent analyses.
2.6 Hydrologic signatures (indicators of hydrologic alteration)
Hydrologic signatures from the Ecological Limits of Hydrologic Alteration (ELOHA) framework (Poff et al., 2010) were selected to evaluate changes in the hydrological regime. The ELOHA framework defines 33 annual Indicators of Hydrologic Alteration (IHA), organized into five ecologically relevant groups (Table 3). These groups align with specific ecological functions: Group 1 quantifies baseflow availability critical for aquatic habitats; Group 4 assesses the cumulative impacts of flood and drought events; and Group 5 identifies flow conditions that risk stranding aquatic organisms or disrupting riparian vegetation through groundwater drawdown (McMillan, 2021). Supplementary ecological flow components, such as seasonal flow variability and extreme event frequency, were also incorporated into the analysis.
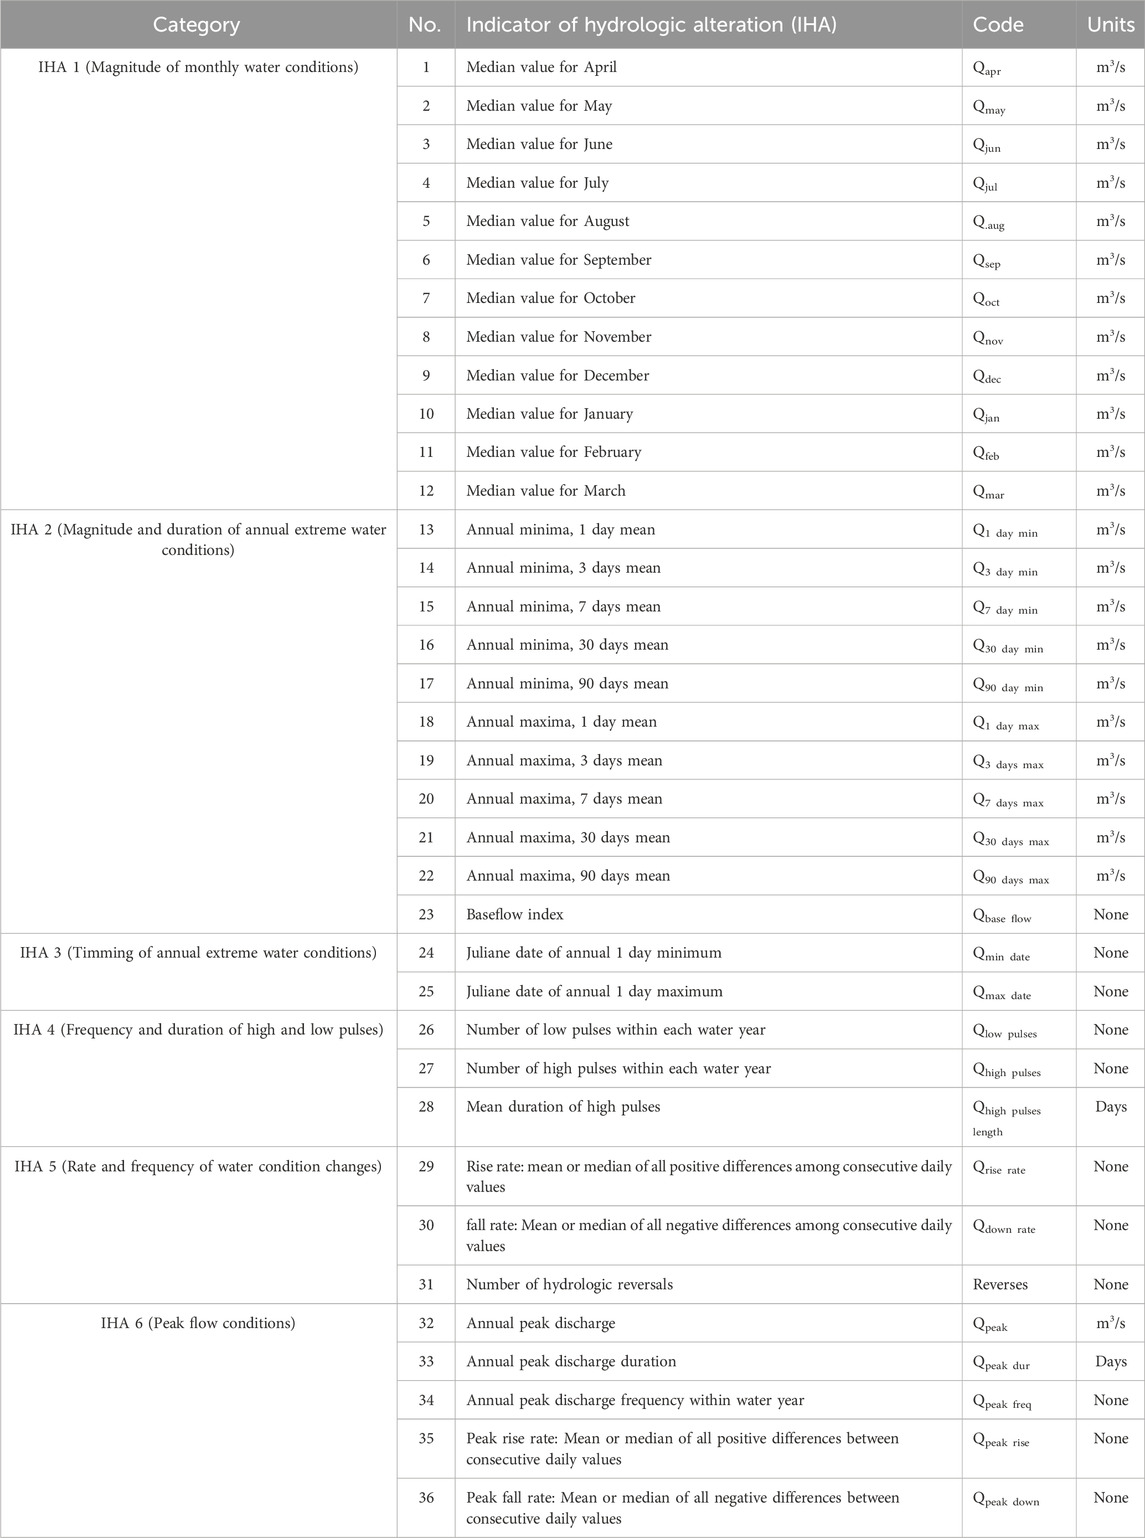
Table 3. Hydrologic signatures (Indicators of hydrologic alteration) based on the ELOHA framework (Poff et al., 2010).
All IHA were computed using the Indicators of Hydrologic Alteration software v7.1.0.10 (The Nature Conservancy, 2009), based on daily streamflow data from 1990 to 2017. Software delivers annual time series of all IHA selected during the timeframe defined. Within this software, non-parametric statistical methods (statistics based on median and percentiles) were chosen to compute IHA to ensure statistical robustness to biased data distributions. More details can be found in the User Manual and the Tutorial of the IHA software (The Nature Conservancy, 2009).
2.7 Regression analysis
Least Absolute Shrinkage and Selection Operator (LASSO) regressions were employed to analyze the relationship between selected class-level landscape metrics (Table 2) as predictor variables and Indicators of Hydrologic Alteration (Table 3) during normal water years (17 years with normal hydrologic conditions). On each catchment, 36 LASSO regressions were performed using a total of 116 LM (29 class-level LM by 4 land uses) as predictors during the timeframe selected (17 years). LASSO regression applies L1 regularization, a technique that enhances model accuracy by penalizing the absolute magnitude of regression coefficients (Tibshirani, 1996; Tibshirani, 2011). This penalty term shrinks non-informative coefficients toward zero, effectively performing automated variable selection and mitigating multicollinearity -a critical advantage in high-dimensional datasets common to environmental studies. Coefficients reduced to zero are excluded from the final model, simplifying its structure while retaining only the most influential predictors, a method validated in environmental applications linking landscape patterns to streamflow variability and environmental models (Slater et al., 2023; Pak et al., 2025; Moosavi et al., 2022).
LASSO regressions were obtained using RStudio 2025.05.1 (R v4.4.3) using all dataset available (no training-test split was done due to limited sample size) and tuning the lambda penalty parameter using a variable k-fold (from 3 to 10) cross-validation until the minimal lambda value was obtained, which was set as the optimal value for this parameter on each regression. Prior to analysis, all LM and IHA values were standardized (z-score normalization) to eliminate scale-dependent biases in coefficient penalization, a preprocessing step widely recommended for LASSO applications in landscape-hydrology studies (Zhou et al., 2020). Model performance was quantified using the percentage of explained variance (deviance explained), which measures the proportion of variability in IHA accounted for by the selected LM relative to a null model. This approach aligns with recent advancements in regularization techniques for ecological and hydrological datasets, where LASSO has proven effective in isolating drivers of environmental change despite collinear predictors (Tian et al., 2024).
Our datasets are characterized by a moderately high dimensionality, where the number of predictor variables (116 LM) surpasses the number of observations (17 years). For this reason, LASSO regression is a particularly suitable methodology, as it inherently incorporates feature selection and regularization to mitigate the risk of model overfitting. This advantage, however, is tempered by the limited sample size in specific model implementations, which can compromise the robustness and stability of the derived regression coefficients. Consequently, the results must be interpreted with caution, acknowledging the potential for increased model variance and reduced generalizability to other sites.
2.8 Strength, universality and influence
To evaluate the predictive relevance of landscape metrics (LM) in LASSO regression models, three criteria were adopted: strength, universality, and influence (Cushman et al., 2008).
1. Strength (S) quantifies the mean coefficient magnitude of LM across all regressions where it was retained (Equation 1), reflecting its average contribution to predicting Indicators of Hydrologic Alteration (IHA).
2. Universality (U) measures the frequency with which a LM was selected across all regressions, indicating its consistency as predictor (Equation 2).
3. Influence (Equation 3) integrates strength and universality into a composite metric, repreenting the overall predictive importance of a LM.
Here, β denotes the standardized regression coefficient of a landscape metric in the i-th LASSO model, δ is an indicator variable (1 if LM is retained, 0 otherwise), and n is the total number of LASSO models analyzed.
3 Results
3.1 Classification accuracy and land use change dynamics
The accuracy of land use classifications for 1999 and 2010 was assessed using proportional cross-tabulation matrices and the Kappa Index of Agreement (KIA) (Table 4). Diagonal values in the cross-tabulation matrices represent the proportion of correctly classified pixels, with overall accuracy reaching 81.4% in 1999 and 81.8% in 2010. Urban, agricultural, and vegetation classes exhibited moderate agreement (KIA = 0.65–0.78), while bare soil showed weaker agreement (KIA = 0.56–0.57), consistent with challenges in distinguishing sparsely vegetated or transient surfaces. The water class, merged with bare soil due to its minimal spatial representation (<0.2% of the catchment area), was excluded from subsequent analyses.
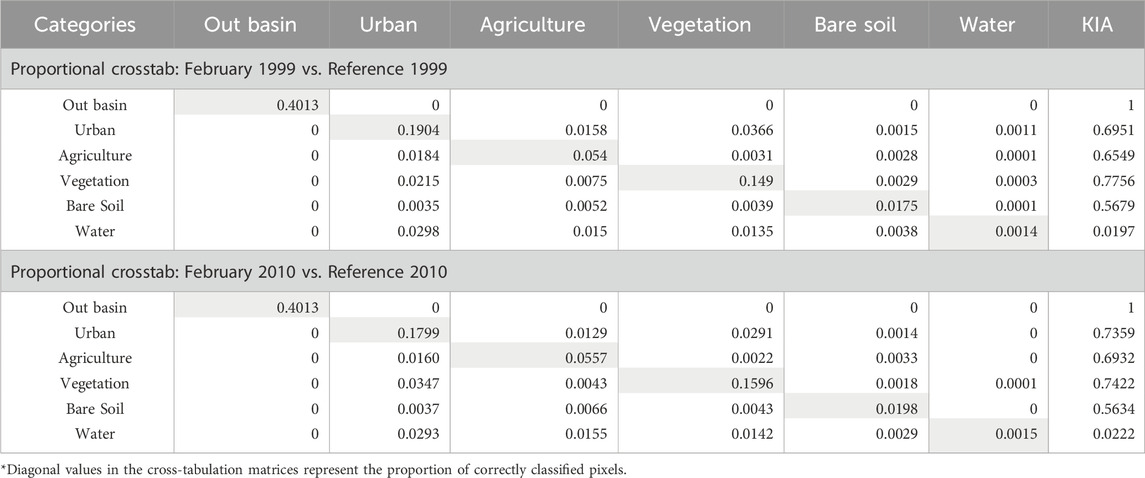
Table 4. Crosstab and KIA values for each land use between selected images and reference images.
Land use changes between 1991 and 2017 revealed contrasting trajectories across catchments (Figure 3; Table 5). In Los Almendros, urban and agricultural areas remained marginal (<1% of the catchment), with vegetation cover declining slightly (−4.3%) and bare soil increasing marginally (+1.1%). In contrast, Rinconada de Maipú (RM) experienced pronounced anthropogenic transformation: urban areas expanded by 87.4% (25,063 ha), while agricultural and bare soil lands decreased by −21.1% (−9,976 ha) and −24.8% (−28,914 ha), respectively. Vegetation in RM increased by 6.7%, which reflect conversion over bare soil (mainly in mountains) and abandoned agricultural areas.
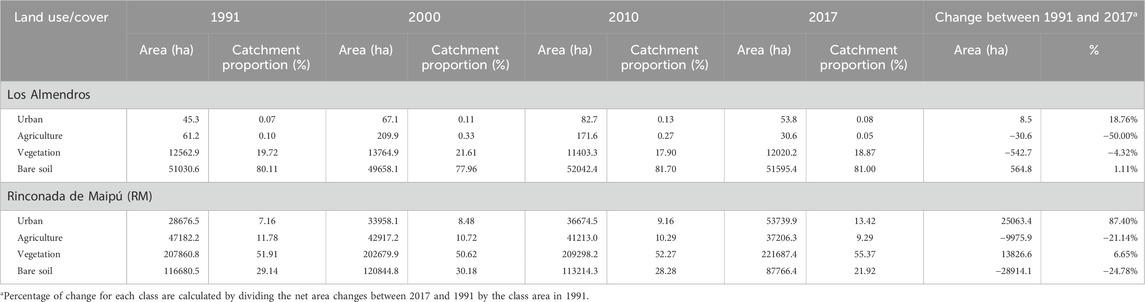
Table 5. Land use changes between 1991 and 2017.
3.2 Landscape metrics dynamics
Landscape configuration exhibited significant dynamism between 1991 and 2017, with nonlinear trajectories in landscape metrics reflecting contrasting anthropogenic pressures in the two catchments studied (Tables 6, 7). In the urban land use category, the Rinconada de Maipú (RM) catchment experienced an increase in urban class area (CA) by 15% between 1991 and 1999, followed by a decline of 9% during 2000–2009, and then a substantial surge of 27% from 2010 to 2017. Despite this expansion in CA, the mean patch area (AREA_MN) decreased by 17.6% in the last period of 2010–2017, indicating fragmentation of urban patches. Concurrently, the largest urban patch index (LPI) increased by 28.5% during the same period, driven by peri-urban sprawl, while the radius of gyration (GYRATE_MN) rose by 89.2%, reflecting more dispersed development patterns. In contrast, Los Almendros treated urban growth nonlinearly, showing early expansion with CA increasing by 51.1% from 1991 to 1999, followed by intense fragmentation evidenced by an extraordinary 4,271% increase in the splitting index (SPLIT) from 2010 to 2017. This fragmentation was accompanied by declining cohesion (COHESION decreased by 37.5%) and aggregation (AI decreased by 44.3%), indicative of patch disaggregation likely resulting from scattered rural settlements.
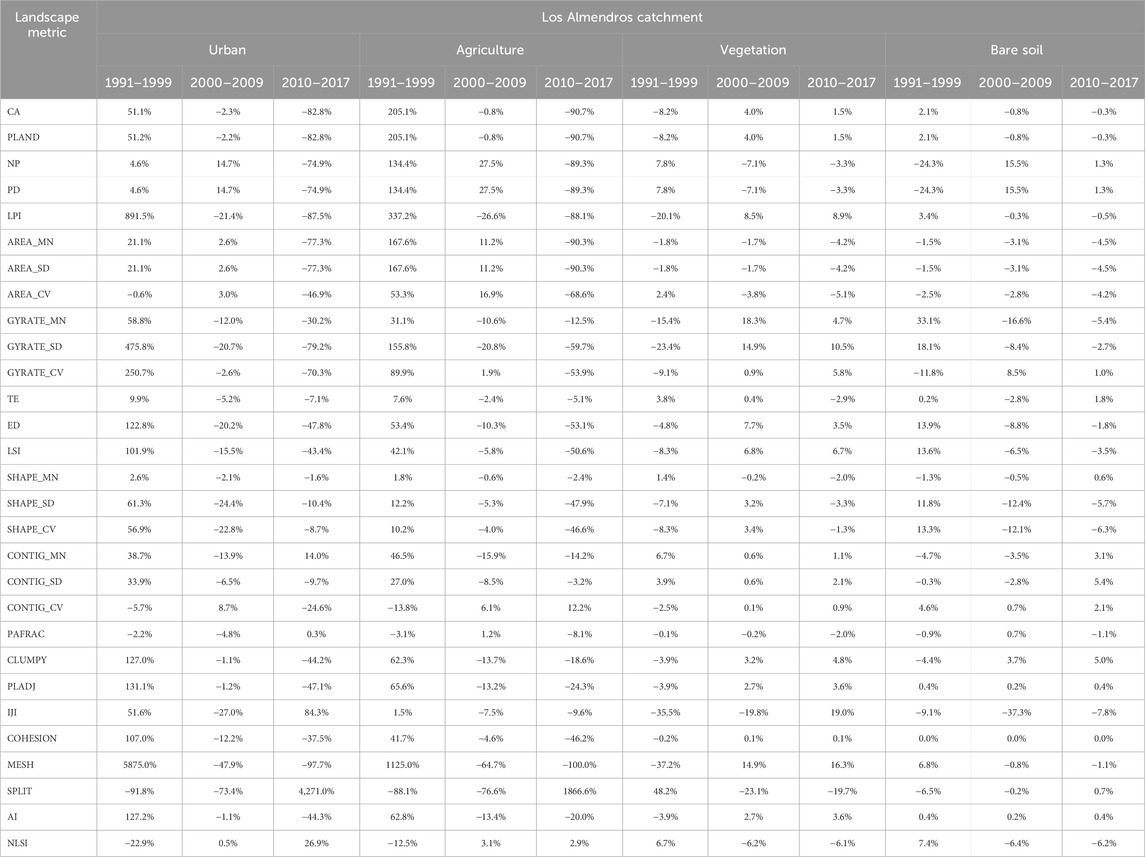
Table 6. Change (%) in landscape metrics.
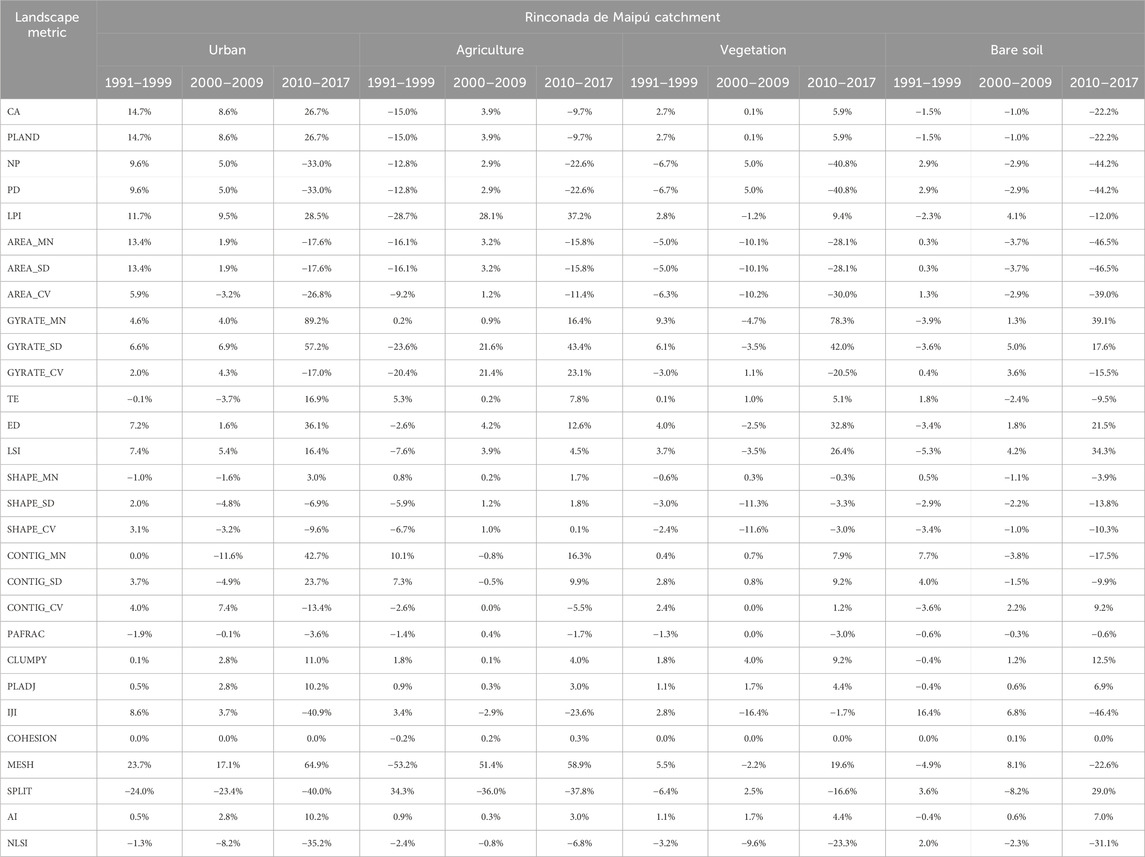
Table 7. Change (%) in landscape metrics.
Agricultural land use dynamics diverged sharply between catchments. In RM, agricultural class area declined overall by 21.1%, yet the LPI surged by 37.2% during 2010–2017, signaling consolidation of the remaining farms into larger patches. Edge density (ED) and shape complexity (LSI) also increased by 12.6% and 4.5%, respectively, suggesting increasingly irregular field boundaries. Conversely, in Los Almendros, agriculture peaked dramatically in the 1990s with a 205.1% increase in CA during 1991–1999 but subsequently collapsed by 90.7% in 2010–2017. This transformation manifested as a shift from early aggregation (MESH index declined by 97.7%) to severe fragmentation (SPLIT increased by 4,271%), consistent with abandonment and land degradation processes.
Vegetation class area showed relative stability in RM, but patch density increased by 40.8% in the 2010–2017 period, indicating fragmentation. Increased edge density (up 32.8%) and shape complexity (LSI increased by 26.4%) further suggest encroachment of urban and agricultural edges into vegetated areas. In contrast, Los Almendros experienced a modest increase in vegetation cover (1.5% growth during 2010–2017) coupled with reductions in the number of patches (NP decreased by 40.8%) and mean patch area (AREA_MN decreased by 28.1%), indicating vegetation consolidation likely due to reforestation or shrub encroachment.
Changes in the bare soil category displayed opposing patterns in the two catchments. RM showed a decrease of 22.2% in bare soil area between 2010 and 2017, with declining patch density and increased clumpiness, signaling efforts toward stabilization. Meanwhile, Los Almendros experienced intensified fragmentation of bare soil (NP increased by 1.3%), which is likely caused by erosion or afforestation efforts.
3.3 Hydrologic signatures
Streamflow regimes in Los Almendros and Rinconada de Maipú (RM) catchments exhibited pronounced decadal shifts (Figure 4; Table 8). In Los Almendros, the flow duration curve (FDC) showed increased peak and low flows during 2000–2009, followed by a sharp decline in very low flows (exceedance probability >0.97). By 2010–2017, low flows partially recovered, but mid-range flows diminished, reflecting altered infiltration patterns linked to vegetation consolidation (Table 6). The FDC slope steepened post-2000, signaling reduced flow variability -a hallmark of land use homogenization. Conversely, RM experienced magnitude shifts in 2000–2009, with slope flattening in 2010–2017, indicative of urban-driven flashiness and groundwater depletion.
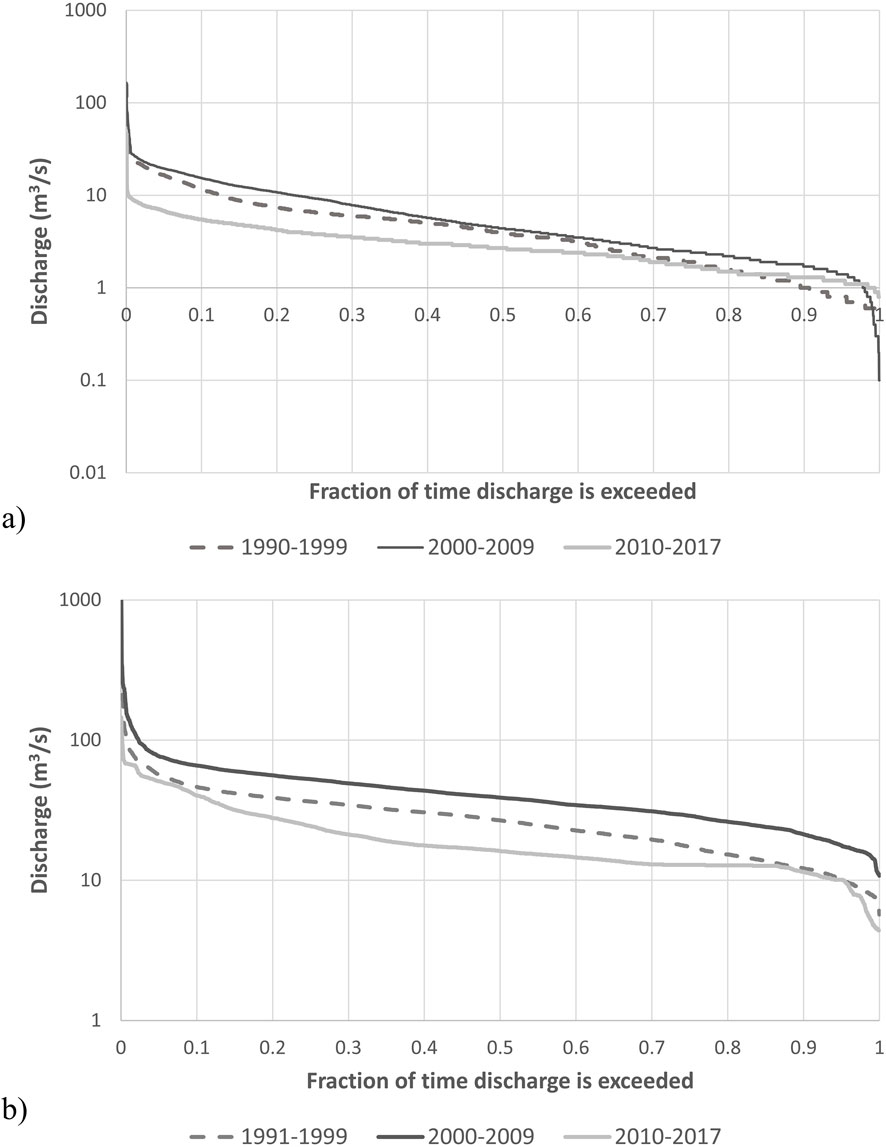
Figure 4. Flow duration curve in Los Almendros (a) and Rinconada de Maipú (b) river flow stations.
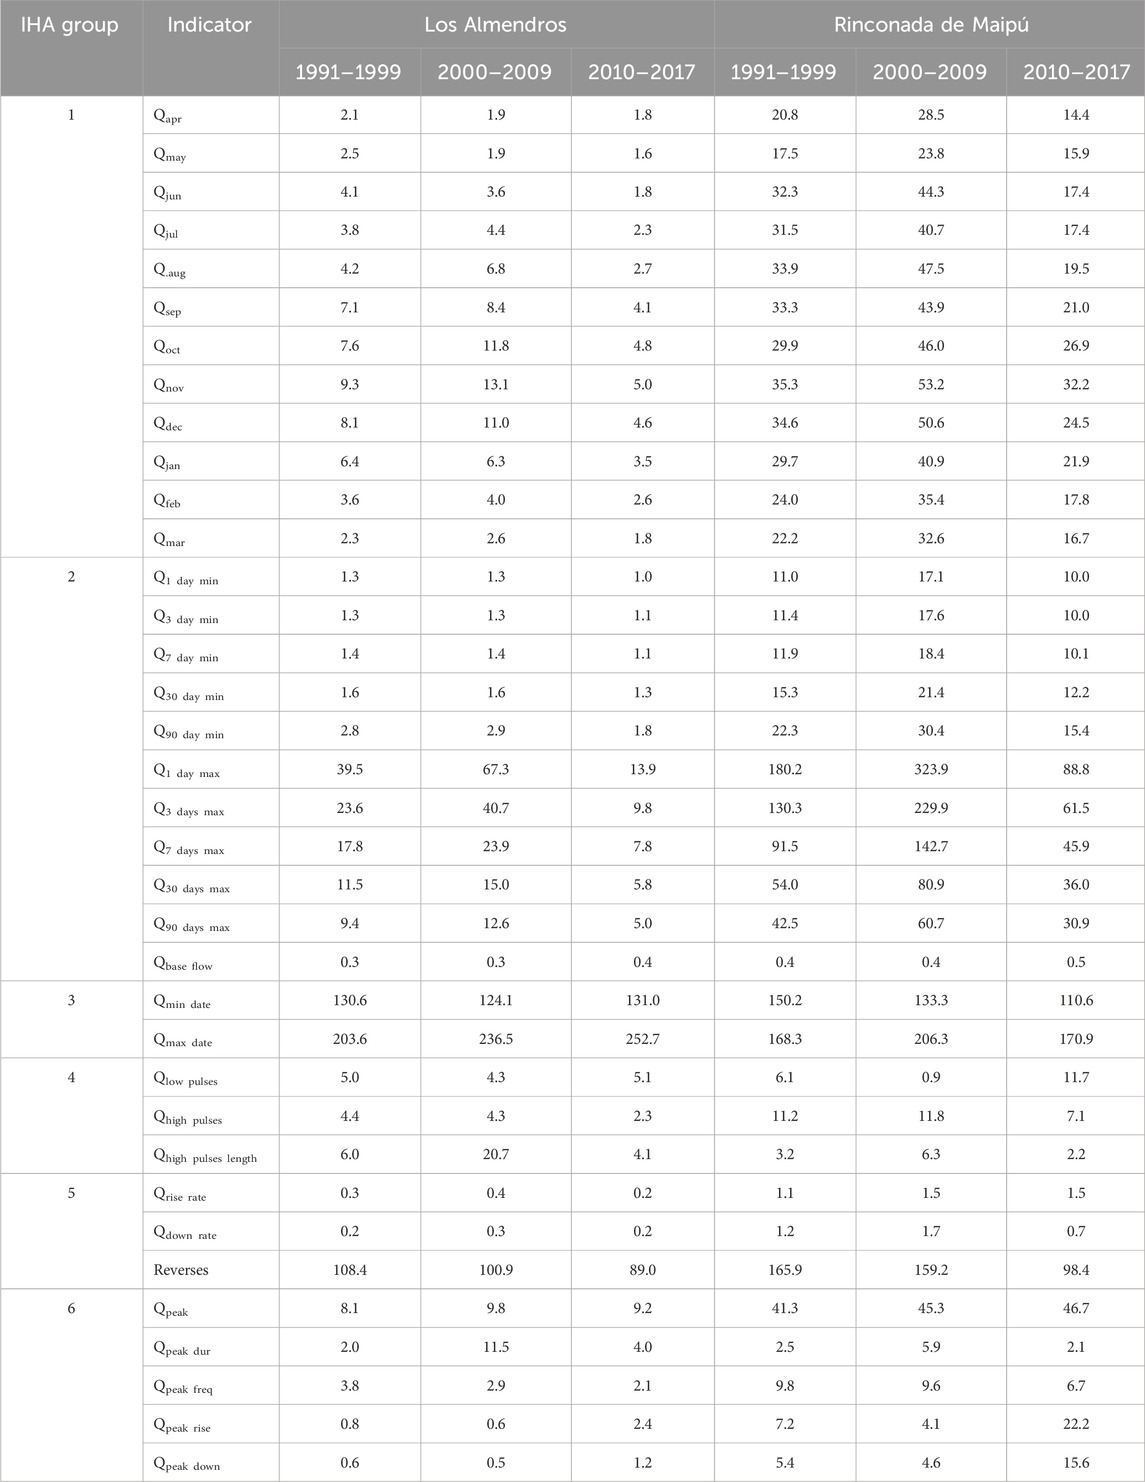
Table 8. Decadal average value of hydrologic signatures in Los Almendros and Rinconada de Maipú catchments.
The Indicators of Hydrologic Alteration (IHA) revealed contrasting hydrological trajectories between the catchments. Baseflow increased by 23% in Los Almendros (2010–2017), likely due to vegetation recovery enhancing aquifer recharge, while Rinconada de Maipú (RM) saw a 16% rise linked to managed groundwater extraction for irrigation. Extreme flows exhibited parallel declines: minimum flows decreased by 23% (Los Almendros) and 17% (RM), and maximum flows halved in both catchments, consistent with reduced rainfall intensity and elevated evapotranspiration under Mediterranean aridification (Vicente-Serrano et al., 2020).
Flow timing shifts disrupted ecological regimes: peak flows in Los Almendros occurred 1 month later, while RM’s minimum flows advanced by 1 month, altering cues critical for riparian species phenology (Poff and Zimmerman, 2010). Flow pulse dynamics diverged sharply: high-pulse frequency declined by 48% (Los Almendros) and 36% (RM), while RM’s low pulses doubled, reflecting urban runoff amplification and irrigation-driven flow regularization. Peak flow rates intensified markedly, with rise rates tripling in both catchments (2010–2017) and fall rates doubling (Los Almendros) or tripling (RM), signaling accelerated stormwater mobilization from expanding impervious surfaces.
3.4 LASSO regressions
LASSO regression models identified key landscape metrics (LM) driving hydrologic alterations in both catchments, with substantial explanatory power (Table 9). Deviance explained in LASSO regression serves as a measure of goodness-of-fit akin to R2. While no strict scale exists, values above 60% were selected as indicative of strong model performance, following the studies of Santhi et al. (2001) and (Moriasi et al., 2007) who used threshold of R2 = 0.6 or NSE = 0.5 to evaluate model´s performance while recognizing that thresholds can vary depending of context and new databases (Gupta et al., 2024; Lin and Wiegand, 2023). In Los Almendros, high deviation explained (>60%) was observed for IHA Groups 1 (mean flows), 2 (extreme flows), and 5 (flow rate changes), aligning with its vegetation consolidation and agricultural decline. In contrast, Rinconada de Maipú (RM) exhibited robust model performance across all IHA groups except Group 3 (flow timing), reflecting its dynamic urban-agricultural interplay. Only IHAs with deviation explained >60% were retained for scenario analysis, ensuring reliability in projecting future hydrologic impacts.
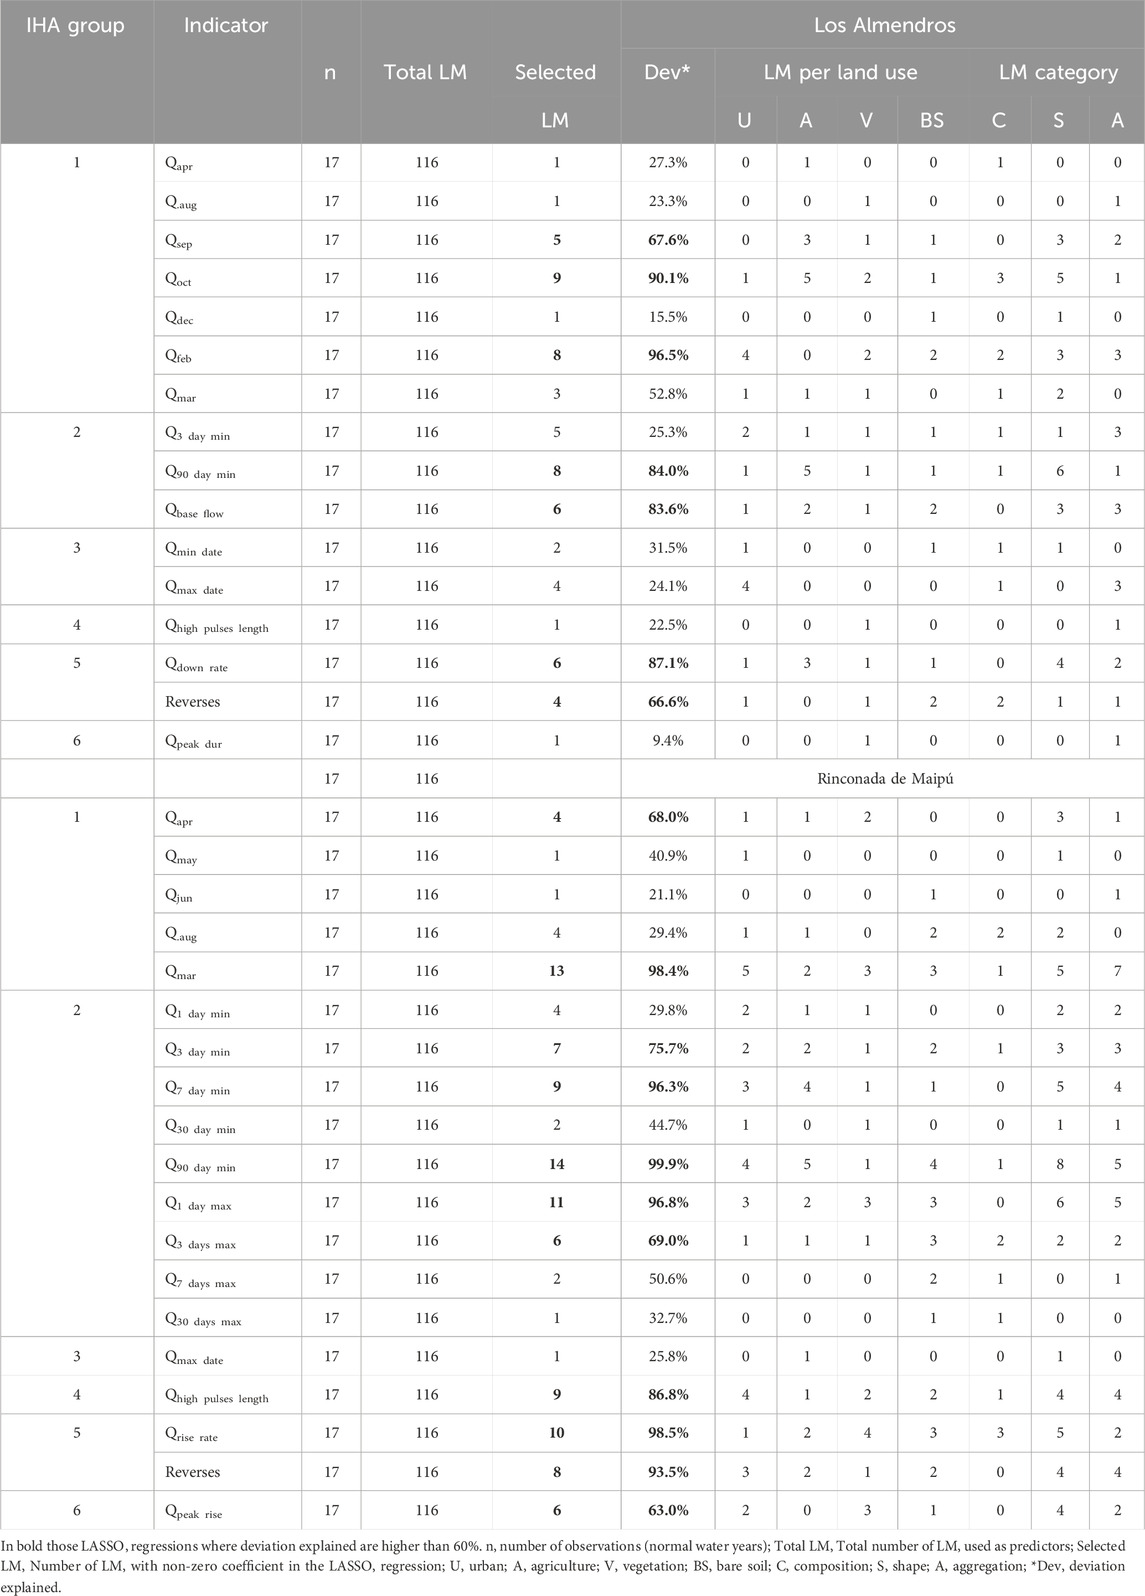
Table 9. Deviation explained (Dev) and number of LM per category in LASSO regressions.
The influence of LM on IHAs varied markedly by metric type and land use (Figures 5, 6). Of 116 LM evaluated, only 74 exhibited significant hydrologic relevance. Shape-related metrics (e.g., SHAPE_MN, SPLIT) dominated across configurations, underscoring their sensitivity to edge effects and patch geometry. Urban and agricultural LM disproportionately influenced IHA Groups 1, 2, and 5 -critical for mean/extreme flows and flashiness-while vegetation and bare soil LM impacts correlated with their spatial dominance: vegetation in RM (higher coverage) and bare soil in Los Almendros.
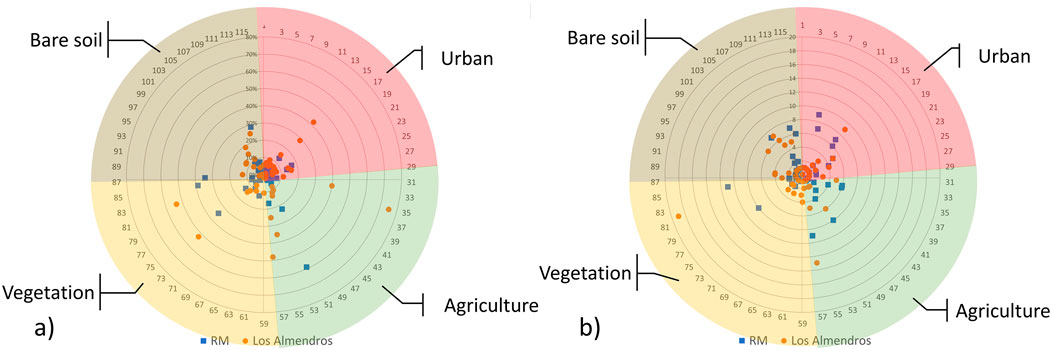
Figure 5. Landscape metrics strength (a) and universality. (b) Separation from center represents magnitude. Just 74 LM (points) were graph out of 116 LM in total: Urban LM (19), Agriculture LM (22), Vegetation LM (18) and Bare soil (15).
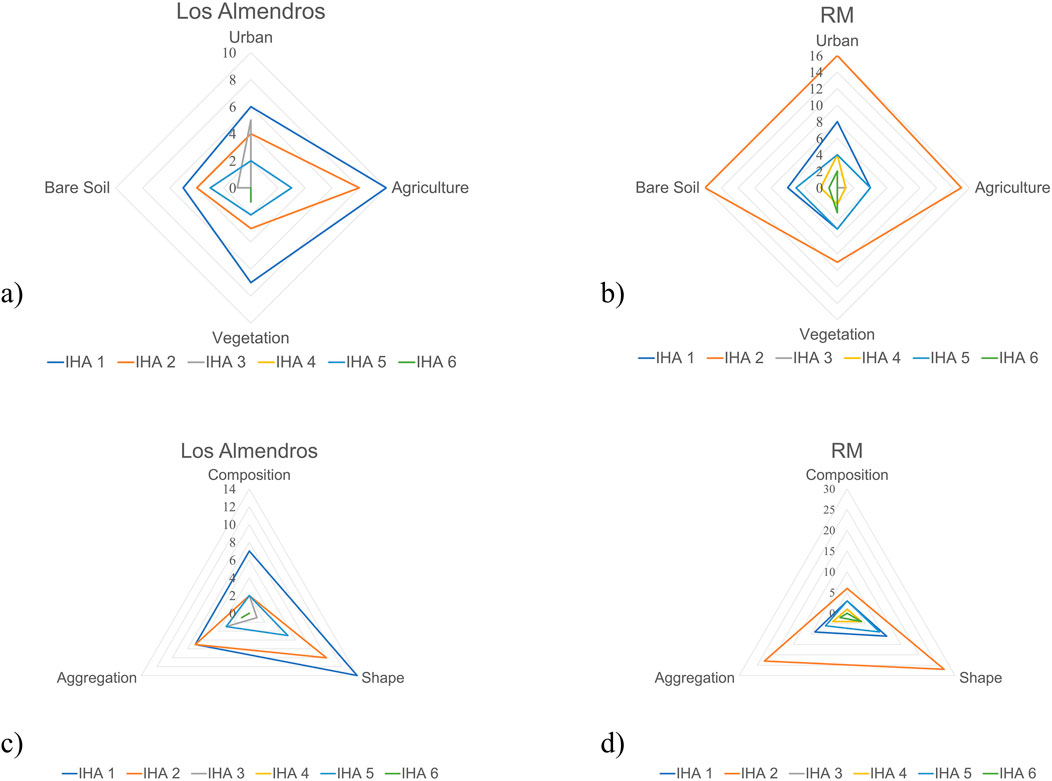
Figure 6. Catchment’s landscape metrics influence over Indicators of Hydrologic Alteration (IHA) groups: by land use (a,b) and by category (c,d).
Rankings of LM strength, universality, and influence (Table 10) revealed context-relevant predictors for both catchments. Urban_SHAPE_MN (mean urban patch shape) ranked in the top 10 for both catchments, strongly affecting mean and extreme flows (IHA 1 & 2). Irregular urban geometries amplified runoff connectivity, particularly in RM’s sprawling periphery. Agro_SPLIT (agricultural patch disaggregation) emerged as a top predictor, reflecting fragmentation’s role in altering infiltration and peak flows. Its influence was pronounced in Los Almendros, where abandoned farms transitioned to fragmented bare soil. Veg_SPLIT and BareSoil_COHESION highlighted vegetation’s stabilizing role and bare soil’s destabilizing effects, respectively, with Veg_SPLIT reducing flashiness in RM’s vegetated uplands.
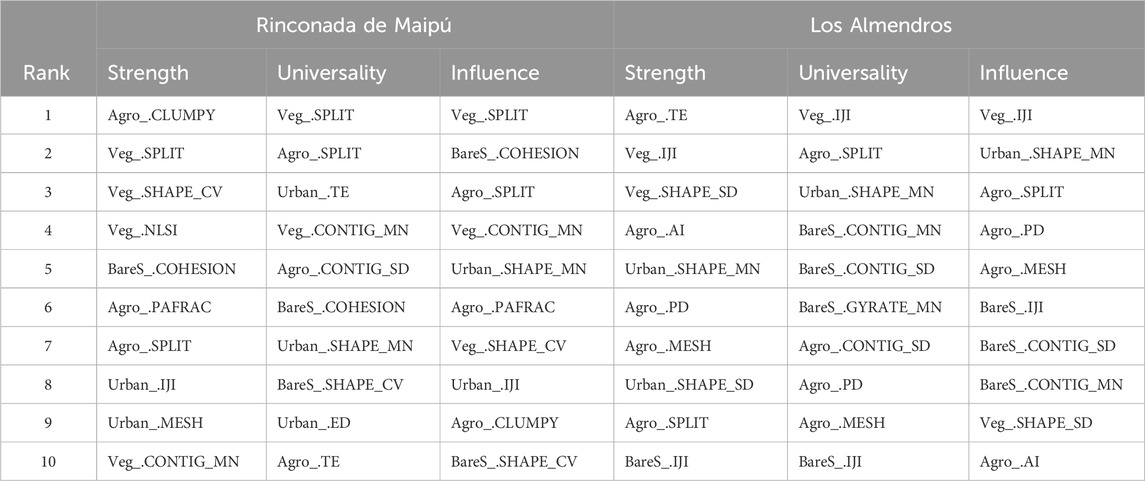
Table 10. Ranking of LM strength, universality, and influence over hydrology in catchments.
3.5 Future scenarios
Future hydrologic signatures were projected for both catchments using LASSO regression models and the eight future land use scenarios (Table 11). In Los Almendros, median flows during critical agricultural periods (e.g., September sowing) are projected to decline by 7%–9% under 2030 scenarios and 5%–9% by 2050, with Business-as-Usual (BAU) trajectories exacerbating reductions compared to Strategic Land Use Planning (PROT). For instance, October flows (Qoct) under PROT show smaller declines (−4.6% to −5.5%) than BAU (−9.1% to −9.7%), highlighting PROT’s potential to buffer water scarcity during planting seasons. Similarly, extreme low flows (IHA Group 2) and flow reversals (IHA Group 5) are markedly attenuated under PROT, with BAU scenarios driving severe reversals (−47.2% to −53.9% by 2050), signaling destabilized flow regimes under unplanned development.
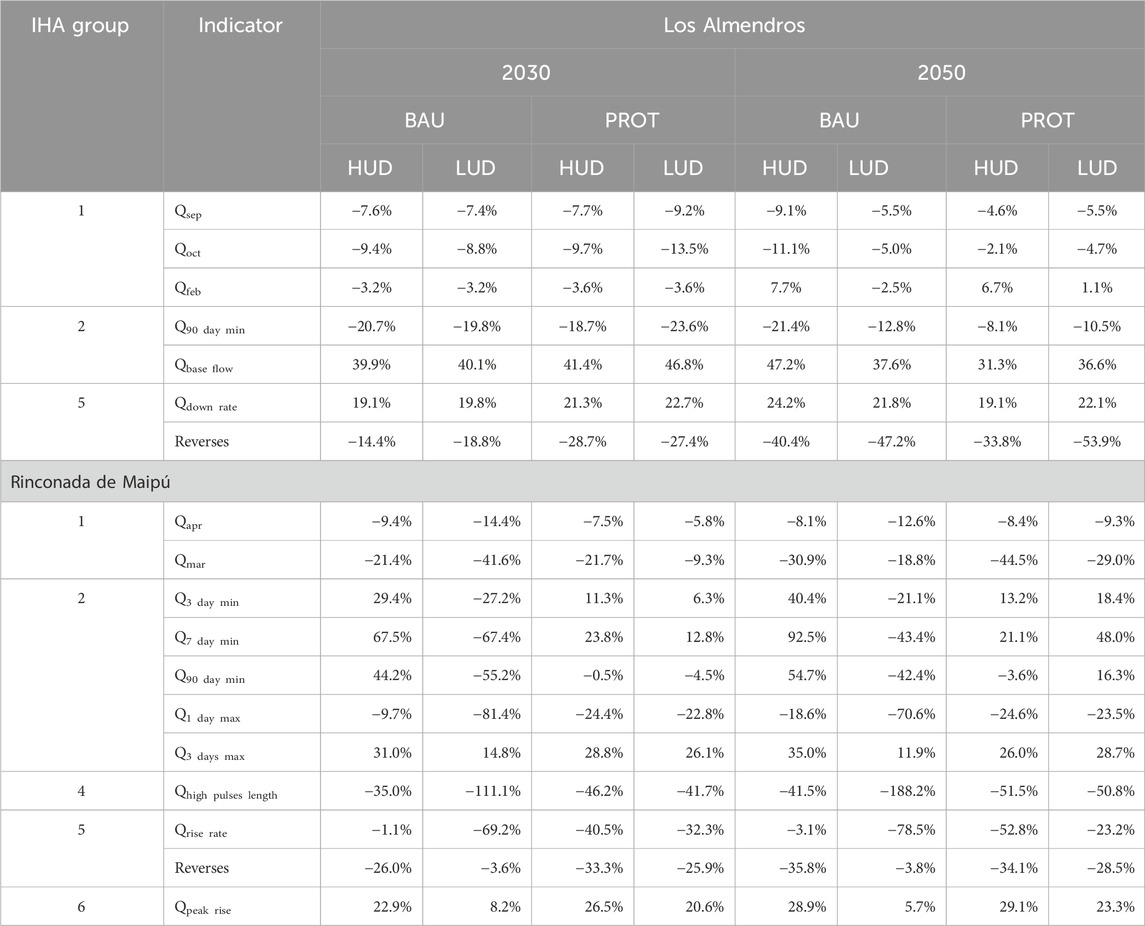
Table 11. Hydrologic signature scenarios based on significative LASSO regressions.
In Rinconada de Maipú (RM), divergent scenario outcomes underscore the limits of land use planning in highly urbanized catchments. April median flows decline by 8%–13% under BAU 2050 versus 8%–9% under PROT, reflecting minimal mitigation efficacy for baseline flows. However, PROT significantly moderates peak flow impacts: rise rates under PROT increase by 23%–29% (vs. 5.7%–29.1% under BAU), suggesting controlled stormwater management. Notably, BAU scenarios project catastrophic declines in high-flow pulse length (Qmin pulse length: −188.2% by 2050), indicating near-elimination of ecologically critical flood events—a trend observed in over-urbanized basins globally (Zhou et al., 2020).
4 Discussion
The moderate to strong classification accuracy achieved (KIA 0.65–0.78 for major classes) supports reliable detection of land use changes driving hydrological alterations. While the bare soil class exhibited lower agreement, this is common in arid environments with sparse or transient vegetation cover (Zhou et al., 2020). The divergent land use trajectories observed—dramatic urban expansion in Rinconada de Maipú (RM) and agricultural collapse coupled with vegetation consolidation in Los Almendros—reflect distinct socio-economic drivers such as urban planning policies, demographic shifts, and water rights governance (Bauer, 2015; Henríquez-Dole et al., 2018). These changes provide a solid basis for evaluating hydrological responses linked to landscape transitions.
A central concern in landscape-hydrology studies is disentangling correlation from causation. While LASSO regression identifies landscape metrics statistically linked with hydrological signatures, causality is inferred cautiously. However, the metrics highlighted—urban patch shape complexity (SHAPE_MN), agricultural patch fragmentation (SPLIT), and vegetation connectivity (COHESION)—have well-established mechanistic roles in modulating hydrological processes (Poff and Zimmerman, 2010; McMillan, 2021; Jackisch et al., 2021). For example, urban imperviousness inherently increases surface runoff and peak flows by reducing infiltration (Dogan and Karpuzcu, 2022), while agricultural fragmentation alters infiltration and peak flow dynamics by disrupting soil continuity (Alatorre et al., 2019). Vegetation connectivity stabilizes baseflow through enhanced water retention and groundwater recharge (Bart and Tague, 2017).
The consistency of these metrics’ predictive strength and universality across multiple IHAs further strengthens their causal interpretation (Cushman et al., 2008). Nonetheless, fully establishing causality requires complementary physically based hydrological models or experimental studies, particularly to account for climatic, subsurface, and socio-economic drivers omitted here (Tian et al., 2024). By using normal water years (years with normal hydrologic conditions), we minimized confounding effects from extremes, making landscape-driven hydrological changes more apparent (Scanlon et al., 2023).
Our findings align closely with global patterns documented in various climatic and land use contexts. The urban expansion in RM increased impervious surfaces by 27%, amplifying peak flow rise rates and flashiness, consistent with patterns noted in Mediterranean drylands (Zuo et al., 2016), for example like in Turkey’s Terkos Basin (Dogan and Karpuzcu, 2022). The reduction in baseflow aligns with urban groundwater depletion documented globally (Scanlon et al., 2023; Bauer, 2015).
Conversely, Los Almendros experienced rural depopulation and agricultural abandonment leading to vegetation recovery, which stabilized baseflows (+23%) and reduced hydrological variability. This is analogous to trends in semi-arid California chaparral ecosystems and other dryland rewilding contexts (Bart and Tague, 2017; Frutos et al., 2015). The fragmentation of vegetation in RM further reduced drought resilience, highlighting the hydrological significance of spatial configuration beyond mere land cover extent (Boongaling et al., 2018; Zhou et al., 2020).
The findings concerning the influence of urban and agricultural landscape metrics on the Los Almendros catchment require special attention, particularly given the relatively small proportion of the catchment area occupied by these land uses. While it may seem counterintuitive that such small land-use percentages could drive significant changes, our results are consistent with established hydrological principles. Research has demonstrated that the spatial arrangement and connectivity of impervious surfaces, even if they constitute a small portion of the total catchment, can alter the hydrological cycle by accelerating stormflow and reducing groundwater recharge, a phenomenon known as the “urban stream syndrome” (Walsh et al., 2005). Similarly, small but highly fragmented agricultural patches can act as disproportionate sources of runoff and pollutants, as their edge density and fragmentation increase the speed and volume of water moving across the landscape. Studies show that landscape metrics like patch density and shape are significantly correlated with hydrological outcomes such as runoff (Wei et al., 2023). Therefore, despite their limited total area, the specific landscape configuration and spatial metrics of urban and agricultural lands within the Los Almendros catchment appear to be crucial drivers of the observed hydrological changes.
The role of patch shape and aggregation metrics emphasized here underscores the mechanistic pathways by which landscape structure controls hydrological connectivity, runoff generation, and sediment transport (Alatorre et al., 2019; Cushman et al., 2008). Such spatial pattern measures provide actionable insights beyond traditional percent land cover metrics (PLAND), advancing the understudied class-level landscape-hydrology dynamics particularly in dryland environments.
The use of LASSO regression allowed effective variable selection amid a high-dimensional, collinear landscape metric dataset, isolating the 64% of metrics most relevant to hydrological signatures. This parsimonious approach (Cushman et al., 2008; Tibshirani, 1996) provides a data-driven methodology free of redundancy and context-dependency, such as the “diversity-centric approach” for selecting training data in streamflow forecasting, where statistical analysis are performed to select useful data instead of location or similarity in conditions (Snieder and Khan, 2025). Moreover, it enhances interpretability and model robustness compared to traditional regression. The high explained deviation (>60%) for critical IHAs (mean flows, extremes, flashiness) demonstrates the approach’s strength.
However, limitations include potential omission of nonlinear and interaction effects among predictors, and its correlative nature precluding definitive causal inference without physically based hydrological process integration (Tian et al., 2024; McMillan, 2021; McMillan, 2020). The lower model performance for timing-related IHAs suggests that subsurface processes, climatic variability, and management interventions likely influence these components beyond landscape metrics alone.
One notable limitation of our study lies in the sample size used for the LASSO regression analyses. Although LASSO is designed to handle high-dimensional datasets effectively by performing variable selection and regularization, the relatively small number of observations may reduce the robustness of the estimated models. Limited sample sizes can increase the variability of coefficient estimates and potentially compromise the stability and generalizability of the results. Consequently, while our findings provide valuable insights, they should be interpreted with caution, and future work should aim to validate these results with larger datasets to enhance confidence in the model robustness.
The scenario analysis further illustrates the complex interplay between land use planning and hydrological response. Strategic land use planning (PROT) could mitigate hydrological degradation in less urbanized Los Almendros by preserving connectivity and buffering vegetation, so there is a critical need to prioritize agroecological zoning and the establishment of riparian buffers to safeguard baseflow essential for smallholder agricultural operations. These measures will help maintain hydrological stability amid ongoing land cover transformations. In RM enforcing compact urban development combined with the incorporation of green infrastructure solutions, such as permeable pavements and stormwater management facilities, is imperative to mitigate the increasing risk of flash floods and hydrological fragmentation. (Kim et al., 2013; Zhou et al., 2020). Finally, at the regional scale, integrating strategic land use planning frameworks (e.g., PROT) with adaptive water allocation policies is essential for balancing competing water demands and enhancing resilience. This integrated approach has been successfully implemented in neighboring basins such as Chile’s Aconcagua, providing a useful model for coordinated governance to address urbanization pressures and water scarcity challenges (Webb et al., 2021).
From an environmental perspective, urban-driven hydrological flashiness elevates flood risks, sediment transport, and ecosystem stress, necessitating integrated stormwater management and green infrastructure (Dogan and Karpuzcu, 2022; Kim et al., 2013). Vegetation recovery in rural catchments enhances aquifer recharge but may pose wildfire risks, illustrating trade-offs inherent in land use transitions (Bart and Tague, 2017).
Socio-economically, this study underlines the importance of incorporating spatial configuration metrics into land and water policy decisions to balance development with ecological resilience and water security in vulnerable drylands (Henríquez-Dole et al., 2018; Bauer, 2015). Encouraging compact urban growth and preserving connected vegetation corridors can enhance hydrological stability and reduce conflicts over scarce water resources.
5 Conclusion
The study reconstructed land use changes in two contrasting catchments of the Maipo River Basin, Chile, revealing divergent trajectories: Rinconada de Maipú (RM) experienced extensive urbanization with impervious surface expansion intensifying peak flows and flash floods, whereas Los Almendros showed rural depopulation and vegetation consolidation stabilizing baseflow despite agricultural decline. Using LASSO regression, we identified key class-level landscape metrics—especially shape and aggregation indices such as mean urban patch shape (SHAPE_MN) and agricultural patch fragmentation (SPLIT)—that significantly influence hydrological signatures related to monthly flows, extreme events, and flow flashiness. These findings emphasize the importance of spatial configuration, beyond mere land cover composition, in modulating hydrological regimes in drylands.
Analysis based on future land use scenarios which combine political frameworks—Business-as-Usual (BAU) and Strategic Land Use Planning (PROT)— and urban population pressures—High Urban Demand (HUD and Low Urban Demanda (LUD)— illustrate context-dependent outcomes. In Los Almendros, characterized by low anthropogenic intervention, PROT scenarios mitigated hydrological degradation more effectively than BAU by promoting vegetation buffers and preserving riparian connectivity. However, in the highly urbanized RM catchment, PROT’s benefits were limited in offsetting median flow declines, despite moderating peak flow rise rates. This suggests that in catchments with entrenched urbanization, achieving water security and flow regulation likely requires not only strategic land use planning but also the incorporation of hybrid green-grey infrastructure measures—such as permeable pavements and stormwater management systems—that were not encompassed in the PROT scenarios analyzed. This proposition highlights a critical area for future planning interventions aimed at addressing complex urban hydrological challenges.
Overall, this research offers a transferable analytical framework that integrates class-level landscape metrics and hydrological alteration indicators to inform water resource management and land use decision-making. While the scenario outcomes demonstrated are specific to the case studies examined, they underscore the necessity for adaptive, multi-scale planning approaches tailored to the intensity of catchment intervention. Integrating dynamic climate projections, socio-economic factors, and advanced hydrological modeling will further enhance the applicability of such frameworks. Policymakers and stakeholders can leverage these insights to design spatial policies and infrastructure investments that balance development pressures with ecological resilience and water security in dryland environments.
Data availability statement
The raw data supporting the conclusions of this article will be made available by the author, without undue reservation.
Author contributions
LH-D: Conceptualization, Data curation, Formal Analysis, Investigation, Methodology, Validation, Writing – original draft, Writing – review and editing. JG: Conceptualization, Supervision, Writing – review and editing. FM: Supervision, Writing – review and editing. ES: Writing – review and editing. CH: Supervision, Writing – review and editing.
Funding
The author(s) declare that financial support was received for the research and/or publication of this article. This work is the result of the funding of the CONICYT scholarship 63140096, the MAPA project under grant N°107081-001 founded by the International Development Research Center (IDRC), the Centro de Desarrollo Urbano Sustentable (CEDEUS) ANID/FONDAP grant N° 1523A0004, and the funding provided by the Pontificia Universidad Católica de Chile through PMI PUC 1203 on interdisciplinary thesis, with the support of the Ministerio de Educación through the higher education program.
Acknowledgments
A special recognition to the Scenario Building Team (SBT), under the MAPA project, where regional stakeholders representing all the organizations and entities participated in dialogues and events which were fundamental throughout the research process. Also, the collaboration of the Gobierno Regional Metropolitano (GORE-RM), Centro de Cambio Global UC (CCG-UC) and the Laboratory of Applied Biometeorology and Climatology (ClimaLab) for their valuable support. Jorge Gironás acknowledge CIGIDEN ANID/FONDAP grant N° 1523A0009. Finally, we thank the valuable contributions from the two reviewers.
Conflict of interest
The authors declare that the research was conducted in the absence of any commercial or financial relationships that could be construed as a potential conflict of interest.
Generative AI statement
The author(s) declare that no Generative AI was used in the creation of this manuscript.
Any alternative text (alt text) provided alongside figures in this article has been generated by Frontiers with the support of artificial intelligence and reasonable efforts have been made to ensure accuracy, including review by the authors wherever possible. If you identify any issues, please contact us.
Publisher’s note
All claims expressed in this article are solely those of the authors and do not necessarily represent those of their affiliated organizations, or those of the publisher, the editors and the reviewers. Any product that may be evaluated in this article, or claim that may be made by its manufacturer, is not guaranteed or endorsed by the publisher.
References
Alatorre, L. C., Granados, A., Bravo, L. C., Torres, M. E., Wiebe, L. C., Uc, M. I., et al. (2019). Agricultural furrow irrigation inefficiency in the Basin of Bustillos Lagoon, Chihuahua, Mexico: geometric characteristics of agricultural plots and aquifer depletion. Tecnol. Ciencias Del Agua 10 (5), 241–281. doi:10.24850/J-TYCA-2019-05-10
Ali, G. A., and Roy, A. G. (2010). Shopping for hydrologically representative connectivity metrics in a humid temperate forested catchment. Water Resour. Res. 46 (12), 12544. doi:10.1029/2010WR009442
Bart, R. R., and Tague, C. L. (2017). The impact of wildfire on baseflow recession rates in California. Hydrol. Process. 31 (8), 1662–1673. doi:10.1002/hyp.11141
Bauer, C. J. (2015). Water conflicts and entrenched governance problems in Chile’s market model. Water Altern. 8 (2), 147–172. Available online at: https://www.water-alternatives.org/index.php/alldoc/articles/vol8/v8issue2/285-a8-2-8/file
Benítez Girón, A. (1998). Taller de hidrología aplicada a la resolución de solicitudes de derechos de aprovechamiento de aguas superficiales. DGA. Dep. Adm. Recur. Hídricos. Available online at: https://snia.mop.gob.cl/PIA/handle/20.500.13000/4748
Berdugo, M., Delgado-Baquerizo, M., Soliveres, S., Hernández-Clemente, R., Zhao, Y., Gaitán, J. J., et al. (2020). Global ecosystem thresholds driven by aridity. Science 367, 787–790. doi:10.1126/science.aay5958
Boongaling, C. G. K., Faustino-Eslava, D. V., and Lansigan, F. P. (2018). Modeling land use change impacts on hydrology and the use of landscape metrics as tools for watershed management: the case of an ungauged catchment in the Philippines. Land Use Policy 72 (March), 116–128. doi:10.1016/J.LANDUSEPOL.2017.12.042
Botterill, T. E., and McMillan, H. K. (2023). Using machine learning to identify hydrologic signatures with an encoder–decoder framework. Water Resour. Res. 59 (3), e2022WR033091. doi:10.1029/2022WR033091
Ching, J., Mills, G., Bechtel, B., See, L., Feddema, J., Wang, X., et al. (2018). WUDAPT: an urban weather, climate, and environmental modeling infrastructure for the anthropocene. Bull. Am. Meteorological Soc. 99 (9), 1907–1924. doi:10.1175/BAMS-D-16-0236.1
Conrad, O., Bechtel, B., Bock, M., Dietrich, H., Fischer, E., Gerlitz, L., et al. (2015). System for automated geoscientific analyses (SAGA) v. 2.1.4. Geosci. Model Dev. 8 (7), 1991–2007. doi:10.5194/GMD-8-1991-2015
Cushman, S. A., McGarigal, K., and Neel, M. C. (2008). Parsimony in landscape metrics: Strength, universality, and consistency. Ecol. Indic. 8 (5), 691–703. doi:10.1016/J.ECOLIND.2007.12.002
Dogan, F. N., and Karpuzcu, M. E. (2022). Effect of land use change on hydrology of forested watersheds. Ecohydrology 15, e2367. doi:10.1002/eco.2367
Frutos, Á.De, Navarro, T., Pueyo, Y., and Alados, C. L. (2015). Inferring resilience to fragmentation-induced changes in plant communities in a semi-arid Mediterranean Ecosystem. PLoS ONE 10 (3), e0118837. doi:10.1371/JOURNAL.PONE.0118837
Garreaud, R. D. (2009). The andes climate and weather. Adv. Geosci. 22, 3–11. doi:10.5194/adgeo-22-3-2009
Ghahremani, V., Noori, O., Deihimfard, R., and Veisi, H. (2024). Understanding resilience: contributions of urban agriculture to the resilience of urban landscapes. Urban Agric. Regional Food Syst. 9 (1), e70003. doi:10.1002/UAR2.70003
Gnann, S. J., Howden, N. J. K., and Woods, R. A. (2020). Hydrological signatures describing the translation of climate seasonality into streamflow seasonality. Hydrology Earth Syst. Sci. 24 (2), 561–580. doi:10.5194/HESS-24-561-2020
Gupta, A., Stead, T. S., and Ganti, L. (2024). Determining a meaningful R-Squared value in clinical medicine. Academic Medicine & Surgery. doi:10.62186/001C.125154
Han, J., Mo, N., Cai, J., Ouyang, L., and Liu, Z. (2024). Advancing the local climate zones framework: a critical review of methodological progress, persisting challenges, and future research prospects. Humanit. Soc. Sci. Commun. 11 (1), 1–18. doi:10.1057/S41599-024-03072-8;SUBJMETA
Henríquez-Dole, L., Usón, T. J., Vicuña, S., Henríquez, C., Gironás, J., and Meza, F. (2018). Integrating strategic land use planning in the construction of future land use scenarios and its performance: the Maipo River Basin, Chile. Land Use Policy 78 (November), 353–366. doi:10.1016/J.LANDUSEPOL.2018.06.045
Jackisch, C., Hassler, S. K., Hohenbrink, T. L., Blume, T., Laudon, H., McMillan, H., et al. (2021). Preface: linking landscape organisation and hydrological functioning: from hypotheses and observations to concepts, models and understanding. Hydrology Earth Syst. Sci. 25 (9), 5277–5285. doi:10.5194/HESS-25-5277-2021
Kim, J., Choi, J., Choi, C., and Park, S. (2013). Impacts of changes in climate and land use/land cover under IPCC RCP scenarios on streamflow in the hoeya river Basin, Korea. Sci. Total Environ. 452-453, 181–195. doi:10.1016/j.scitotenv.2013.02.005
E. F. Lambin, and H. Geist (2006). Land-use and land-cover change. Global Change - The IGBP Series. doi:10.1007/3-540-32202-7
Langhammer, J., and Bernsteinová, J. (2025). Attributing the effects of climate change and forest disturbance on runoff using distributed modeling and indicators of hydrological alteration in central European montane basins. J. Hydrology Regional Stud. 57, 102101. doi:10.1016/J.EJRH.2024.102101
Lehnert, M., Savić, S., Milošević, D., Dunjić, J., and Geletič, J. (2021). Mapping local climate zones and their applications in european urban environments: A systematic literature review and future development trends. ISPRS International Journal of Geo-Information 10 (4), 260. doi:10.3390/IJGI10040260/S1
Li, J., and Zhou, Z. X. (2015). Coupled analysis on landscape pattern and hydrological processes in Yanhe Watershed of China. Sci. Total Environ. 505 (February), 927–938. doi:10.1016/j.scitotenv.2014.10.068
Lin, Yi, and Wiegand, K. (2023). Low R2 in ecology: bitter, or B-Side? Ecol. Indic. 153 (September), 110406. doi:10.1016/J.ECOLIND.2023.110406
Liu, H., Yan, H., and Guan, M. (2025). Evaluating the effects of topography and land use change on hydrological signatures: a comparative study of two adjacent watersheds. Hydrology Earth Syst. Sci. 29 (8), 2109–2132. doi:10.5194/HESS-29-2109-2025
Luebert, F., and Pliscoff, P. (2006). Sinopsis Bioclimática y Vegetacional de Chile. Santiago, Chile: Editorial Universitaria.
Luo, M., Liu, Y., Luo, R., Zhu, Q., Guo, J., Tan, Z., et al. (2022). Anthropogenic impacts on the water cycle over drylands in the northern hemisphere. J. Clim. 36 (2), 453–466. doi:10.1175/JCLI-D-22-0037.1
McGarigal, K., and Marks, B. J. (1995). FRAGSTATS: Spatial pattern analysis program for quantifying landscape structure. Portland, OR: U.S. Department of Agriculture, Forest Service, Pacific Northwest Research Station. doi:10.2737/PNW-GTR-351
McGarigal, K., Cushman, S. A., and Ene, E. (2012). FRAGSTATS v4: Spatial pattern analysis program for categorical and continuous maps. Amherst: Computer software program produced by the authors at the University of Massachusetts.
McGarigal, K., Cushman, S., Neel, M., and Ene, E. (2015). FRAGSTATS: Spatial pattern analysis program for categorical maps.
McMillan, H. K. (2020). Linking hydrologic signatures to hydrologic processes: a review. Hydrol. Process. 34 (6), 1393–1409. doi:10.1002/HYP.13632
McMillan, H. K. (2021). A review of hydrologic signatures and their applications. Wiley Interdiscip. Rev. Water 8 (1), e1499. doi:10.1002/WAT2.1499
Meza, F. J., Vicuña, S., Jelinek, M., Bustos, E., and Bonelli, S. (2014). Assessing water demands and coverage sensitivity to climate change in the urban and rural sectors in central Chile. J. Water Clim. Change 5 (2), 192–203. doi:10.2166/wcc.2014.019
Moosavi, V., Karami, A., Behnia, N., Berndtsson, R., and Massari, C. (2022). Linking hydro-physical variables and landscape metrics using advanced data mining for stream-flow prediction. Water Resour. Manag. 36 (11), 4255–4273. doi:10.1007/S11269-022-03251-9
MOP (2021). Plan Estratégico de Gestión Hídrica En La Cuenca de Maipo. Santiago, Chile. Available online at: https://snia.mop.gob.cl/repositoriodga/handle/20.500.13000/125473.
Moriasi, D. N., Arnold, J. G., Van Liew, M. W., Bingner, R. L., Harmel, R. D., and Veith, T. L. (2007). Model evaluation guidelines for systematic quantification of accuracy in watershed simulations. Trans. ASABE 50 (3), 885–900. doi:10.13031/2013.23153
Ocampo-Melgar, A., Vicuña, S., Gironás, J., Varady, R. G., and Scott, C. A. (2016). Scientists, policymakers, and stakeholders plan for climate change: a promising approach in Chile’s Maipo Basin. Environ. Sci. Policy Sustain. Dev. 58 (5), 24–37. doi:10.1080/00139157.2016.1209004
Pak, A., Kaviani Rad, A., Nematollahi, M. J., and Mahmoudi, M. (2025). Application of the lasso regularisation technique in mitigating overfitting in air quality prediction models. Sci. Rep. 15 (1), 547–17. doi:10.1038/s41598-024-84342-y
Poff, N. L., and Zimmerman, J. K. H. (2010). Ecological responses to altered flow regimes: a literature review to inform the science and management of environmental flows. Freshw. Biol. 55 (1), 194–205. doi:10.1111/j.1365-2427.2009.02272.x
Poff, N. L., Richter, B. D., Arthington, A. H., Bunn, S. E., Naiman, R. J., Kendy, E., et al. (2010). The ecological limits of hydrologic alteration (ELOHA): a new framework for developing regional environmental flow standards. Freshw. Biol. 55 (1), 147–170. doi:10.1111/j.1365-2427.2009.02204.x
Puertas, O. L., Henríquez, C., and Meza, F. J. (2014). Assessing spatial dynamics of urban growth using an integrated land use model. Application in Santiago metropolitan area, 2010–2045. Land Use Policy 38 (May), 415–425. doi:10.1016/j.landusepol.2013.11.024
Ren, J., Wang, W., Jia, W., Li, H., Li, X., Liu, G., et al. (2023). Evolution and prediction of drought-flood abrupt alternation events in huang-huai-hai River Basin, China. Sci. Total Environ. 869 (April), 161707. doi:10.1016/J.SCITOTENV.2023.161707
Robineau, T., Rodler, A., Morille, B., Ramier, D., Sage, J., Musy, M., et al. (2022). Coupling hydrological and microclimate models to simulate evapotranspiration from urban green areas and air temperature at the district scale. Urban Clim. 44, 101179. doi:10.1016/J.UCLIM.2022.101179
Rosenfield, G. H., and Fitzpatrick-Lins, K. (1986). A coefficient of agreement as a measure of thematic classification accuracy. Photogrammetric Eng. Remote Sens. 52 (2), 223–227. Available online at: https://www.asprs.org/wp-content/uploads/pers/1986journal/feb/1986_feb_223-227.pdf
Santhi, C., Arnold, J. G., Williams, J. R., Dugas, W. A., Srinivasan, R., and Hauck, L. M. (2001). Validation of the swat model on a large rwer basin with point and nonpoint sources. JAWRA J. Am. Water Resour. Assoc. 37 (5), 1169–1188. doi:10.1111/J.1752-1688.2001.TB03630.X
Scanlon, B. R., Fakhreddine, S., Rateb, A., de Graaf, I., Famiglietti, J., Gleeson, T., et al. (2023). Global water resources and the role of groundwater in a resilient water future. Nat. Rev. Earth & Environ. 24 (2), 87–101. doi:10.1038/s43017-022-00378-6
Slater, L. J., Arnal, L., Boucher, M. A., Chang, A. Y. Y., Moulds, S., Murphy, C., et al. (2023). Hybrid forecasting: blending climate predictions with AI models. Hydrology Earth Syst. Sci. 27 (9), 1865–1889. doi:10.5194/HESS-27-1865-2023
Snieder, E., and Khan, U. T. (2025). A diversity-centric strategy for the selection of spatio-temporal training data for LSTM-based streamflow forecasting. Hydrology Earth Syst. Sci. 29 (3), 785–798. doi:10.5194/HESS-29-785-2025
Stewart, I. D., and Oke, T. R. (2012). Local climate zones for urban temperature studies. Bull. Am. Meteorological Soc. 93 (12), 1879–1900. doi:10.1175/BAMS-D-11-00019.1
Tejada, D., Sandoval, G., and Peredo-Parada, M. (2015). Clasificación de años secos, normales y húmedos mediante el método standardized precipitation index adaptado a caudal medio mensual: aplicación en mulchén.
Tian, H., Huang, L., Hu, S., and Wu, W. (2024). A modified machine learning algorithm for multi-collinearity environmental data. Environ. Ecol. Statistics 31 (4), 1063–1083. doi:10.1007/s10651-024-00634-6
Tibshirani, R. (1996). Regression shrinkage and selection via the lasso. J. R. Stat. Soc. Ser. B Methodol. 58 (1), 267–288. doi:10.1111/J.2517-6161.1996.TB02080.X
Tibshirani, R. (2011). Regression shrinkage and selection via the lasso: a retrospective. J. R. Stat. Soc. Ser. B Stat. Methodol. 73 (3), 273–282. doi:10.1111/J.1467-9868.2011.00771.X
Vogiatzakis, I. N., Mannion, A. M., and Griffiths, G. H. (2006). Mediterranean ecosystems: problems and tools for conservation. Prog. Phys. Geogr. 30 (2), 175–200. doi:10.1191/0309133306pp472ra
Walsh, C. J., Allison, H. R., Feminella, J. W., Cottingham, P. D., Groffman, P. M., and Morgan, R. P. (2005). The urban stream syndrome: current knowledge and the search for a cure. 24 (3): 706–723. doi:10.1899/04-028.1
Webb, M. J., Winter, J. M., Spera, S. A., Chipman, J. W., and Osterberg, E. C. (2021). Water, agriculture, and climate dynamics in central Chile’s aconcagua River Basin. Phys. Geogr. 42, 395–415. doi:10.1080/02723646.2020.1790719
Wei, C., Dong, X., Ma, Y., Leng, M., Zhao, W., Zhang, C., et al. (2023). Relationships between landscape patterns and hydrological processes in the subtropical monsoon climate Zone of Southeastern China. Remote Sens. 15 (9), 2290. doi:10.3390/RS15092290
Zhang, S., Fan, W., Li, Y., and Yi, Y. (2017). The influence of changes in land use and landscape patterns on soil erosion in a watershed. Sci. Total Environ. 574 (January), 34–45. doi:10.1016/J.SCITOTENV.2016.09.024
Zheng, F.Li (2006). Effect of vegetation changes on soil erosion on the loess Plateau. Pedosphere 16 (4), 420–427. doi:10.1016/S1002-0160(06)60071-4
Zhou, T., Kennedy, E., Koomen, E., and van Leeuwen, E. S. (2020). Valuing the effect of land use change on landscape services on the urban–rural fringe. J. Environ. Plan. Manag. 63 (13), 2425–2445. doi:10.1080/09640568.2020.1726732
Keywords: landscape metrics, hydrological signatures, global change, society influence, sustainable planning, lasso regression, indicators of hydrological alteration
Citation: Henriquez-Dole LE, Gironás J, Meza F, Salazar E and Henríquez C (2025) Landscape metrics selection and influence over hydrological signatures: land use change’s effect over water resources in Chile. Front. Environ. Sci. 13:1569574. doi: 10.3389/fenvs.2025.1569574
Received: 01 February 2025; Accepted: 06 October 2025;
Published: 30 October 2025.
Edited by:
Mariana Madruga de Brito, Helmholtz Association of German Research Centres (HZ), GermanyReviewed by:
Jasmin Heilemann, Helmholtz-Center for Environmental Research, GermanyLetícia Santos De Lima, Autonomous University of Barcelona, Spain
Copyright © 2025 Henriquez-Dole, Gironás, Meza, Salazar and Henríquez. This is an open-access article distributed under the terms of the Creative Commons Attribution License (CC BY). The use, distribution or reproduction in other forums is permitted, provided the original author(s) and the copyright owner(s) are credited and that the original publication in this journal is cited, in accordance with accepted academic practice. No use, distribution or reproduction is permitted which does not comply with these terms.
*Correspondence: Lenin Esau Henriquez-Dole, bC5oZW5yaXF1ZXpAZWNvYWdzdXMuY29t