 Zijing Zhang
 Bowen Li
 Jianxiang Wang
- 1School of Economics and Management, Dalian University of Technology, Bank of Dalian Postdoctoral Workstation, Dalian Administrative Institute, Dalian, China
- 2School of International Business, Zhejiang Yuexiu University, Shaoxing, China
- 3School of Finance, Dongbei University of Finance and Economics, Dalian, China
This study empirically examines the impact of the Green Credit Guidelines Policy (GCGP) on carbon emission intensity in China’s manufacturing sector. Using a difference-in-differences (DID) model and panel data from A-share listed firms from 2008 to 2023, we treat the issuance of the GCGP in 2012 as a quasi-natural experiment. The results demonstrate that the GCGP significantly reduces the carbon emission intensity of manufacturing enterprises. Further analysis reveals that this effect operates through both macro and micro-level mechanisms. At the macro level, green credit promotes industrial structure upgrading and enhances energy utilization efficiency. At the micro level, it improves investment efficiency and the quality of environmental information disclosure, thereby supporting carbon reduction. Heterogeneity analysis shows that the carbon-reducing effect of green credit is more pronounced in firms with strong internal governance, low financing constraints, and a high degree of digital transformation. Additionally, the policy is more effective in regions with stricter environmental regulations, higher financial development, and a stronger orientation toward economically developed areas. These findings offer important theoretical insights and policy implications, underscoring the role of green finance in achieving low-carbon transformation and supporting sustainable development goals.
1 Introduction
Addressing climate change and reducing carbon emissions are global concerns. China’s factor-driven rapid economic expansion growth has been accompanied by excessive energy consumption, resulting in significant carbon dioxide (CO2) emissions and escalating climate challenges. Moreover, according to the Global Carbon Emissions Report 2023 released by the International Energy Agency (IEA), global energy-related CO2 emissions continued to rise in 2023, reaching 37.4 billion tons. China remains the world’s largest CO2 emitter, releasing approximately 34% of global emissions. As part of its commitment to global climate governance, China has set ambitious dual carbon targets: to peak carbon emissions by 2030 and achieve carbon neutrality by 2060. These nationally determined contributions constitute a strategic pathway for advancing global climate change mitigation and promoting sustainable development.
Corporate low-carbon initiatives are essential for advancing environmental sustainability, particularly within the manufacturing sector, which faces the dual imperative of transitioning to cleaner energy sources and adopting green technologies to reduce carbon emissions. In response to rising environmental pressures, the Chinese government has employed a mix of incentive-based and regulatory approaches, increasingly integrating financial instruments into its environmental governance framework. Among these instruments, the Green Credit Guidelines Policy (GCGP), introduced by the China Banking Regulatory Commission in February 2012, stands out as a critical financial regulatory tool. The GCGP institutionalizes the integration of environmental criteria into the credit allocation process, directing financial resources away from pollution-intensive sectors and toward greener alternatives. By the fourth quarter of 2023, China’s outstanding green credit balance had reached USD 4.256 trillion, marking a 36.5% year-on-year increase and accounting for 12.7% of total loan balances. Despite its rapid expansion, an important question remains: Does the green credit policy effectively mitigate carbon emissions among manufacturing enterprises?
Green credit guidelines policy (GCGP), based on the international practice of the Equator Principle, encourages financial institutions to allocate resources toward projects and businesses that promote environmental protection, energy efficiency, and carbon emission reduction. By integrating environmental considerations into the credit assessment process, green credit aims to align financial flows with sustainable development goals, facilitating the transition to a low-carbon economy (Hu et al., 2021). This approach is widely recognized and valued globally. The UK government launched the Green Investment Bank in 2012 as a dedicated financial institution to facilitate low-carbon project financing through equity investments and credit guarantees. In a significant policy development, the European Central Bank formally incorporated climate change risk assessments into its monetary policy framework in July 2022, thereby expanding the application of financial instruments to support economic green transformation initiatives. The GCGP in China is a government-led top-down policy, encouraging banks and financial institutions to be industrially oriented in implementing credit preferences for greening projects and loan limits or high-interest rate credit penalties for restricted projects, ultimately achieving the green distribution of financial resources and environmental governance (Zhang et al., 2021).
Researchers have extensively examined the impacts of the GCGP. Financial institutions incorporate environmental assessment standards, pollution management and control measures, and ecological protection criteria into credit approval processes to restrict lending to firms engaged in environmentally harmful activities. From a macro perspective, numerous studies have investigated the impact of GCGP on economic and environmental protection (Nabeeh et al., 2021; Yao et al., 2021), reductions in coal energy consumption (Liu et al., 2017), and industrial structure upgrading (Wang et al., 2021; Cheng et al., 2022). From a micro perspective, most research has focused on the influence of GCGP on corporate investment and financing activities, technological innovation, and green transformation (Chen et al., 2019; Ling et al., 2020). While extensive research has been conducted on these topics, relatively few have specifically examined the relationship between green credit and carbon emissions, particularly within the manufacturing sector.
Accordingly, we examine whether the GCGP can curb corporate carbon emissions and identify the driving factors and heterogeneous mechanisms of green transformation in the manufacturing sector. To address the integrated research question, we adopt a difference-in-differences research design based on panel data from China’s A-share listed companies covering the period from 2008 to 2023. This study makes three principal contributions to the existing literature. First, unlike most existing literature primarily focusing on the industry-level impacts of green credit policies, we provide new empirical evidence using firm-level panel data, which broadens the assessment of the effects of GCGP and offers a foundation for utilizing financial instruments to accomplish the objective of “double carbon” reduction. Second, we investigate the relationship between the GCGP and carbon emission intensity from both macro- and micro-level perspectives. At the macro level, we examine the roles of industrial structure and energy efficiency; at the micro level, we assess the impacts of environmental information disclosure and investment efficiency. Furthermore, we analyze the heterogeneity of the GCGP’s effect by considering variations in firm-level characteristics and regional conditions. This comprehensive analysis helps to clarify the underlying policy transmission mechanisms.
The remainder of this paper is organized as follows: Section 2 presents a theoretical analysis and research hypotheses. Section 3 describes the empirical models and data. Section 4 analyzes the empirical results. Sections 5, 6 provide the mechanism and heterogeneity analyses, respectively. Finally, section 7 discusses the results and offers policy recommendations.
2 Theoretical analysis and research hypotheses
Existing studies examining the relationship between the GCGP and enterprise carbon emission intensity have yielded divergent findings, reflecting the complexity of this policy-environment nexus. Some researchers argue that the GCGP effectively reduce carbon emissions (An et al., 2021), while others suggest that such policies may, paradoxically, stimulate emissions (Bello and Abimbola, 2010; Sadorsky, 2010). Additionally, some studies emphasize the uncertainty surrounding carbon emissions induced by green credit policies (Su et al., 2022). This section comprehensively analyzes the direct and indirect mechanisms given these contrasting viewpoints.
2.1 Direct impact of the GCGP on enterprises’ carbon emission intensity
The impact of the GCGP on carbon emission intensity in the manufacturing sector can be explained through three principal transmission mechanisms: credit constraints, green signaling, and technological innovation. Together, these channels facilitate the transition of manufacturing enterprises toward environmentally sustainable practices, thereby contributing to a decline in carbon emission intensity. First, from a corporate finance perspective, the GCGP introduces differentiated credit thresholds that restrict financing access for pollution-intensive industries. Under these more stringent lending standards, firms in sectors characterized by high energy consumption and heavy pollution are compelled to phase out obsolete production methods, invest in pollution control technologies, and pursue green transformation initiatives. These adjustments help alleviate credit constraints and directly reduce carbon emissions (Chen et al., 2011). Second, the GCGP functions as a green signaling mechanism by integrating environmental information into credit evaluations. This incentivizes enterprises to enhance transparency in environmental performance, strengthen carbon disclosure practices, and upgrade environmental management systems. Consequently, investors and financial institutions are directed toward low-carbon firms, reinforcing market preferences for sustainability (Lin and Pan, 2023; Wang et al., 2021; Lin and Pan, 2023). For highly polluting firms, this signaling effect serves as a policy alert, motivating them to accelerate their transition to cleaner operations (Li et al., 2022). Third, the GCGP indirectly promotes technological innovation by influencing the cost of capital. As compliance with green credit requirements raises financing costs for non-compliant firms, they are incentivized to pursue innovation to offset the associated regulatory and operational burdens. When the returns from innovation surpass the cost of environmental compliance, an “innovation compensation” effect emerges, yielding both economic and ecological benefits (Zhang et al., 2021). Through the combined effects of credit tightening, environmental signaling, and innovation stimulation, the GCGP fosters cleaner production, more efficient resource allocation, and long-term green upgrading in the manufacturing sector. Therefore, we proposed the following hypothesis.
Hypothesis 1. The GCGP significantly contributes to reducing carbon emission intensity in manufacturing enterprises.
2.2 Indirect impact of the GCGP on enterprises’ carbon emission intensity
This section systematically explores the multi-level transmission mechanisms through which the GCGP indirectly influences enterprise carbon emission intensity, utilizing an integrated analytical framework that connects macro-level structural factors with micro-level behavioral responses.
2.2.1 Macro-level mechanism analysis
The GCGP promotes technological upgrading and the adoption of low-carbon business models by providing preferential financing to environmentally sustainable projects while restricting capital access for high-pollution industries. From an economic development perspective, credit allocation places continuous pressure on inefficient industries, driving the reallocation of production factors. These factors transition from low-productivity primary industries toward to high-productivity, green, and digitized sectors (Tian et al., 2014). Optimizing the industrial structure plays a pivotal role in reducing carbon emission intensity and advancing the achievement of the Sustainable Development Goals (SDGs). Specifically, industrial upgrading involves rationalizing and progressing the industrial structure, ensuring a shift toward higher productivity and lower carbon emissions. This process promotes industrial restructuring, leading to the elimination of outdated, high-emission production methods.
The GCGP facilitate this transition by influencing enterprise investment decisions and resource allocation. In particular, two-high enterprises are incentive to phase out outdated capacity and adopt green, energy-efficient technologies to comply with stricter environmental financing conditions (Liu et al., 2022). The manufacturing sector plays a pivotal role in this transformation by integrating clean energy technologies, energy efficiency innovations, and carbon capture and storage solutions, ultimately decoupling economic growth from carbon emissions (Zhang et al., 2014). Moreover, emerging industries receiving green credit support typically demonstrate higher value creation and lower energy consumption. With the advancement of renewable energy technologies, enterprises are gradually reducing their dependence on fossil fuels and shifting toward cleaner energy alternatives. This shift enhances industrial efficiency, lowers carbon dependency, and facilitates a sustainable economic transition.
Hypothesis 2. The GCGP contributes to the reduction of carbon emission intensity in manufacturing enterprises by facilitating the upgrading of industrial structures.
Energy efficiency is fundamental to sustainable development and the transition to a low-carbon economy, as higher energy efficiency enables enterprises to maintain the same level of economic output with reduced energy consumption or to increase productivity without a corresponding rise in energy demand, thereby directly lowering carbon emissions per unit of output. The GCGP plays a crucial role in optimizing production processes, accelerating the clean energy transition and achieving sustainable, low-carbon development. It provides low-cost financing for enterprises to adopt energy-saving technologies and replace outdated equipment, leading to higher energy efficiency and reduced carbon emissions (Hu et al., 2020). Meanwhile, financial support encourages the replacement of energy-intensive, high-emission equipment, reducing energy waste and carbon intensity per unit of output. Furthermore, by linking loan terms to emission reduction commitments, green credit reinforces market-based incentives for energy efficiency, offering preferential interest rates and credit quotas to enterprises that achieve energy efficiency improvements and carbon reduction goals. It also mandates enterprises to establish carbon accounting and monitoring systems, improving data transparency and refining emission reduction strategies.
Moreover, green credit reduces financing costs and risks, offering long-term, low-cost funding that alleviates short-term financial pressure and encourages long-term investments in energy efficiency. Through government-backed loan guarantees and subsidies, green credit reduces risks for enterprises adopting high-efficiency technologies, accelerating implementation. Furthermore, green credit is a financing constraint, influencing capital allocation and market entry dynamics. It enforces credit rationing by progressively restricting capital investment in high-carbon projects while simultaneously increasing financial support for green and low-carbon initiatives. Limited financing forces inefficient, energy-intensive firms to scale back operations or exit the market, thereby improving energy efficiency at industry and regional levels.
Hypothesis 3. The GCGP contributes to the reduction of carbon emission intensity in manufacturing enterprises by promoting improvements in energy efficiency.
2.2.2 Micro-level mechanism analysis
By requiring firms to enhance transparency in their environmental impact reporting, green credit strengthens external oversight and encourages more sustainable corporate behavior. High-quality disclosure ensures that corporate carbon emission data is publicly available and subject to scrutiny from investors, regulatory bodies, and the public (Ding et al., 2022). Additionally, insufficient disclosure or high carbon emissions may affect enterprises’ financing costs or customer preferences, pushing firms to optimize their environmental performance proactively. The link between green credit and environmental disclosure also improves green financing accessibility. Since green credit financing often mandates regular environmental reporting, firms with higher disclosure quality can access low-cost capital more efficiently, supporting investment in emission reduction projects such as procuring clean energy equipment. Furthermore, enhanced disclosure improves a firm’s ESG rating, making it more attractive to sustainability-focused investors and fostering a positive cycle of “enhanced disclosure – improved financing access – increased investment in emission reduction initiatives.”
Beyond individual firms, green credit and environmental disclosure foster supply chain-wide emission reductions. To comply with disclosure requirements, manufacturing enterprises may demand that their suppliers publish environmental data, promoting adopting low-carbon technologies throughout the supply chain, such as green material substitution and shared logistics, to reduce emissions (Thompson and Cowton, 2004). Additionally, transparent emission data enables collaboration among firms within the industrial chain, which improves overall energy efficiency. By enhancing environmental information disclosure quality, green credit facilitates more rigorous external monitoring, expands access to green financing, drives supply chain-wide sustainability efforts, ensures regulatory compliance, and enhances brand competitiveness. These mechanisms collectively contribute to reducing carbon emission intensity in the manufacturing sector, supporting the transition toward a low-carbon economy.
Hypothesis 4. The GCGP reduces the carbon emission intensity of manufacturing enterprises by enhencing the quality of environmental information disclosure.
In the presence of principal-agent problems and information asymmetry, managers may prioritize personal interests over shareholder value, often resulting in inefficient investment behaviors. Before the implementation of the Green Credit Guidelines Policy (GCGP), manufacturing enterprises in China commonly relied on tangible assets to secure bank financing, which, coupled with abundant free cash flow, increased the likelihood of excessive and low-efficiency investments. Following the introduction of the GCGP in 2012, firms began to face greater external financing constraints and policy-driven environmental pressures, which prompted a reduction in such inefficient investment activities (Tian et al., 2022).
The GCGP functions by internalizing the environmental costs associated with pollution-intensive projects, thereby discouraging enterprises from engaging in “two-high” and low-return investments under conditions of limited financial resources (He et al., 2019). At the same time, green credit serves as a signaling mechanism that incentivizes firms to shift their capital allocation toward environmentally friendly projects, such as green production and R&D. As a result, firms not only curb inefficient investments but also enhance the overall efficiency of investment decision-making. Improved investment efficiency contributes directly to lower carbon emission intensity by reducing redundant fixed-asset expansion, transforming extensive growth models, and curbing fossil energy consumption. Moreover, the reallocation of capital toward green innovation facilitates the adoption of low-carbon, energy-efficient technologies, further reinforcing carbon reduction efforts (Lee and Min, 2015).
Hypothesis 5. The GCGP reduces the carbon emission intensity of manufacturing enterprises by enhancing investment efficiency.
3 Methodology and data
3.1 Research design and model construction
We exploit the 2012 implementation of the Green Credit Guidelines Policy (GCGP) as a quasi-natural experiment to identify its causal impact on corporate carbon emissions. Adopting a DID framework, firms are categorized into treatment and control groups according to their pollution intensity. Specifically, enterprises operating in officially designated high-polluting industries are assigned to the treatment group, while those in other industries comprise the control group. The baseline DID model is specified as follows:
The model specification includes the following components. The subscript i denotes individual firms, and t represents the time dimension. The dependent variable, Co2_intensity captures the level of corporate carbon emissions per unit of output. The key explanatory variables are defined as follows: (1) Treat is a binary variable equal to one for firms classified as energy-intensive and highly polluting (the “two-high” industries), and 0 otherwise; (2) Time is a temporal dummy variable set to one for the post-policy period (2012 onward) and 0 for the pre-policy period. The model incorporates γ for time fixed effects, μ for firm fixed effects, and ε as the idiosyncratic error term. A vector of control variables (control) accounts for other observable factors.
3.2 Variables selection
3.2.1 Explained variables
Enterprise carbon emission intensity (Co2Intensityit). It is defined as the volume of carbon dioxide emissions generated per unit of economic output and serves as a key indicator for evaluating the environmental impact of industrial activities. Due to the lack of firm-level carbon emissions data, we draw on Chapple et al. (2013) to convert firms’ carbon emission intensity through industry energy consumption data. The measurement steps are: First, calculate the manufacturing industry’s overall carbon emissions. The primary energy sources include coal, coke, crude oil, gasoline, kerosene, diesel, fuel oil, and natural gas. The CO2 emission coefficients of these energy sources are 1.903, 2.864, 3.024, 2.929, 3.037, 3.100, 3.171, and 2.165, respectively. First, the carbon emissions from eight energy sources were aggregated to determine the sector’s total emissions. Second, each enterprise’s carbon emissions were divided by the sector’s total emissions, and the resulting ratio was multiplied by the sector’s major operating costs to derive carbon-adjusted operating costs. Third, enterprise-level carbon intensity was computed as the ratio of carbon emissions to primary business revenue, followed by taking its natural logarithm for further analysis. The specific formulation is presented in Equation 2:
3.2.2 Core explanatory variables
To evaluate the implementation effect of the Green Credit Guidelines Policy (GCGP), this study constructs a policy interaction term (Treat × Time) as the core explanatory variable. Existing research often faces fragmented data disclosure, short observation periods, and inconsistent statistical standards. To address these challenges, we adopt a dummy variable approach. Enterprises are classified based on their environmental attributes. Those identified as highly energy-consuming and heavily polluting are assigned to the treatment group, while environmentally friendly enterprises are placed in the control group. A time dummy variable is also constructed, taking the value of one for years from 2012 onward, corresponding to the formal introduction of the Green Credit Guidelines, and 0 for years before 2012.
3.2.3 Control variables
To ensure the robustness of the empirical results, this study follows Yang et al. (2022) in incorporating a comprehensive set of control variables that may influence firms’ carbon emission intensity. At the firm level, we control for the firm’s age (AGE), financial leverage (LEV), asset size (SIZE), business diversification (HHI), and return on equity (ROE). At the provincial level, we include research and development intensity (RD), the level of economic development (ED), and the intensity of credit support (CI).
3.3 Data source
This study compiles carbon emission intensity data from 2008 to 2023 by integrating annual information on manufacturing enterprises from the CSMAR database with environmental indicators from the China Environmental Statistics Yearbook. Additionally, data related to industrial structure upgrading and rationalization were manually extracted from statistical yearbooks at both provincial and prefecture levels across China. To ensure data quality, we implemented rigorous preprocessing procedures. First, we excluded firms under special treatment statuses (*ST, ST, PT) and those with significant missing values in key control variables. Subsequently, we applied natural logarithmic transformations to all continuous variables to address heteroscedasticity and winsorized extreme values beyond the 99th percentile to minimize outlier effects. These procedures yielded a final panel dataset containing 14,767 firm-year observations for empirical analysis.
3.4 Descriptive statistics
Columns (4)–(8) in Table 1 display the descriptive statistics for the primary variables. The natural logarithm of carbon emission intensity (Co2Intensity) exhibits a mean of 2.745 and a standard deviation of 0.977, reflecting considerable variability in environmental performance across enterprises. The green credit treatment group in two-high industries has an average treatment value of 0.347, reflecting a clear disparity between more polluting enterprises and greener ones. Additionally, the natural logarithm of enterprise age (Age) has a mean of 2.327, with most samples above this average, indicating that the sample selection is representative of relatively mature firms.
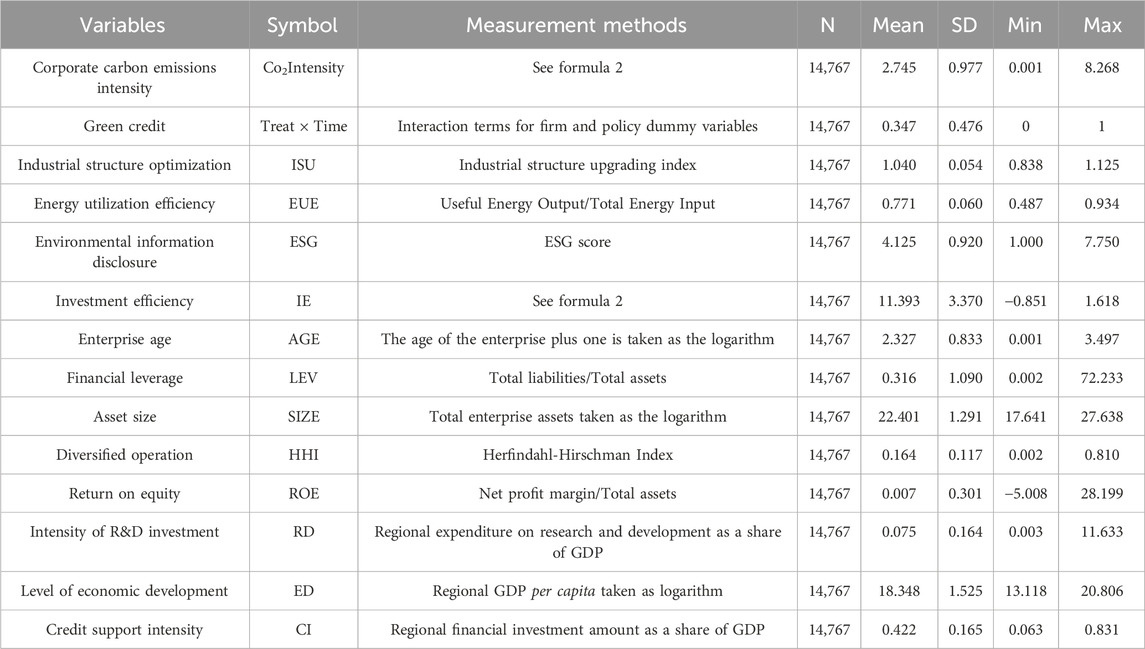
Table 1. Definition of main variables and descriptive statistics results.
4 Testing the direct impact of the GCGP on enterprises’ carbon emission intensity
4.1 Baseline regression results
Model (1) estimates are presented in Table 2, incorporating control variables, industry fixed effects, and time-fixed effects, as shown in Columns (1)–(3). The analysis demonstrates that green credit has a statistically significant negative impact on carbon intensity at the 1% level, providing strong empirical support for H1. This finding underscores that the GCGP functions as an innovative financial instrument, enabling financial institutions to provide credit support and preferential financing to environmentally conscious enterprises while actively promoting environmentally sustainable practices across manufacturing industries. The result indicates that the GCGP significantly reduces the carbon emission intensity of firms in the treatment group (two-high firms) relative to those in the control group (green firms), further reinforcing the effectiveness of the GCGP in incentivizing low-carbon transitions and promoting sustainable industrial transformation.
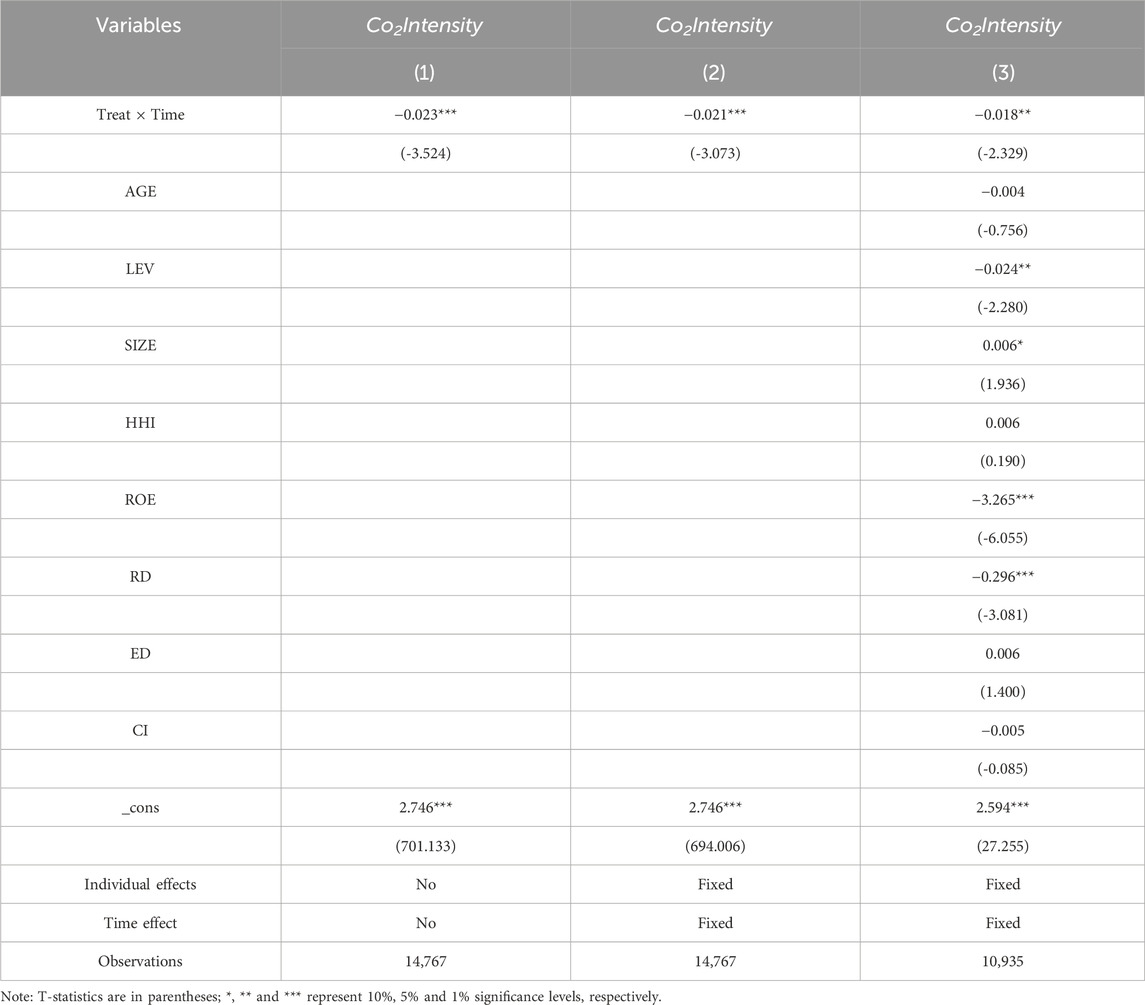
Table 2. Basis regression of green credit on the carbon intensity of enterprises.
4.2 Parallel trend test
The validity of the DID method relies on the key assumption that the treatment and control groups follow a common parallel trend in the absence of the intervention. The parallel trend test is conducted using the event study approach, as specified in Equation 3. N_Time denotes a series of time dummy variables for the periods before and after the policy implementation. In this specification, the interaction term Treat × N_Time replaces N_Time in Equation 1, capturing the dynamic treatment effects over time. The coefficient of interest, φ1, is used to assess the validity of the parallel trend assumption. All other variables in the equation retain the same definitions as those in Equation 1.
We designate the year before the policy implementation as the baseline period and employ an 8-year window surrounding the introduction of the GCGP to conduct the parallel trend test. The results, illustrated in Figure 1, indicate that the coefficient estimates for the 2 years preceding the policy are statistically insignificant and even suggest a slight worsening in carbon intensity. This confirms that, before the implementation of the GCGP, there were no significant differences in trends between the treatment and control groups. In contrast, following the implementation of the GCGP, the coefficient estimates become statistically significant, suggesting a clear divergence between the two groups. These findings indicate that the GCGP had a significant inhibitory effect on the carbon emission intensity of high-pollution, high-energy-consuming enterprises, thereby supporting the validity of the parallel trend assumption.
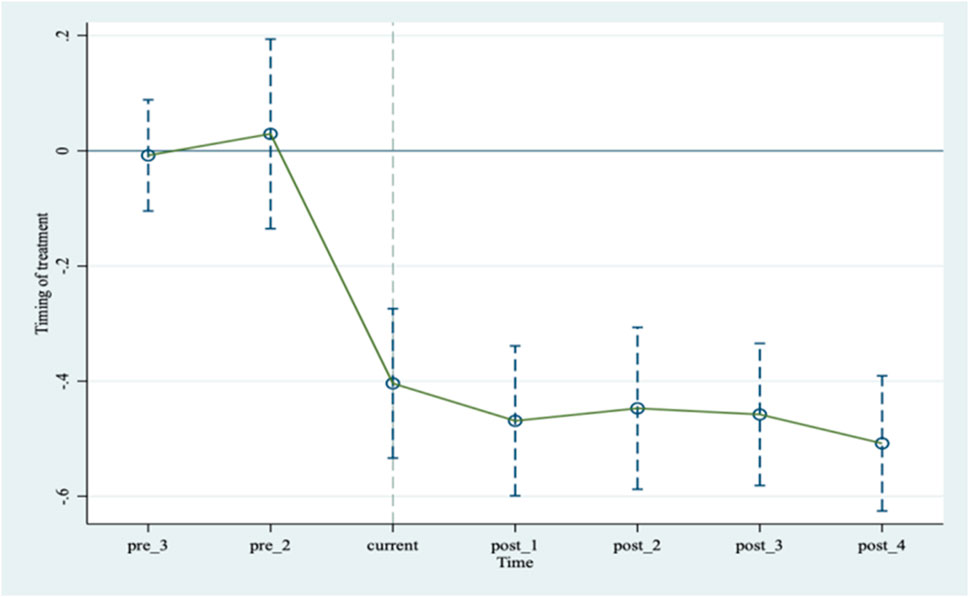
Figure 1. Parallel trend test.
4.3 Placebo test
A placebo test was conducted on a dummy treatment group of enterprise samples using an enterprise placebo. We employed a randomized controlled trial framework to identify the causal effect of green credit on corporate carbon emission intensity. From a population of 1,856 listed firms, 730 were randomly assigned to the treatment group, while the remaining firms comprised the control group. This random assignment process was repeated 500 times to generate empirical sampling distributions of the estimated treatment effects. The resulting kernel density estimates, as shown in Figure 2, yield three key insights. First, the distribution of estimated coefficients is centered around zero and exhibits characteristics of a normal distribution, suggesting that most random assignments produce null effects. Second, the majority of corresponding p-values exceed conventional significance thresholds. Most notably, the baseline estimate of the treatment effect lies in the extreme lower tail of the randomization distribution, providing strong evidence that the observed reduction in carbon intensity is unlikely to have occurred by chance. This randomization inference approach reinforces the robustness and statistical significance of our primary findings.
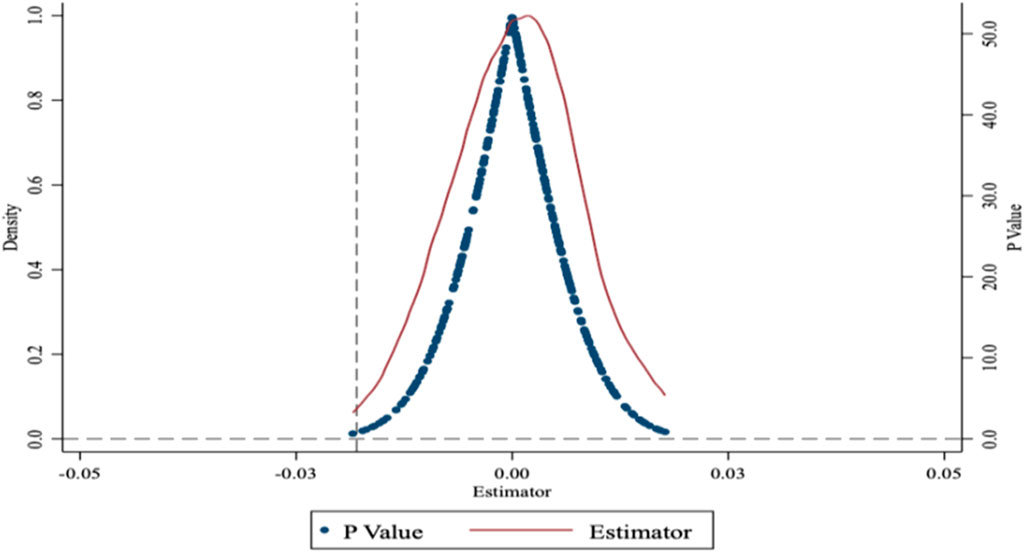
Figure 2. Placebo test.
4.4 Endogeneity analysis
While the baseline regression results indicate a negative association between green credit and carbon emission intensity, these findings may be influenced by self-selection bias. In particular, the observed reductions in emissions among heavily polluting industries may be driven not only by the implementation of green credit policies but also by China’s broader “dual carbon” strategy, which independently promotes technological innovation and industrial upgrading in high-emission sectors through a suite of complementary regulatory measures. To mitigate potential self-selection effects, we employ a propensity score matching difference-in-differences (PSM-DID) approach. Urbanization rate and firm age are used as covariates in the matching process. The estimation results, reported in Columns (1)–(3) of Table 3, are obtained using radius matching, kernel matching, and nearest neighbor matching techniques. Across all specifications, the coefficients (Treat × Time) remain statistically significant at the 5% level. These findings indicate that, even after addressing potential sample selection bias, the GCGP continues to have a significant inhibitory effect on firms’ carbon emission intensity, thereby reinforcing the robustness of the baseline results. the robustness of the baseline results.
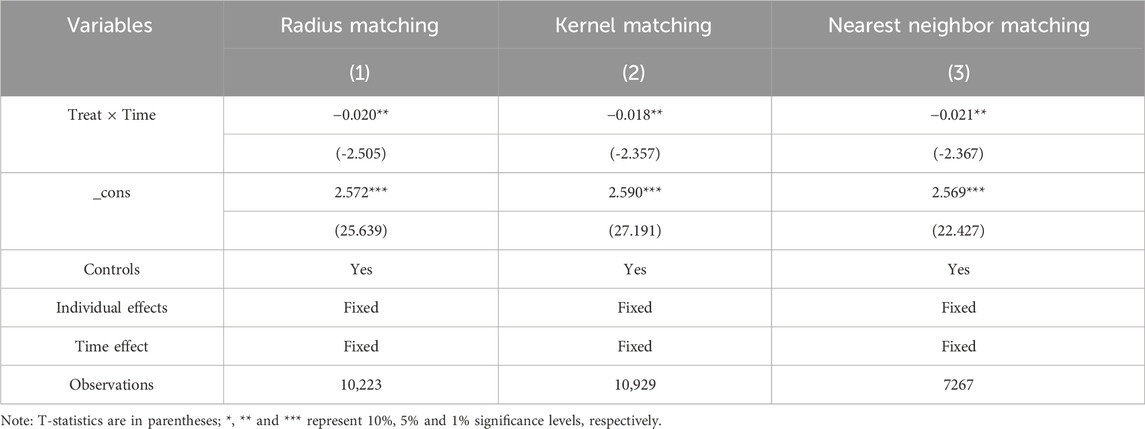
Table 3. Endogeneity analysis: PSM-DID estimation.
4.5 Robustness tests
4.5.1 Expanding the metric of the treatment group
Under the key evaluation criteria of the GCGP, industries such as nuclear power generation, hydropower generation, water conservancy, and inland port engineering, as well as coal mining and washing, are classified as green credit-restricted sectors. This classification is captured by the dummy variable Treat, which takes the value of one if the enterprise operates within a restricted industry, and 0 otherwise. All other variables remain consistent with the baseline specification. Following this reclassification, we re-estimate the model, with the results presented in Column (1) of Table 4. The findings demonstrate that green credit maintains a statistically significant negative relationship with firm-level carbon emission intensity, irrespective of the inclusion of control variables and fixed effects. Specifically, the estimated coefficient on Treat × Time is −0.039 and remains statistically significant at the 1% threshold. This result is consistent with the baseline regression, confirming the robustness of our findings.
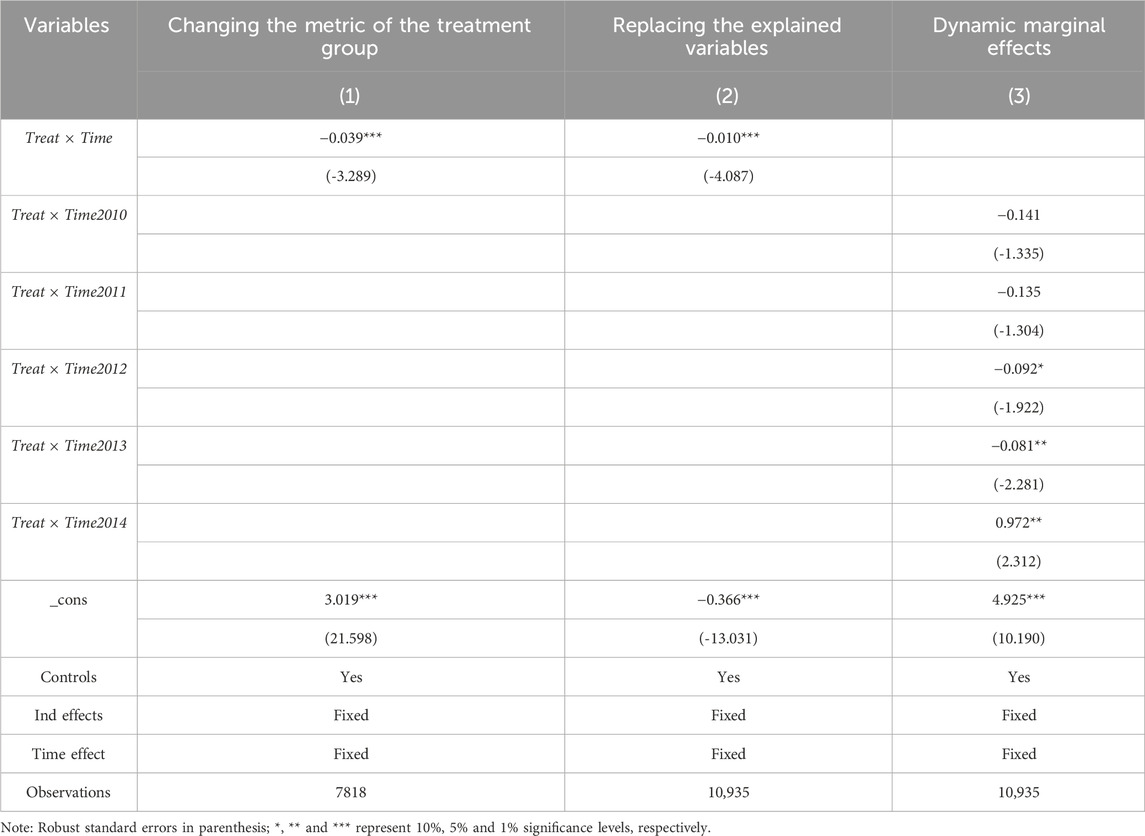
Table 4. Methodological Robustness tests.
4.5.2 Replacing the explained variables
To further assess the robustness of the baseline regression results, this study constructs a composite pollution emission indicator by summing five primary pollutant emissions: industrial wastewater discharge, chemical oxygen demand discharge, smoke and dust discharge, sulfur dioxide discharge, and ammonia nitrogen discharge (Jiang et al., 2021). The natural logarithm of the total is then taken to serve as the newly explained variable. This approach addresses the lack of firm-level carbon emission data and provides a more comprehensive measure of enterprises’ overall environmental performance. Lower values of this composite indicator reflect better environmental outcomes and a higher degree of green transformation. As presented in Column (2) of Table 4, green credit remains significantly negatively associated with the log of total pollutant emissions at 5 percent significance level. The alignment of these results with the baseline regression further reinforces the robustness and reliability of the main findings.
4.5.3 Dynamic marginal effects
To examine the dynamic marginal effects of the GCGP on carbon emission intensity, we incorporated interaction terms between the GCGP treatment variable and year dummy variables spanning from 2010 to 2014. This approach allows for an in-depth depiction of the dynamic evolution of policy effects over time. The results are reported in Column (3) of Table 4. Before 2012, the influence of the GCGP was not significant. However, in 2012, the first year following the implementation of the GCGP, there was a significant decline in carbon emission intensity, aligning with the findings in baseline regression. In the subsequent years, the reductions in carbon intensity remained consistent with the levels observed in 2012. This pattern suggests that China’s GCGP has effectively and persistently contributed to reducing targeted carbon emissions.
4.5.4 Considering the impact of other policies
Controlling for the potential influence of other policies on firms’ carbon emission intensity during the sample period is essential, as such confounding factors may introduce bias into the estimated effects. For example, in June 2017, China approved the establishment of green finance reform pilot zones in eight provinces and municipalities, including Zhejiang, Jiangxi, Guangdong, Guizhou, and Xinjiang. These regional initiatives may have independently affected firms’ carbon emission intensity, thus confounding the impact attributed to the GCGP. To address this concern, we adopt two robustness strategies. First, we exclude post-2017 sample observations. Second, we remove listed companies located within the green finance pilot zones from the sample. We then re-estimate the model using the adjusted samples, with the results reported in Columns (1) and (2) of Table 5. The estimated coefficient on the interaction term (Treat × Time) is −0.025 and remains statistically significant at the 1% level. This suggests that, even after accounting for potential policy interference, green credit continues to exert a significant negative effect on firms’ carbon emission intensity. The consistency of these results with the benchmark regression further affirms the robustness of the main findings.
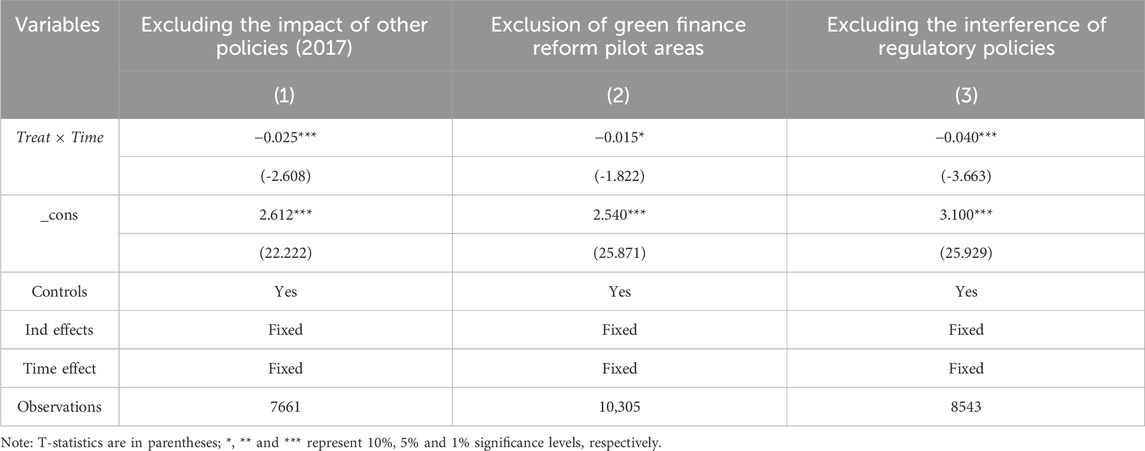
Table 5. Policy-Related Robustness tests.
4.5.5 Excluding the interference of regulatory policies
In 2018, China’s financial regulators introduced a series of new supervisory policies targeting the asset management industry, the banking sector, and the insurance industry. These regulatory measures led financial institutions to further tighten their loan evaluation standards, potentially affecting the credit allocation behavior of commercial banks. To isolate the effect of these regulatory changes from the estimated impact of green credit, we exclude data from the year 2018 from the analysis. The regression results, presented in Column (3) of Table 5, show that after controlling for the influence of financial regulatory supervision, the coefficient on green credit remains negative and statistically significant at the 10% level. The consistency between these findings and the baseline regression results further reinforces the robustness of our core conclusions.
5 Testing the indirect impact of the GCGP on enterprises’ carbon emission intensity
5.1 Testing the macro-level mechanism
5.1.1 Industrial structure optimization
To empirically test the mechanism of industrial structure optimization (H2), this study draws upon existing literature and adopts industrial structure upgrading (ISU) as the key proxy variable (Cheng et al., 2022). Industrial structure optimization refers to improvements in the efficiency, sophistication, and adaptability of industrial transformation. In recent years, the National Development and Reform Commission of China has revised the Industrial Structure Adjustment Catalogue to emphasize the green and intelligent transformation of manufacturing. This includes accelerating the development of emerging strategic sectors such as 5G networks, industrial internet, new materials, new energy vehicles, and biopharmaceuticals, while concurrently promoting energy efficiency and carbon reduction in traditional high-emission industries such as steel, petrochemicals, chemicals, nonferrous metals, and building materials. The goal is to achieve green transformation and facilitate sustainable industrial upgrading, ensuring that high-emission industries transition toward low-carbon, energy-efficient production models.
The estimation results reported in Column (1) of Table 6 show that the coefficient of Treat × Time is −0.018 and statistically significant at the 5% level, while the coefficient for ISU is positive and also statistically significant. These findings suggest that green credit promotes industrial structure optimization by imposing credit constraints, thereby enhancing resource allocation efficiency. Drawing on previous research, industrial structure rationalization plays a crucial role in optimizing the allocation of production factors across different industries (Liu and Liu, 2021). It also fosters the technological advancement of industrial processes, shifting enterprises from outdated, high-emission production methods to modern, energy-efficient technologies. This transition leads to a reduction in enterprises’ carbon emission intensity, confirming that green credit facilitates industrial upgrading by imposing credit constraints.
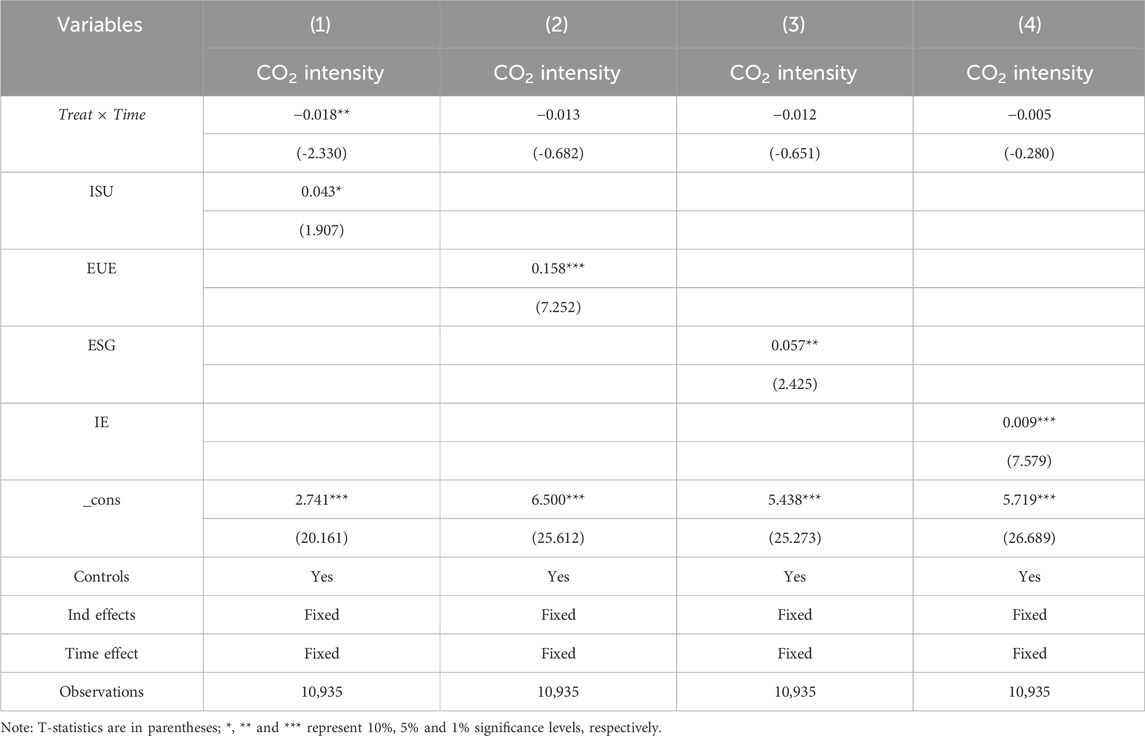
Table 6. Mediating effects of the GCGP on enterprise carbon emission intensity.
5.1.2 Energy utilization efficiency
To empirically test H3, we measure energy utilization efficiency per unit of output (EUE), which serves as a positive indicator. Higher values indicate greater energy efficiency. An advanced industrial structure encourages enterprises to adopt cutting-edge technologies and production processes, thereby improving production efficiency and intensifying resource use (Zhao et al., 2023). This includes the substitution of traditional fossil fuels with clean energy and improvements in overall energy efficiency, which collectively contribute to lower energy consumption and reduced carbon intensity.
The estimation results reported in Column (2) of Table 6 show that the coefficient of interaction term is not statistically significant. However, the coefficient for EUE is 0.158 and statistically significant at the 1% level. These findings suggest that while the direct impact of green credit on energy efficiency is limited, the optimization of energy use, reflected through EUE, plays a critical role in reducing carbon intensity and may function as an indirect transmission mechanism. According to Yang et al. (2023), from the perspective of energy consumption, maintaining the same level of economic output effectively reduces enterprises’ overall energy demand, thereby lowering carbon emissions. As firms transition away from crude, high-emission production methods, they increasingly adopt innovation-driven, high-efficiency production models, enhancing resource utilization and sustainability. Moreover, increasing economic output without raising energy consumption enables enterprises to optimize the use of limited energy resources, thereby reinforcing the role of green credit in promoting sustainable and low-carbon industrial transformation. These findings provide empirical support for H3, confirming that green credit contributes to improved energy efficiency, which in turn reduces carbon intensity and facilitates a more sustainable and efficient industrial upgrading process.
5.2 Testing the micro-level mechanism
5.2.1 Quality of environmental information disclosure
To test the mechanism related to the quality of environmental information disclosure (H4), this study employs ESG performance scores as a proxy variable. Firms with higher ESG performance are better able to reduce agency costs and mitigate information asymmetry between managers and investors, which in turn enhances stock liquidity and shareholder value. The estimation results, reported in Column (3) of Table 6, show that the coefficient of the interaction term (Treat × Time) is not statistically significant. However, the coefficient for ESG is 0.057 and statistically significant at the 5% level. In addition, the Sobel test statistic is significant at the 1% level, indicating a partial mediation effect.
The significant positive coefficient of the ESG score suggests that better ESG performance leads firms to adopt greener production and operational practices, thereby improving energy efficiency and reducing carbon emissions. Simultaneously, the regulatory pressure imposed by green credit policies forces “two-high” enterprises to phase out outdated, high-emission production models and invest in low-carbon technologies, ultimately contributing to a decline in carbon intensity. These findings provide empirical support for H4, confirming that green credit reduces firms’ carbon emission intensity by improving ESG disclosure quality and accelerating the shift toward low-carbon development.
5.2.2 Investment efficiency
To test the mechanism of inefficient investment (H5), we refer to Chen et al. (2011) investment efficiency model. This model measures firms’ inefficient investment degree using residuals, where a new capital investment variable (IE) represents it, as calculated in Equation 4:
Additional control variables include the operating income growth rate (Growth) and a dummy variable (NGE) that equals one if the operating income growth rate is negative, and 0 otherwise. The estimation results, reported in Column (4) of Table 6, show that the coefficient of the interaction term is not statistically significant. However, the coefficient for, IE is 0.009 and statistically significant at the 1% level. Drawing on Zhao et al. (2023), improvements in investment efficiency allow enterprises to reduce inefficient fixed asset investment by promoting technological innovation and optimizing internal management. These improvements lead to lower energy consumption and more efficient energy use, thereby reducing carbon emissions during the production process. The results support H5, indicating that green credit reduces enterprise carbon emission intensity by enhancing investment efficiency and curbing inefficient investment activities.
6 Heterogeneity analysis of the GCGP impact on enterprises’ carbon emission intensity
6.1 Heterogeneity analysis of enterprise types
6.1.1 Internal governance and controls
Differences in internal governance and control mechanisms across enterprises are closely associated with their environmental attitudes and behaviors, which in turn influence the effectiveness of green credit policies (Kudłak, 2019). To empirically investigate this heterogeneity, we utilize the Dibao Internal Governance Control rating data as a proxy for the quality of internal governance. Firms are classified into two groups based on the annual median IGC score: those above the median are considered to exhibit strong internal governance, while those below are regarded as having relatively weak governance structures.
Table 7 reports the estimation results, with Column (1) corresponding to firms with strong internal governance and Column (2) to those with weaker controls. The results reveal that for enterprises with strong internal governance, the coefficient of the interaction term is −0.017 and statistically significant at the 5% level, indicating a more substantial reduction in carbon emission intensity. This suggests that firms with better governance frameworks are more likely to align with green credit requirements, voluntarily adopt low-carbon technologies, and actively contribute to China’s dual carbon goals, thereby reinforcing their public image and organizational legitimacy. By contrast, enterprises with weaker internal governance generally exhibit lower levels of environmental awareness and limited willingness to engage in carbon reduction efforts. Consequently, the effect of green credit in curbing carbon emission intensity among these firms is statistically insignificant. These findings highlight the critical role of internal governance in enhancing firms’ responsiveness to environmental finance policies.
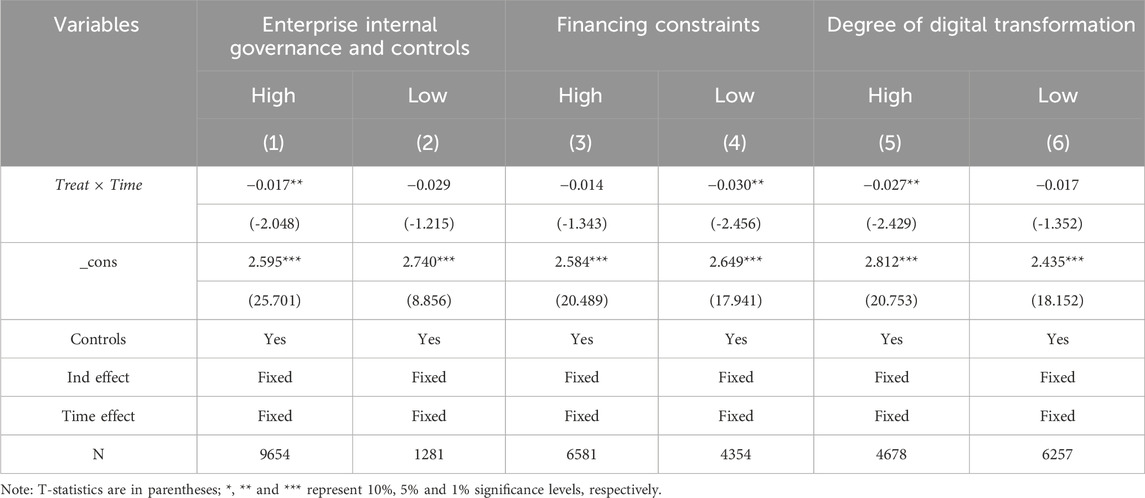
Table 7. Heterogeneity analysis of enterprise types.
6.1.2 Financing constraints
The essence of the GCGP lies in influencing corporate environmental behavior through credit constraints. Accordingly, the level of financing constraints faced by enterprises may significantly shape the effectiveness of green credit in curbing carbon emissions (Wang et al., 2021). To measure the degree of financial constraint, this study adopts the Kaplan–Zingales (KZ) index, which is widely used in the literature as a proxy for firms’ external financing difficulties. Firms are classified annually into two groups based on the median value of the KZ index: those above the median are considered to face low financing constraints, while those below the median are classified as highly constrained.
Table 7 presents the estimation results for firms with varying levels of financing constraints. Column (3) reports the results for firms facing high financing constraints, while Column (4) shows the results for those with low constraints. For the low-constraint group, the coefficient of the interaction term is −0.030 and statistically significant at the 5% level, whereas the effect is statistically insignificant for firms with high financing constraints. Such firms are more capable of reallocating financial resources or accessing alternative financing channels even under restricted bank lending, allowing them to invest in technological innovation and environmental upgrades. In contrast, firms with higher financing constraints face difficulties in securing adequate funds for green transformation, thereby weakening their responsiveness to green credit policies and reducing their incentive to lower carbon emission intensity.
6.1.3 Degree of digital transformation
Digital transformation is an important driver of resource efficiency but often requires substantial upfront investment, which may affect firms’ environmental decision-making. To assess heterogeneity in the impact of green credit, we construct a proxy for digitalization based on financial statement indicators (Yang et al., 2023). Firms are divided annually into high and low digital transformation groups using the median value of this indicator.
Table 7 presents the regression results. Column (5) shows that the coefficient for firms with high digital transformation is −0.027, statistically significant at the 5% level. In contrast, Column (6) reveals no significant effect for firms with low digital development. This suggests that green credit exerts a stronger carbon-reducing effect on digitally advanced firms. These enterprises are typically in better financial condition and more capable of leveraging digital technologies to improve energy efficiency and environmental performance. In contrast, firms with lower digital capacity may lack the financial and technical resources to engage in low-carbon upgrades, and in some cases, may continue to rely on high-emission operations to maintain short-term profitability. As a result, the effectiveness of green credit in such firms is limited.
6.2 Heterogeneity analysis of regional conditions
6.2.1 Environmental regulation level
Regions differ in their environmental priorities and policy responses, which directly influence enterprise behavior and the effectiveness of green credit implementation. To quantify regional environmental regulatory intensity, we construct a proxy variable based on the frequency of keywords such as “environmental supervision and protection” in local government work reports. Regions with values above the annual median are classified as having high regulatory intensity, while those below the median are considered low-regulation regions.
Estimation results are presented in Table 8, with Column (1) showing results for high-regulation regions and Column (2) for low-regulation regions. In regions with stricter environmental regulation, the interaction term has a coefficient of −0.022 and is statistically significant at the 5% level. After controlling for relevant covariates and fixed effects, the findings suggest that the GCGP exerts a stronger carbon-reducing effect in regions with more stringent regulatory environments. This enhanced effect likely stems from the cumulative pressure of tighter enforcement, including harsher penalties for pollution and stronger institutional constraints, which together amplify the impact of green credit policies on firm-level carbon emissions.
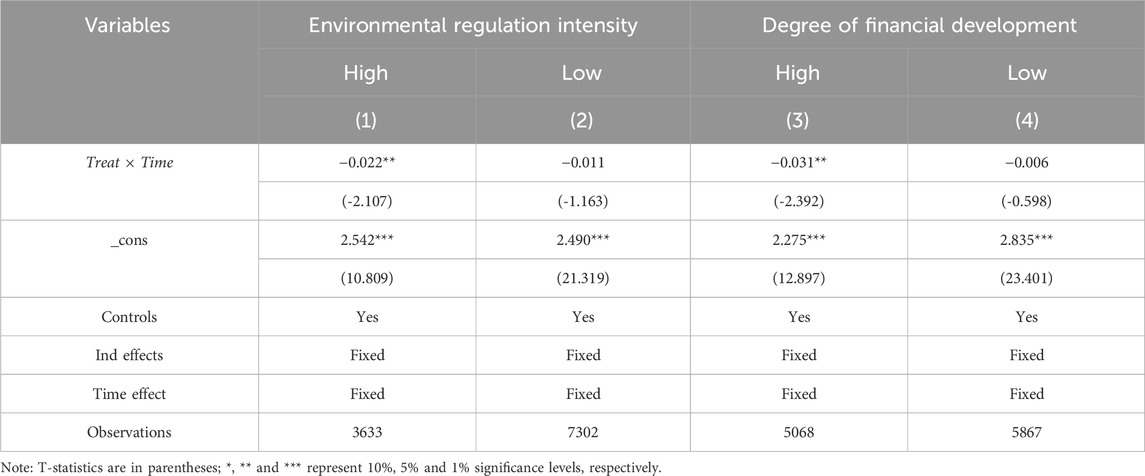
Table 8. Heterogeneity by regional characteristics.
6.2.2 Degree of financial development
The effectiveness of the GCGP varies depending on the level of regional financial development (Zaidi et al., 2019). In this study, we proxy financial development using the ratio of financial sector output to regional GDP, classifying regions above the median as financially developed and those below as underdeveloped.
As shown in Table 8, Column (3) reports results for high-development regions and Column (4) for low-development ones. In the former, the interaction term has a coefficient of −0.031, significant at the 5% level. This implies that in more developed financial environments, firms’ access to financing is more closely linked to environmental performance. High-pollution firms face tighter credit constraints if they fail to improve, increasing their financial risk. Therefore, green credit provides stronger incentives for carbon reduction in financially developed regions. In contrast, in underdeveloped financial regions, its disciplinary effect is weaker, limiting its overall impact on firm-level carbon intensity.
6.2.3 Firm location choice
Due to differences in factor endowments, industrial foundations, and policy support, there are natural disparities in carbon emission intensity across regions, which may lead to heterogeneous effects of the green credit policy. Following the regional classification standard of the National Bureau of Statistics of China, we divide manufacturing enterprises into four regions based on their operating locations: eastern, central, western, and northeastern regions. This allows for a more precise examination of how regional heterogeneity influences the effectiveness of the policy. As shown in Columns (1) to (4) of Table 9, the estimated coefficients for both eastern and central regions are statistically significant, showing negative effects at the 1% and 5% levels respectively. Indicating that the green credit policy exerts a stronger emission reduction effect in these regions. In contrast, the coefficients for the western and northeastern regions are not statistically significant. One possible explanation for this discrepancy is the gradient transfer of traditional manufacturing industries from the east to the west as the eastern region optimizes its industrial structure. Additionally, the relatively underdeveloped infrastructure and limited industrial base in the western region may hinder the efficient allocation of credit resources.
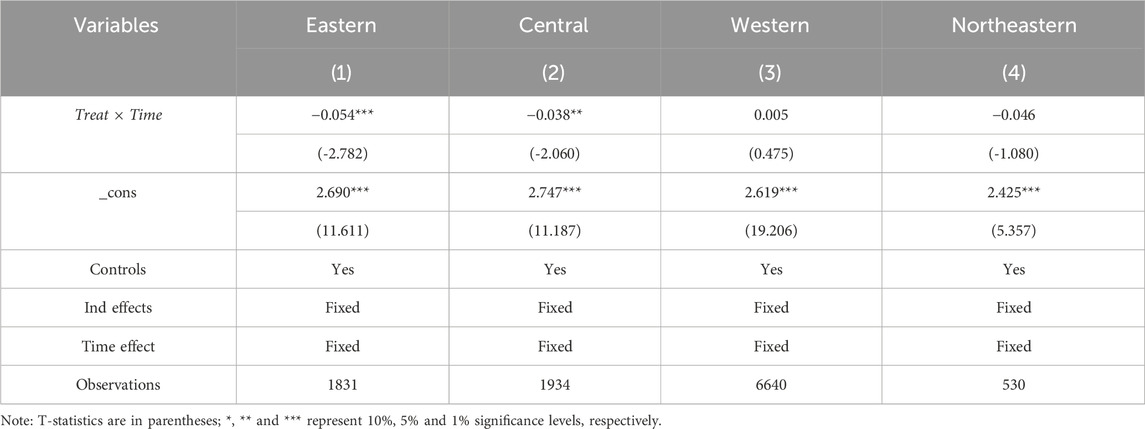
Table 9. Heterogeneity analysis based on firm location.
7 Results and discussion
7.1 Research findings
This study provides robust empirical evidence on the effectiveness of the GCGP in reducing the carbon emission intensity of manufacturing enterprises. Taking the GCGP’s introduction in 2012 as a quasi-natural experiment, we explore a DID approach using panel data from 1,856 listed manufacturing firms spanning the period from 2008 to 2023, analyzing yields three key findings: (1) The GCGP significantly contributes to the low-carbon transformation of the manufacturing sector; (2) Mechanism analysis reveals that green credit promotes carbon emission reduction through both macro and micro-level channels. At the macro level, the GCGP facilitates industrial structure upgrading and improves energy utilization efficiency. At the micro level, it enhances investment efficiency and the quality of environmental information disclosure, thereby strengthening firms’ capacity and incentives to reduce emissions; (3) The effect of green credit is heterogeneous across firms and regions. Enterprises with stronger internal governance, lower financing constraints, and higher degrees of digital transformation exhibit more pronounced carbon-reducing responses. Regionally, the policy is more effective in areas with stricter environmental regulations, more advanced financial systems, and a clear developmental preference for economically leading regions.
7.2 Policy recommendations
To enhance the effectiveness of green credit in promoting carbon emissions reduction and supporting economic green transformation, it is essential to establish a comprehensive policy framework integrating standard-setting, spatial differentiation, market participation, and performance evaluation.
First, green credit standards must integrate environmental, social, and economic indicators to direct financing toward sustainable projects that promote industrial upgrading and carbon reduction. The framework should combine forward-looking targets with historical performance assessments and implement a dynamic evaluation system that considers enterprise profiles, sectoral characteristics, and compliance records. This approach enables more accurate risk-return analysis and encourages enterprises to pursue continuous improvements in environmental performance.
Second, green credit policies should reflect regional disparities in economic development, financial infrastructure, and industrial structure. Establishing pilot zones in financially mature and green-oriented regions can serve as a strategic entry point to explore region-specific credit evaluation standards, monitoring systems, and incentive mechanisms. These zones can act as policy laboratories, accumulating experience and generating best practices that can be gradually expanded to other regions based on performance, replicability, and institutional readiness. Such a spatially adaptive approach can enhance policy precision, ensure a more equitable allocation of green financial resources, and facilitate coordinated regional transitions toward greener development paths.
Finally, beyond government guidance, greater efforts should be made to mobilize market innovation. Financial institutions should be encouraged to actively participate in the development of innovative green credit instruments such as carbon-neutral asset-backed securities (ABS), ESG-linked loans, and sustainability performance-based credit products. These instruments can help diversify financing channels, improve capital efficiency, and enhance the attractiveness of green projects. In parallel, supporting policy tools such as credit guarantees, risk-sharing arrangements, and interest rate subsidies should be provided to reduce investment risks, enhance the willingness of financial institutions to engage in green finance, and facilitate broader participation from private capital in the green transition.
Data availability statement
The original contributions presented in the study are included in the article/supplementary material, further inquiries can be directed to the corresponding author.
Author contributions
ZZ: Data curation, Formal Analysis, Investigation, Project administration, Software, Visualization, Writing – original draft. BL: Conceptualization, Funding acquisition, Methodology, Resources, Writing – original draft. JW: Supervision, Validation, Writing – review and editing.
Funding
The author(s) declare that financial support was received for the research and/or publication of this article. This research was funded by the 75th batch of China Postdoctoral Science Foundation Project, No. 2024M750332; Liaoning Province Social Science Planning Fund Project, No. L24CGL039; Scientific Research Fund of Zhejiang Provincial Education Department, No. Y202455099.
Conflict of interest
The authors declare that the research was conducted in the absence of any commercial or financial relationships that could be construed as a potential conflict of interest.
Generative AI statement
The author(s) declare that no Generative AI was used in the creation of this manuscript.
Publisher’s note
All claims expressed in this article are solely those of the authors and do not necessarily represent those of their affiliated organizations, or those of the publisher, the editors and the reviewers. Any product that may be evaluated in this article, or claim that may be made by its manufacturer, is not guaranteed or endorsed by the publisher.
References
An, S., Li, B., Song, D., and Chen, X. (2021). Green credit financing versus trade credit financing in a supply chain with carbon emission limits. Eur. J. Operational Res. 292, 125–142. doi:10.1016/j.ejor.2020.10.025
Bello, A. K., and Abimbola, O. M. (2010). Does the level of economic growth influence environmental quality in Nigeria: a test of environmental kuznets curve (ekc) hypothesis? Pak. J. Soc. Sci. 7, 325–329. doi:10.3923/pjssci.2010.325.329
Chapple, L., Clarkson, P. M., and Gold, D. L. (2013). The cost of carbon: capital market effects of the proposed emission trading scheme (ETS). Abacus 49, 1–33. doi:10.1111/abac.12006
Chen, H., Liu, C., Xie, F., Zhang, T., and Guan, F. (2019). Green credit and company R&D level: empirical research based on threshold effects. Sustainability 11, 1918. doi:10.3390/su11071918
Chen, S., Sun, Z., Tang, S., and Wu, D. (2011). Government intervention and investment efficiency: evidence from China. J. Corp. Finance 17 (2), 259–271. doi:10.1016/j.jcorpfin.2010.08.004
Cheng, Q., Lai, X., Liu, Y., Yang, Z., and Liu, J. (2022). The influence of green credit on China's industrial structure upgrade: evidence from industrial sector panel data exploration. Environ. Sci. Pollut. Res. 29, 22439–22453. doi:10.1007/s11356-021-17399-1
Ding, L., Zhuang, Y., and Jiang, S. (2022). Green credit and high-quality sustainable development of banks. Environ. Sci. Pollut. Res. 29, 80871–80881. doi:10.1007/s11356-022-21438-w
He, L., Liu, R., Zhong, Z., Wang, D., and Xia, Y. (2019). Can green financial development promote renewable energy investment efficiency? A consideration of bank credit. Renew. Energy 143, 974–984. doi:10.1016/j.renene.2019.05.059
Hu, G., Wang, X., and Wang, Y. (2021). Can the green credit policy stimulate green innovation in heavily polluting enterprises? Evidence from a quasi-natural experiment in China. Energy Econ. 98, 105134. doi:10.1016/j.eneco.2021.105134
Hu, Y., Jiang, H., and Zhong, Z. (2020). Impact of green credit on industrial structure in China: theoretical mechanism and empirical analysis. Environ. Sci. Pollut. Res. 27, 10506–10519. doi:10.1007/s11356-020-07717-4
Jiang, Q., Ma, X., and Wang, Y. (2021). How does the one belt one road initiative affect the green economic growth? Energy Econ. 101, 105429. doi:10.1016/j.eneco.2021.105429
Kudłak, R. (2019). The role of corporate social responsibility in predicting CO2 emission: an institutional approach. Ecol. Econ. 163, 169–176. doi:10.1016/j.ecolecon.2019.04.027
Lee, K.-H., and Min, B. (2015). Green R&D for eco-innovation and its impact on carbon emissions and firm performance. J. Clean. Prod. 108, 534–542. doi:10.1016/j.jclepro.2015.05.114
Li, S., Liu, Q., Lu, L., and Zheng, K. (2022). Green policy and corporate social responsibility: empirical analysis of the Green Credit Guidelines in China. J. Asian Econ. 82, 101531. doi:10.1016/j.asieco.2022.101531
Lin, B. L., and Pan, T. (2023). Financing decision of heavy pollution enterprises under green credit policy: based on the perspective of signal transmission and supply chain transmission. J. Clean. Prod. 412, 137454. doi:10.1016/j.jclepro.2023.137454
Ling, S., Han, G., An, D., Hunter, W. C., and Li, H. (2020). The impact of green credit policy on technological innovation of firms in pollution-intensive industries: evidence from China. Sustainability 12, 4493. doi:10.3390/su12114493
Liu, J.-Y., Xia, Y., Fan, Y., Lin, S.-M., and Wu, J. (2017). Assessment of a green credit policy aimed at energy-intensive industries in China based on a financial CGE model. J. Clean. Prod. 163, 293–302. doi:10.1016/j.jclepro.2015.10.111
Liu, X., and Liu, X. (2021). Can financial development curb carbon emissions? Empirical test based on spatial perspective. Sustainability 13, 11912. doi:10.3390/su132111912
Liu, Z., He, S., Li, W., and Sun, H. (2022). Does green credit reduce carbon emissions? Evidence from China. Environ. Sci. Pollut. Res. 30, 26735–26751. doi:10.1007/s11356-022-24011-7
Nabeeh, N. A., Abdel-Basset, M., and Soliman, G. (2021). A model for evaluating green credit rating and its impact on sustainability performance. J. Clean. Prod. 280, 124299. doi:10.1016/j.jclepro.2020.124299
Sadorsky, P. (2010). The impact of financial development on energy consumption in emerging economies. Energy Policy 38, 2528–2535. doi:10.1016/j.enpol.2009.12.048
Su, C.-W., Umar, M., and Gao, R. (2022). Save the environment, get financing! How China is protecting the environment with green credit policies? J. Environ. Manag. 323, 116178. doi:10.1016/j.jenvman.2022.116178
Thompson, P., and Cowton, C. J. (2004). Bringing the environment into bank lending: implications for environmental reporting. Br. Account. Rev. 36, 197–218. doi:10.1016/j.bar.2003.11.005
Tian, C., Li, X., Xiao, L., and Zhu, B. (2022). Exploring the impact of green credit policy on green transformation of heavy polluting industries. J. Clean. Prod. 335, 130257. doi:10.1016/j.jclepro.2021.130257
Tian, X., Chang, M., Shi, F., and Tanikawa, H. (2014). How does industrial structure change impact carbon dioxide emissions? A comparative analysis focusing on nine provincial regions in China. Environ. Sci. and Policy 37, 243–254. doi:10.1016/j.envsci.2013.10.001
Wang, F., Cai, W., and Elahi, E. (2021). Do green finance and environmental regulation play a crucial role in the reduction of CO2 emissions? An empirical analysis of 126 Chinese cities. Sustainability 13, 13014. doi:10.3390/su132313014
Xu, X., and Li, J. (2020). Asymmetric impacts of the policy and development of green credit on the debt financing cost and maturity of different types of enterprises in China. J. Clean. Prod. 264, 121574. doi:10.1016/j.jclepro.2020.121574
Yang, G., Wang, F., Deng, F., and Xiang, X. (2023). Impact of digital transformation on enterprise carbon intensity: the moderating role of digital information resources. IJERPH 20, 2178. doi:10.3390/ijerph20032178
Yang, Z., Wang, M. C., Chang, T., Wong, W. K., and Li, F. (2022). Which factors determine CO2 emissions in China? Trade openness, financial development, coal consumption, economic growth or urbanization: quantile granger causality test. Energies 15, 2450. doi:10.3390/en15072450
Yao, S., Pan, Y., Sensoy, A., Uddin, G. S., and Cheng, F. (2021). Green credit policy and firm performance: what we learn from China. Energy Econ. 101, 105415. doi:10.1016/j.eneco.2021.105415
Zaidi, S. A. H., Zafar, M. W., Shahbaz, M., and Hou, F. (2019). Dynamic linkages between globalization, financial development and carbon emissions: evidence from Asia Pacific Economic Cooperation countries. J. Clean. Prod. 228, 533–543. doi:10.1016/j.jclepro.2019.04.210
Zhang, B., Yang, Y., and Bi, J. (2011). Tracking the implementation of green credit policy in China: top-down perspective and bottom-up reform. J. Environ. Manag. 92, 1321–1327. doi:10.1016/j.jenvman.2010.12.019
Zhang, K., Li, Y., Qi, Y., and Shao, S. (2021). Can green credit policy improve environmental quality? Evidence from China. J. Environ. Manag. 298, 113445. doi:10.1016/j.jenvman.2021.113445
Zhang, X., Wu, L., Zhang, R., Deng, S., Zhang, Y., Wu, J., et al. (2013). Evaluating the relationships among economic growth, energy consumption, air emissions and air environmental protection investment in China. Renew. Sustain. Energy Rev. 18, 259–270. doi:10.1016/j.rser.2012.10.029
Zhang, Y.-J., Liu, Z., Zhang, H., and Tan, T.-D. (2014). The impact of economic growth, industrial structure and urbanization on carbon emission intensity in China. Nat. Hazards 73, 579–595. doi:10.1007/s11069-014-1091-x
Keywords: green credit policy, enterprise carbon emission intensity, industrial structure upgrading, energy efficiency, difference-in-differences model
Citation: Zhang Z, Li B and Wang J (2025) Can green credit policy promote greener manufacturing? Empirical evidence from enterprises’ carbon emission intensity. Front. Environ. Sci. 13:1572134. doi: 10.3389/fenvs.2025.1572134
Received: 06 February 2025; Accepted: 12 May 2025;
Published: 21 May 2025.
Edited by:
Le Wen, Auckland University of Technology, New ZealandCopyright © 2025 Zhang, Li and Wang. This is an open-access article distributed under the terms of the Creative Commons Attribution License (CC BY). The use, distribution or reproduction in other forums is permitted, provided the original author(s) and the copyright owner(s) are credited and that the original publication in this journal is cited, in accordance with accepted academic practice. No use, distribution or reproduction is permitted which does not comply with these terms.
*Correspondence: Jianxiang Wang, amp4aWFuZzE5OThAZ21haWwuY29t
†These authors have contributed equally to this work