 Yalei Cui
 Wensen Wu
- 1Ma Yinchu School of Economics, Tianjin University, Tianjin, China
- 2State Key Laboratory of Marine Environmental Science, College of the Environment and Ecology, Xiamen University, Xiamen, Fujian, China
The EU’s extension of emissions trading to buildings and road transport via the second Emissions Trading System (ETS2) marks a critical juncture in climate policy. While carbon pricing is essential for achieving ambitious climate goals, its implementation poses significant social equity challenges. This study fills a gap in the literature by utilizing a Multiregional input-output (MRIO) model to analyze the economic impact of EU ETS2-based carbon pricing on single and childless households. Our findings indicate that these households disproportionately bear the carbon costs burden under EU ETS2, with notable regional variations. Households in economically disadvantaged areas or those with less robust social welfare systems experience more severe financial burdens. Crucially, substantially higher carbon expenditure on residential heating fuels imposes critical pressure, forcing single and childless households to reduce spending on other essentials, such as food, to maintain heating. Furthermore, simulations of carbon revenue rebates demonstrate that average per-household rebates and targeted heating fuel subsidies offer greater protection for vulnerable households. This study highlights the necessity for targeted policies to mitigate the economic pressures on single and childless households associated with carbon pricing’s focus on the transport and building sectors.
1 Introduction
The EU’s extension of emissions trading to buildings and road transport through the second Emissions Trading System (ETS2) represents a critical juncture in climate policy. As the cornerstone of the ‘Fit for 55’ package, this policy innovation seeks to address the 40% of EU emissions previously excluded from carbon pricing (Commission, 2023). Carbon pricing, together with other policies such as efficiency standards for buildings, an accelerated deployment of renewable energies and CO2 emission limits for vehicles, will play a major role in emission reductions. However, the transition from theoretical efficiency to practical implementation reveals fundamental tensions between environmental objectives and social equity (Tian et al., 2024a). By placing compliance obligations on fuel suppliers, the upstream design of ETS2 inherently triggers cost pass-through to final consumers. This generates complex distributional consequences that vary across household types, income levels, and geographical regions (Dobrowolski et al., 2025; Haywood and Jakob, 2023).
The global demographic shift toward singleness and childlessness households introduces critical challenges for equitable carbon mitigation. From 2005 to 2020, the proportion of single-person households in the EU-27 increased substantially from 30.0% to 36.0%. This growth established them as the predominant configuration—exceeding couple-based households with dependent children (21.5%, in 2020) (Eurostat, 2025). Carbon pricing is a powerful policy tool for mitigating climate change but also have long been criticized for their regressivity. The impending introduction of ETS2 threatens to exacerbate these inequalities, undermining public support for climate policies (Maestre-Andrés et al., 2019), as seen in France (Tatham and Peters, 2023). The ‘Gilets Jaunes’ protests in France demonstrated that carbon pricing regressivity disproportionately mobilizes low-urban-density households, a structural analog to singles and childless groups in our framework, suggesting ETS2 may face similar equity-driven resistance. Consequently, policymakers must to consider the potential equity impacts of carbon pricing on the distribution among different consumer groups, to reconcile decarbonization goals with the socioeconomic realities of evolving family structures (Pahle, 2023). The rising trend of singles and childlessness highlights the urgency of adapting carbon pricing mechanisms to address the structural disadvantages faced by emerging households, for which research remain underexplored in current literature.
We quantify and compare the impacts of carbon pricing under EU ETS2 on different household types in 28 European countries. This study advances the discourse on carbon pricing equity through three novel dimensions. First, we address a critical oversight in existing literature by centering on single and childless households—demographic groups historically marginalized in distributional analyses dominated by income- or region-based frameworks. While current studies emphasize income-based disparities, none quantitatively assess the disproportionate burden on single and childless households under ETS2’s sector-specific mechanism. Second, leveraging the sectoral specificity of the EU ETS2, we differentiated carbon pricing mechanisms systematically assessing how distinct household types respond to sector-specific price signals in transport and building heating. Using Eurostat household expenditure microdata and input-output models, we simulate sector-specific cost pass-through effects. Third, we conceptualize targeted revenue recycling scenarios—such as green housing subsidies—designed to offset transport and heating costs for single-person households and childless couples. We contrast these with conventional income-based recycling scenarios to evaluate whether such households could be compensated through carbon revenue schemes, thereby bridging climate policy design and evolving demographic realities.
The structure of this paper is as follows: Section 2 reviews the existing literature. Section 3 details the methodology and data. Section 4 presents the analysis of the results. Section 5 shares the conclusions and policy implication for emerging single and childless households toward sustainable lifestyles.
2 Literature review
As a pivotal policy instrument for climate change mitigation, carbon pricing has gained broad-based recognition for its cost-effectiveness and environmental efficiency (Leroutier, 2022; Zhang et al., 2024; Ohlendorf et al., 2021). There is significant concern that regressive carbon pricing policies may exacerbate inequalities in the allocation of carbon revenues, particularly for vulnerable households, challenging the EU’s commitment to a just transition (Ohlendorf et al., 2021; Fried et al., 2018; Feindt et al., 2021). The effectiveness of carbon pricing depends on the tax being equal to the marginal external cost at the point of socially optimal output (Boyce, 2018). However, accurately estimating this cost is extremely difficult, often resulting in carbon pricing that deviates from the path of equity to the detriment of vulnerable households. Widespread national, economic, and geographic differences profoundly influence the distributional effects of carbon pricing on households (Tomás et al., 2020; Steckel et al., 2021; Dorband et al., 2019; Tian et al., 2024b; Tian et al., 2025). Regional heterogeneity within Europe further complicates equity of carbon pricing. Eastern European states relying on coal-based heating, faces higher regressive burdens compared to Nordic nations with access to renewables (Linden et al., 2024). While EU-wide redistribution could mitigate national disparities (Feindt et al., 2021), it risks overlooking subnational nuances.
Distributional effects of carbon pricing remain a central controversy in policy design and public acceptance (Beck et al., 2015; Bureau, 2011; Eisner et al., 2021; Fremstad and Paul, 2019). When focusing on household micro factors, existing studies have mainly concerned heterogeneity in carbon pricing burdens by household income (Linden et al., 2024; Malerba et al., 2024; Yu et al., 2025), size (Haywood and Jakob, 2023; Verleyen et al., 2024), and age (Zha et al., 2022; Wang et al., 2019), ignoring inequalities arising from household composition. Specifically, single and childless households, despite representing 43% of EU households, are absent in major studies assessing carbon pricing burdens. Multiple studies confirm that carbon taxes disproportionately burden low-income households, who spend a higher share of their income on energy-intensive essentials like heating, transport, and basic goods (Dorband et al., 2019; Liu et al., 2022; Müller et al., 2024). Larger households benefit from scale economies, reducing per capita energy costs through shared heating and appliances (Ivanova et al., 2018). While elderly households face amplified risks due to high heating needs and fixed incomes (Zhang et al., 2025). However, our study emphasizes the influence of carbon pricing on various household types. Single-person and single-parent households may face unique energy poverty risks under the EU ETS2. Single-person households, particularly elderly individuals living alone, suffer greater income erosion from rising energy costs due to high retrofit expenses and per capita spending inefficiencies (Pais-Magalhães et al., 2022). Single-parent households face the challenges of low income and high childcare costs (Marron and Toder, 2014; Ohlendorf et al., 2021). Without additional support, the marginal benefit of carbon revenue rebates for these households may be lower than for others (Sørensen, 1994).
Carbon revenue recycling programs can mitigate the negative impacts of carbon pricing on vulnerable households, usually through lump-sum rebates or transfers payment (Bourgeois et al., 2021; Sajeewani et al., 2015). The effectiveness varies significantly across target, methods and economies. Most studies agree that carbon revenue recycling schemes need to be targeted on vulnerable households (Fremstad et al., 2022; Ravigne et al., 2022). Existing revenue recycling designs prioritize income or age vulnerabilities (Vandyck et al., 2021; Ver et al., 2009; Zhang et al., 2018; Tian et al., 2023), ignoring the fixed-cost burden of single and childless households. The composition of basic social groups is changing with the trend toward singles and childlessness (Brini, 2020; Helm et al., 2021; Hogendoorn et al., 2023; Sobotka, 2017). Evidence gaps in the discussion of this phenomenon have led to an inadequate understanding of carbon pricing. In this study, we categorize all households into five types based on whether the adult is single and whether the household has dependent children. Multi-Regional Input-Output (MRIO) model can capture sectoral and inter-product linkages by linking household consumption data to industry data. By integrating household typology with MRIO modeling, this work pioneers the quantification of ETS2’s sectoral burden distribution (transport and heating) across five household types, a dimension absent in prior equity analyses.
3 Method and data
3.1 Environmentally extended Multiregional input-output (MRIO) analysis
Households face two main economic impacts under carbon pricing: direct impacts from rising energy costs, and indirect impacts from higher prices for goods and services, resulting from embodied carbon emissions within production and transportation networks (Tian et al., 2023; Zhang et al., 2017). The environmentally extended MRIO model has been widely used to estimate the distributional impacts of carbon tax. We connected the household expenditure survey data of various household types with the global MRIO database. The detailed product-level information and the ability to explicitly consider different production technologies in various countries make EXIOBASE 3.7 the most suitable database for our study (Stadler et al., 2018; Cabernard et al., 2019). More information about MRIO model and EXIOBASE 3.7 is in the Supplementary Materials.
To calculate the indirect carbon expenditure across different household types, we adopt the classic Leontief demand model within the Multi - Regional Input - Output (MRIO) framework to allocate the environmental impacts stemming from households. Mathematically (see Equation 1):
Here, the intermediate input coefficient matrix is defined as
Next, we estimate the expenditure increase driven by carbon pricing based on the MRIO model. The total carbon expenditure of sector s of household i in country n (denoted as
We obtain total indirect expenditure increase of consumption through linking the supply industries to the changes in the final consumption of group i, which can be expressed by Equation 3:
where
The direct expenditure increases of carbon pricing shock on household i can be calculated by multiplying the household direct emissions of group i and the carbon price p, which be expressed as Equation 4:
Here,
The share of carbon expenditure (
3.2 Harmonization of HBS data and EXIOBASE
The expenditure data from the Household Budget Survey (HBS) employs a product classification different from that of the MRIO tables in EXIOBASE 3.7. Hence, it is necessary to harmonize the HBS data and EXIOBASE using the RAS method (Ivanova et al., 2017). The steps are as follows.
First, we match the HBS expenditure items with EXIOBASE MRIO table products. For more detailed information on the correspondence between consumption items and product classifications, see Supplementary Table S2. Second, let
This procedure is repeated 500 time;
3.3 Design of carbon price scenarios
ETS2 price expectations in the literature vary greatly. According to EU ETS2, if the price of allowances exceeds €45/tCO2 (in 2020 prices, equivalent to €42/tCO2 in 2015 prices), the Market Stability Reserve (MSR) may release additional allowances to mitigate excessive price increases. Consequently, we adopt €42/tCO2 as the standard carbon price applied to all products excluding transportation and building fuels in our model.
For these specific products (fuels of transportation and buildings, details shown in Supplementary Table S3 of the supplementary material), distinct carbon prices are applied. The EU Commission projects that achieving substantial market incentives for building retrofits and low-emission transport by 2030 necessitates an ETS2 carbon price of €48–€80/tCO2 (2015 prices). Supporting this range, Günther et al. (2024) projected an ETS2 price of €71/tCO2 (2022 prices, equivalent to €60/tCO2 in 2015 prices) under their “Strong Efficiency Policies” scenario. Based on this synthesis of evidence, we set €60/tCO2 (2015 prices) as the baseline carbon price for transportation and building fuels. For sensitivity analysis, we use the upper bound of €80/tCO2, derived from policy scenarios relying more heavily on carbon pricing (MIX-CP). This allows us to examine how stronger carbon price signals in these sectors affect burdens across different household types (design of carbon prices summarized in Table 1).
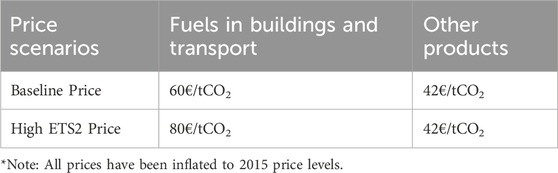
Table 1. Design of carbon price scenarios.
3.4 Carbon revenue recycling scenarios
Carbon revenue recycling programs can help reduce inequality and protect vulnerable populations (Fremstad and Paul, 2019; Budolfson et al., 2021). We developed four carbon revenue recycling schemes to assess their effectiveness in alleviating the economic burdens imposed by carbon pricing. The first scheme is the No Rebate, in which all households only incur carbon expenditures under a carbon pricing policy, leading to a negative net impact, referred to as the household carbon burden. The second scheme is the Transport Rebate, which aims to reducing the household carbon payment burden of transportation fuels by providing tax rebates based on the proportion of transport carbon expenditure used by households. The third scheme is the Building Rebate, which aims to reducing the household carbon payment burden of housing fuels by providing tax rebates based on the proportion of housing carbon expenditure used by households. The forth scheme is the Average Per-Household Rebate, which allocates carbon revenues equally to each household. We analyzed the net impact of carbon pricing on various household types. Net impact of group
where
4 Results
4.1 Total expenditure increase from carbon pricing
EU countries are implementing aggressive carbon pricing to mitigate climate change, but it also imposes an additional financial burden on households. Based on findings of these studies, we measure the total cost of carbon pricing for households in 28 European countries in 2015, which would amount to €195 billion (€209 billion), approximately 2.70% (2.88%) of households’ final consumption. Single and childless households (single person households, single parent households with children, and couple households without children) bear a burden as high as €110 billion (€118 billion), representing 56.5% of the total carbon pricing cost. Figure 1 illustrates the total cost of carbon pricing expenditures, expenditures share of single and single-parent households and income status in 28 countries by region.1
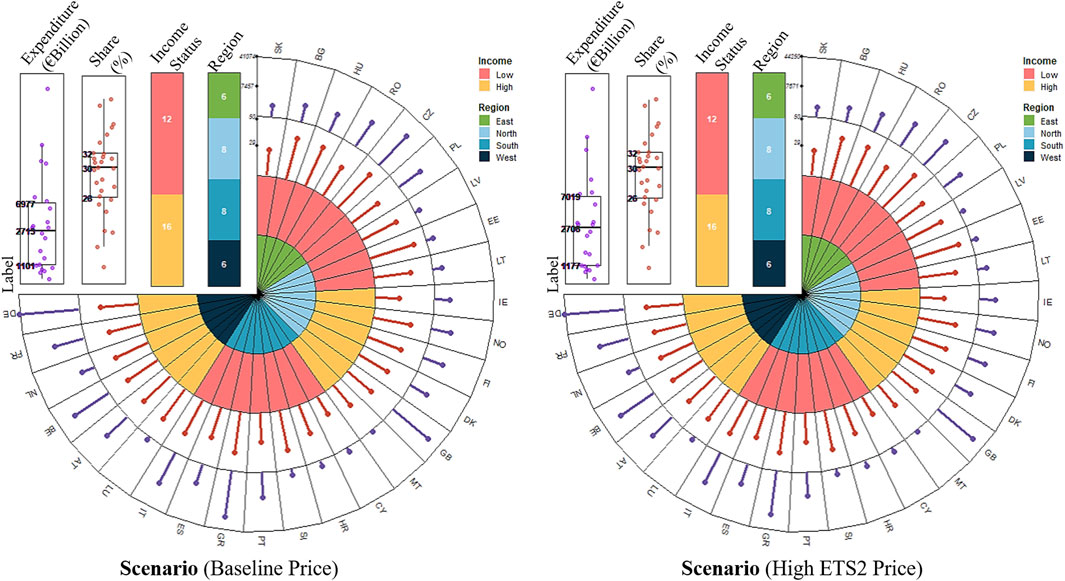
Figure 1. Increase in total expenditure caused by carbon pricing, expenditures share of single and single-parent households and income status in European countries. The income status compares the country’s household income with the average household income in European. We divided the European countries into four regions, countries in the four regions are ranked from lowest to highest in terms of total expenditure increase in this figure. The abbreviation of each country is shown in Supplementary Table S4.
Households in Western Europe countries bear highest total carbon pricing costs, total achieving €75.8 billion. Well-developed economies and social transfer system encourage more single and childless households (Beaujouan and Toulemon, 2021), and these households bear the majority of the carbon expenditure. For example, in scenario with baseline carbon price, couples without children in Germany spend (€12.9 billion) even more than couple households of with children (€12.3 billion). This gap becomes larger in the scenario with higher price on buildings and transportation. Considering the popular trend of single and childless households in Western Europe who are replacing traditional households and account for a significant portion of society (Pesando, 2019), they could be the most affected groups with the highest share of carbon payments (55.4%). Similar phenomenon that is also prevalent in Northern Europe. However, there are some different in Southern Europe, especially considering the influence of religion on traditional households in Southern Europe (Vignoli and Salvini, 2014) compared to Western and Northern Europe. The proportion of single and childless households in Southern Europe is relatively small. Thus, the highest carbon costs are for couples with children (€20.4 billion). Yet new family trend still leads single and childless households to bear more carbon payments. Northern Europe, achieving €13.6 billion, is the second largest payment among four regions. Moreover, singleness trend also result in a rapid increase in the scale of vulnerable households in Southern Europe (Toulemon, 2016), leading them bearing the largest burden in European, achieving 11.4% of the total cost (€4.8 billion).
The indicator of average carbon pricing cost could also be informative. Single-person and single-parent households in Northern Europe take €640.9 and €1013.1 per household carbon pricing cost respectively, the highest average cost among the four European regions when facing higher carbon pricing in High ETS2 price scenario. These two households are often deemed as the vulnerable groups and easily affected by carbon pricing. One noteworthy finding is that if the price of Baseline price scenario increases to High ETS2 price scenario, the average carbon pricing cost for these two households in Eastern Europe quickly approaches the cost in Northern Europe (single household, €640.5; single-parent household, €940.1). The lower disposable income and social subsidies for Eastern Europe households make them hard to absorb the impact by higher carbon price. Apart from that, there are some similarities between two regions. In the face of more aggressive carbon pricing, the carbon cost for vulnerable households in many countries in two regions is gradually approaching even surpassing the cost for traditional households, especially in the Czech Republic, Poland, Lithuania and Estonia. For example, in the Czech Republic, vulnerable households spend €271.3 million more on carbon pricing costs than households with dependent children. Therefore, in carbon pricing policy, the necessity of considering the trend towards singleness and childless are becoming inevitable.
4.2 Household burden rate from carbon pricing
Carbon payment burden rate could be a more valuable indicator to evaluate the policy impact on different households. Figure 2 illustrates the variation in household carbon pricing burden rates across different household types in the 28 European countries. Specifically, vulnerable households (single, 2.79%; single-parent, 2.90%) have a higher average carbon payment burden rate than traditional households (2.65%) in scenario with baseline carbon price. If setting scenario with higher carbon pricing on building and transportation sector, the carbon burden for single (3.00%) and single-parent (3.11%) increases rapidly, a lager gap with and traditional households (2.83%). Specific consumption structure related with household attributes creates a potential impact on carbon burden rates, for example, single person households are less efficient at heating (Liu et al., 2023). Vulnerable households may be inequal in carbon pricing expenditures.
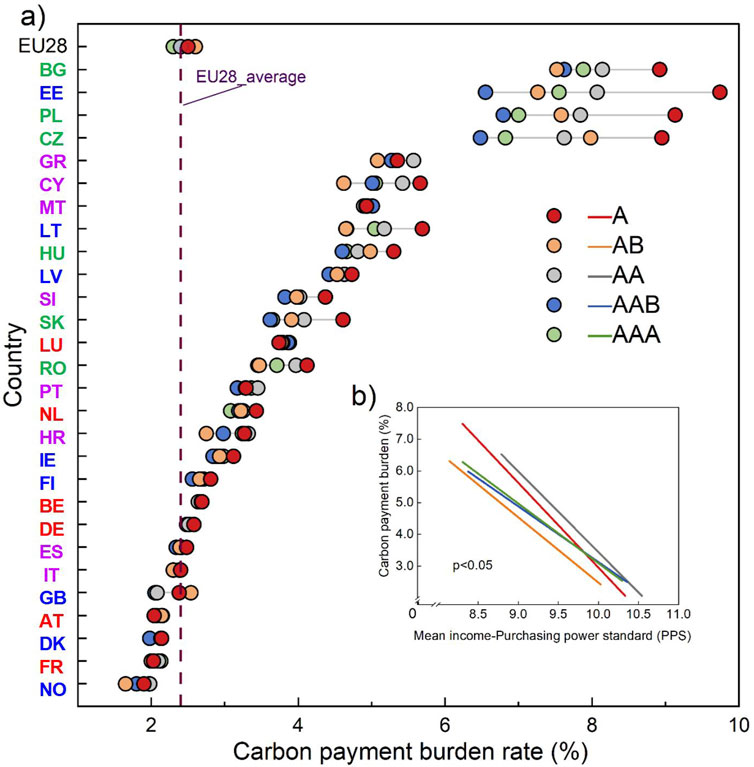
Figure 2. Impacts of baseline price scenarios on different household groups in European countries. (a) Shows the carbon payment rate across Europe. Countries in the four regions are ranked from lowest to highest in terms of average household carbon payment burden rate. The horizontal axis represents countries, with different regions distinguished by different colored fonts: red for Western Europe, green for Eastern Europe, blue for Northern Europe, and purple for Southern Europe. (b) Shows the correlation between logs of mean income and the carbon payment burden rate. The slopes provide the sensitivity of income to carbon burden rates for different types of households at the 0.05 level of significance.
From a general overview in baseline scenario, the households’ carbon burden is highest in Eastern Europe (5.60%), followed by Southern Europe (2.39%) and lower in Western Europe (2.18%) and Northern Europe (2.04%). The economy situation, energy policy and social welfare system, may influence the household burden rate (Mi et al., 2020), leading to regional and household differences. Western Europe exhibits a relatively balanced low carbon payment burden rate across different household, with only 0.09% gap between single and traditional household. This can be attributed to the higher average incomes and clean technologies, as well as the early development of singles and childlessness trends, accompanied by better welfare systems for single and childless households. Luxembourg stands out with the highest carbon burden rate for single and childless households in Western Europe at 3.77%. This is attributed to its extreme reliance on imports, which embed high carbon intensities due to origin-specific production profiles, particularly in energy sectors (Oberhausen Krippler, 2023). In most Northern Europe countries, single and childless households are inevitably bearing higher carbon burden rate than traditional households. Moreover, considering the vulnerable groups, single and single-parent households are still the households with highest burden rate, achieving 2.22% and 2.33%. The three Baltic countries - Estonia, Latvia, and Lithuania - face similarly highest carbon burden rates for single households, at 7.64%, 5.22%, and 4.64% respectively (Aidukaite et al., 2022; Hsu, 2023). Moreover, single and childless households in these three countries are facing significant disproportionate burden, such as the 3.19% huge gap between single and traditional households burden rate in Estonia. However, Nordic countries such as Norway exhibit relatively low burden (1.86%) due to their higher incomes (€41528) and cleaner energy structures with over 50% renewable output and consumption (Supplementary Table S8).
In Southern European, households in Spain and Italy showing relatively low burdens of 2.39% and 2.34% respectively. While households in Greece experiences a higher carbon burden, achieving 5.31% due to the impact of the national debt crisis. Similar to Greece, Cyprus has an elevated carbon burden (5.15%) combined with high unemployment rate at 15% (Oliveras et al., 2020). Malta, despite lower unemployment, is also facing high carbon burden at 5.15% due to its fossil fuel-dependent energy system and only around 7% penetration of clean energy. From the perspective of burden by different households, single households have a disproportionately highest carbon burden in all Southern European countries. In Eastern European, households are more vulnerable in scenario with greatly burden increase by €80 price on buildings and transportation, especially single and childless households in Bulgaria, Czech and Poland who are taking over 9% carbon payment burden rate. Results also show that Eastern European households bear the highest carbon payment burden at 6.18% due to the high average unemployment rate (6.43%) and low wages (€4,000–€11,000) compare to other regions, despite having the lowest per capita carbon footprint. This highlights the consumption challenges by aggressive climate action faced by single and childless households in Eastern Europe. Meanwhile, country disparities are difficult to reconcile, but a comprehensive understanding of household carbon burdens under single and childless trends can still contribute to future mitigation and revenue rebate policy.
Figure 2b reports a significant negative correlation between household carbon burden rates and household income at the 0.05 level of significance. Carbon expenditure accounts for only a small proportion of expenses in wealthy households, but it is a significant burden for households in struggling with poverty. The slopes elucidate the sensitivity of carbon burden rates to income across different household types. Notably, the line of single-person households exhibits markedly higher slopes, suggesting their greater sensitivity of carbon burden rates to income compared to other household compositions (Liu and Zhang, 2022; Piekut, 2020). However, the carbon burden rate for single-parent households is largely insensitive to marginal income growth, meaning that the financial situation would not be greatly improved until their income climbed dramatically (Sørensen, 1994).
Current studies have widely recognized the regressivity of carbon/energy tax, and however, detailed income data distribution among and within household types preventing further investigation. Although lacking detailed HBS-published dataset, we added Supplementary Tables S10–S12 to the Supplementary Material to describe the distribution of different households’ income and at-risk-of-poverty rate reported by EU statistics on income and living conditions (EU-SILC) survey. As reported, both single-parent and single-person households are the types of households at highest at-risk-of-poverty rate, even after social transfers. Moreover, single parents more easily fall into poverty even compared with other households with one or more children. A worsening financial situation among vulnerable make them hard to bear more additional carbon cost. And such extreme poverty may weaken the effectiveness of marginal carbon revenue rebate. Exploring carbon burden differences within the household by each country can be further investigated in the future as more detailed income data becomes accessible.
4.3 Consumption structure of carbon-induced expenditures
As Figure 3 reported, in two scenarios, the distribution of carbon expenditures differs across household types, but exhibits similarity. For all households, residential fuels, miscellaneous goods, food, and transportation account for the majority of carbon expenditure. Single and single-parent devote a larger proportion of their additional expenditure to fuel and less transportation compared to traditional households (Lin et al., 2021). If the carbon pricing on building and transportation continue to climb, single households in all regions would spend over 50% payments on fuel consumption. This inefficiency in heating and less transporting may be due to household attributes (Behsudi, 2021). The consumption patterns related with household attributes would lead higher carbon burden to vulnerable households.

Figure 3. Consumption structure of carbon expenditures under ETS2 carbon price. (a) Represents the consumption structure of five types on household carbon expenditures in four European regions under the Baseline price scenario. The numbers on the circle refer to the share by consumption category. (b) Represents the gap in the share of carbon expenditure on basic living items in the High ETS2 price scenario.
Regional heterogeneity, such as energy structure, geographical location or households’ income would affect households’ consumption items and carbon expenditure. The long cold periods at high latitudes in Nordic countries lead vulnerable households to pay more for housing energy (Streimikiene et al., 2021), especially the single parent spending highest share on fuels among all households with the need for children to maintain a consistently comfortable temperature. However, benefit from more cleaner energy structure and developed social transfer system, most households in Northern Europe still can hold a relative balanced carbon expenditure structure rather than centre on one item, same as Western European households. Households in Western Europe also exhibits balance structure with similar advantages in social welfare systems. The difference is mainly in the higher proportion of food, miscellaneous goods and services items. Higher incomes increase their willingness to consume a variety of goods, leading to higher spending on miscellaneous goods and services in Western Europe. Additionally, due to the high demand for carbon-intensive food products such as red meat, oilseed crops (e.g., palm oil), and stimulant foods (e.g., coffee) (Li, 2023), additional carbon spending on food is significantly higher in Western Europe.
If regional social protection for households is insufficient with lower income, aggressive carbon pricing would compel vulnerable households to centre on fuel items and crowd out others items, even the basic items like foods and miscellaneous goods. Compare the item share change under two scenarios, the situation is worse in Eastern European. For Eastern European, over 70% of the additional expenditure of single and childless households are already from housing fuels. Particularly, single households have the highest percentage for fuel about 76%. Although additional carbon costs in fuel by households in Eastern European countries change less with 2.2%–2.6% increase, but the consumption shares of food, miscellaneous goods and services decrease fastest in four regions at total 1.5% decrease. This indicates the vulnerable households attempts to save moneys from basic items to keep their building warming. According to Supplementary Table S7 of the supplementary material, the number of heating and cooling days in the Eastern European countries exceeds that of the Southern and Western European countries and is only second to that of the Nordic countries. Due to consumption rigidity, single-person and single-parent households in Eastern Europe are facing increasing expenditure by carbon pricing, more than half of additional expenditure from household fuel item. This may increase their carbon burden and further entrench rigid consumption patterns. Although the situation is also not optimistic for other household types, the situation of single-person households and single-parent households are getting more concerns about their burden related with household attributes. And constrained by low incomes, private car ownership rate is very low among Eastern European households, resulting in less change and lowest additional carbon costs for transportation. In contrast, households in Southern Europe exhibit the larger consumption share and share change of transport-related carbon costs in Europe, which aligns with the inverted U-shaped relationship between income levels and transport expenditure shares (Vandyck et al., 2023). Yet facing higher carbon price in building and transportation, their consumption shares of basic items still decrease fast about 1.15%–1.3%, to satisfy the need of energy, similar with Eastern European.
4.4 Impact of carbon revenue rebate scenarios
Based on EU ETS2, four carbon revenue rebate scenarios were designed to assess their effectiveness in reducing the economic burden associated with carbon pricing, and the results are shown in Figure 4.
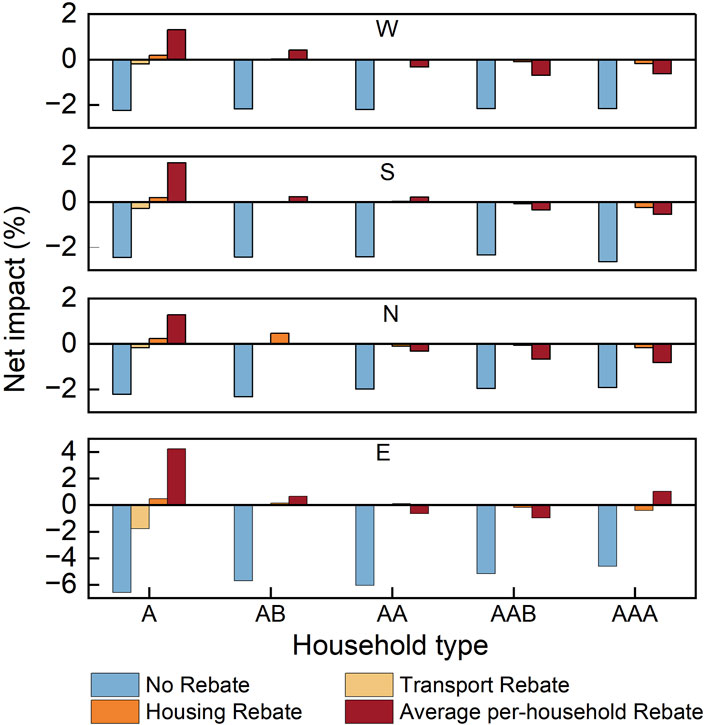
Figure 4. Net impacts of carbon revenues rebate scenarios on different household groups in European regions under baseline carbon price. Notably, the No rebate scenario represents the burden of carbon expenditures under a carbon pricing policy for the types of households discussed in Section 3.2.
Under No carbon rebate scenario, all households only incur carbon expenditures under a carbon pricing policy, leading to a negative net impact, referred to as the household carbon burden. Households in Eastern Europe face the highest carbon burden, with single and childless households experiencing greater burdens than traditional households. The results show that single households in all four regions bear a negative net impact in the transportation rebate scenario, especially in Eastern Europe, where the net impact is as high as −1.77%. Since single households have a lower share of carbon expenditures on transportation than other households, their incomes in the scenarios focusing on subsidizing the carbon burden of transportation have difficulty in hedging against the burden imposed by other consumption, and thus they become the net bearers of carbon pricing. The same is true for single parent households. A slight difference is the small positive net effect of single parent households in Southern Europe. For traditional households (group AAB and group AAA), the transportation rebate scenario significantly eases their carbon burden, showing a significant positive impact. In contrast to the transportation return scenario, single and lone parent households receive a positive net impact in the residential return scenario, while traditional households become the main contributors to carbon pricing. It is worth noting, however, that the absolute value of the net impact for each type of household shows a relatively balanced picture, ranging from −0.42% (Eastern Europe, group AAA) to 0.47% (Eastern Europe, group A). Finally, the Average per-household return demonstrates the advantage of targeted compensation for vulnerable households (especially single parent households vs. single person households). Single households significantly reverse their high carbon payment burden in the household average scenario and become the absolute beneficiaries of the carbon pricing policy. Peaking at 6.60% in Eastern Europe, while those in Northern Europe receive the smallest benefit at 2.22%.
The findings clearly demonstrate that single and single-parent households experience significant financial challenges under carbon pricing. The introduction of rebate strategies, particularly those focused on subsidizing by average household carbon expenditure and housing fuel consumption, appears promising in alleviating financial burdens on these groups. This analytical framework provides an empirical basis for updating the EU Social Climate Fund (SCF) Operational Guidelines.
5 Conclusion and discussion
5.1 Conclusion
While carbon pricing remains essential for climate mitigation, our analysis of the EU ETS2-based carbon pricing confirms it imposes disproportionately higher costs on single and childless households—particularly across Southern and Eastern Europe. These households allocate a substantial share of income to carbon-intensive essentials like heating, transport, and food, limiting their ability to adapt consumption patterns under carbon pricing regimes. Such consumption rigidity raises critical equity concerns, necessitating policy interventions that reconcile environmental goals with social protection. Targeted rebate scheme offers a solution. For instance, average per-household rebates and direct subsidy on housing fuels can redistribute carbon revenue to offset the regressive impacts of carbon pricing. Such measures operationalize core equity principles by balancing horizontal equity (equal treatment of equals) with vertical equity (redistributive support for vulnerable groups) (Pizer and Pizer, 2019). Our updated scenarios demonstrate that carbon pricing is vital for climate goals but it must incorporate protective measures to ensure a fair distribution of costs across society.
5.2 Discussion
The rise in single and lone parent households, driven by aging populations and single life style, has created a diverse group facing significant challenges under carbon pricing policies. These households (e.g., elderly singles, single mothers, young job seekers) share a common vulnerability: high essential expenditure shares on heating/transportation with limited consumption flexibility. For older singles and single parents (Distefano and D’Alessandro, 2023), carbon pricing exacerbates financial strain, increasing energy poverty risks (Tian et al., 2023). Moreover, their typically lower-income status further amplifies vulnerability. For example, elderly singles often take informal jobs to top up pensions, particularly vulnerable to housing or job market frictions. And lone mothers substantially outnumber lone fathers in most countries (Supplementary Table S6), bearing disproportionate carbon burdens while raising children alone (Heintz-Martin and Langmeyer, 2020; Sunikka-Blank and Galvin, 2021; Osorio et al., 2024). These pressures are most severe in Southern and Eastern Europe, where fossil fuel dependency exceeds EU averages.
Targeted revenue recycling is essential to address these inequities. The ETS2 is projected to allocate €65 billion (2026–2032) to the Social Climate Fund (SCF). The SCF supports Member States in mitigating the social impacts of carbon pricing by providing direct financial assistance (Monitor, 2019), such as income support or rebates by per household, and expanding social transfer to reduce temporary rising costs for vulnerable households (Bednar and Reames, 2020). For single and lone parent households, these measures can alleviate the burden of increased costs for necessities, enabling them to maintain essential living standards without sacrificing other needs.
Complementary policies, such as targeted social transfers for single and single parents (Trinh, 2021; Ghafouri, 2023), phasing out fossil fuel subsidies while redirecting funds to support low-carbon alternatives, and establishing occupational training system can further enhance the effectiveness of carbon pricing. Investments in energy efficiency, such as building renovations and electrified transport, can reduce the poverty of single and lone parent households in transport and housing fuels, aligning environmental and social objectives (Bednar and Reames, 2020; Shang, 2023). By combining these strategies, policymakers can ensure that carbon pricing not only drives decarbonization but also advanced social equity.
This study highlights the disproportionate burden of carbon pricing based on ETS2 among single and lone parent households, risking energy poverty. Developing countries also experiencing demographic shifts toward single and childless households, such as China, India, and Indonesia, can leverage this methodology to quantify carbon pricing impacts. Our study focuses on different household types and, due to data limitations; we use household expenditures as a proxy for household income to measure the carbon payment burden rate, albeit with some margin of error. However, it has been demonstrated that expenditures reflect a combination of income and wealth (Atkinson and Bourguignon, 2014), thus this approximation can still indicate the carbon burden of different households. Additionally, the MRIO model’s linearity overstates direct effects, missing dynamic economic shifts. Static modeling of MRIO cannot reflect dynamic emission reductions, but it quantifies the maximum allocation burden at decarbonization stagnation. In addition, our ETS2 price scenarios depend on current projections; accelerated climate risks could escalate prices beyond these forecasts, intensifying burdens on vulnerable groups.
Data availability statement
The original contributions presented in the study are included in the article/Supplementary Material, further inquiries can be directed to the corresponding author.
Author contributions
YC: Conceptualization, Methodology, Visualization, Writing – original draft, Writing – review and editing. WW: Data curation, Investigation, Writing – original draft, Writing – review and editing.
Funding
The author(s) declare that no financial support was received for the research and/or publication of this article.
Conflict of interest
The authors declare that the research was conducted in the absence of any commercial or financial relationships that could be construed as a potential conflict of interest.
Generative AI statement
The author(s) declare that no Generative AI was used in the creation of this manuscript.
Any alternative text (alt text) provided alongside figures in this article has been generated by Frontiers with the support of artificial intelligence and reasonable efforts have been made to ensure accuracy, including review by the authors wherever possible. If you identify any issues, please contact us.
Publisher’s note
All claims expressed in this article are solely those of the authors and do not necessarily represent those of their affiliated organizations, or those of the publisher, the editors and the reviewers. Any product that may be evaluated in this article, or claim that may be made by its manufacturer, is not guaranteed or endorsed by the publisher.
Supplementary material
The Supplementary Material for this article can be found online at: https://www.frontiersin.org/articles/10.3389/fenvs.2025.1572246/full#supplementary-material
Footnotes
1Four European regions in this paper are: the Northern European group includes Finland, Denmark, Ireland, United Kingdom, Estonia, Latvia, Lithuania, and Norway; the Southern European group is composed of Italy, Spain, Greece, Croatia, Slovenia, and Portugal; the Western Europe includes France, Belgium, Netherlands, Austria, Germany, and Luxembourg; the Eastern European group includes Poland, Czech Republic, Hungary, Slovakia, Bulgaria, and Romania.
References
Aidukaite, J., Hort, S., and Ainsaar, M. (2022). Current trends in social welfare policies toward the older people in the Baltic and Nordic countries: an explorative study. J. Baltic Stud. 53, 147–167. doi:10.1080/01629778.2021.1998166
Beaujouan, É., and Toulemon, L. (2021). European countries with delayed childbearing are not those with lower fertility. Genus 77, 2. doi:10.1186/s41118-020-00108-0
Beck, M., Rivers, N., Wigle, R., and Yonezawa, H. (2015). Carbon tax and revenue recycling: impacts on households in British Columbia. Resour. Energy Econ. 41, 40–69. doi:10.1016/j.reseneeco.2015.04.005
Bednar, D. J., and Reames, T. G. (2020). Recognition of and response to energy poverty in the United States. Nat. Energy 5, 432–439. doi:10.1038/s41560-020-0582-0
Bourgeois, C., Giraudet, L.-G., and Quirion, P. (2021). Lump-sum vs. energy-efficiency subsidy recycling of carbon tax revenue in the residential sector: a French assessment. Ecol. Econ. 184, 107006. doi:10.1016/j.ecolecon.2021.107006
Boyce, J. K. (2018). Carbon pricing: effectiveness and equity. Ecol. Econ. 150, 52–61. doi:10.1016/j.ecolecon.2018.03.030
Brini, E. (2020). Childlessness and low fertility in context: evidence from a multilevel analysis on 20 European countries. Genus 76, 6–38. doi:10.1186/s41118-020-00074-7
Budolfson, M., Dennig, F., Errickson, F., Feindt, S., Ferranna, M., Fleurbaey, M., et al. (2021). Climate action with revenue recycling has benefits for poverty, inequality and well-being. Nat. Clim. Change 11, 1111–1116. doi:10.1038/s41558-021-01217-0
Bureau, B. (2011). Distributional effects of a carbon tax on car fuels in France. Energy Econ. 33, 121–130. doi:10.1016/j.eneco.2010.07.011
Cabernard, L., Pfister, S., and Hellweg, S. (2019). A new method for analyzing sustainability performance of global supply chains and its application to material resources. Sci. Total Environ. 684, 164–177. doi:10.1016/j.scitotenv.2019.04.434
Commission, E. (2023). ETS2: buildings, road transport and additional sectors. Available online at: https://climate.ec.europa.eu/eu-action/eu-emissions-trading-system-eu-ets/ets2-buildings-road-transport-and-additional-sectors_en.
Distefano, T., and D’Alessandro, S. (2023). Introduction of the carbon tax in Italy: is there room for a quadruple-dividend effect? Energy Econ. 120, 106578. doi:10.1016/j.eneco.2023.106578
Dobrowolski, Z., Adamisin, P., Slugocki, W., and Kotylak, S. (2025). Energy ladder, decarbonisation and energy poverty: the European Union inside. Energies 18, 1180. doi:10.3390/en18051180
Dorband, I. I., Jakob, M., Kalkuhl, M., and Steckel, J. C. (2019). Poverty and distributional effects of carbon pricing in low-and middle-income countries–A global comparative analysis. World Devel 115, 246–257. doi:10.1016/j.worlddev.2018.11.015
Eisner, A., Kulmer, V., and Kortschak, D. (2021). Distributional effects of carbon pricing when considering household heterogeneity: an EASI application for Austria. Energy Policy 156, 112478. doi:10.1016/j.enpol.2021.112478
Feindt, S., Kornek, U., Labeaga, J. M., Sterner, T., and Ward, H. (2021). Understanding regressivity: challenges and opportunities of European carbon pricing. Energy Econ. 103, 105550. doi:10.1016/j.eneco.2021.105550
Fremstad, A., and Paul, M. (2019). The impact of a carbon tax on inequality. Ecol. Econ. 163, 88–97. doi:10.1016/j.ecolecon.2019.04.016
Fremstad, A., Mildenberger, M., Paul, M., and Stadelmann-Steffen, I. (2022). The role of rebates in public support for carbon taxes. Environ. Res. Lett. 17, 084040. doi:10.1088/1748-9326/ac8607
Fried, S., Novan, K., and Peterman, W. B. (2018). The distributional effects of a carbon tax on current and future generations. Rev. Econ. Dyn. 30, 30–46. doi:10.1016/j.red.2018.02.001
Ghafouri, B. (2023). Fairness in climate change mitigation: the case of carbon taxation. Am. J. Clim. Change 12, 548–578. doi:10.4236/ajcc.2023.124025
Günther, C., Michael, P., Kristina, G., Sebastian, O., and Fotiou, T. (2024). Carbon prices on the rise? Shedding light on the emerging second EU Emissions Trading System (EU ETS 2). Clim. Policy, 1–12. doi:10.1080/14693062.2025.2485196
Haywood, L., and Jakob, M. (2023). The role of the emissions trading scheme 2 in the policy mix to decarbonize road transport in the European Union. Transp. Policy 139, 99–108. doi:10.1016/j.tranpol.2023.06.003
Heintz-Martin, V. K., and Langmeyer, A. N. (2020). Economic situation, financial strain and child wellbeing in stepfamilies and single-parent families in Germany. J. Fam. Econ. Issues 41, 238–254. doi:10.1007/s10834-019-09653-z
Helm, S., Kemper, J. A., and White, S. K. (2021). No future, no kids–no kids, no future? Popul. Env. 43, 108–129. doi:10.1007/s11111-021-00379-5
Hogendoorn, B., and Härkönen, J. (2023). Single motherhood and multigenerational coresidence in Europe. Popul. Res. Policy Rev. 49, 105–133. doi:10.1111/padr.12540
Hsu, C.-H. (2023). How women’s employment instability affects birth transitions: the moderating role of family policies in 27 European countries. Eur. Sociol. Rev. jcad037. doi:10.1093/esr/jcad037
Ivanova, D., Vita, G., Steen-Olsen, K., Stadler, K., Melo, P. C., Wood, R., et al. (2017). Mapping the carbon footprint of EU regions. Environ. Res. Lett. 12, 054013. doi:10.1088/1748-9326/aa6da9
Ivanova, D., Vita, G., Wood, R., Lausselet, C., Dumitru, A., Krause, K., et al. (2018). Carbon mitigation in domains of high consumer lock-in. Glob. Environ. Change-Human Policy Dimensions 52, 117–130. doi:10.1016/j.gloenvcha.2018.06.006
Leroutier, M. (2022). Carbon pricing and power sector decarbonization: evidence from the UK. J. Environ. Econ. Manag. 111, 102580. doi:10.1016/j.jeem.2021.102580
Li, Y. (2023). Changes in global food consumption increase GHG emissions despite efficiency gains along global supply chains. Nat. Food 1-13. doi:10.1038/s43016-023-00768-z
Lin, V. S., Qin, Y., Li, G., and Wu, J. (2021). Determinants of Chinese households' tourism consumption: evidence from China family panel studies. Int. J. Tour. Res. 23, 542–554. doi:10.1002/jtr.2425
Linden, J., O'Donoghue, C., and Sologon, D. M. (2024). The many faces of carbon tax regressivity-why carbon taxes are not always regressive for the same reason. Energy Policy 192, 114210. doi:10.1016/j.enpol.2024.114210
Liu, G., and Zhang, F. (2022). China's carbon inequality of households: perspectives of the aging society and urban-rural gaps. Resour. Conservation Recycl. 185, 106449. doi:10.1016/j.resconrec.2022.106449
Liu, J., Gong, N., and Qin, J. (2022). How would the carbon tax on energy commodities affect consumer welfare? Evidence from China's household energy consumption system. J. Environ. Manage. 317, 115466. doi:10.1016/j.jenvman.2022.115466
Liu, T., Shryane, N., and Elliot, M. (2023). Micro-macro multilevel analysis of day-to-day lifestyle and carbon emissions in UK multiple occupancy households. Sustain. Prod. Consum. 39, 13–29. doi:10.1016/j.spc.2023.04.023
Maestre-Andrés, S., Stefan, D., and van den Bergh, J. (2019). Perceived fairness and public acceptability of carbon pricing: a review of the literature. Clim. Policy 19, 1186–1204. doi:10.1080/14693062.2019.1639490
Malerba, D., Roscioli, F., Gaentzsch, A., and Ward, H. (2024). Changing carbon footprints and the consequent impacts of carbon taxes and cash transfers on poverty and inequality across years: a Peruvian case study. Energy Policy 192, 114246. doi:10.1016/j.enpol.2024.114246
Marron, D. B., and Toder, E. J. (2014). Tax policy issues in designing a carbon tax. Am. Econ. Rev. 104, 563–568. doi:10.1257/aer.104.5.563
Mi, Z., Zheng, J., Meng, J., Ou, J., Hubacek, K., Liu, Z., et al. (2020). Economic development and converging household carbon footprints in China. Nat. Sustain. 3, 529–537. doi:10.1038/s41893-020-0504-y
Müller, A., Hummel, M., Smet, K., Grabner, D., Litschauer, K., Imamovic, I., et al. (2024). Why renovation obligations can boost social justice and might reduce energy poverty in a highly decarbonised housing sector. Energy Policy 191, 114168. doi:10.1016/j.enpol.2024.114168
Oberhausen Krippler, F. (2023). Towards a sustainable energy future: a case study of Luxembourg’s transition to renewable energy and carbon neutrality.
Ohlendorf, N., Jakob, M., Minx, J. C., Schröder, C., and Steckel, J. C. (2021). Distributional impacts of carbon pricing: a meta-analysis. Environ. Resour. Econ. 78, 1–42. doi:10.1007/s10640-020-00521-1
Oliveras, L., Artazcoz, L., Borrell, C., Palència, L., López, M. J., Gotsens, M., et al. (2020). The association of energy poverty with health, health care utilisation and medication use in southern Europe. SSM-population health 12, 100665. doi:10.1016/j.ssmph.2020.100665
Osorio, P., Tobarra, M.-Á., and Tomás, M. (2024). Are there gender differences in household carbon footprints? Evidence from Spain. Ecol. Econ. 219, 108130. doi:10.1016/j.ecolecon.2024.108130
Pahle, M. (2023). Pricing carbon for a fair and effective low-carbon road transport transition in the EU. One Earth 6, 7–10. doi:10.1016/j.oneear.2022.12.005
Pais-Magalhães, V., Moutinho, V., and Robaina, M. (2022). Is an ageing population impacting energy use in the European Union? Drivers, lifestyles, and consumption patterns of elderly households. Energy Res. and Soc. Sci. 85, 102443. doi:10.1016/j.erss.2021.102443
Pesando, L. M. (2019). Childlessness and upward intergenerational support: cross-national evidence from 11 European countries. Ageing and Soc. 39, 1219–1254. doi:10.1017/s0144686x17001519
Piekut, M. (2020). Patterns of energy consumption in Polish one-person households. Energies 13, 5699. doi:10.3390/en13215699
Pizer, C. F., and Pizer, W. A. (2019). Horizontal equity effects in energy regulation. J. Assoc. Environ. Resour. Econ. 6, S209–S237. doi:10.1086/701192
Ravigne, E., Ghersi, F., and Nadaud, F. (2022). Is a fair energy transition possible? Evidence from the French low-carbon strategy. Ecol. Econ. 196, 107397. doi:10.1016/j.ecolecon.2022.107397
Sajeewani, D., Siriwardana, M., and Mcneill, J. (2015). Household distributional and revenue recycling effects of the carbon price in Australia. Clim. Change Econ. 6, 1550012. doi:10.1142/s2010007815500128
Shang, B. (2023). The poverty and distributional impacts of carbon pricing: channels and policy implications. Rev. Environ. Econ. Policy 17, 64–85. doi:10.1086/723899
Sobotka, T. (2017). Childlessness in Europe: reconstructing long-term trends among women born in 1900–1972. Childlessness Eur. Contexts, causes, consequences, 17–53. doi:10.1007/978-3-319-44667-7_2
Sørensen, A. (1994). Women's economic risk and the economic position of single mothers. Eur. Sociol. Rev. 10, 173–188. doi:10.1093/oxfordjournals.esr.a036328
Stadler, K., Wood, R., Bulavskaya, T., Södersten, C., Simas, M., Schmidt, S., et al. (2018). EXIOBASE 3: developing a time series of detailed environmentally extended multi-regional input-output tables. J. Ind. Ecol. 22, 502–515. doi:10.1111/jiec.12715
Steckel, J. C., Dorband, I. I., Montrone, L., Ward, H., Missbach, L., Hafner, F., et al. (2021). Distributional impacts of carbon pricing in developing Asia. Nat. Sustain. 4, 1005–1014. doi:10.1038/s41893-021-00758-8
Streimikiene, D., Kyriakopoulos, G. L., Lekavicius, V., and Siksnelyte-Butkiene, I. (2021). Energy poverty and low carbon just energy transition: comparative study in Lithuania and Greece. Soc. Indic. Res. 158, 319–371. doi:10.1007/s11205-021-02685-9
Sunikka-Blank, M., and Galvin, R. (2021). Single parents in cold homes in Europe: how intersecting personal and national characteristics drive up the numbers of these vulnerable households. Energy Policy 150, 112134. doi:10.1016/j.enpol.2021.112134
Tatham, M., and Peters, Y. (2023). Fueling opposition? Yellow vests, urban elites, and fuel taxation. J. Eur. Public Policy 30, 574–598. doi:10.1080/13501763.2022.2148172
Tian, P., Feng, K., Zheng, H., Hubacek, K., Li, J., Zhong, H., et al. (2023). Implementation of carbon pricing in an aging world calls for targeted protection schemes. PNAS Nexus 2, pgad209. doi:10.1093/pnasnexus/pgad209
Tian, P., Zhong, H., Chen, X., Feng, K., Sun, L., Zhang, N., et al. (2024a). Keeping the global consumption within the planetary boundaries. Nature 635, 625–630. doi:10.1038/s41586-024-08154-w
Tian, P., Feng, K., Sun, L., Hubacek, K., Malerba, D., Zhong, H., et al. (2024b). Higher total energy costs strain the elderly, especially low-income, across 31 developed countries. Proc. Natl. Acad. Sci. 121, e2306771121. doi:10.1073/pnas.2306771121
Tian, P., Ma, H., Zhang, Z., Yu, Y., and Li, D. (2025). China's current carbon inequality is predominantly determined by capital disparity. Ecol. Econ. 230, 108515. doi:10.1016/j.ecolecon.2024.108515
Tomás, M., López, L. A., and Monsalve, F. (2020). Carbon footprint, municipality size and rurality in Spain: inequality and carbon taxation. J. Clean. Prod. 266, 121798. doi:10.1016/j.jclepro.2020.121798
Toulemon, L. (2016). Fifty years of family change in Europe: diversifying partnerships. Changing Fam. Dyn. Demogr. Evol. Fam. kaleidoscope, 25–48. doi:10.4337/9781785364983.00008
Trinh, N. A. (2021). Hartz IV and educational attainment: investigating the causal effect of social benefit reform on intergenerational inequalities in Germany.
Vandyck, T., Weitzel, M., Wojtowicz, K., Rey Los Santos, L., Maftei, A., and Riscado, S. (2021). Climate policy design, competitiveness and income distribution: a macro-micro assessment for 11 EU countries. Energy Econ. 103, 105538. doi:10.1016/j.eneco.2021.105538
Vandyck, T., Della Valle, N., Temursho, U., and Weitzel, M. (2023). EU climate action through an energy poverty lens. Sci. Rep. 13, 6040. doi:10.1038/s41598-023-32705-2
Verde, S. F., and Tol, R. S. J. (2009). The distributional impact of a carbon tax in Ireland. Econ. Soc. Rev. 40, 317–338. doi:10.1016/j.enpol.2008.08.034
Verleyen, L., Arroyo, J., and Helsen, L. (2024). The cost of CO2 emissions abatement in a micro energy community in a Belgian context. Smart Energy 16, 100162. doi:10.1016/j.segy.2024.100162
Vignoli, D., and Salvini, S. (2014). Religion and union formation in Italy: catholic precepts, social pressure, and tradition. Demogr. Res. 31, 1079–1106. doi:10.4054/demres.2014.31.35
Wang, Q., Hubacek, K., Feng, K., Guo, L., Zhang, K., Xue, J., et al. (2019). Distributional impact of carbon pricing in Chinese provinces. Energy Econ. 81, 327–340. doi:10.1016/j.eneco.2019.04.003
Yu, Y.-Y., Zhong, C.-Y., Zhang, S.-X., and Jiang, H.-D. (2025). The economic burden of a carbon tax on Chinese residents: a gender and income perspective. Energy Econ. 147, 108601. doi:10.1016/j.eneco.2025.108601
Zha, D., Chen, Q., and Wang, L. (2022). Exploring carbon rebound effects in Chinese households’ consumption: a simulation analysis based on a multi-regional input–output framework. Appl. Energy 313, 118847. doi:10.1016/j.apenergy.2022.118847
Zhang, Y.-J., Bian, X.-J., Tan, W., and Song, J. (2017). The indirect energy consumption and CO2 emission caused by household consumption in China: an analysis based on the input–output method. J. Clean. Prod. 163, 69–83. doi:10.1016/j.jclepro.2015.08.044
Zhang, Z. Y., Hao, Y., Lu, Z. N., and Deng, Y. X. (2018). How does demographic structure affect environmental quality? Empirical evidence from China. Resour. Conserv. Recycl. 133, 242–249. doi:10.1016/j.resconrec.2018.02.017
Zhang, Q., Li, B., Liu, J. Y., Deng, Y., Zhang, R., Wu, W., et al. (2024). Assessing the distributional impacts of ambitious carbon pricing in China's agricultural sector. Ecol. Econ. 217, 108082. doi:10.1016/j.ecolecon.2023.108082
Keywords: EU ETS2, singleness, childlessness, MRIO model, carbon pricing, social equity
Citation: Cui Y and Wu W (2025) The economic burden of EU ETS2 carbon pricing on single and childless households: focusing on transport and building sectors. Front. Environ. Sci. 13:1572246. doi: 10.3389/fenvs.2025.1572246
Received: 07 February 2025; Accepted: 18 August 2025;
Published: 29 August 2025.
Edited by:
Xunjie Gou, Sichuan University, ChinaReviewed by:
Peipei Tian, Shandong University, ChinaSana Fatima, Symbiosis School for Open and Distance Learning, India
Copyright © 2025 Cui and Wu. This is an open-access article distributed under the terms of the Creative Commons Attribution License (CC BY). The use, distribution or reproduction in other forums is permitted, provided the original author(s) and the copyright owner(s) are credited and that the original publication in this journal is cited, in accordance with accepted academic practice. No use, distribution or reproduction is permitted which does not comply with these terms.
*Correspondence: Yalei Cui, Y3VpX3lsQHRqdS5lZHUuY24=