 Wenrui Zhang
- College of Economics and Management, Nanjing Agricultural University, Nanjing, China
Introduction: The existing research on the relationship between farm size and land yield has been controversial because it fails to clarify the differences in factor substitution and technological progress across machinery technologies used in different production links.
Methods: Based on micro-level farmer data from the 2020 China Rural Revitalization Survey (CRRS) database, this paper uses a stochastic Frontier model (SFM) to systematically analyze the impact of machinery technology at different production links on the relationship between the farm size and land yield of staple crops, revealing the significant role of technological progress in promoting the development of farmland scale management.
Conclusion: The research results indicate that before incorporating machinery technology variables, there is an “inverse relationship” between the farm size and land yield for all three crops, meaning that the larger the farm size, the lower land yield. After incorporating machinery technology variables, the “inverse relationship” was alleviated for wheat and rice, while it was reversed for corn. After considering technical efficiency losses and adjusting the coefficients of farm size, the regression results show no significant changes. Compared to power-intensive machinery technologies, control-intensive machinery technologies have a more significant role in improving this relationship. Further analysis indicates that as farm size increases, the total factor productivity index at the farmer level for the three crops shows an upward trend, with the adoption of control-intensive machinery technologies playing an important role. Therefore, moderate-scale farming is an effective means to ensure food security, and its development process should place greater emphasis on the development and application of control-intensive machinery technologies such as spraying and fertilization.
1 Introduction
“Food is the paramount necessity of the people, and when grain is abundant, the world is peaceful.” Ensuring food security has always been the top priority for both national governance and people’s livelihoods. The primary task for building a strong agricultural nation is to ensure the stable and safe supply of food and important agricultural products, with a focus on stabilizing acreage and increasing yield per unit area. With the continued urbanization in China and the continuous migration of agricultural labor to towns and cities, the farmland scale management in agriculture has rapidly developed, effectively improving agricultural labor productivity and increasing income levels from grain production. However, the relationship between farm size and land yield has been controversial due to economies or diseconomies of scale. The study on the relationship between farm size and land yield can be traced back to the 1920s. Russian scholar Chaianov (1986) found that, under the same technological level, crop yields per unit area tend to decrease as the farm size expands, which is the classic “inverse relationship” (Sen, 1962; Barrett, 2010). This phenomenon has been repeatedly confirmed by numerous empirical studies (Berry et al., 1980; Collier, 1983; Carter, 1984; Heltberg, 1998; Alvarez and Arias, 2003; Yan, 2019). This phenomenon occurs because traditional smallholder farmers, relying on intensive labor input, achieve higher yields per unit of land. However, as farm size expands, there is insufficient supervision of hired labor, which leads to a decline in land yield.
With the continuous innovation of agricultural technology, traditional production models have gradually been disrupted. Since the 1940s, the Green Revolution aimed at increasing grain yields and addressing food shortages has been widely implemented in developing countries. By promoting biotechnology and modern agricultural techniques, it has significantly advanced agricultural development. Since the 1960s, China has drawn on international experience by introducing improved grain crop varieties, promoting the use of chemical fertilizers and pesticides, and popularizing agricultural machinery, thereby substantially increasing grain yields (Foster and Rosenzweig, 2022). As this process deepened, large-scale farmers, leveraging their greater resource endowments and stronger learning capabilities, not only achieved widespread substitution of machinery for labor but also tended to adopt more advanced biotechnologies. In contrast, smallholder farmers often prefer traditional production technologies that fully utilize their labor advantages, leading to a divergence in technology adoption paths between them and large-scale farmers (Gong et al., 2020). However, China’s current grain production has not yet achieved complete substitution of machinery for labor, as certain mechanized processes still require a significant amount of labor input. This inevitably subjects farmland scale management to labor shortage constraints. More critically, the expansion of farm size has increased the complexity of field management, particularly in areas such as fertilization and spraying, further exacerbating labor shortages. This undermines the yield potential of biotechnologies and may ultimately lead to extensive management practices by large-scale farmers (Han, 2023). If the technological advantages of large-scale farmers cannot compensate for the disadvantages of labor shortages, the “inverse relationship” between farm size and land yield is likely to persist. This could pose a threat to China’s future food security goals and hinder the sustainable development of farmland scale management. This raises the core questions: What is the relationship between farm size and land yield in China’s grain production? How can the compatibility between farmland scale management and high yields be achieved?
Existing studies generally agree that the substitution of machinery for labor in grain production not only alleviates the labor constraints and supervision costs faced by farmland scale management but also reduces the willingness of smallholder farmers to engage in “intensive farming.” This effectively mitigates the “inverse relationship” between farm size and land yield (Assuncao and Ghatak, 2003; Otsuka et al., 2016). Some studies have found that farmers who substitute labor with machinery for farmland scale management have achieved land yield levels that reach or even exceed those of smallholders (Fan and Zhou, 2014; Wang et al., 2015; Huang and Ding, 2016; Bevis and Barrett, 2020). This phenomenon has been widely observed in developed countries (Alvarez and Arias, 2003; Sheng and Chancellor, 2019; Key, 2019). Some also studies have also found that the relationship between farm size and land yield is not a simple linear one; it may follow a “U-shaped” or “inverted U-shaped” pattern. Scholars who support the “U-shaped” view argue that the degree of labor substitution by machinery increases as farm size expands, which results in the lowest land yield for medium-size farms that are most dependent on hired labor (Muyanga and Jayne, 2019; Foster and Rosenzweig, 2022). On the other hand, research supporting the “inverted U-shaped” view suggests that farmers with strong management abilities are more likely to expand their land area by transferring more land, achieving the highest land yield at the medium-size stage. However, as the farm size continues to grow, they may face diminishing returns due to insufficient management, leading to a decline in land yield (Yan et al., 2016; Zheng et al., 2024).
One of the controversies in existing research lies in the failure to clarify the role of agricultural machinery technology in different production links in the relationship between farm size and land yield. Neoclassical economics distinguishes between factor substitution and technological progress: the former refers to changes in the factor input structure, represented by the movement of the production point along the isoquant curve, while the latter refers to the increase in output per unit of input, represented by the movement of the isoquant curve itself (Ellis, 1993). The development of agricultural machinery technology typically involves both factor substitution and technological progress occurring simultaneously. Existing research often treats agricultural technological progress as an exogenous variable, focusing on the impact of farm size expansion on the structure of factor inputs. However, expanding the farm size not only affects the proportion of factor inputs, but it may also have an endogenous relationship with agricultural technological progress, as expanding the farm size may encourage farmers to adopt more advanced machinery technology. If factor substitution alone cannot fully explain the changes in the relationship between farm size and land yield, then it is necessary to further consider the role of technological progress. In food production, the adoption of agricultural machinery technology covers various links such as cultivating, seeding, harvesting, spraying, fertilizing, and irrigation. The emphasis of machinery technology in each production link on factor substitution and technological advancement varies, and this emphasis changes with farm size. As a result, the impact of technological adoption in different links on the relationship between farm size and land yield may also differ. Therefore, to scientifically understand the relationship between farm size and land yield, it is necessary to comprehensively consider the effects of factor substitution and technological adoption (Sheng et al., 2015; Ayaz and Mughal, 2024).
This study uses micro-level data from the China Rural Revitalization Survey (CRRS) initiated by the Institute of Rural Development, Chinese Academy of Social Sciences, to systematically analyze the relationship between farm size, land yield, and agricultural machinery technology. Based on the existing literature (Gautam and Ahmed, 2019; Foster and Rosenzweig, 2022), the innovations of this paper are as follows: At the theoretical level, existing research primarily focuses on the substitution effect of machinery technology on labor. Building on this, our study further identifies the role of machinery technology in promoting agricultural technological progress and reveals how technological progress facilitates farmland scale management. This research not only deepens the understanding of the functions of machinery technology but also provides new perspectives and insights for the theoretical exploration of farmland scale management. At the practical level, the study selects wheat, rice, and maize as the research subjects and analyzes in-depth the differentiated impact of agricultural machinery technology on the relationship between farm size and land yield for different crops, offering valuable references for the development of farmland scale management in China.
This study is structured as follows. Section 2 shows the theoretical of the impact of machinery technology on the relationship between farm size and land yield. Section 3 introduces the model specification. Section 4 presents the data sources and the results of the empirical analysis. Section 5 analyzes the impact of machinery technologies in different production links on technological progress. Section 6 discusses the contribution and limitations of the study. Section 7 draws conclusions and lay out the policy implications.
2 Theoretical analysis
Farmers expand their farm size with the goal of increasing operational profitability, a process that is typically accompanied by adjustments in factor structure and changes in production technology. Factor structure adjustment includes both the changes in economies of scale brought about by proportional increases in factors and the changes in input intensity of land factors determined by factor prices. Meanwhile, changes in production technology affect the output level per unit of input. Therefore, the impact of farm size on land yield depends on the combined effect of these two factors.
2.1 The impact of farm size on factor structure adjustment
Returns to Scale refer to the changes in output resulting from proportional changes in inputs under a given level of technology. These changes can manifest as increasing returns to scale, decreasing returns to scale, or constant returns to scale (Hu and Gao, 2000). In theory, achieving increasing returns to scale in agricultural production requires two conditions: firstly, in the process of proportional factor aggregation under the given level of technology, the efficiency of factor allocation is improved, which promotes specialization and division of labor; secondly, each producer exerts the same level of effort in different combinations of production factors (Xu et al., 2011; Sheng et al., 2015). However, unlike in industrial sectors, the indivisibility of production factors in agriculture is less pronounced, leading to less significant effects from proportional increases in production factors. Moreover, agriculture is an industry where effective supervision of labor during the production process is lacking, which means that even if proportional increases in production factors have the potential to achieve increasing returns to scale, they are often offset by insufficient labor supervision (Lucas, 1978; Adamopoulos and Restuccia, 2014). As a result, proportional increases in production factors in agriculture often lead to diminishing returns to scale.
Farmers, aiming to maximize their operational profitability, decide the intensity of input for each unit of land based on the market prices of production factors (Li et al., 2010; Barrett, 2010; Yu et al., 2022). At present, agricultural production in China cannot achieve complete substitution of labor by machinery and still requires a certain amount of labor input, including both family labor and hired labor. When the farm size is small, family labor can be managed more precisely, and the labor input per unit of land is higher. As the farm size increases, the family labor force is unable to maintain the same level of management precision, while hired labor faces high supervision costs. This results in an increase in the relative “price” of labor (Feder, 1985; Carletto et al., 2013; Valtiala et al., 2023). To ensure operational profitability, rational farmers would choose to reduce labor input per unit of land, but the reduction in labor input cannot be fully compensated by agricultural machinery. Meanwhile, the decline in management precision due to labor shortages reduces the efficiency of capital inputs such as fertilizers and pesticides, leading to a decrease in capital input intensity per unit of land (Eswaran and Kotwal, 1986; Abay et al., 2019). This suggests that, with technology remaining unchanged, an increase in farm size will lead to a decrease in the intensity of labor and capital inputs per unit of land, thereby reducing land yield.
2.2 The impact of farm size on agricultural technological progress
In agricultural production, technological progress includes advancements in physical technologies such as machinery, biological, and chemical technologies, as well as improvements in production and management efficiency. Relative to other technologies, biological and chemical technologies are more easily subdivided to fit different farm sizes and are generally considered size-neutral. Although machinery technologies can also be subdivided based on power size to suit different farm sizes, high-horsepower machinery tends to carry more advanced production technologies (Gautam and Ahmed, 2019; Key, 2019; Helfand and Taylor, 2021). In other words, the farm size determines the level of machinery, and the level of machinery directly influences production technology.
According to the varying demands for power and management skills, machinery technologies can be divided into power-intensive and control-intensive components (Pingali, 2007). Power-intensive components, such as cultivation, harvesting, and irrigation, have a high degree of standardization and significant power requirements. Machinery technologies in these areas primarily focus on replacing manual labor, particularly in heavy operations, where they can significantly reduce labor costs. In contrast, control-intensive components, such as seeding, fertilizing, and spraying, require higher levels of specialized skills. In these areas, machinery technologies are more focused on precision management, improving the uniformity and health of crop growth, thereby enhancing both yield and quality, and maximizing the productive potential of the land.
The aging and feminization of the agricultural labor force have reduced family labor quality, prompting smallholder farmers to demand machinery for labor replacement. Their production methods usually combine family labor with small-size agricultural machinery, which mainly compensates for labor shortages (Zheng and Xu, 2017; Zhang et al., 2016). At this stage, various types of machinery technologies primarily serve to replace labor. As the farm size expands, the complexity and management difficulty of food production also increase, which not only raises the demand for labor-replacing machinery but also imposes more refined requirements for management and technology. To counter potential marginal output losses brought about by scaling up, large-scale farmers typically replace medium and small machinery with larger machinery (Ji and Zhong, 2013; Omotilewa et al., 2021). At this point, machinery technology begins to show differences across various links.
Power-intensive tasks (such as cultivation, harvesting, and irrigation) are characterized by a high degree of standardization and significant power requirements. Machinery technologies in these links primarily focus on replacing manual labor, particularly in heavy-duty operations, leading to substantial labor savings. For example, large farms in the Midwestern United States use high-horsepower tractors for cultivation and seeding, where a single tractor can replace the labor of dozens of people, increasing cultivation efficiency by more than threefold. In contrast, control-intensive links (such as seeding, fertilization, and spraying) involve the application of biotechnology. These links not only require a certain level of power support but also demand higher professional skills, placing greater demands on machinery technologies. This includes precise crop management and improving the uniformity and health of crop growth, thereby maximizing the production potential of the land (Mandal, 2002; Zhang and Yi, 2015). For instance, in northeastern China, large-scale farmers use precision fertilizer applicators to precisely control the amount of fertilizer based on soil nutrient data and crop needs. This technology not only reduces fertilizer usage but also improves fertilizer efficiency, increasing corn yield by 10%–15%. Additionally, rice farmers in Jiangsu Province use plant protection drones for pesticide spraying, achieving precision operations through GPS positioning and sensor technology. Data shows that pesticide usage has decreased by 20%, pest control effectiveness has significantly improved, and rice yield has increased by 5%–8%.
2.3 Economic analysis of the impact of farm size on land yield
From both the perspective of returns to scale of factors and the intensity of factor input per unit of land, expanding the farm size by farmers leads to a decrease in land yield. In order to compensate for this yield loss and increase operational profits, farmers choose to adopt new machinery technologies to improve the output level per unit of input. As shown in Figure 1 assuming that farmers only use land (
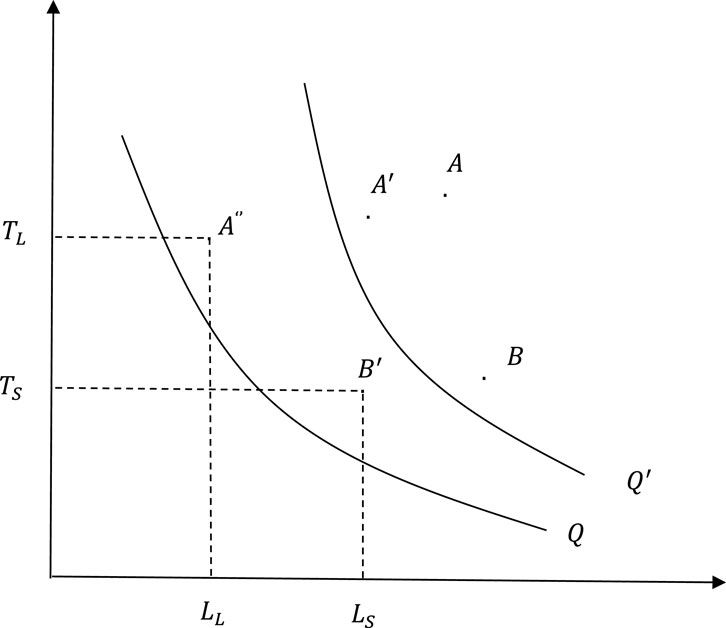
Figure 1. The impact of technological progress on farmers with different farm sizes.
Technological progress enhances the productivity advantages of large-scale farmers, and its impact on grain production is mainly reflected in improving the output level of each production factor. This indicates that, although an increase in farm size may be accompanied by a trend of declining yield per unit of land, farmers can still improve the output level of each production factor through technological progress, thereby alleviating or even reversing the “inverse relationship” between farm size and yield per unit. Therefore, neither of them constitutes a sufficient condition nor a necessary condition. To illustrate this point, this study constructs the following model:
In Equations 1, 2,
As shown in Equation 3,
The above analysis indicates that although expanding the farm size leads to a decrease in marginal output, adopting new technologies can still improve land yield, thereby alleviating or even reversing the “inverse relationship” between farm size and land yield. Specifically, when the loss in yield due to farm size expansion exceeds the gain in yield from new technology, there will be an “inverse relationship” between farm size and land yield. Conversely, if the yield improvement from new technology outweighs the yield loss from farm size expansion, a “positive relationship” will emerge.
3 Model specification
The relationship between farm size and land yield is influenced by various factors. Although nonlinear models may better fit the data in some cases, choosing a linear model, in the absence of sufficient evidence supporting a nonlinear relationship, requires fewer assumptions and can meet the needs of most econometric analyses. The key inputs for food production include land, capital, and labor, while differences in farmers’ technological levels and production methods affect the output elasticity of these factors, thereby influencing the final yield level.
3.1 Theoretical model
Assuming that the key inputs for food production include land, capital, and labor, this study uses the Cobb-Douglas production function to analyze the relationship between farm size and land yield. The corresponding functional form can be expressed as:
In Equation 6,
The farmer’s technological level (
From Equation 8, it can be seen that the factors affecting land yield primarily include: technological progress related to farm size and household characteristics, returns to scale of production factors (proportional factor inputs), and factor inputs per unit of land (i.e., non-proportional factor inputs). If the factor market is in a perfectly competitive environment and the returns to scale of production factors are constant (
Equation 9 is the classic yield model, which is widely used in the analysis of farm size and land yield (Assunção and Braido, 2007; Barrett, 2010; Gourlay et al., 2019). As seen from Equation 8, the yield model actually identifies the impact of agricultural technological progress related to farm size on crop yield. Since this model is established under the assumption that there are no distortions in the factor market and that returns to scale are constant, there is a correlation between farm size, factor input ratios, and returns to scale. Therefore, although a large number of studies have proven the existence of an “inverse relationship,” their results may contain some biases. In reality, the factor market is not in a perfectly competitive environment. When farmers expand their farm size, market imperfections lead to increased supervision costs for labor, resulting in a reduction in factor inputs per mu (Abay et al., 2019; Helfand and Taylor, 2021). To reduce the bias in the model results caused by market imperfections, the above equation can be modified by controlling for factor inputs per mu:
Compared to Equation 9, Equation 10 considers the impact of market imperfections on the structure of factor inputs, i.e., the production function model (Julien et al., 2019; Rada et al., 2019; Aragón et al., 2022). In this case, the model bias is expressed as
3.2 Econometric model
Traditional production functions tend to conflate the physical technological progress related to farm size with technical efficiency losses. Omitting the impact of technical efficiency can lead to bias in the relationship between farm size and land yield (Wang and Schmidt, 2002; Kumbhakar and Lovell, 2003). Based on Equation 10, this study constructs a stochastic Frontier analysis model.
In this model,
In this model,
4 Empirical analysis
4.1 Data sources
The data in this study comes from the China Rural Revitalization Survey (CRRS), a nationwide rural tracking survey organized by the Institute of Rural Development, Chinese Academy of Social Sciences. The first phase of this survey was conducted in August-September 2020 across ten provinces (or autonomous regions): Guangdong, Zhejiang, Shandong, Anhui, Henan, Heilongjiang, Guizhou, Sichuan, Shaanxi, and Ningxia. The survey covered 50 counties (or cities) and 156 townships, collecting 300 village-level questionnaires and over 3,800 farmer-level questionnaires, involving more than 15,000 people. The survey content includes individual basic characteristics, education and employment status, family demographics, income and expenditure, crop planting structure and land transfer, as well as village population and organizational conditions, agricultural production and management.
The data cleaning process was conducted as follows: First, wheat, rice, and corn are China’s primary grain crops, accounting for the vast majority of the country’s grain production. This study selects farmers cultivating these three crops as the research sample, not only because of their significant role in agricultural production but also because their wide geographical distribution and varying farm sizes can effectively reflect the impact of different farm sizes on land yield. Second, to ensure the accuracy and reliability of the research results, the study implemented rigorous sample screening and processing. Specifically, samples with farm sizes exceeding five standard deviations were excluded to avoid the influence of outliers. Additionally, samples with missing values, anomalies, or farm sizes smaller than 1 mu (approximately 0.067 ha) were removed to ensure data completeness and representativeness. After these screening steps, the study ultimately obtained 2,871 valid samples, including 692 wheat-growing farmers, 652 rice-growing farmers, and 1,527 corn-growing farmers2. This sample distribution not only covers different crop types but also reflects the cultivation characteristics of farmers with varying farm sizes. The specific distribution is shown in Table 1.
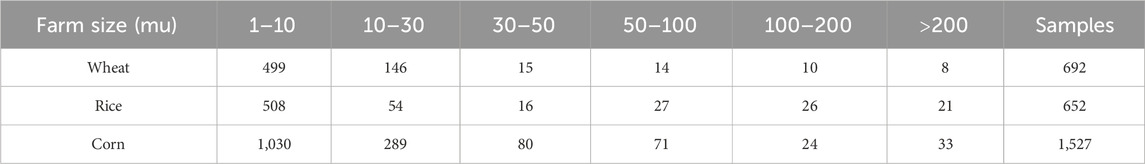
Table 1. The distribution of the farm size of the three major staple crops.
4.2 Descriptive statistics of variables
The descriptive statistics of the main variables are shown in Table 2. In the sample of this study, the yields of wheat, rice, and corn farmers were 380.52 kg/mu, 463.64 kg/mu, and 431.04 kg/mu, respectively, which are close to the national average yield levels for the three major staple crops3. The sample contains a relatively high proportion of large-scale farmers, with the average farm sizes for wheat, rice, and corn farmers being 17.90 mu, 20.77 mu, and 24.33 mu, respectively. In terms of machinery adoption, the machinery rate for cultivation, seeding, and harvesting was relatively high, with over 90% mechanization in the wheat cultivation, seeding, and harvesting links, 81%, 68%, and 75% for rice, and 87%, 65%, and 82% for corn. The machinery rate for fertilizing and spraying was lower, especially for spraying, with 12% for wheat, 14% for rice, and 19% for corn. In terms of technical efficiency, the level of socialized agricultural machinery services for the three crops was approximately 30%, mainly benefiting from the development of the socialized agricultural machinery service system in recent years. The average age of household heads exceeded 55, indicating a clear trend of aging.
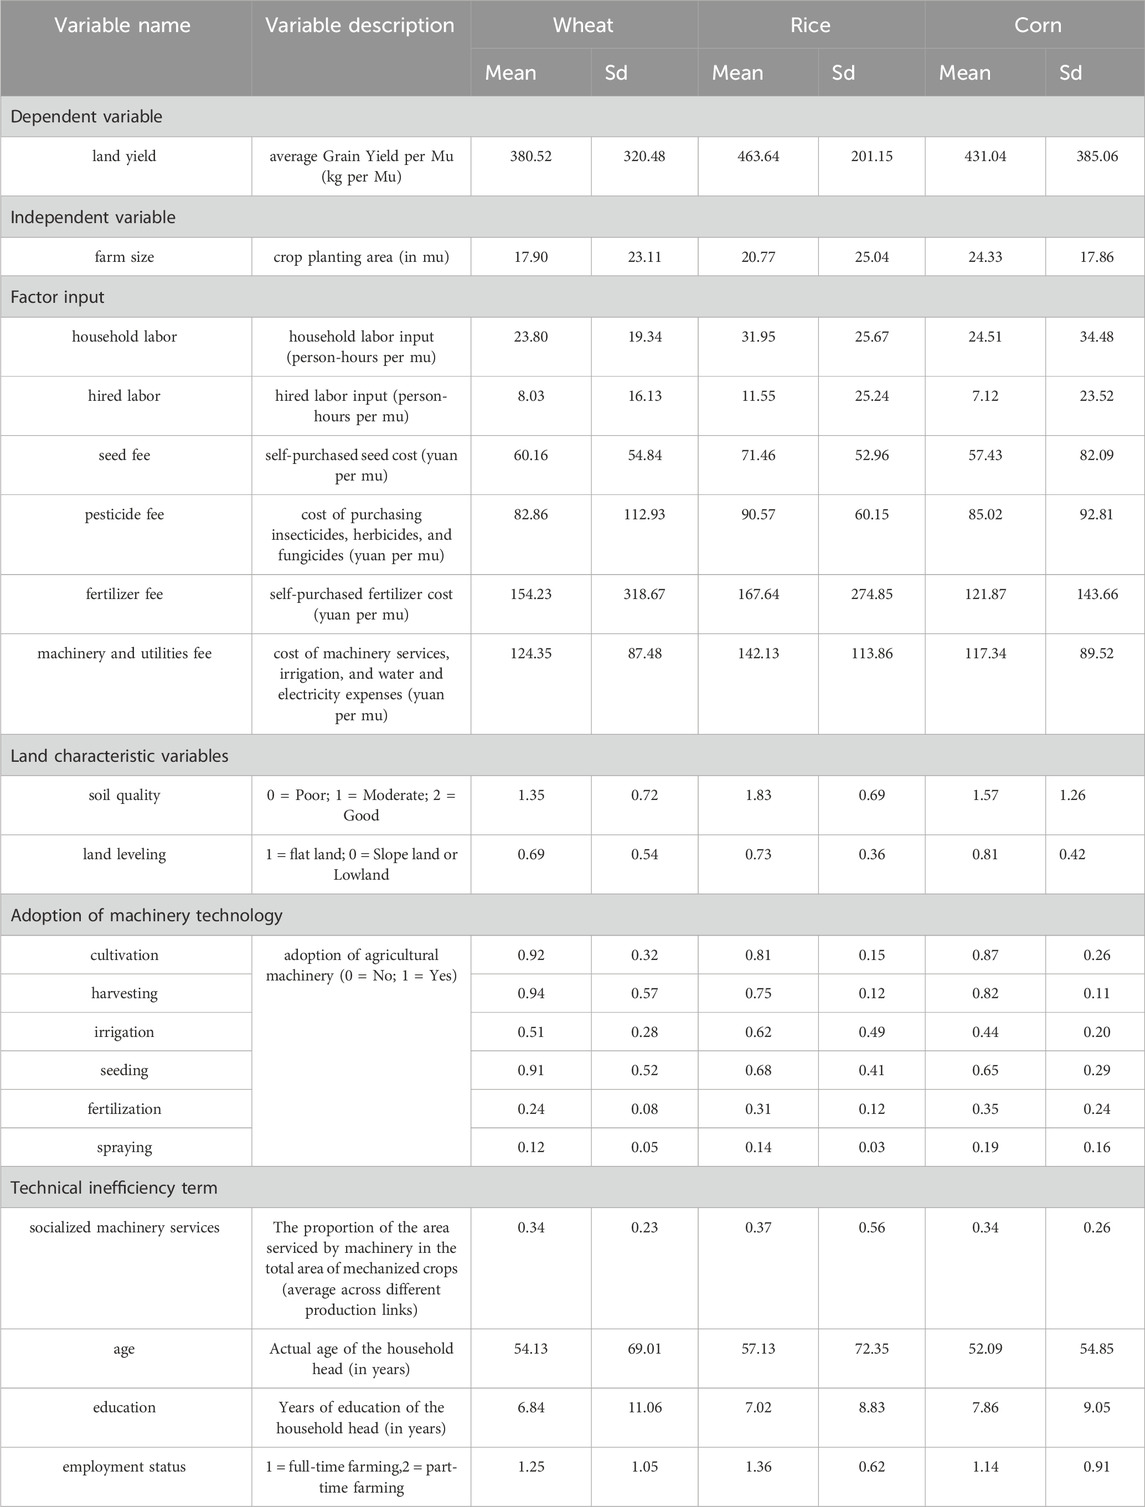
Table 2. Descriptive statistics of farmer-level variables.
4.3 Regression results analysis
4.3.1 The impact of farm size on land yield
In the stochastic Frontier model, the production function section reflects the maximum output level that can be achieved with production factors under the best production method, while the technical efficiency section reflects the degree of diffusion and application of existing technology. This study uses the “one-step method” to simultaneously estimate both the production function and the technical efficiency section, avoiding the estimation bias caused by different distribution assumptions in the “two-step method.” In the empirical analysis, it is necessary to test the suitability of the stochastic Frontier model. Therefore, this paper constructs the following generalized likelihood ratio test model:
As shown in Equation (13), among them,
Table 3 presents the regression results on the impact of farm size on land yield for wheat. The results in column (1) indicate that, without controlling for land characteristic variables, expanding the farm size significantly reduces wheat yield per unit of land, and the result passes the 5% significance test. After adding land characteristic variables, the results in column (2) show no significant change, suggesting that land quality does not alter the relationship between farm size and land yield. When machinery technology variables are further included, the results in column (3) show that the “inverse relationship” weakens, with the coefficient for farm size changing from −0.52 to −0.047, and statistical significance improving from 10% to 5%. Specifically, machinery in seeding and fertilization significantly improves land yield. In column (4), after adding the interaction term between farm size and machinery technology, the regression results indicate that the interaction between farm size and machinery in harvesting, fertilization, and spraying significantly enhances land yield. In the technical efficiency section, the coefficient for farm size is negative, indicating that increasing farm size helps reduce technical efficiency losses. The level of agricultural machinery socialization services and the education level of the household head both effectively reduce technical efficiency losses. Overall, land characteristics have a limited impact on the relationship between farm size and land yield, while agricultural machinery technology plays a significant role.
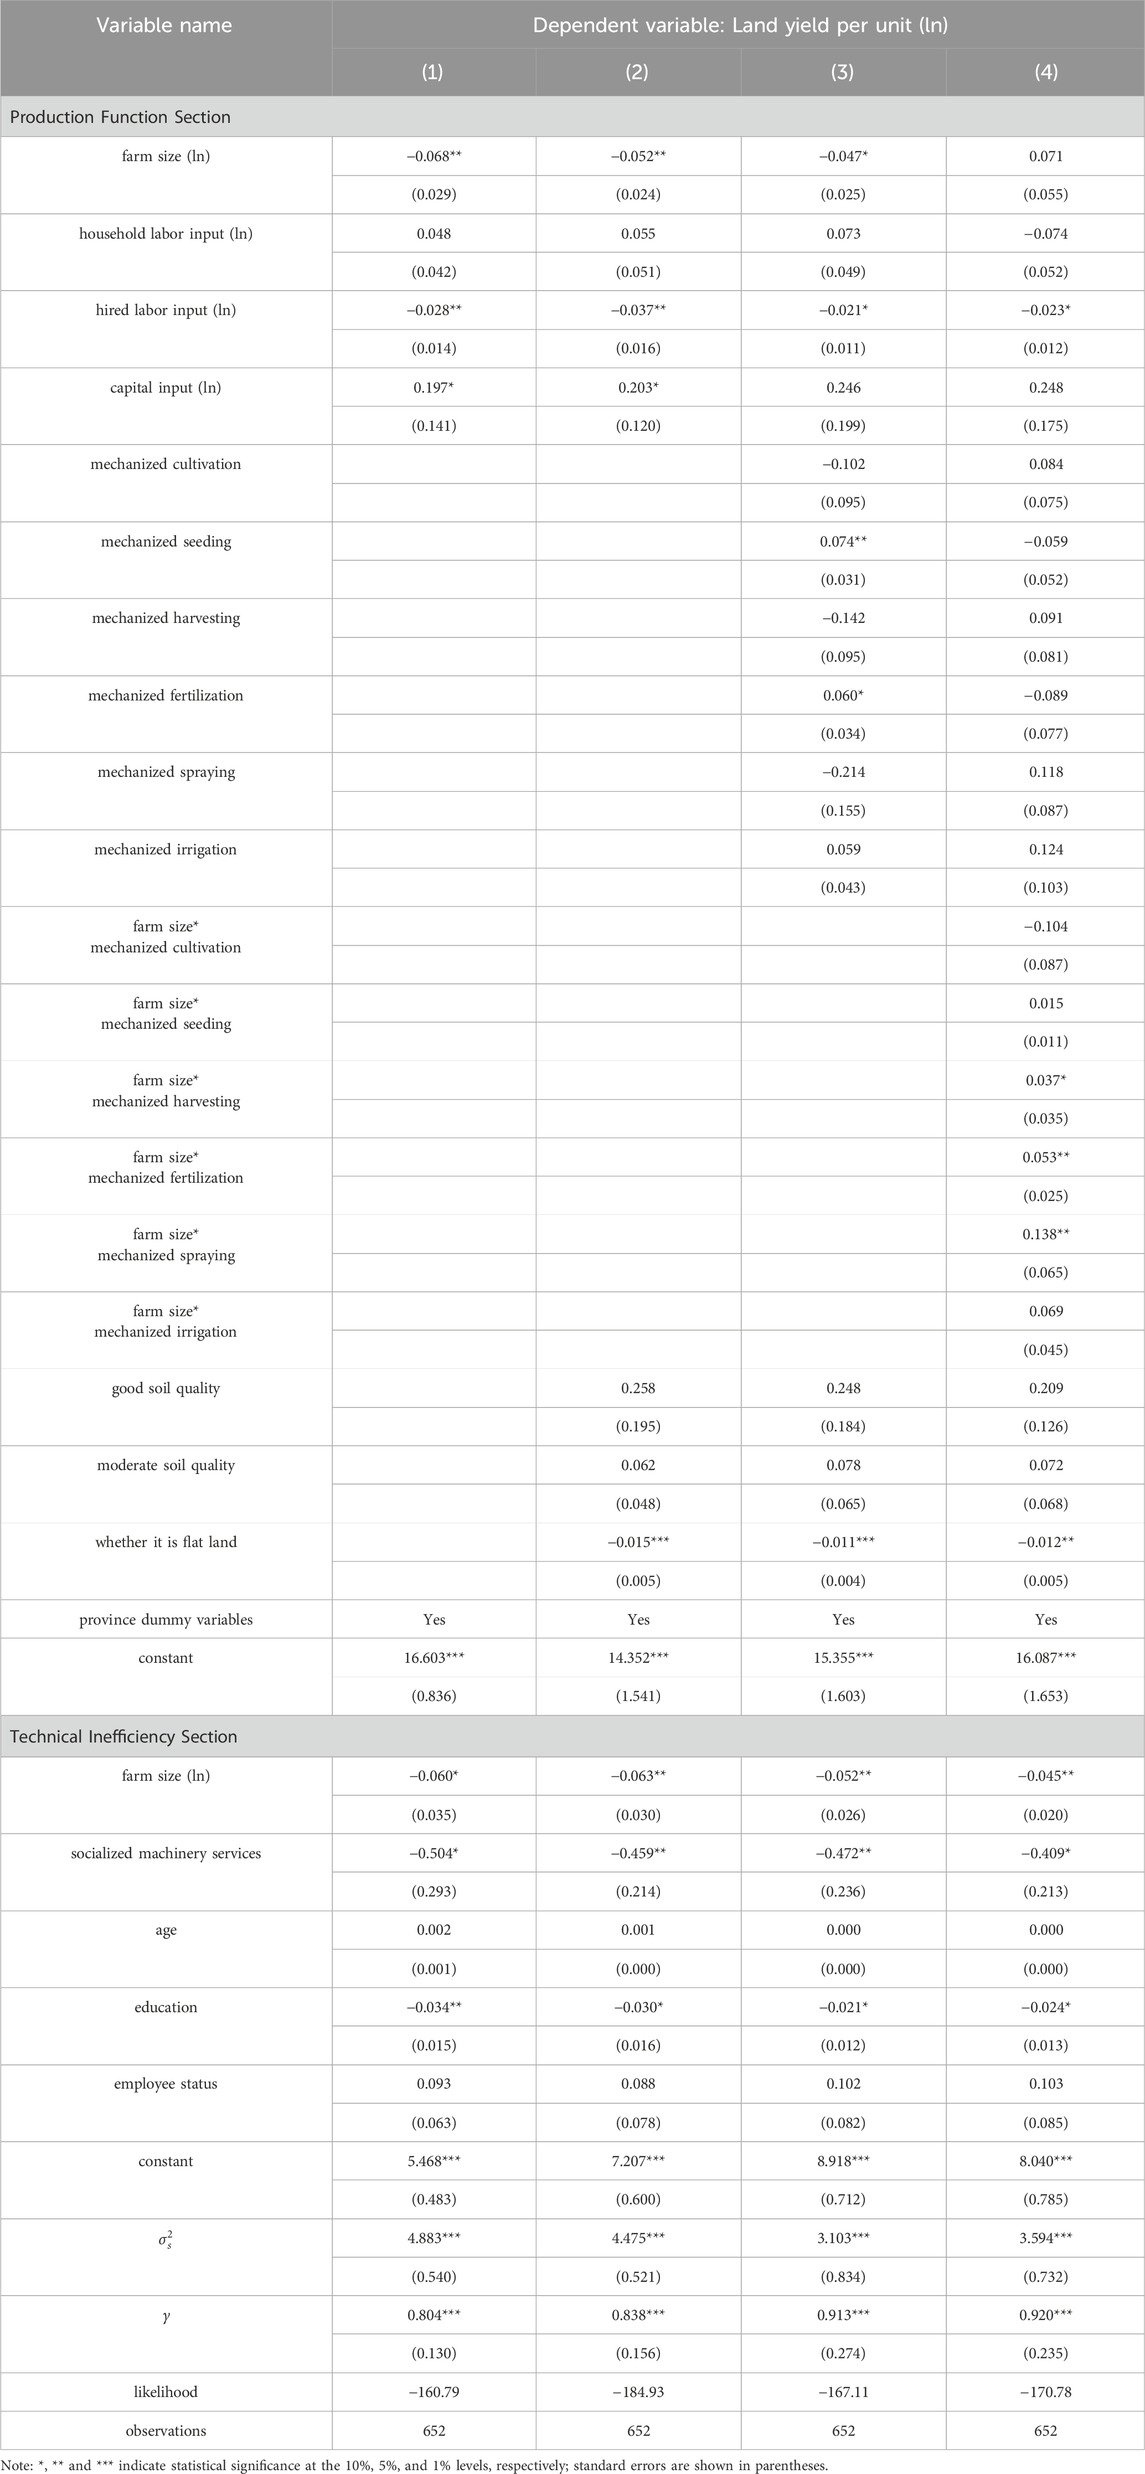
Table 3. The regression results of wheat on land yield.
Table 4 reports the relationship between rice farm size and land yield. In the production function section, the regression results in columns (1) and (2) show that the expansion of farm size significantly reduces rice yield per unit of land, passing the 1% significance test. This result does not change with the inclusion of land characteristic variables. After introducing machinery technology variables in column (3), although farm size still significantly negatively affects rice land yield, the coefficient decreases from −0.062 to −0.053, with significance only at the 10% level. Specifically, mechanized seeding and fertilization significantly improve land yield. The regression results in column (4) show that the interaction terms between mechanized seeding and fertilization and farm size are significantly positive, while the interaction term for mechanized spraying is also positive, but only passes the 10% significance level. In the technical inefficiency section, the coefficient for farm size is negative, consistent with the results for wheat. Additionally, part-time farmers increase technical inefficiency losses. The
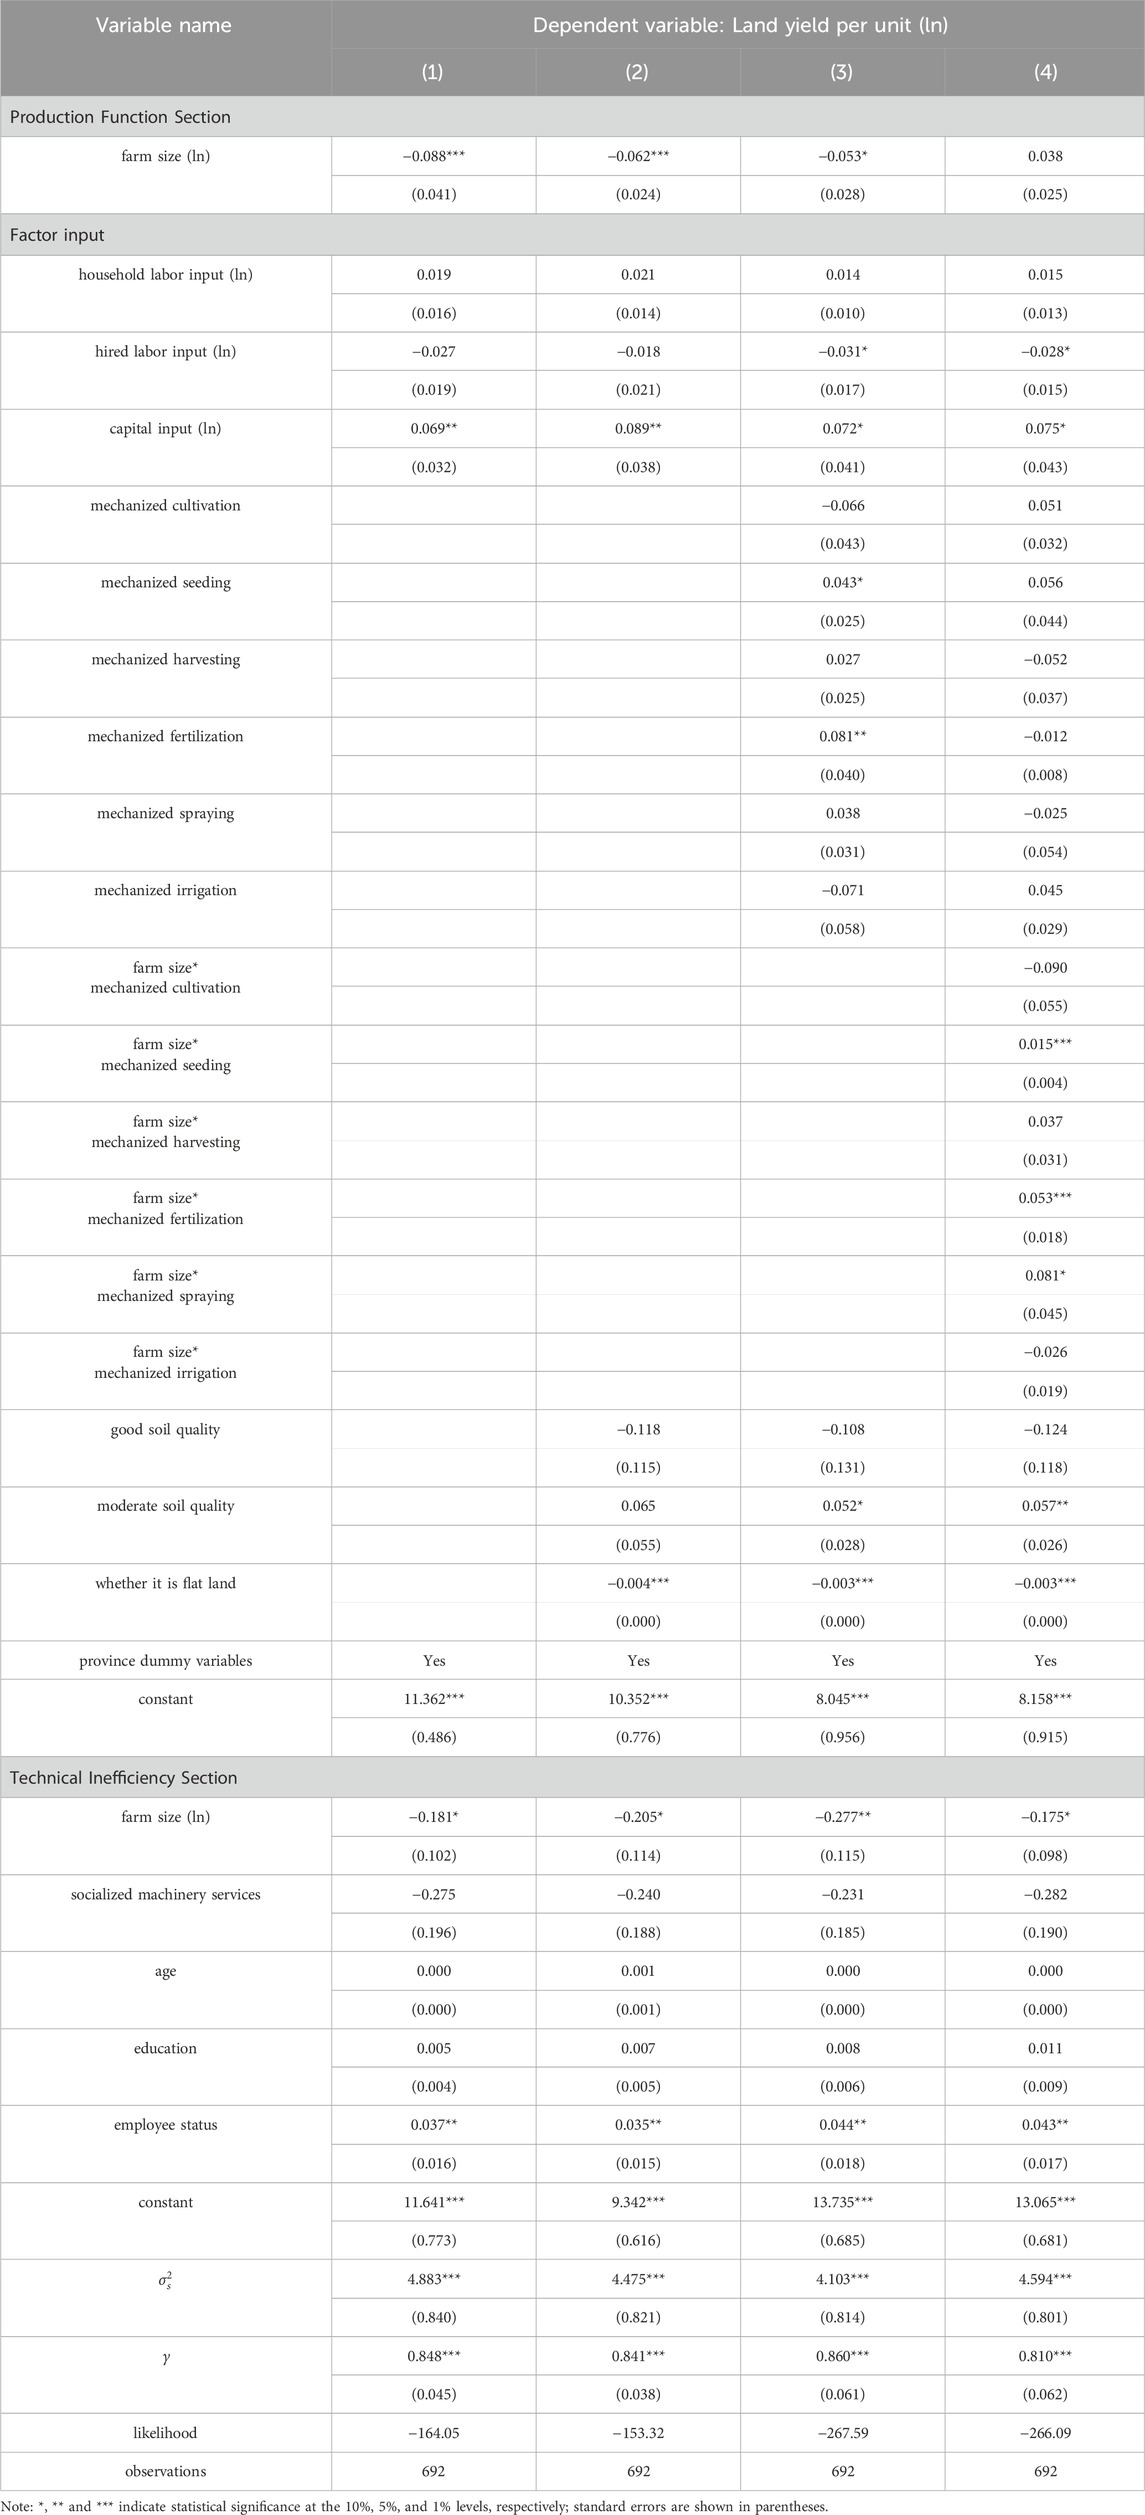
Table 4. The regression results of rice on land yield.
Table 5 reports the regression results on the impact of corn farm size on land yield. In the production function section, the regression results in column (1) show that farm size significantly reduces land yield, but only at the 10% significance level. In column (2), after adding land characteristic variables, the coefficient for farm size shows no significant change. Column (3) reveals that, after introducing machinery technology variables, the coefficient for farm size shifts from negative to positive, with significance improving to the 5% level. Specifically, mechanized seeding, fertilization, and irrigation significantly increase corn land yield. The regression results in column (4) show that the interaction terms between farm size and mechanized seeding, fertilization, and spraying are positive and significant. Overall, the adoption of machinery technology significantly increases land yield and reverses the “negative relationship” between farm size and land yield. In the technical efficiency section, the coefficient for farm size is negative, consistent with the results for wheat and rice. The coefficient for mechanized social services is also negative and significant, while the employment status of farmers significantly impacts technical efficiency. Part-time farmers experience greater technical efficiency losses. The

Table 5. The regression results of corn on land yield.
4.3.2 The impact of farm size on technological progress
In the technical efficiency section, the coefficient for farm size only represents the direction of the impact, rather than the degree of impact. To accurately identify the effect of farm size on land yield, it is necessary to combine the coefficient for farm size in the production function section with the coefficient in the technical efficiency component. Therefore, this study adopts the methods of Battese and Broca (1997) and Wang and Schmidt (2002) to parametrize the technical efficiency loss component4.
As shown in Equation 14 and 15, in this context,
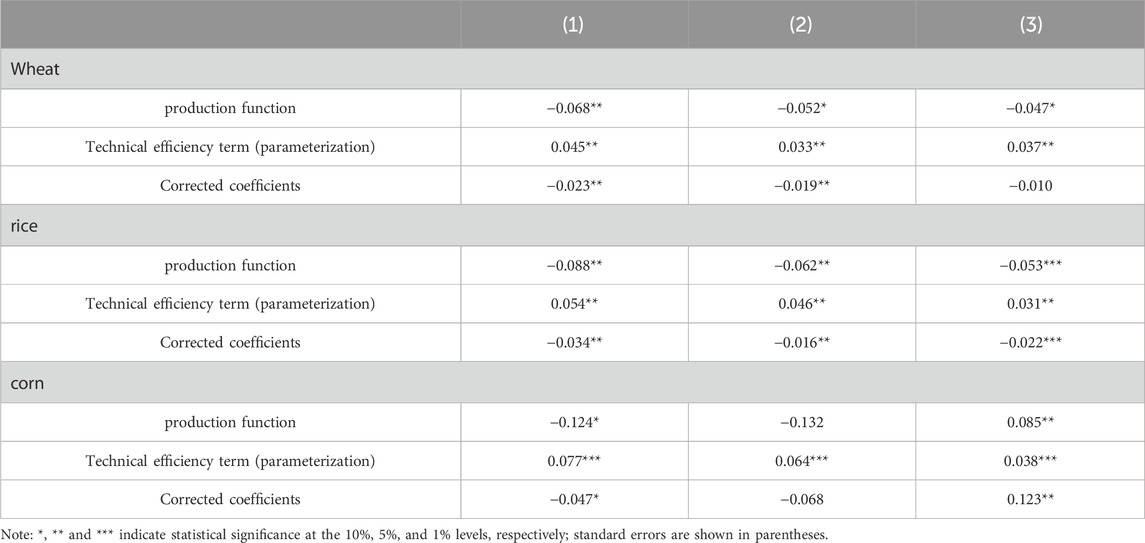
Table 6. The adjustment of the farm size coefficients for the three crops.
The above analysis indicates that land characteristics have a limited impact on the relationship between farm size and land yield, whereas agricultural machinery technology is closely related to farm size. The adoption of machinery technology effectively alleviates or even reverses the “inverse relationship” between the size of food crop farming and land yield. For smallholder farmers, machinery technology mainly serves as a substitute for labor. As the farm size expands, the impact of machinery technology on land yield varies across different production links. Compared to labor-intensive links, machinery technology in control-intensive links can significantly increase land yield and shift the production Frontier. After considering the impact of technical efficiency, the “inverse relationship” between farm size and land yield for wheat and rice is further alleviated, while the “positive relationship” for corn is further strengthened. Meanwhile, in terms of the efficiency of machinery technology utilization, larger farmers have a natural advantage. Ignoring differences in farmers’ technical levels may lead to biases in the relationship between farm size and land yield. Larger farmers, as “early adopters” of technology, have an advantage in the application of new technologies, while smallholder farmers have failed to keep up and are further from the optimal production Frontier.
4.3.3 Robustness test
In order to identify the impact of machinery technology at different production links on the relationship between farm size and land yield, this study introduces a dummy variable for machinery technology, reflecting the differences between farmers of different farm sizes in adopting or not adopting machinery at specific links. However, when farmers choose machinery technology, they not only consider whether or not to adopt the technology, but also decide the level of machinery based on their farm size. This leads to potential differences in factors such as the amount of investment and usage frequency, even when the same machinery technology is adopted. Therefore, this study uses the per-mu machinery cost at different production links as a proxy variable for machinery technology and conducts robustness checks on the regression results. The regression results are shown in Table 7. In the production function section, after adding per-mu machinery costs, the relationship between farm size and land yield for the three main staple crops does not change significantly. In the technical efficiency section, the expansion of farm size significantly reduces technical efficiency loss. Overall, the regression results remain robust after replacing machinery technology.
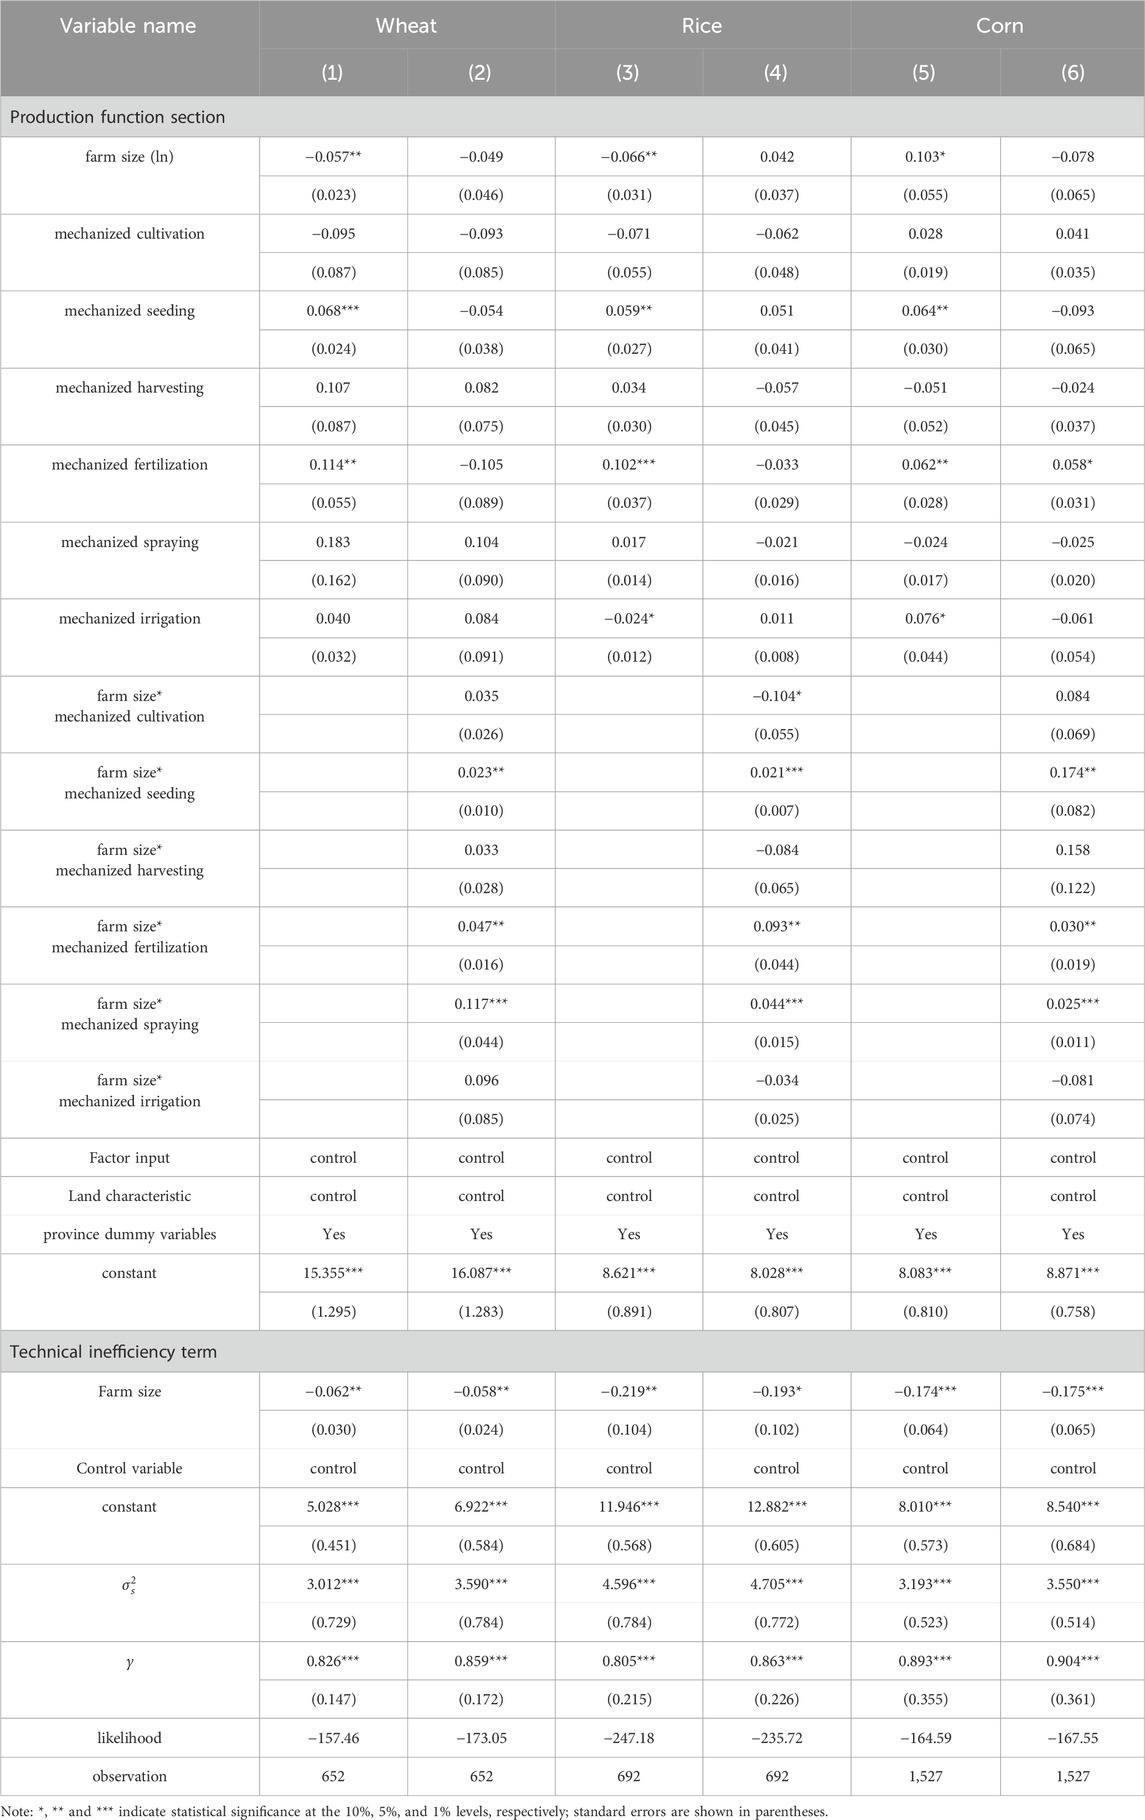
Table 7. Robustness test (replace machinery technology measurement method).
In order to further control for regional differences in resource endowments, this study replaces provincial-level dummy variables with city-level dummy variables to ensure the stability of the econometric model. The results in Table 8 show that the “inverse relationship” between the farm size and land yield still exists for the three crops. Compared to power-intensive links such as cultivation, harvesting, and irrigation, the interaction term between machinery technology in seeding, fertilizing, and spraying application is significantly positive, indicating that the adoption of machinery technology significantly enhances the productivity of large-scale farmers. Overall, the impact of machinery technology on the relationship between farm size and crop land yield remains consistent across regions, confirming the robustness of the research findings.
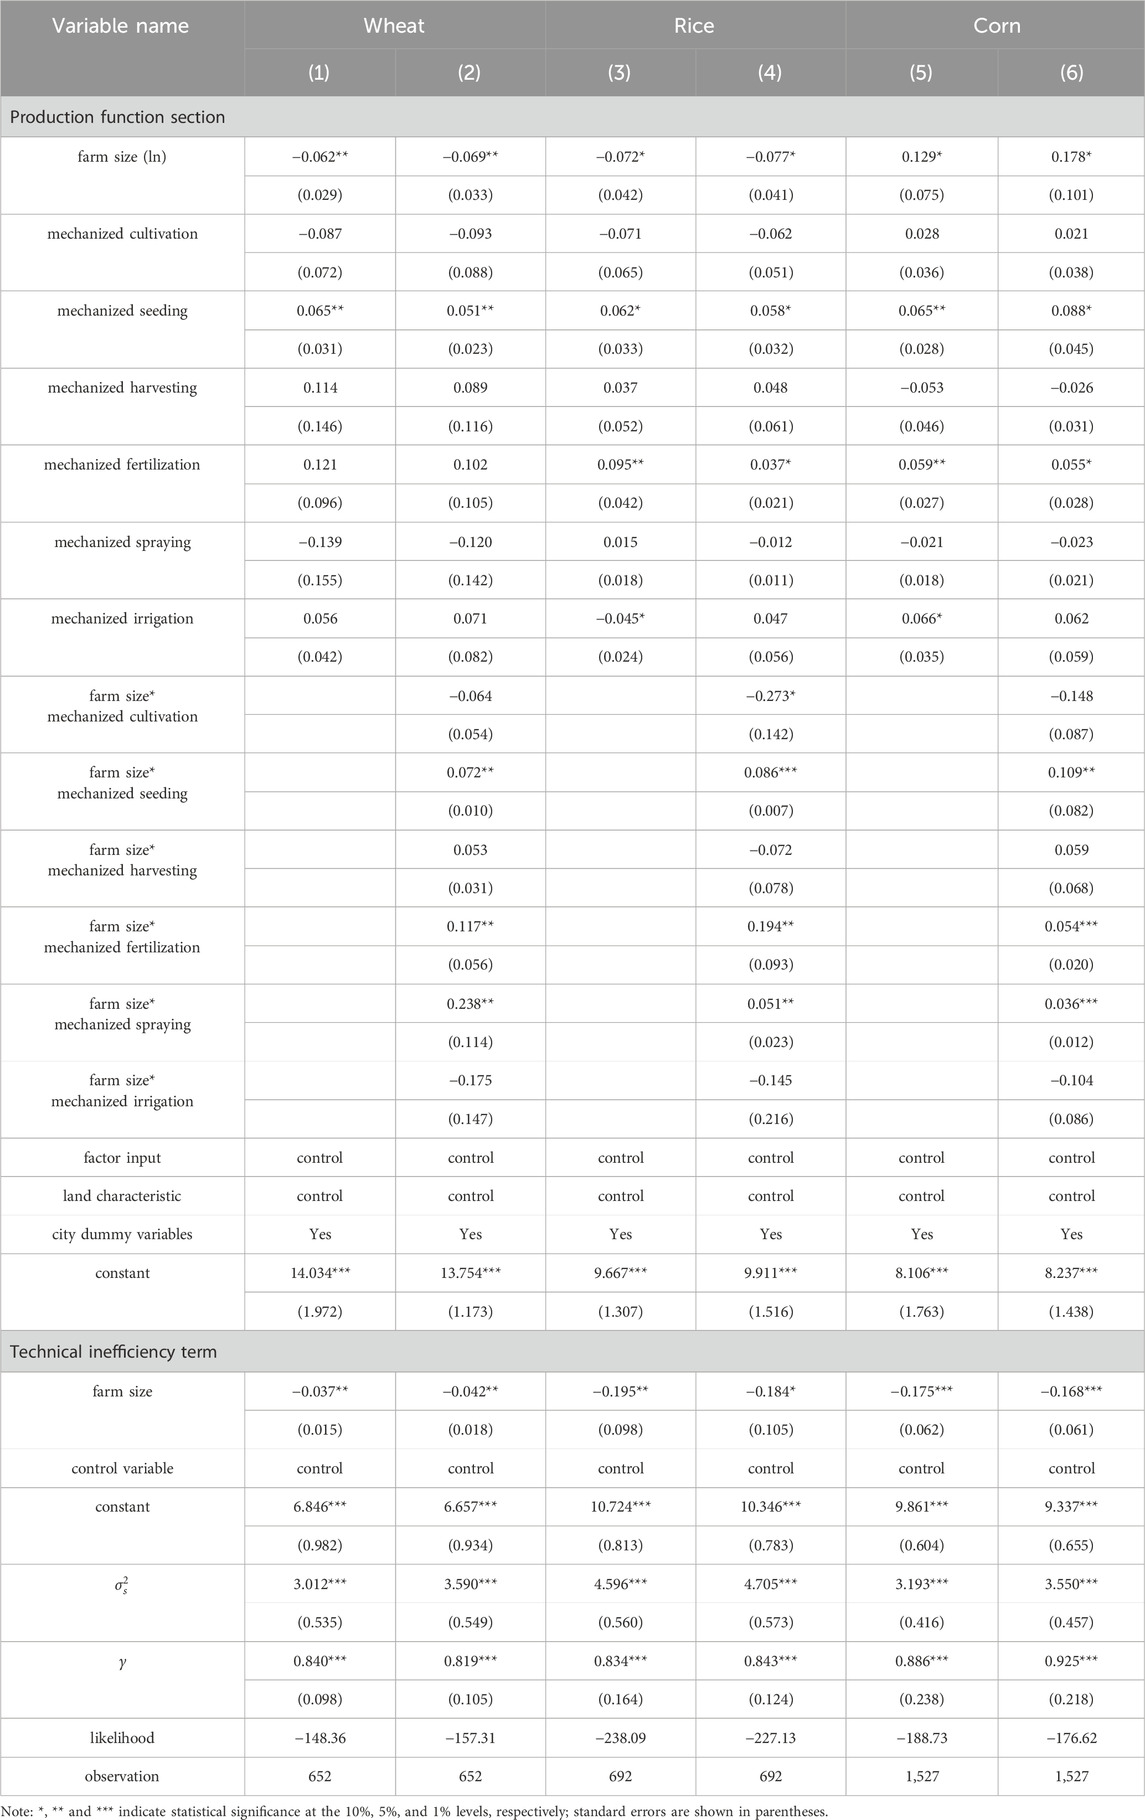
Table 8. Robustness test (replace dummy variable).
5 Further analysis
This study conducts a correlation analysis of the relationship between farm size, input factors, and the adoption of machinery technology. As shown in Table 9, with the expansion of farm size, household labor input per mu for wheat, rice, and corn decreases, while hired labor input per mu increases, indicating that farmland scale management relies on a certain proportion of hired labor. The input of seeds, pesticides, and fertilizers decreases, while machinery and water-electricity costs increase. Regarding the adoption of machinery technology, with the expansion of farm size, the machinery levels of traditional cultivation, seeding, and harvesting links for the three crops significantly improve, while there are larger variations in the machinery levels for fertilizing, pesticide application, and irrigation. Specifically, wheat has a higher level of machinery in the fertilization links, rice shows a more pronounced machinery in both fertilization and irrigation links, and corn exhibits higher machinery in the fertilizing and spraying links.
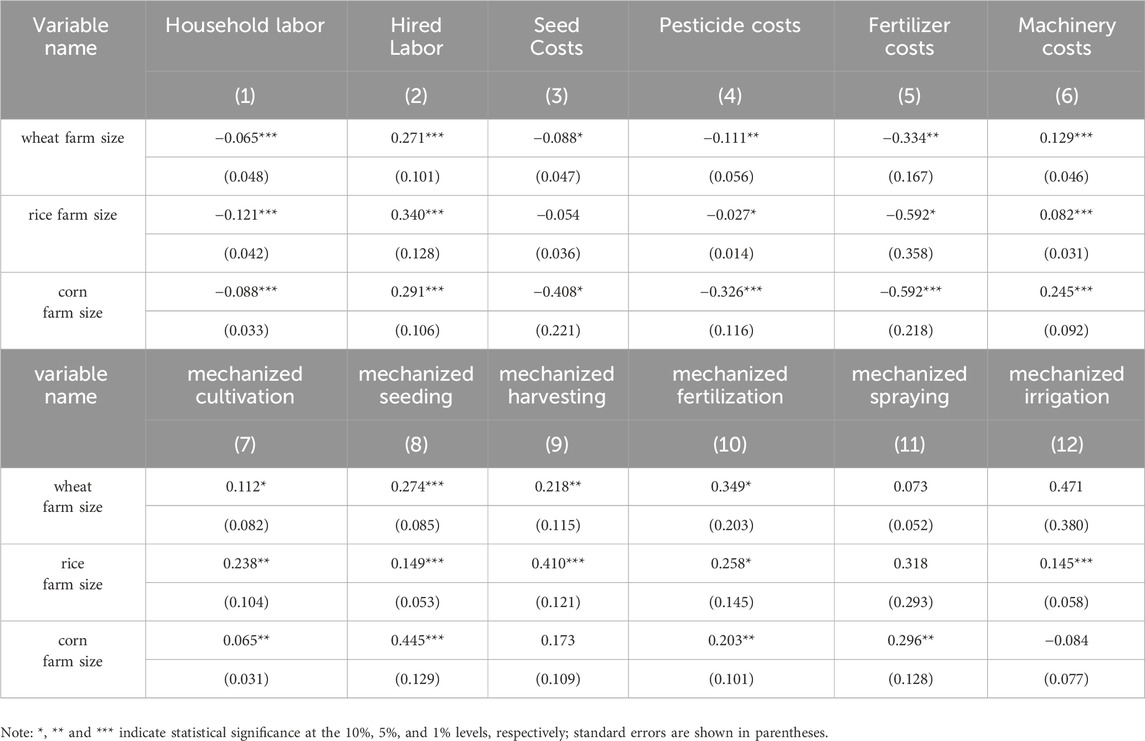
Table 9. The relationship between crop farm size, input factors and the adoption of machinery technology.
Wheat has a shorter growth period and strong adaptability to the environment, requiring larger power-driven equipment for cultivation and harvesting. Power-intensive machinery ensures the stability and continuity of operations, but due to the relatively simple growth characteristics of wheat, the effect of control-intensive technology on improving yield is weaker. Rice, which requires a large amount of water and often grows in muddy environments, needs machinery with sufficient power to ensure efficient operations, especially in the transplanting links, where power-intensive machinery is crucial for improving operational efficiency. Corn has a longer growth period, deeper roots, and is more sensitive to climate and soil conditions. The proper application of control-intensive machinery technology is essential. Control-intensive technology not only enhances planting precision but also optimizes production conditions and finely tunes the growth process, significantly improving corn land yield, with results superior to those for wheat and rice.
To further identify the relationship between the machinery technology in different production links and the technical level of farmers, this study estimates the Total Factor Productivity (TFP) of 2,871 sample farmers using the Solow residual method. The farmers are then divided into five groups according to their farm sizes, with the mean values taken for each group (Sheng et al., 2015; Wang et al., 2020). The specific calculation method is as follows:
As shown in Equation 16, 17,
The regression results in Table 10 show that the land output elasticities for the three grain crops are 27.8%, 30.6%, and 34.1%, respectively, while the labor input elasticities are 10.9%, 16.5%, and 18.4%, respectively. The capital input elasticities are 45.0%, 31.5%, and 29.8%, respectively. Overall, the output elasticity of labor is relatively small, while the output elasticity of capital is relatively high, indicating that capital and intermediate goods play an increasingly important role in grain production.
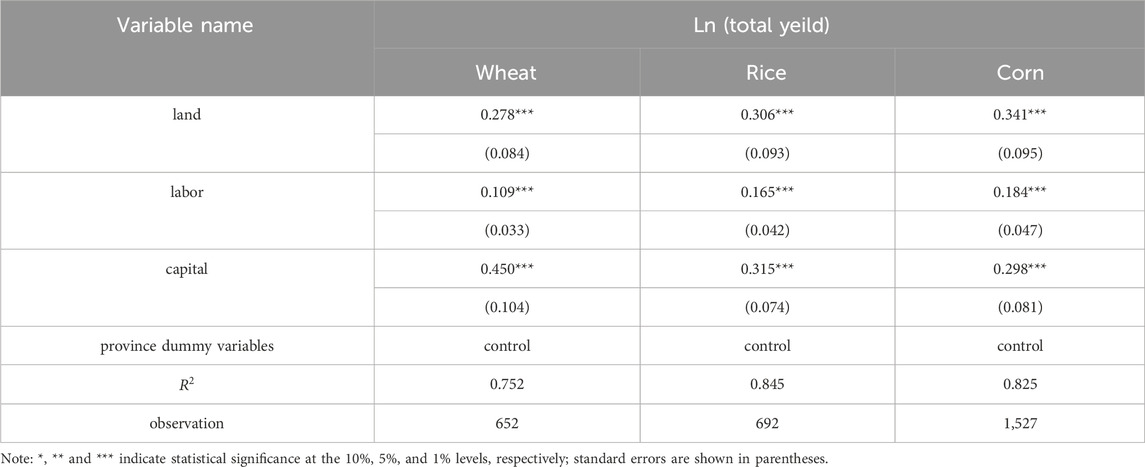
Table 10. The output elasticity of production factors at the farmer level.
The analysis shows that for wheat, TFP increases with the expansion of farm size, reaching its maximum between 100 and 200 mu, but decreases beyond 200 mu (As shown in Figure 2). For sizes below 10 mu, the impact of machinery on TFP at different links is not significant, but as the farm size increases, machinery in harvesting, fertilization, and spraying significantly improves TFP. For rice, the TFP index is highest in the 30–100 mu range and declines beyond 100 mu (As shown in Figure 3). As the farm size expands, machinery in seeding, fertilization, and irrigation significantly enhances TFP. In corn production, TFP increases with farm size, although the growth rate slows after 200 mu (As shown in Figure 4). Machinery in spraying, fertilization, and seeding has a strong effect on improving TFP. In conclusion, the impact of Machinery technology on TFP varies across different crops and links. As the farm size increases, machinery in labor-intensive links such as seeding, spraying, and fertilization has a more significant effect on enhancing farmers’ TFP.
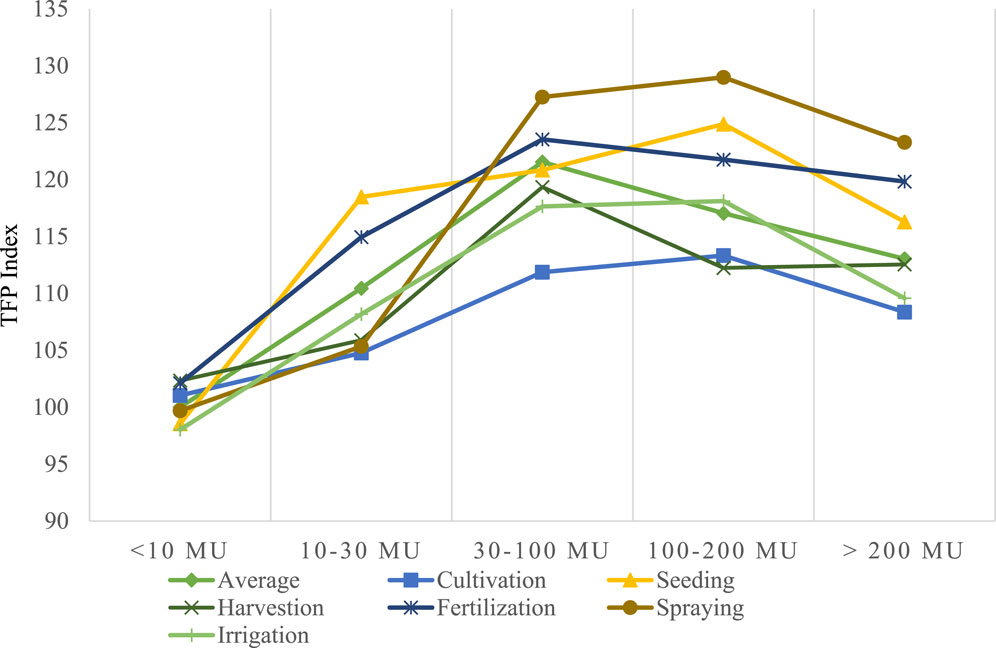
Figure 2. Adoption of machinery technology in different production links and its distribution of farmers’ TFP index (Wheat).
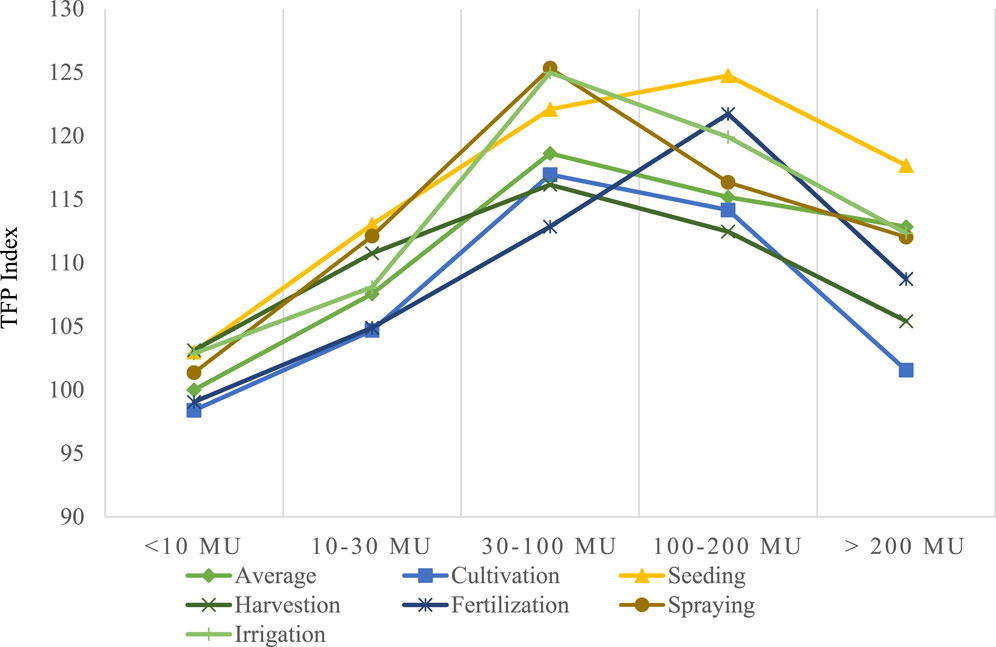
Figure 3. Adoption of Machinery technology in different production links and its distribution of farmers’ TFP index (Rice).
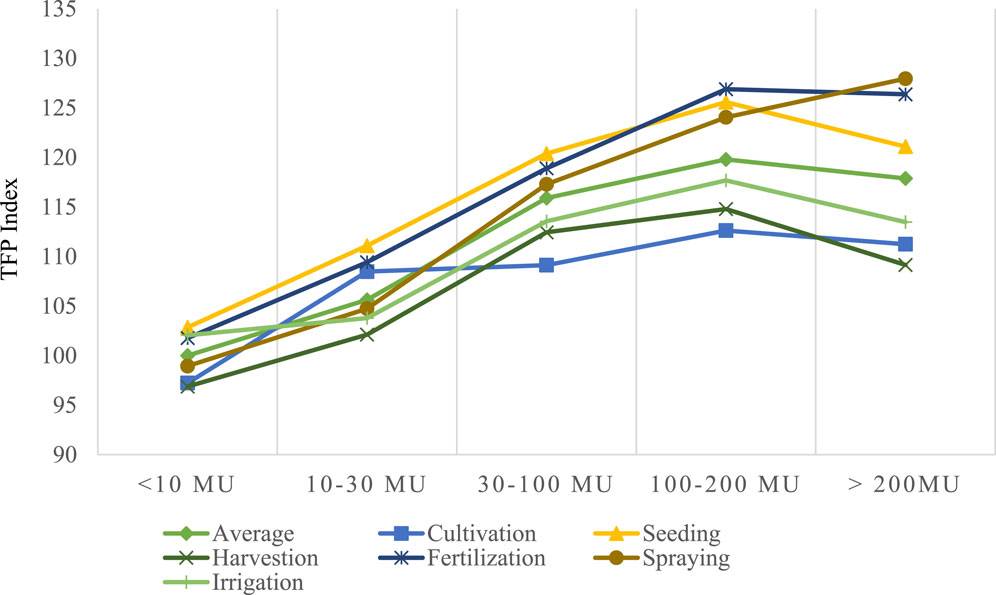
Figure 4. Adoption of Machinery technology in different production links and its distribution of farmers’ TFP index (Corn).
Overall, the expansion of farm size helps improve farmers’ technical levels, but its effect has certain limits. The peak TFP index for wheat and rice is found in the 100–200 mu and 30–100 mu ranges, respectively. Beyond these ranges, farmers’ TFP indices begin to decline. While the TFP index for corn continues to grow with the expansion of farm size, the growth trend becomes less pronounced beyond 200 mu. In terms of the adoption of machinery, when farmers have a small farm size, the impact of machinery in different production links on technical levels is not significant. However, once the farm size exceeds a certain threshold, machinery in seeding, fertilization, and spraying has a significant impact on farmers’ technical levels, while machinery in cultivation, harvesting, and irrigation shows less impact. This suggests that, comparatively, power-intensive machinery technologies have a greater effect on labor substitution and cost reduction in grain production, while control-intensive machinery technologies play a more significant role in promoting farmland scale management.
6 Discussion
This study reveals that while farmland scale management significantly increases land yield through the adoption of more advanced machinery technologies, large-scale farmers still exhibit certain productivity disadvantages compared to smallholder farmers. This discrepancy may be related to the prevalence of left-behind elderly and women in rural China. In the absence of sufficient non-agricultural employment opportunities, surplus labor increases labor input and management precision per unit of land, factors that cannot be fully captured by the model. This study aligns with the findings of Otsuka et al. (2016), Liu and Violette. (2016), and Foster and Rosenzweig (2022), indicating that the adoption of machinery technologies effectively mitigates the “inverse relationship” between farm size and land yield. However, this study further highlights that machinery technologies in different links of production have varying emphases on factor substitution and technological progress. For instance, machinery in control-intensive links such as seeding, fertilization, and spraying is more effective in shifting the production Frontier, particularly for large-scale farmers, whereas machinery in traditional links like cultivation and harvesting primarily substitutes labor and has a relatively limited impact on increasing grain yields. Although control-intensive machinery technologies offer greater advantages in terms of yield improvement and potential, their adoption rate among farmers remains relatively low. This is primarily due to the fact that control-intensive machinery technologies need to be integrated with advanced biotechnologies, requiring higher levels of technical expertise and operational skills, which significantly increases the cost of adoption. For example, the price of precision fertilization machinery (100,000 to 300,000 yuan) and spraying drones (100,000 to 200,000 yuan) is typically several times higher than that of cultivation and harvesting machinery (30,000 to 50,000 yuan).
Additionally, compared to smallholder farmers, large-scale farmers are not only more likely to adopt new machinery technologies but also demonstrate higher efficiency in utizing these technologies, operating closer to the production Frontier. This conclusion differs from the findings of Kagin et al. (2015) in Mexico and Bangladesh, where large-scale farmers faced greater difficulties in accessing modern agricultural machinery due to poor infrastructure and transportation conditions, resulting in lower technical efficiency. This discrepancy may be attributed to China’s rapidly developing agricultural machinery socialization service system, which has effectively increased the adoption rate of mechanization among farmers. Consequently, large-scale farmers can compensate for their productivity disadvantages through the widespread application of machinery technologies. The limitations of this study include: First, the research sample only includes cross-sectional data from 1 year. Although the sample has a high proportion of large-scale farmers, the lack of long-term time-series data prevents an assessment of the dynamic impact of machinery technology advancements on the relationship between farm size and crop yield over different time periods. Second, although machinery technologies have the potential to mitigate or even reverse the “inverse relationship,” their adoption methods include purchasing agricultural machinery and purchasing machinery services. However, this study does not distinguish between the differences of these two approaches.
7 Research conclusion and policy recommendations
Farmland scale management is an important means of increasing farm household income and advancing agricultural modernization. However, whether its development poses a threat to China’s food security still requires further examination. A popular view in development economics suggests a classic “inverse relationship” between farm size and land yield. However, with the advancement of agricultural Machinery technology, this view may be challenged. The impact of farm size on land yield is a result of the combined effects of changes in returns to scale, marginal factor inputs, and technological progress. Existing research primarily focuses on the substitution effect of machinery technology on labor, with insufficient characterization of technological progress related to farm size, which may lead to biases in studies on the relationship between farm size and land yield. Building on this, our study further identifies the significant role of agricultural machinery in promoting technological advancement. This not only deepens the multidimensional understanding of agricultural machinery but also provides new perspectives and insights for the theoretical exploration of farmland scale management. The research findings indicate that, prior to incorporating machinery technology variables, an “inverse relationship” existed between farm size and land yield for wheat, rice, and corn. After introducing the machinery technology variables, the coefficient for wheat farm size changed from −0.052 to 0.047, the coefficient for rice farm size shifted from −0.062 to −0.053, and the coefficient for corn farm size transformed from −0.132 to 0.085. This demonstrates that machinery technology has reversed the “inverse relationship” for corn, while only mitigating it for wheat and rice. Furthermore, after considering the impact of technical efficiency loss and adjusting the farm size coefficient, the relationship between farm size and crop yield does not show significant changes. In specific production links, when farm size is small, machinery mainly serves as a substitute for labor in various production links. However, as the farm size expands, machinery in control-intensive links (as opposed to power-intensive links) becomes more beneficial for increasing crop yield.
The farmland scale management is not in conflict with high yields per unit of land. However, the development of large-scale farming relies on advancements in machinery technology. Expanding the farm size helps with the application of new technologies and increases crop yields, thereby ensuring food security in China. However, there are limits to the development of farmland scale management, and excessively large sizes may not be conducive to efficient food production. Therefore, moderate-scale farming not only aligns with China’s “large population and limited land” resource endowment, but also helps increase farmers’ incomes and ensures food security. Against the backdrop of a declining agricultural labor force, the mechanization of power-intensive production links has been widely adopted, significantly enhancing the stability of agricultural production. However, the application of control-intensive machinery technologies, such as precision fertilization and drone-based plant protection, involves higher costs and demands greater technical skills and knowledge, which limits their adoption among smallholder farmers. Although these technologies can significantly improve production efficiency and resource utilization, their high initial investment and operational costs pose economic barriers for many farmers. To promote the adoption of control-intensive machinery technologies, the government should reduce farmers’ input costs through policy subsidies. First, differentiated subsidy policies should be provided for farmers of different farms, with priority given to small and medium-sized farmers. Second, technical training and support should be offered alongside subsidies to help farmers master the operation and maintenance skills of control-intensive machinery technologies.
Data availability statement
The original contributions presented in the study are included in the article/supplementary material, further inquiries can be directed to the corresponding author.
Author contributions
WZ: Conceptualization, Data curation, Formal Analysis, Funding acquisition, Investigation, Methodology, Project administration, Resources, Software, Supervision, Validation, Visualization, Writing – original draft, Writing – review and editing.
Funding
The author(s) declare that financial support was received for the research and/or publication of this article. Major Project of Anhui Provincial Department of Education: “Research on the New Endogenous Development Mechanism and Path Optimization for Rural Revitalization in the Dabie Mountain Revolutionary Old Area of Anhui” (2022AH040140); Project of Anhui Federation of Social Sciences: “Research on the Mechanism and Policy for Cultivating New Agricultural Business Entities in Anhui from the Perspective of Chinese-style Agricultural Modernization” (2023CXZ016).
Acknowledgments
The authors are grateful to Nanjing Agricultural University (NAJU) and Institute of Rural De-velopment, Chinese Academy of Social Sciences (CASS).
Conflict of interest
The author declares that the research was conducted in the absence of any commercial or financial relationships that could be construed as a potential conflict of interest.
Generative AI statement
The author(s) declare that no Generative AI was used in the creation of this manuscript.
Publisher’s note
All claims expressed in this article are solely those of the authors and do not necessarily represent those of their affiliated organizations, or those of the publisher, the editors and the reviewers. Any product that may be evaluated in this article, or claim that may be made by its manufacturer, is not guaranteed or endorsed by the publisher.
Footnotes
1To facilitate explanation, most existing studies on the relationship between farm size and land yield per unit assume constant returns to scale (CRS) for the factors of production. However, in reality, returns to scale generally show a decreasing trend. Nevertheless, returns to scale cannot be incorporated as a variable in econometric models, which leads to potential bias in the coefficient for farm size. Despite this, the coefficient for farm size remains valuable for the following reasons: First, the diminishing returns to scale in agricultural production factors are widely accepted. While the coefficient for farm size may be biased to some extent, it can still provide a relatively clear overall trend and offers a reasonably valid explanation. Second, diminishing returns to scale are related to technological progress, and technological progress may be a result of decreasing returns to scale. Since it is difficult to evaluate the two factors independently, the combined effect is an acceptable outcome.
2The World Bank defines smallholder farmers and large-scale farmers based on a farm size of 30 mu (2 ha), and this study will also use this standard.
3In 2020, the National Bureau of Statistics of China released data showing that the yield per mu for wheat was 383 kg, for rice was 470 kg, and for corn was 421 kg.
4The specific calculation methods and procedures are based on (Belotti et al., 2013).
References
Abay, K. A., Abate, G. T., Barrett, C. B., and Bernard, T. (2019). Correlated non-classical measurement errors, ‘Second best’ policy inference, and the inverse size-productivity relationship in agriculture. J. Dev. Econ. 139, 171–184. doi:10.1016/j.jdeveco.2019.03.008
Adamopoulos, T., and Restuccia, D. (2014). The size distribution of farms and international productivity differences. Am. Econ. Rev. 104 (6), 1667–1697. doi:10.1257/aer.104.6.1667
Alvarez, A., and Arias, C. (2003). Technical efficiency and farm size: a conditional analysis. Agric. Econ. 30 (3), 241–250. doi:10.1016/j.agecon.2003.04.001
Aragón, F. M., Restuccia, D., and Rud, J. P. (2022). Are small farms really more productive than large farms? J. Food Policy 106, 102168. doi:10.1016/j.foodpol.2021.102168
Assunção, J. J., and Braido, L. H. B. (2007). Testing household-specific explanations for the inverse productivity relationship. Am. J. Agric. Econ., 89(4): 980–990. doi:10.1111/j.1467-8276.2007.01032.x
Assuncao, J. J., and Ghatak, M. (2003). Can unobserved heterogeneity in farmer ability explain the inverse relationship between farm size and productivity. Econ. Lett. 80 (2), 189–194. doi:10.1016/S0165-1765(03)00091-0
Ayaz, M., and Mughal, M. (2024). Farm size and productivity: the role of family labor. Econ. Dev. Cult. Change 72 (2), 959–995. doi:10.1086/721837
Barrett, C. B., Bellemare, M. F., and Hou, J. Y. (2010). Reconsidering conventional explanations of the inverse productivity–size relationship. World Dev. 38, 88–97. doi:10.1016/j.worlddev.2009.06.002
Battese, G., and Broca, S. (1997). Functional forms of stochastic frontier production functions and models for technical inefficiency effects: a comparative study for wheat farmers in Pakistan J. J. Prod. Analysis 8, 395–414. doi:10.1023/A:1007736025686
Berry, A. R., Cline, W. R., and Baron, D. (1980). Agrarian structure and productivity in developed countries J. Agric. Econ. Res. 32 (1), 56. doi:10.1016/S0140-6736(11)61681-4
Bevis, L. E. M., and Barrett, C. B. (2020). Close to the edge: high productivity at plot peripheries and the inverse size-productivity relationship. J. Dev. Econ., 143: 102377. doi:10.1016/j.jdeveco.2019.102377
Carletto, C., Savastano, S., and Zezza, A. (2013). Fact or artifact: the impact of measurement errors on the farm size–productivity relationship. J. Dev. Econ. 103, 254–261. doi:10.1016/j.jdeveco.2013.03.004
Carter, M. R. (1984). Identification of the inverse relationship between farm size and productivity: an empirical analysis of peasant agricultural production J. Oxf. Econ. Pap. 36 (1), 131–145. doi:10.1093/oxfordjournals.oep.a041621
Chaianov, A. V. (1986). AV Chayanov on the theory of peasant economy. China, Manchester University Press.
Collier, P. (1983). Malfunctioning of African rural factor markets: theory and a Kenyan example J. Oxf. Bull. Econ. and Statistics 45 (2), 141–172. doi:10.1111/j.1468-0084.1983.mp45002001.x
Ellis, F. (1993). Peasant economics: farm households in agrarian development. Cambridge, Cambridge University Press.
Eswaran, M., and Kotwal, A. (1986). Access to capital and agrarian production organisation. Econ. J. 96 (382), 482–498. doi:10.2307/2233128
Fan, H. Z., and Zhou, Q. L. (2014). The relationship between farmers' land planting area and land productivity: based on survey data from farmers in seven counties (cities) in central and western China. J. China Popul. Resour. Environ. 24 (12), 38–45. (in Chinese).
Feder, G. (1985). The relation between farm size and farm productivity: the role of family labor, supervision and credit constraints J. J. Dev. Econ. 18 (2-3), 297–313. doi:10.1016/0304-3878(85)90059-8
Foster, A. D., and Rosenzweig, M. R. (2022). Are there too many farms in the world? Labor market transaction costs, machine capacities, and optimal farm size J. J. Political Econ. 130 (3), 636–680. doi:10.1086/717890
Gautam, M., and Ahmed, M. (2019). Too small to be beautiful? The farm size and productivity relationship in Bangladesh J. Food Policy 84, 165–175. doi:10.1016/j.foodpol.2018.03.013
Gong, B., Zhang, S. R., Wang, S., et al. (2020). A review of agricultural technological progress in the 70 Years since the founding of new China. Issues Agric. Econ. (06), 11–29. (in Chinese).
Gourlay, S., Kilic, T., and Lobell, D. B. (2019). A new spin on an old debate: errors in farmer-reported production and their implications for inverse scale - productivity relationship in Uganda. J. Dev. Econ. 141, 102376. doi:10.1016/j.jdeveco.2019.102376
Han, Z. (2023). The original intention of agricultural scale management from the perspective of farming income. Econ. Dyn. (03), 52–65. (in Chinese).
Helfand, S. M., and Taylor, M. P. H. (2021). The inverse relationship between farm size and productivity: refocusing the debate. Food Policy 99, 101977. doi:10.1016/j.foodpol.2020.101977
Heltberg, R. (1998). Rural market imperfections and the farm size— productivity relationship: evidence from Pakistan. World Dev. 26 (10), 1807–1826. doi:10.1016/S0305-750X(98)00084-9
Hu, Y., and Zhang, Z. (2018). Does agricultural machinery service affect the technical efficiency of wheat production? China Rural. Econ. (05), 68–83.
Huang, J., and Ding, J. (2016). Institutional innovation and policy support to facilitate small-scale farming transformation in China. Agric. Econ. 47 (S1), 227–237. doi:10.1111/agec.12309
Ji, Y., and Zhong, F. (2013). Non-agricultural employment and farmers' use of agricultural machinery services. J. Nanjing Agric. Univ. Soc. Sci. Ed. 13 (05), 47–52.
Julien, J. C., Bravo-Ureta, B. E., and Rada, N. E. (2019). Assessing farm performance by size in Malawi, Tanzania, and Uganda. Food Policy 84, 153–164. doi:10.1016/j.foodpol.2018.03.016
Kagin, J., Taylor, J. E., and Yúnez-Naude, A. (2016). Inverse productivity or inverse efficiency? Evidence from Mexico J. J. Dev. Stud. 52 (3): 396–411. doi:10.1080/00220388.2015.1041515
Key, N. (2019). Farm size and productivity growth in the United States Corn Belt. Food Policy 84, 186–195. doi:10.1016/j.foodpol.2018.03.017
Kumbhakar, S. C., and Lovell, C. A. K. (2003). Stochastic frontier analysis. Cambridge, Cambridge University Press. doi:10.1007/978-981-10-3450-3_9-2
Li, G., Feng, Z., and Fan, L. (2010). Are small farmers really more efficient? Empirical evidence from Hubei Province. Econ. Q. 9 (01), 95–124.
Liu, Y., and Violette, A. (2016). Structural transformation and intertemporal evolution of real wages, machine use, and farm size€ productivity relationships in Vietnam: J. Ifpri Discussion Papers.
Lucas, R. E. (1978). On the size distribution of business firms. Bell J. Econ. 9, 508–523. doi:10.2307/3003596
Mandal, M. A. S. (2002). Agricultural machinery manufacturing and farm mechanization: a case of rural non-farm economic development in Bangladesh. Int. Workshop Foster. Rural Econ. Dev. through Agriculture-based Enterp. Serv. 19, e22.
Muyanga, M., and Jayne, T. S. (2019). Revisiting the farm size-productivity relationship based on a relatively wide range of farm sizes: evidence from Kenya. Am. J. Agric. Econ. 101 (4), 1140–1163. doi:10.1093/ajae/aaz003
Omotilewa, O. J., Jayne, T. S., Milu, M., Adebayo, B. A., Lenis, S., Titus, A., et al. (2021). A revisit of farm size and productivity: empirical evidence from a wide range of farm sizes in Nigeria. World Dev. 146, 105592. doi:10.1016/j.worlddev.2021.105592
Otsuka, K., Nakano, Y., and Takahashi, K. (2016). Contract farming in developed and developing countries. Annu. Rev. Resour. Econ. 8, 353–376. doi:10.1146/annurev-resource-100815-095459
Pingali, P. (2007). Chapter 54 agricultural mechanization: adoption patterns and economic impact. Handb. Agric. Econ. 3, 2779–2805. doi:10.1016/S1574-0072(06)03054-4
Rada, N., Helfand, S., and Magalhães, M. (2019). Agricultural productivity growth in Brazil: large and small farms excel J. Food policy 84, 176–185. doi:10.1016/j.foodpol.2018.03.014
Sheng, Y., and Chancellor, W. (2019). Exploring the relationship between farm size and productivity: evidence from the Australian grains industry. Food Policy 84, 196–204. doi:10.1016/j.foodpol.2018.03.012
Sheng, Y., Zhao, S., Nossal, K., and Zhang, D. (2015). Productivity and farm size inAustralian agriculture: reinvestigating the returns to scale. Aust. J. Agric. Resour. Econ. 59 (1), 16–38. doi:10.1111/1467-8489.12063
Valtiala, J., Niskanen, O., Torvinen, M., Riekkinen, K., and Suokannas, A. (2023). The relationship between agricultural land parcel size and cultivation costs. Land Use Policy, 131, 106728. doi:10.1016/j.landusepol.2023.106728
Wang, H. J., and Schmidt, P. (2002). One-step and two-step estimation of the effects of exogenous variables on technical efficiency levels J. J. Prod. Analysis 18, 129–144. doi:10.1023/A:1016565719882
Wang, J., Chen, Z., Huang, Z., et al. (2015). A re-examination of the relationship between land productivity and household operation scale during the transition period. Manag. World (09), 65–81.
Wang, L., Yang, R. D., and Wu, B. (2020). Research on total factor productivity in agricultural production of Chinese farmers. Manag. World 36 (12), 77–93. doi:10.19744/j.cnki.11-1235/f.2020.0185
Xu, Q., Yin, R., and Zhang, H. (2011). Economies of scale, returns to scale, and moderate-scale farming in agriculture: an empirical study based on China's grain production. Econ. Res. J. 46 (03), 59–71+94. doi:10.1111/j.1468-0084.2008.00503.x
Yan, J., Yang, Z., Li, Z., Li, X., Xin, L., and Sun, L. (2016). Drivers of cropland abandonment in mountainous areas: a household decision model on farming scale in Southwest China. Land Use Policy 57, 459–469. doi:10.1016/j.landusepol.2016.06.014
Yan, Y. (2019). Unintended land use effects of afforestation in China's grain for green program[J]. Am. J. Agric. Econ. 101, 1047–1067. doi:10.1093/ajae/aay107
Yang, Z., Zhang, J., and Zhu, P. (2019). Can agricultural social services promote small farmers' integration with agricultural modernization? A perspective based on technical efficiency. Agric. Technol. Econ. (09), 16–26.
Yu, P., Fennell, S., Chen, Y., Liu, H., Xu, L., Pan, J., et al. (2022). Positive impacts of farmland fragmentation on agricultural production efficiency in Qilu Lake watershed: implications for appropriate scale management. Land Use Policy, 117. 106108. doi:10.1016/j.landusepol.2022.106108
Zhang, D., Xu, Z., and Liu, J. (2022). Outsourcing and land transfer: does the scaling-up of operational services delay the scaling-up of farmland management? A perspective based on factor constraint alleviation and rising land rents. China Rural. Obs. (02), 19–38.
Zhang, W., Cao, G., Li, X., Zhang, H., Wang, C., Liu, Q., et al. (2016). Closing yield gaps in China by empowering smallholder farmers. Nature 537 (7622), 671–674. doi:10.1038/nature19368
Zhang, Z., and Yi, Z. (2015). The impact of agricultural production service outsourcing on rice productivity: an empirical analysis based on 358 farmers. Agric. Econ. Issues 36 (10), 69–76.
Zheng, X., and Xu, Z. (2017). Resource endowment constraints, factor substitution, and induced technological change: a case study of mechanization in China's grain production. Econ. Q. 16 (01), 45–66.
Keywords: farm size, land yield, machinery technology, power-intensive, control-intensive
Citation: Zhang W (2025) The impact of agricultural farmland scale management on land yield: a perspective based on the adoption of agricultural machinery in different production links. Front. Environ. Sci. 13:1573394. doi: 10.3389/fenvs.2025.1573394
Received: 09 February 2025; Accepted: 26 March 2025;
Published: 09 April 2025.
Edited by:
Kun Jia, Beijing Normal University, ChinaReviewed by:
Kumudini Verma, Indira Gandhi Krishi Vishwavidyalaya, IndiaDongying Xie, Jilin University, China
Yanjun Jiang, Southwest Forestry University, China
Copyright © 2025 Zhang. This is an open-access article distributed under the terms of the Creative Commons Attribution License (CC BY). The use, distribution or reproduction in other forums is permitted, provided the original author(s) and the copyright owner(s) are credited and that the original publication in this journal is cited, in accordance with accepted academic practice. No use, distribution or reproduction is permitted which does not comply with these terms.
*Correspondence: Wenrui Zhang, MjAxOTIwNjAxOEBzdHUubmphdS5lZHUuY24=