 Wei Sun1
 Qiang Li
 Ijaz Uddin
- 1Department of Business Administration, Shandong College of Economics and Business, Weifang, China
- 2School of Humanities and Social Sciences, North China Electric Power University, Beijing, China
- 3Department of Economics, Abdul Wali Khan University Mardan, Khyber Pakhtunkhwa, Pakistan
Financial inclusion (FI) and technological innovation (TI) are pivotal in advancing SDG 13 (Climate Action) by enabling access to sustainable solutions and promoting low-carbon technologies. FI allows marginalized communities and businesses to invest in renewable energy (RE) and energy-efficient technologies, while TI drives the development of clean energy solutions and CO2 emissions (CO2E) reducing innovations. Together, they empower societies to take significant action against climate change, fostering a global transition to a low-carbon economy and helping achieve the targets of SDG 13. Previous studies have focused exclusively on the impact of either FI or TI on CO2E in China under the N-shaped Environmental Kuznets Curve (EKC). To address this gap, the current study examines the combined effects of FI and TI on CO2E within the EKC framework for the Chinese economy. This study utilizes the Autoregressive Distributed lag (ARDL), fully Modified ordinary least square (FMOLS), and Dynamic ordinary least square (DOLS) methods by using the time series quarterly data from 2006Q1 to 2022Q4. The ARDL long-run and short-run results confirm that there is an inverted N-shaped EKC between GDP and CO2E. While FI, TI, and RE have negative effects on CO2E. This study has several policy recommendations for policymakers to promote environmental sustainability in China.
1 Introduction
One of the most significant environmental challenges influencing the long-term, sustainable economic growth of almost every country in the world is climate change (CC). The most controversial issues nowadays are environmental degradation, CC, and global warming. The aforementioned factors are the primary causes of the average global temperature increase and the incidence of severe weather. CC, CO2 emissions (CO2E), and global warming are the leading causes of distortions in consumption and production activities (Uddin et al., 2023). The rise in CO2E poses a critical threat to the environment and the planet. These emissions primarily result from human activities, including burning fossil fuels for energy, industrial processes, and deforestation. The escalating CO2E levels intensify the greenhouse effect, trapping heat in the atmosphere and driving a steady increase in global temperatures (Le and Pham, 2024). Moreover, CO2E is regarded as one of the fundamental markers of pollution. According to the literature, CO2E comes from two primary sources. The primary source of CO2E is natural processes, including respiration, decomposition, and ocean discharge. Industrial pollution further exacerbated the unsafe amounts of CO2E that have been absorbed by the atmosphere due to human activity. Human activities, including burning fuels like coal, oil, natural gas, cement, and deforestation, are the second source of CO2E (Azam et al., 2022). China, as the world’s largest emitter of carbon dioxide (CO2), accounted for over 31% of global CO2 emissions in 2022, highlighting its substantial influence on the global carbon footprint (Statista, 2022). This stems from its status as the world’s most populous country and its rapid economic development, which relies heavily on energy-intensive industries and fossil fuel consumption. Power generation, manufacturing, and transportation sectors contribute significantly to these emissions, with coal being a primary energy source. China’s role in climate change mitigation is critical due to its sheer share of emissions. The country has made efforts to transition towards renewable energy, becoming a global leader in solar, wind, and electric vehicle technologies. Despite these advances, its reliance on coal for energy production continues to pose challenges.
As the global community advances toward sustainable development and poverty eradication, financial inclusion (FI) has become a crucial priority. Ensuring access to formal financial services is increasingly recognized as a vital means of empowering individuals and communities—especially in developing countries, where many people still lack connection to the formal financial system (Razzaq et al., 2024). According to Verma and Giri (2024) reported that FI indicators highly influence income inequality disparity in Asian economies. FI is also one of the most important tools for reducing CO2E by providing access to green financing and promoting renewable energy adoption. It enables individuals and businesses to transition to sustainable practices, reducing dependence on fossil fuels. This promotes environmentally friendly economic growth and mitigates CC. According to Le and Pham (2024), there have been conflicting findings on the relationship between environmental sustainability and FI. Numerous writers agree that FI lowering the CO2E helps mitigate CC and promote environmental sustainability. Finance plays a part in allocating resources as efficiently as possible. With more logical and effective distribution, the growth of finance can help resources go to green industries. Households are, therefore, more likely to access and invest in green energy when financial resources are readily available. FI benefits companies by lowering the cost of updating eco-friendly machinery and industrial methods, which encourages the adoption of green initiatives. According to Qin et al. (2021), Zheng and Li (2022), Shahbaz et al. (2022), and Hussain et al. (2024) found that FI raises environmental sustainability and reduces CO2E. Conversely, increasing financial inclusion may result in higher CO2E by improving access to money for both individuals and societies, accelerating environmental deterioration, and lowering environmental quality; financial inclusion can increase the total capacity for industrial output. Increasing production levels frequently results in increased energy consumption and, therefore, higher CO2 emissions; they argue that although financial inclusion may encourage and enhance production and industrial activities, it can also raise carbon emissions (Le and Pham, 2024). According to Le et al. (2020), Zaidi et al. (2021), Mehmood (2022), Tsimisaraka et al. (2023), and Cheikh and Rault (2024) found that FI raises environmental pollution.
Technological innovation (TI) is one of the most effective tools for reducing CO2E, as it enhances energy efficiency, promotes renewable energy adoption, and introduces cleaner production techniques. It drives the transition from traditional carbon-intensive methods to sustainable alternatives, enabling industries to minimize their environmental footprint. More government officials and academics are realizing the importance of technical innovation in lowering CO2E as their intensity increases (Saqib et al., 2023). Recent research highlights the crucial role of technological innovation in reducing CO2E emissions, mainly through patents, which are seen as key indicators of sustainable advancements Chen and Lee (2020), Cheng et al. (2021), Wang et al. (2019), Yu and Du (2019), Bilal et al. (2021) and Abid et al. (2022). China is currently the largest market in the world for environmental technology products and services, with a market size exceeding $260 billion in 2022. More than 86% of Guangdong’s total operating income from environmental technologies was generated by the subsectors of the environmental technologies industry that produced the vast majority of goods and services, including solid waste disposal, recycling, and water and wastewater treatment solutions. Despite the province’s vast geographic area, most of Guangdong’s environmental businesses are centered in Guangzhou, Foshan, Shenzhen, Dongguan, and Zhongshan (China Environmental Technologies, 2024).
Recent discussions highlight a growing interest in understanding the influence of FI and TI on CO2E, given their critical role in sustainable development. Despite this increasing attention, existing studies present mixed and often inconclusive findings regarding their relationship. Moreover, most research has primarily focused on their individual effects rather than their combined impact, particularly in the context of China. Additionally, previous studies have largely overlooked the potential existence of an N-shaped EKC in the FI, TI and CO2E nexus. The N-shaped EKC framework suggests that CO2E may initially rise with economic growth, then decline as advancements in TI and FI improve environmental outcomes, but could eventually rise again due to structural changes or increased resource consumption. Given this gap in the literature, a comprehensive examination of these relationships is necessary to provide a clearer understanding of their dynamics in China. Therefore, this study aims to investigate the impact of FI and TI on CO2E within the N-shaped EKC framework, focusing specifically on the Chinese context. Our research seeks to address the following key questions.
How does FI affect CO2E?
How does TI affect CO2E?
Does an N-shaped EKC exist or not?
The Chinese government’s launch of the “Plan for Promoting the Development of Inclusive Finance” in 2015 has significantly expanded digital financial inclusion in China (Lai et al., 2020). According to this plan, financial inclusion aims to ensure that financial institutions provide access to financial products and services to all population segments within their jurisdictions based on principles of equal opportunity, commercial sustainability, and cost-effectiveness. Additionally, the surge in global demand following the pandemic has accelerated the adoption of digital channels, with governments, businesses, and the public showing heightened interest in fintech solutions. Inclusive finance services particularly aim to support disadvantaged groups, such as farmers, the elderly, and low-income populations (Liu et al., 2024; Becha et al., 2025). This study makes several significant contributions to the existing literature. First, it examines the impact of FI and TI on CO2E in China, an area that has been largely overlooked in previous research. While prior studies have explored various determinants of CO2E, the role of FI and TI in shaping environmental outcomes in the Chinese context remains underexplored. By addressing this gap, our study provides new insights into how these factors influence CO2E. Second, this research tests the existence of an N-shaped EKC for China while incorporating FI and TI into the analysis. However, the potential for an N-shaped EKC, where CO2E may rise again after a decline, has not been thoroughly examined, particularly in the presence of FI and TI. By integrating these variables into the EKC framework, this study offers a more comprehensive understanding of the dynamics shaping CO2E in China. Third, this study extends the analysis by investigating the combined effects of FI, TI, and renewable energy on CO2E under the N-shaped EKC framework. Previous research has often treated these factors in isolation, failing to account for their interactive effects on environmental outcomes. By examining their joint influence, this study provides a more holistic perspective on the mechanisms through which FI, TI, and renewable energy impact CO2E. The analysis spans from 2006Q1 to 2022Q4, ensuring a robust and up-to-date assessment of these relationships. Finally, the study’s findings offer valuable insights for policymakers seeking to balance economic growth with environmental sustainability. By identifying the roles of FI, TI, and renewable energy in shaping CO2E, this research provides a solid foundation for designing targeted policies that promote sustainable development in China.
The rest of the study is structured as follows: Section 2 reviews the relevant literature, while Section 3 outlines the model, methodology, and data. Section 4 presents the findings and discussion, and Section 5 concludes with policy recommendations.
2 Literature review
2.1 Financial inclusion and CO2E nexus
Le et al. (2020) analyzed the impact of FI on CO2E in Asia using data from 31 countries between 2004 and 2014. Principal Component Analysis (PCA) was used to create FI indicators. The results revealed that income, energy use, urbanization, industrialization, and FI increased CO2E. In contrast, greater trade openness was found to reduce emissions. The study demonstrated that the results remained robust to alternative FI proxies and model specifications. Notably, the study found no synergies between FI and CO2 reduction policies. As a result, FI should be integrated into climate adaptation strategies at all levels to mitigate its environmental impact. Zaidi et al. (2021) examined the dynamic relationships between FI, energy use, CO2E, infrastructure, corruption, and economic growth in 23 OECD countries from 2004 to 2017. The study constructed FI and infrastructure indexes using Principal Component Analysis (PCA). The CS-ARDL method was applied to analyze long-term relationships while accounting for cross-sectional dependence. The results showed a positive relationship between FI, energy use, and CO2E, indicating that FI exacerbates environmental degradation. Infrastructure development and economic growth also contributed to increased emissions. The study emphasized aligning FI strategies with environmental policies to achieve sustainable development goals.
Policymakers were urged to balance FI objectives with energy consumption patterns and environmental regulations. Qin et al. (2021) investigated how FI, globalization, and renewable power generation influenced CO2E in seven developing economies from 2004 to 2016. A panel quantile regression approach was used to account for the non-normality of data. The findings showed that FI significantly reduced emissions at the 25th and 50th quantiles but had no significant effect at the 75th and 95th quantiles. Globalization and renewable power generation consistently reduced CO2E across all quantiles. The Kao and Johansen cointegration tests also validated long-term relationships among the variables. The study confirmed the seven economies' Environmental Kuznets Curve (EKC) hypothesis. Based on these findings, the authors recommended improving FI, encouraging globalization, and increasing renewable energy use to promote sustainable economic growth.
Mehmood (2022) examined the relationship between FI, renewable energy, globalization, and CO2E in South Asia from 1990 to 2017. Using the cross-sectional ARDL technique, the study accounted for cross-sectional dependence in panel data for reliable findings. The Westerlund test confirmed a long-term relationship among the variables. The results showed that FI contributed to rising CO2E, indicating the need to incorporate cleaner environmental measures into FI policies. In contrast, renewable energy use was found to reduce emissions, highlighting its role in environmental sustainability. The study also revealed that globalization and economic growth further increased emissions. Based on the findings, Mehmood advised South Asian countries to update foreign trade policies to reduce environmental degradation. Wang et al. (2022) explored the effect of digital FI on CO2E in 284 Chinese cities at the prefecture level. Using a spatial econometric model, the study assessed digital FI’s local and spillover effects. The findings revealed that digital FI increased CO2E in local cities while reducing emissions in neighboring cities due to spatial spillover effects. Additionally, the study examined the three facets of digital FI (breadth, depth, and usage) and their impacts on CO2E. Mediation analysis showed that industrial structure and economic growth were pathways through which digital FI influenced emissions. The study highlighted regional differences, noting that eastern, western, and northeastern cities benefited more. The findings underscored the importance of region-specific policies to balance FI and environmental sustainability. Liu et al. (2022) investigated the role of FI and education in limiting CO2E in China using the ARDL approach. The study evaluated the impact of five proxies for FI on environmental quality and found that four positively influenced CO2 reduction. Education was also identified as a critical factor in lowering emissions by increasing public awareness and promoting eco-friendly practices. However, research and development activities were found to increase carbon emissions, while GDP and population growth further exacerbated environmental degradation. The authors emphasized the importance of innovation through knowledge in developing energy-efficient technologies. They recommended allocating financial resources to eco-innovations and strengthening environmental education campaigns to combat global warming. The study concluded that education and FI are essential for achieving environmental sustainability.
Zheng and Li (2022) explored the effect of digital FI on CO2E in 30 Chinese provinces from 2013 to 2020. Using instrumental variable regression and GMM, they found that digital FI reduces emissions, mainly through usage depth and digitization level. Heterogeneity analysis revealed more substantial impacts in central regions and low-emission areas. Mechanism tests indicated that digital finance lowers emissions by reducing per capita energy consumption and increasing GDP, supporting its role in achieving carbon neutrality. Shahbaz et al. (2022) studied the role of FI in reducing pollutant and carbon emissions across 30 Chinese provinces from 2011 to 2017. Empirical results showed that FI supports joint reductions in pollutants and CO2E, mainly through energy consumption and renewable energy development. The effects were region-specific, with stronger impacts in less polluted areas. FI indirectly lowered emissions by improving energy structure and consumption patterns, highlighting its potential in provincial and national development plans. Hussain et al. (2023) explored the FI-carbon emissions relationship in 102 countries from 2004 to 2020 using the STIRPAT framework and PCA. The study found an N-shaped EKC relationship, where FI initially increases emissions, then decreases, followed by a rise again. The nonlinear relationship was robust in low-income countries but weak in developed ones. The study recommended well-directed financial policies to improve inclusion while addressing income, governance, and laws disparities. Tsimisaraka et al. (2023) examined the short- and long-term impacts of FI, ICT, renewable energy, globalization, and economic growth on CO2E in the OBOR region. Using the CS-ARDL method with data from 2004 to 2019, the results demonstrated a strong positive correlation between FI, ICT, and CO2E. Renewable energy reduced emissions in both timeframes, while globalization had a long-term negative impact. Economic growth positively affected emissions, highlighting the need for green foreign investment and ICT infrastructure development.
Khan et al. (2023) investigated the impact of digital FI on carbon emissions across 76 emerging markets and developing economies. Using the Global Findex database, they constructed an overall digital FI index and sub-indices. A dynamic two-step system GMM approach was employed, and results showed that digital FI positively impacts carbon emissions. The findings remained robust when using sub-indices and traditional FI as control variables.
Prempeh et al. (2023) specifically examined the impact of banking sector development on environmental degradation in 11 Economic Community of West African States (ECOWAS) by using the Augmented Mean Group (AMG) estimators from 1990 to 2019. They found that banking sector development generally reduces environmental degradation, its associated technological effects tend to worsen environmental quality. Hussain et al. (2024) investigated the FI-carbon emissions nexus in 26 Asian nations, distinguishing between developed and emerging economies. Using PCA for FI indices, the results showed a positive long-term and negative short-term effect of FI on emissions. Cheikh and Rault (2024) analyzed threshold effects of FI on CO2E in 70 nations using panel threshold models. Their findings showed that FI’s impact varies with economic growth. FI increases emissions in low-income regimes, while it improves environmental quality at higher economic stages.
Arshad and Parveen (2024) empirically examined the impact of FI on CO2E in 29 developing countries over the period 2004 to 2018 by using the CS ARDL methods. Their findings suggest that financial inclusion is positively associated with CO2E. In a broader cross-country context, Le and Pham (2024) investigate the dual roles of FI and digitalization on CO2E in 38 countries from 2006 to 2020. Using the system GMM approach and fixed-effect panel threshold models. Their results reveal that the environmental impact of financial inclusion decreases as countries reach higher levels of financial access and digitalization.
Prempeh et al. (2024) investigates the roles of economic growth, financial development, globalization, renewable energy, and industrialization in mitigating environmental degradation in 10 ECOWAS countries from 1990 to 2019 using the panel quantile regression. The study validates the N-shaped EKC hypothesis. The Key findings reveal that financial development and renewable energy adoption contribute to lower environmental degradation, whereas globalization and industrialization exacerbate it. Expanding the regional focus to Sub-Saharan Africa (SSA), Prempeh et al. (2024) explore how financial development influences renewable energy consumption within the renewable energy-environmental Kuznets curve (REKC) framework. Analyzing a panel of 38 SSA countries from 2002 to 2019 using PCSE and FGLS models, they validate the REKC hypothesis. Surprisingly, financial development, economic growth, governance, trade openness, and urbanization were all found to negatively impact renewable energy consumption.
2.2 Technological innovation and CO2E nexus
Santra (2017) analyzed the effect of TI on energy and CO2 emission productivity in the BRICS countries. The study found that technological progress positively impacts emission productivity, with significant improvements in energy efficiency observed in countries with higher levels of innovation. The research suggested that TI is a key driver of sustainable development in emerging economies. Lin and Zhu (2019) focused on the determinants of renewable energy TI in China under CO2E constraints. They found that CO2 emission reduction targets significantly influenced the pace of renewable energy technological development. Setting strict environmental regulations could drive TI in the renewable energy sector. Yu and Du (2019) examined the impact of TI on CO2E and the projection of emissions trends in China’s “New Normal” economy. Using panel data from Chinese provinces (1997–2015), they developed an extended STIRPAT model to assess how TI affects CO2E. The sample was divided into two groups: high-speed and low-speed growth groups. The study also included scenario simulations to forecast CO2E from 2016 to 2030. The findings showed that TI contributed more to increasing CO2E in the low-speed growth group, while it had a significant reduction effect in the high-speed growth group. Projections suggested that China could reduce CO2E substantially if appropriate policies promoting TI are implemented.
Chen and Lee (2020) investigated the relationship between TI and CO2E in a cross-country context. They employed panel data for a group of countries and used dynamic panel methods to assess how TI impacts CO2E. The results indicated that TI negatively correlates with CO2E in high-income countries, but this effect is less pronounced in low-income countries. They concluded that enhancing TI is an essential policy tool for reducing emissions, particularly in developed nations. Wang et al. (2019) investigated the multiple impacts of technological progress on CO2E in China using a panel quantile regression approach. The results indicated that technological progress has a varied effect across different quantiles of CO2E. The authors found that TI has a significant negative impact in regions with high emissions, suggesting that innovation could be a powerful tool for emission reduction in industrial areas. Wen et al. (2020) examined the spillover effects of TI on CO2E. The study found that TI directly reduces emissions and has positive spillover effects on neighboring regions and countries. This suggests that collaborative technological efforts could amplify global emission reductions. Cheng et al. (2021) analyzed how TI mitigates CO2E in OECD countries. Using panel quantile regression, the authors found that TI significantly negatively affects CO2E, especially in high-emission countries. Their findings underscore the importance of fostering innovation to meet environmental targets in developed nations.
Bilal et al. (2021) explored the relationship between green technology innovation, globalization, and CO2E. Using a panel data approach, they found that globalization amplifies the impact of green TI on emissions, particularly in developed countries. Their study emphasized the need for global cooperation to leverage TI to reduce CO2E. Zhao et al. (2021) examined the effect of financial risk on global CO2E, emphasizing the role of TI. Using a panel data approach, they found that financial risk negatively impacts TI, reducing its potential to mitigate CO2E. The study highlighted the need for stable financial systems to foster technological progress and achieve emission reduction targets. Acheampong et al. (2022) investigated the impact of transport infrastructure and TI on economic growth and CO2E. Their findings indicated that while TI promotes economic growth, it also increases emissions in the short term. However, long-term effects showed that TI could help reduce emissions, especially with sustainable transport policies. Abid et al. (2022) explored the impact of TI, foreign direct investment (FDI), and financial development on CO2E in the G8 countries. The study used a panel data approach and found that TI significantly reduces CO2E, particularly when combined with financial development.
The authors suggested that policies promoting technological advancement and FDI could further reduce emissions in these countries. Udeagha and Ngepah (2022) examined the asymmetric effect of TI on CO2E in South Africa using a Quantile Autoregressive Distributed Lag (QARDL) approach. The study found that TI has a more substantial impact on reducing emissions in the long run compared to the short run. The results suggested that innovation policies need to be strengthened for South Africa to achieve its climate goals. Obobisa et al. (2022) investigated the role of green TI and institutional quality in reducing CO2E across African countries. Their results indicated that green innovation and better institutional quality are crucial for reducing emissions. The study highlighted the need for African nations to improve their institutions and invest in green technologies to achieve sustainable development.
2.3 Theoretical review
Theoretically, FI can have both positive and negative effects on CO2E (Le et al., 2020). On the positive side, FI enhances access to financial resources, enabling businesses and individuals to invest in green technologies. By improving accessibility, affordability, and adoption of sustainable practices, an inclusive financial system can contribute to reducing environmental degradation. This is particularly crucial for marginalized communities, where limited capital often restricts investment in clean energy solutions. For instance, FI can help farmers secure credit for solar energy microgrids, a cost-effective alternative that emits significantly less CO2E than coal-based energy sources. Conversely, better access to financial services supports and encourages industrial and manufacturing activity, which might raise CO2E and contribute to global warming. Additionally, increased financial inclusion makes it possible for consumers to purchase energy-intensive consumer items like air conditioners, refrigerators, and cars, all of which pose a significant environmental risk due to their increased emissions of greenhouse gases (GHG). In addition to promoting economic activity, inclusive financial systems boost demand for polluting energy sources, raising greenhouse gas emissions (Lee et al., 2020). The Environmental Kuznets Curve (EKC) theory, developed by Grossman and Krueger (1991), examines the relationship between economic growth (GDP) and environmental sustainability, mainly focusing on CO2 emissions. According to the EKC hypothesis, as economies grow, environmental degradation (ED) initially increases, but after reaching a certain economic threshold, the relationship between GDP and environmental degradation changes. Du et al. (2023) support the view that the impact of economic development on the environment follows a non-linear pattern, with environmental damage rising during the early stages of industrialization and later decreasing as income and technology improve. The EKC contrasts pre-industrial and post-industrial development, aiming to explain how CO2 emissions evolve as economies progress. Jahanger et al. (2023) argue that, as economic development progresses, the intensity of emissions decreases due to the shift towards cleaner, more energy-efficient technologies and improved industrial practices. Figure 1, in theory, illustrates the N-shaped pattern, showing that environmental degradation and per capita income initially rise together. However, after a certain income level, they diverge as emissions intensity falls. The N-shape pattern, as described by Awan and Azam (2022), shows that environmental degradation may initially worsen as income increases. However, the relationship reverses over time as economies mature and adopt greener technologies. This suggests that while early stages of economic growth may harm the environment, long-term development and technological progress lead to environmental improvements. The EKC theory thus provides a framework for understanding how economic development and environmental sustainability can be balanced over time, with the potential for future reductions in emissions as economies continue to develop.
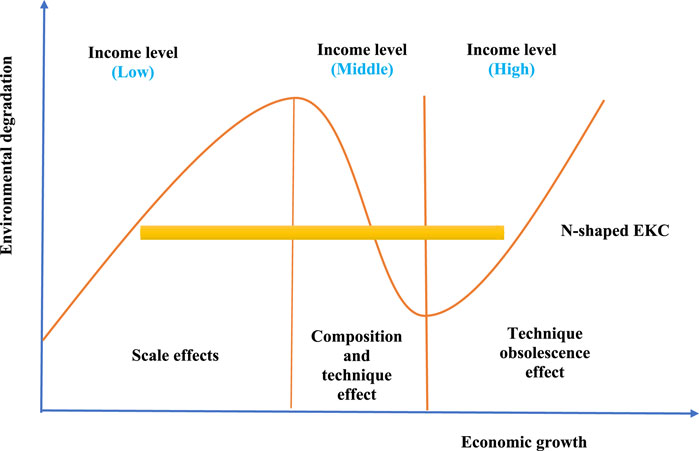
Figure 1. N-Shaped EKC. Source: Authors own compilation based on literature.
Although previous studies have examined various determinants of CO2E, the specific roles of FI and TI in influencing CO2E in China remain underexplored. Particularly, there is limited research investigating the potential existence of an N-shaped EKC while accounting for FI and TI. Moreover, most earlier research has analyzed FI, TI, and renewable energy separately rather than exploring their combined interactive effects on environmental outcomes. Thus, there is a lack of comprehensive studies that integrate FI, TI, and renewable energy into a unified framework to assess their joint impact on CO2E in China over a recent and extensive period (2006Q1–2022Q4).
3 Methodology and data
3.1 Model specification
This study examines the impact of financial inclusion and technological innovation on CO2E sustainable environment; under the EKC framework. The following model has been emerged from the literature:
where in Equation 1, CO2E, GDP, GDP2, GDP3, FI, TI and RE represent the Carbon emission, Gross domestic product, GDP square, GDP cube, financial inclusion, technological innovation and renewable energy respectively. Where residual, countries and time periods are represented by Where
3.2 Estimation strategy
The first step of any time series analysis, is testing the unit root. This study employs the Augmented Dickey-Fuller (ADF) test, developed by Dickey and Fuller (1979), and the Phillips-Perron (PP) test, introduced by Phillips and Perron (1988), to examine stationarity, with the ADF test based on Equation 2:
where
After performing the unit root test, the study applies the Johansen and Juselius (1990) Cointegration test to examine long-run relationships among time series variables. Cointegration suggests that despite being individually non-stationary, variables share a common trend and move together over time. Identifying Cointegration is crucial to prevent spurious regression results. Methods such as the JJ Cointegration test and the ARDL bounds test help ensure the model captures meaningful long-term relationships, improving prediction accuracy and enhancing policy implications. The JJ test is particularly effective in detecting long-run equilibrium relationships in multivariate time series (Zhang et al., 2025).
Following the Cointegration analysis, the study employs the Autoregressive Distributed Lag (ARDL) model developed by Pesaran et al. (2001) to assess both long-run and short-run dynamics. This model is estimated to investigate the relationships among the variables, as presented in Equation 3 below.
Equation 3 is estimated using the ordinary least squares (OLS) method, and the joint significance of the lagged variables’ coefficients is assessed through the Wald F-test to determine the presence of a long-run relationship. The null hypothesis of no cointegration
A negative and statistically significant coefficient of
For the Robustness, FMOLS (Fully modified OLS) and the DOLS (dynamic OLS) developed by Phillips and Hansen (1990) and Stock and Watson (1993) created the FMOLS (Fully modified OLS) and the DOLS (dynamic OLS). Because they account for endogeneity and serial autocorrelation, they result in the creation of asymptotically efficient coefficients. They are only used for all variables in the I(1) situation. The latter reduces their adaptability and appeal. When variables are cointegrated but nonstationary, OLS is biassed, whereas FMOLS is not. For a number of reasons, DOLS outperforms the FMOLS technique (Kao and Chiang, 2001). Compared to FMOLS, DOLS minimizes bias more effectively and is computationally easier. Compared to the statistics derived from the OLS or the FMOLS, the t-statistic derived by DOLS more closely resembles the standard normal density. Pre-estimation and non-parametric correction are not necessary for DOLS estimators because they are completely parametric. The main advantage of DOLS, is that it takes into account the heterogeneous order of integration of variables in the cointegration framework (Menegaki, 2019).
3.3 Data
This study examines the impact of financial inclusion (FI) and technological innovation (TI) on CO2E under the EKC framework in China from 2006Q1 to 2022Q4 based on data availability. The data has been obtain from World Development Indicators (WDI), and Global financial development websites, Table 1 shows the variable measurement. The financial development index developed from four indicators such as Life insurance premium (LIP) Nonlife insurance premium (NLIP), Depositors with commercial banks (DCB) and Automated teller machines (ATMs) by using the principle component analysis (PCA). Table 2 shows the PCA output for FI index. The PCA output reveals that the first component (Comp1) explains 79.7% of the variance, indicating it captures the overall financial inclusion trends, with high positive loadings for ATMs, DCM, NLIP, and LIP. The second component (Comp2) explains 14.7% of the variance and is strongly associated with LIP, reflecting financial literacy or product availability, while having negative relationships with DCM and NLIP. The third component (Comp3) accounts for 4.6% of the variance and highlights a trade-off between financial service types, especially mobile payments and traditional banking. The fourth component (Comp4) explains 1% of the variance and focuses on infrastructure-related dimensions, with negative associations with ATMs and positive with NLIP. Based on these findings, we developed the financial inclusion index primarily using the first component (Comp1), as it explains the largest proportion of the variance and incorporates key indicators of financial access and inclusion.
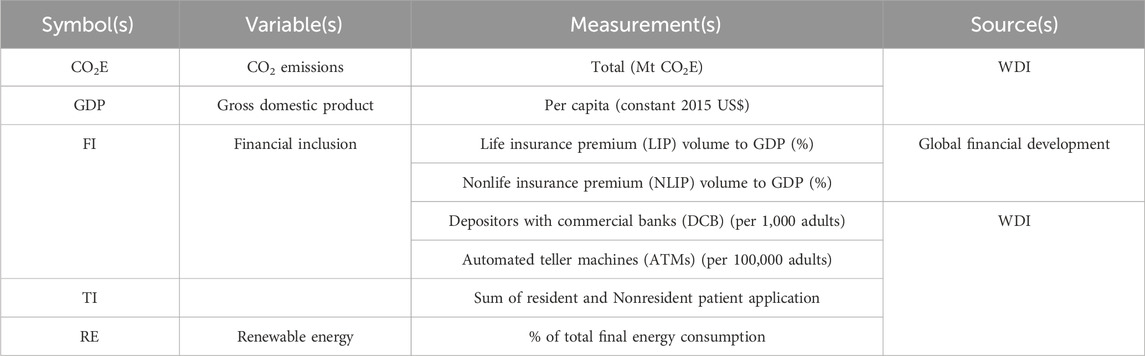
Table 1. Variable measurement.
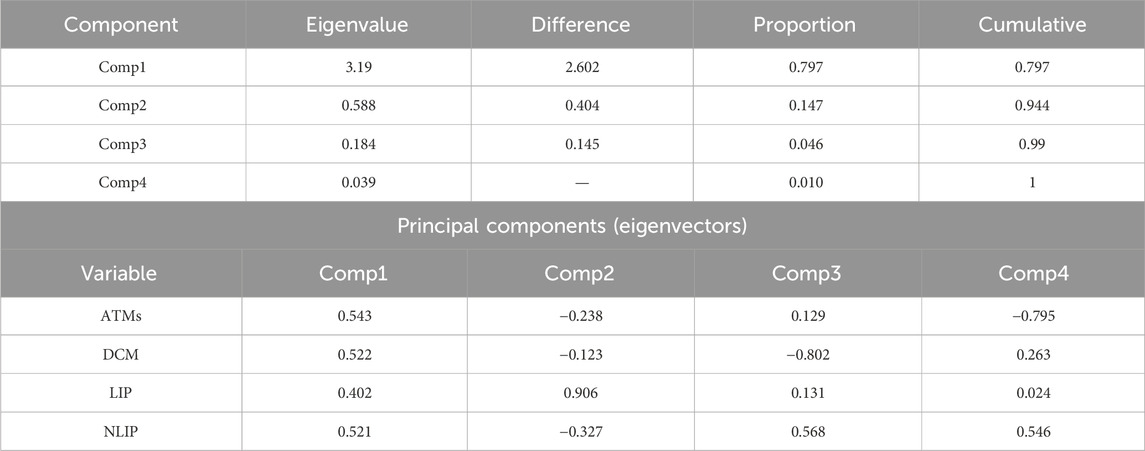
Table 2. Financial inclusion index.
4 Results and discussions
4.1 Results
Table 3, shows the mean values for the variables show that CO2E average is 9.224, GDP is 8.884, GDP2 is 79.044, GDP3 is 704.230, FI is 0.000, TI is 13.529, and RE is 13.476. The standard deviations indicate low variability in CO2E (0.180), moderate variability in GDP (0.337) and TI (0.710), and high variability in GDP3 (78.971) and RE (1.583). The Jarque-Bera test shows that CO2, FI, and TI significantly deviate from normality, while GDP, GDP2, GDP3, and RE exhibit near-normal distributions, with probabilities indicating a slight deviation from normality for most variables.
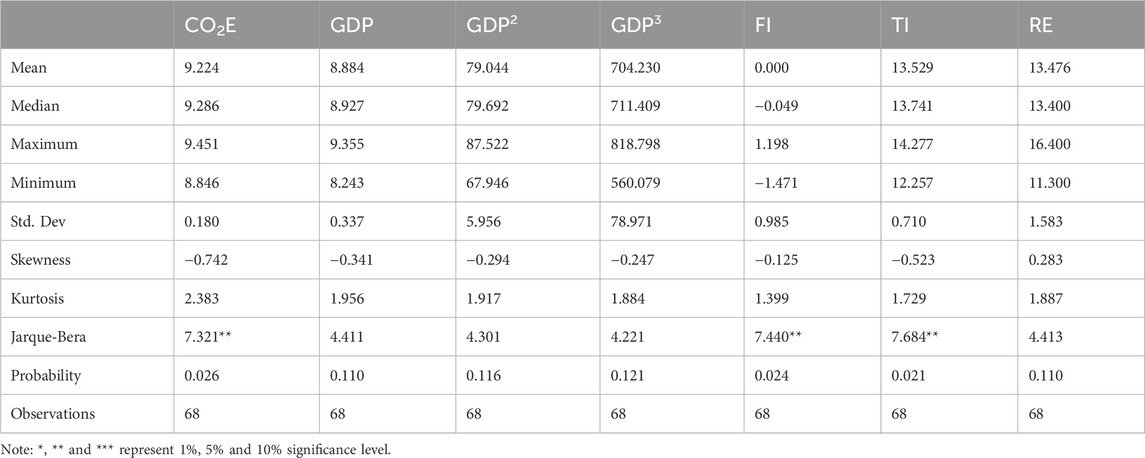
Table 3. Descriptive statistics.
Table 4, shows the three different unit root rest results. The ADF test shows that CO2E, GDP, TI and RE are non-stationary at level and becomes stationary after first difference, while FI is stationary at level. The PP test also confirms that CO2E and GDP are stationary at level, while FI, TI and RE are stationary after fist difference. The ZA test shows that At level (I(0), the variables that are stationary are CO2E, GDP, FI and RE, with structural breaks occurring in 2010Q1 for CO2, 2010Q1 for GDP, 2019Q1 for FI, and 2010Q1 for RE. At first difference (I(1)), the variables that become stationary are CO2, GDP, FI, TI, and RE, with structural breaks occurring in 2012Q1 for CO2, 2011Q3 for GDP, 2015Q2 for FI, 2011Q4 for TI, and 2015Q2 for RE.
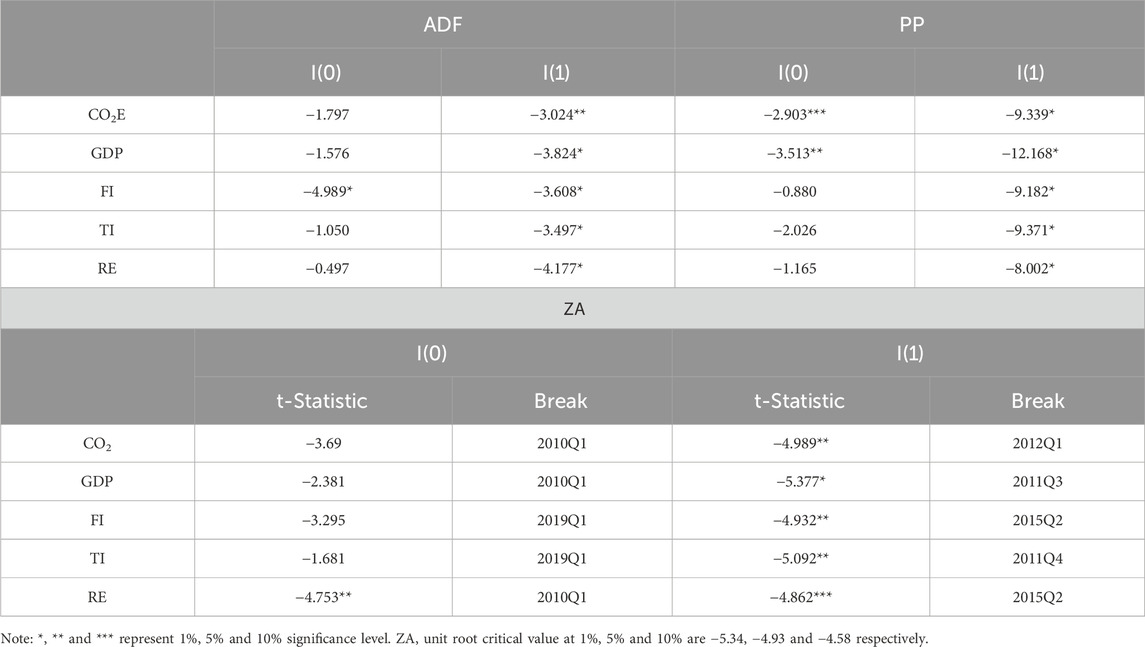
Table 4. Unit root test.
Table 5 presents the results of the Johansen Cointegration and ARDL bounds tests. The Trace statistics from the Johansen Cointegration test confirm the presence of 2 cointegrated equations, while the Max-Eigen statistics indicate 1 cointegrated equations. Additionally, the ARDL bounds test shows that the F-statistic (8.560) exceeds the critical value of 5.53, confirming the presence of Cointegration among the variables.
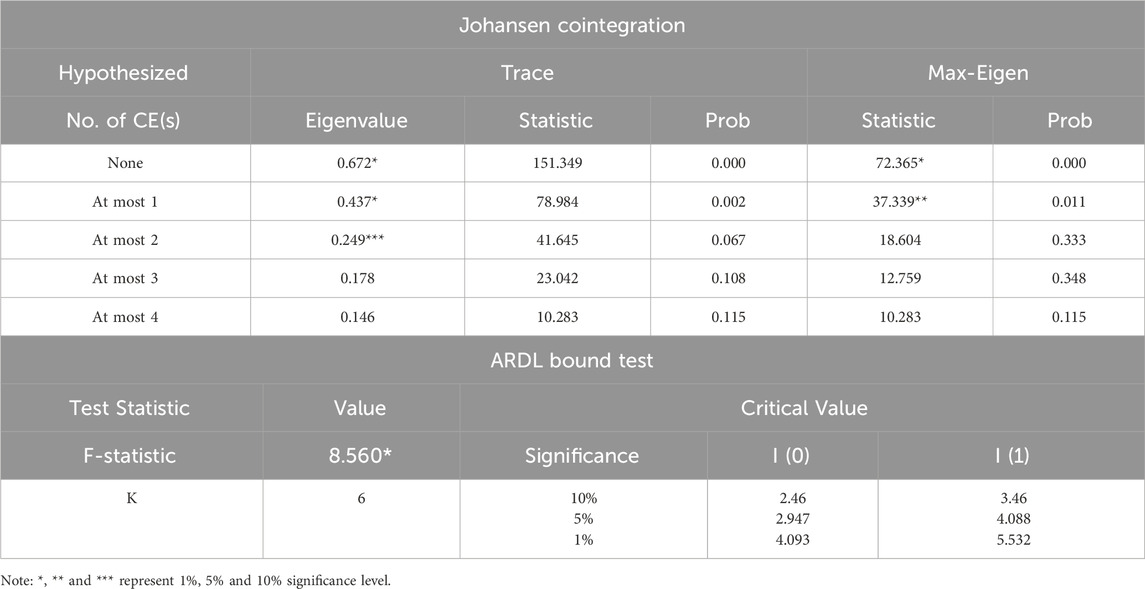
Table 5. Cointegration test.
In Table 6, shows the ARDL long run estimates, the coefficient of GDP, GDP2 and GDP3 -216.656, 24.321 and −0.904 respectively. The coefficient of GDP is −216.656, which indicates that in the initial stages of economic growth, an increase in GDP is associated with a decrease in CO2E. The coefficient for GDP2 is 24.321, which is positive. This suggests that after a certain level of GDP, the decrease in CO2 emissions slows down, and emissions may begin to increase again as the economy grows further. The coefficient of GDP3 is −0.904, which is negative. This indicates that at very high levels of GDP, the relationship between GDP and CO2 emissions turns negative again, suggesting emissions start to decline as GDP continues to grow. With a -GDP, +GDP2, and -GDP3 relationship, the pattern represents an inverted-N shaped EKC in China.

Table 6. ARDL estimates.
The coefficient for FI is −0.108, with a p-value of 0.001, which is statistically significant at the 1% level. This suggests that an increase in financial inclusion is associated with a decrease in the dependent variable, as the negative coefficient implies an inverse relationship. The coefficient for TI is −0.171, and it is statistically significant at the 5% level (p-value = 0.042). This indicates a negative relationship between the Technology Index and the dependent variable, meaning that as technology increases, the CO2E decreases. The coefficient for RE is −0.047, with a p-value of 0.004, which is statistically significant at the 1% level. This indicates a negative relationship between renewable energy and the CO2E. As renewable energy usage increases, the CO2E decreases.
The short run ARDL estimates also confirms that an inverted N shaped exist in china. The financial inclusion, technological innovation and renewable energy have negative effect on CO2E. The coefficient of the error correction term (ECM) is −0.266, significant at the 1% level (p = 0.001). The negative and significant value indicates that approximately 26.6% of the deviation from the long-run equilibrium is corrected each period. This suggests a relatively moderate speed of adjustment toward the long-run relationship.
The ARDL diagnostic tests confirm that the model is well-specified and reliable. The Jarque-Bera test (p = 0.653) indicates normally distributed residuals, while the LM test (p = 0.174) shows no autocorrelation. The ARCH test (p = 0.435) confirms homoscedasticity, and the Ramsey RESET test (p = 0.452) verifies the correct functional form. The CUSUM and CUSUMSQ tests indicate that the ARDL model is stable over time see (Figures 2, 3). This confirms that the parameters remain consistent and the model is reliable for explaining the relationship between the variables. Combined with the other diagnostic results, the ARDL model is robust, well-specified, and suitable for interpretation.
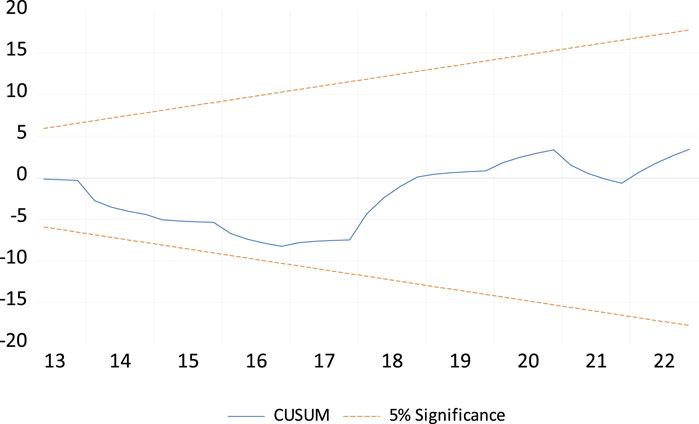
Figure 2. The cumulative sum of the recursive residual plot.
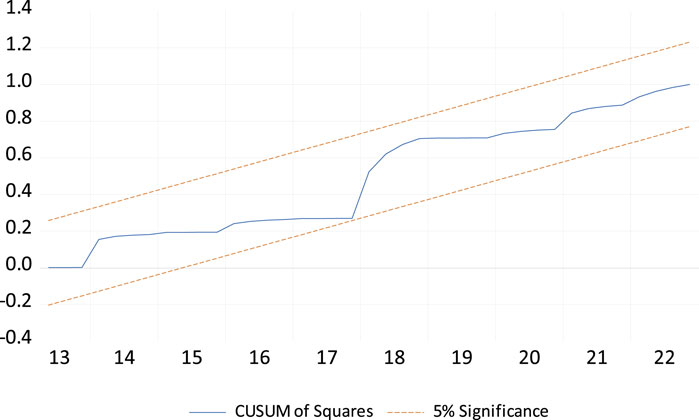
Figure 3. The cumulative sum of the square of the recursive residual plot.
Table 7 shows the Robustness analysis, The FMOLS and DOLS estimators confirm the robustness of the ARDL model findings, as both methods yield similar results in terms of the sign. Both FMOLS and DOLS estimators confirm the robustness of the ARDL results. All variables exhibit the same signs (negative for GDP, financial inclusion, technology, and renewable energy) and are statistically significant, indicating consistent findings across different estimation techniques. This consistency supports the reliability and robustness of the model in explaining the relationship between economic factors and CO2E.
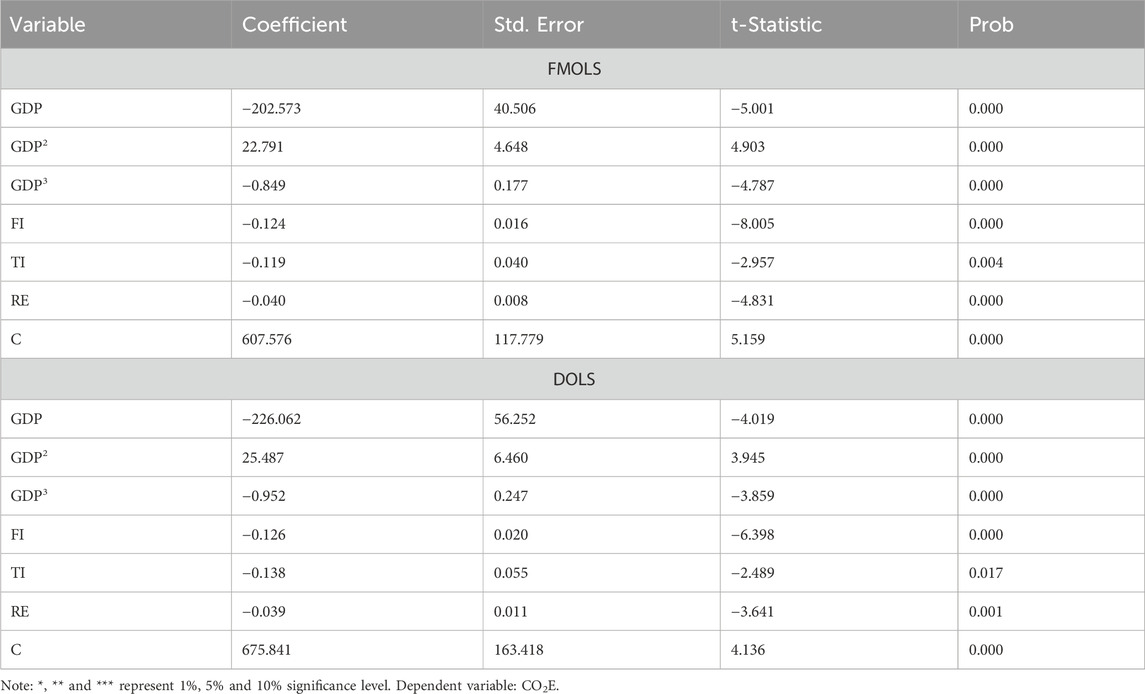
Table 7. Robustness analysis.
4.2 Discussions
In both the long run and short run, the coefficients of GDP, GDP2, and GDP3 have negative, positive, and negative effects on CO2E. This implies that in the Initial stage decline in CO2E as GDP increases, then a rise in CO2E during industrialization and growth, and a Final decline in CO2E at high GDP levels as economies adopt cleaner technologies and policies. This pattern is consistent with the idea that higher income levels enable investments in cleaner energy sources, stricter environmental regulations, and better technology to reduce CO2E. In the early stages of economic development, CO2 emissions in China declined as GDP rose. This may be attributed to structural transformation from heavy industry to services, improvements in energy efficiency, and initial environmental regulations during the early 2000s. The relationship turned positive as China moved into middle-income status, indicating that emissions increased with further economic growth. This period aligns with the rapid urbanization, infrastructure expansion, and high energy consumption that followed the global financial crisis (2008–2015). At higher income levels, emissions appear to decline again, likely due to the scaling up of renewable energy, carbon trading pilots, green finance, and China’s growing commitment to environmental governance (e.g., the 2020 carbon neutrality pledge for 2060). The finding is consistent with the line of Abbasi et al. (2023), Huang et al. (2023), and Wang et al. (2023). Abbasi et al. (2023) found an inverted N-shape EKC shows that nuclear and RE alleviate pollution while non-renewable energy enhances it. Huang et al. (2023) reported that Ecological land area has an inverted “N” connection with GDP. Wang et al. (2023) indicated that income inequality has altered the relationship between economic growth and CO2E, shifting it from an inverted U-shape to an N-shape. This suggests that income inequality redefines the EKC and adds complexity to decoupling economic growth from CO2E.
Financial inclusion has a negative effect on CO2E. FI can reduce CO2E by enabling access to green financing, which supports investments in clean technologies and renewable energy. It also empowers individuals and businesses to adopt energy-efficient practices and sustainable consumption. Moreover, improved financial services can promote environmental awareness and green initiatives. In the Chinese context, financial inclusion is not just about reducing poverty but also a strategic decarbonization tool. By equipping households and firms with the financial means and incentives to act sustainably, financial inclusion helps accelerate China’s shift toward a low-emission, inclusive green economy. The finding is consistent with the line of Qin et al. (2021), which found that FI significantly reduced CO2E at the 25th and 50th quantiles. Zheng and Li (2022) reported that Digital financial inclusion reduces emissions, particularly through usage depth and digitization level. Shahbaz et al. (2022) found that FI supports reductions in CO2E by improving energy structure and consumption patterns. Hussain et al. (2024) found that FI negatively affects emissions in emerging economies. The finding contradict with the finding of Arshad and Parveen (2024) found that FI significantly increases emissions due to higher industrial activity and energy demand from urbanization. Cheikh and Rault (2024) reported that financial inclusion increases emissions in low-income regimes.
Technological innovation has a negative effect on CO2E. TI reduces CO2E by improving energy efficiency and promoting cleaner energy sources. It enables the development of low-carbon technologies, such as renewable energy, electric vehicles, and energy-efficient machinery. Innovations in production processes can minimize waste and reduce resource consumption. Moreover, technological advancements drive the transition to a more sustainable and less carbon-intensive economy. The finding is consistent with the line of Chen and Lee (2020) reported that TI has a negative relationship with CO2E in high-income countries, but the effect is less in low-income countries. Cheng et al. (2021) found that TI significantly negatively affects CO2E, especially in high-emission countries. Yu and Du (2019) indicated that TI significantly reduced CO2E in the high-speed growth group in China. Abid et al. (2022) found that TI significantly reduces CO2E, particularly when combined with financial development. The finding contradicts the finding of Acheampong et al. (2022) that TI promotes economic growth, but it leads to increased emissions in the short term, suggesting a positive effect in the short run.
Renewable energy has a negative effect on CO2E; RE reduces CO2E by replacing fossil fuels with clean energy sources like solar, wind, and hydropower. Unlike coal or natural gas, these energy sources produce little to no carbon emissions during generation. As renewable energy use increases, reliance on carbon-intensive energy sources decreases. This transition helps mitigate climate change by significantly reducing greenhouse gas emissions. The finding is consistent with the line of Jie and Rabnawaz (2024) and Akbar et al. (2024).
5 Conclusion and policy recommendations
This study examined the impact of financial inclusion and technological innovation on CO2E in China under the N-shaped EKC framework from 2006Q1 to 2022Q4. This study utilized the unit root test, Cointegration test, ARDL, FMOLS, and DOLS estimators. The unit root test finding showed that all variables are in a mixed order of data stationarity. The Cointegration test confirmed that there is a long-run nexus between the variables. The long-run and short-run ARDL results confirmed an inverted N-shaped EKC between GDP and CO2E. While financial inclusion, technological innovation, and RE have negative effects on CO2E.
This study has several policy recommendations for policymakers to promote environmental sustainability in China. First, Chines Governments should increase access to financial services, particularly for underserved populations, to facilitate investments in green technologies, RE, and energy-efficient practices. Second, Governments should specifically introduce and expand green financial products, such as green bonds, low-interest loans, and microcredit, to fund sustainable projects. These should be accessible to businesses and individuals, particularly in underserved areas. Increased access to green financing can empower businesses and households to invest in energy-efficient technologies, renewable energy systems, and eco-friendly infrastructure, significantly reducing CO2E. Third, Policymakers should support research and development in clean technologies, provide incentives for adopting low-carbon solutions, and encourage industries to innovate in energy efficiency. Fourth, Governments should implement policies that incentivize the transition to renewable energy, such as subsidies, tax incentives, and investment in infrastructure for solar, wind, and other sustainable energy sources. Fifth, reducing income inequality can help reshape the Environmental Kuznets Curve, ensuring that economic growth does not come at the cost of environmental degradation. Policies should focus on equitable wealth distribution and social safety nets to support inclusive, sustainable development. Fifth, Enforce stricter environmental regulations and standards to guide industries toward cleaner production methods, reduce carbon emissions, and promote sustainability. Six, China should expand digital finance infrastructure (internet coverage, fintech services) in less-developed provinces like Gansu, Qinghai, and Xinjiang, enabling local residents to access green savings products, carbon credit markets, and clean energy investment schemes. Seven, The Chinese government should partner with rural credit cooperatives, agricultural banks, and digital finance platforms like Alipay and WeBank to provide low-interest green microloans to farmers and small enterprises for renewable energy adoption (e.g., solar irrigation systems, biogas digesters).
This study has certain limitations that provide directions for future research. First, while our analysis focuses exclusively on the Chinese economy, future studies could broaden the scope to include developed, emerging, and developing nations to offer a more comparative perspective on the FI, TI and CO2E nexus. Expanding the geographical coverage would help assess whether the observed relationships hold across different economic contexts. Second, although we incorporated key explanatory variables, several macroeconomic, demographic, social, and health-related factors influencing CO2E were not included due to data constraints. Future research could integrate these factors to provide a more comprehensive understanding of the determinants of CO2E. Third, this study did not employ asymmetric analysis, quantile regression, or structural break tests, which could offer deeper insights into heterogeneous effects and regime shifts in the FI, TI and CO2E relationship. Future research could apply these advanced econometric techniques to extend and refine the analysis. Fourth, our FI index was constructed using four indicators, as data limitations prevented the inclusion of additional FI-related variables. Future studies could enhance the index by incorporating a broader set of indicators to improve the measurement of FI and its impact on CO2E. Finally, our dataset spans from 2006Q1 to 2022Q4, constrained by data availability. Extending the time period in future studies could help capture long-term trends and structural changes in the relationship between FI, TI, and CO2E. Addressing these limitations will strengthen future research and contribute to a more nuanced understanding of the dynamics shaping environmental outcomes.
Data availability statement
The raw data supporting the conclusions of this article will be made available by the authors, without undue reservation.
Author contributions
WS: Conceptualization, Investigation, Writing – original draft, Writing – review and editing. QL: Data curation, Formal Analysis, Funding acquisition, Methodology, Project administration, Supervision, Writing – original draft, Writing – review and editing. IU: Formal Analysis, Methodology, Resources, Validation, Visualization, Writing – review and editing.
Funding
The author(s) declare that no financial support was received for the research and/or publication of this article.
Conflict of interest
The authors declare that the research was conducted in the absence of any commercial or financial relationships that could be construed as a potential conflict of interest.
Generative AI statement
The author(s) declare that Generative AI was used in the creation of this manuscript. The authors have used ChatGPT and Grammarly to assist in English translation, grammar checking, and editing.
Publisher’s note
All claims expressed in this article are solely those of the authors and do not necessarily represent those of their affiliated organizations, or those of the publisher, the editors and the reviewers. Any product that may be evaluated in this article, or claim that may be made by its manufacturer, is not guaranteed or endorsed by the publisher.
References
Abbasi, K. R., Awan, A., Bandyopadhyay, A., Rej, S., and Banday, T. P. (2023). Investigating the inverted N-shape EKC in the presence of renewable and nuclear energy in a global sample. Clean Technol. Environ. Policy 25 (4), 1179–1194. doi:10.1007/s10098-022-02436-5
Abid, A., Mehmood, U., Tariq, S., and Haq, Z. U. (2022). The effect of technological innovation, FDI, and financial development on CO2 emission: evidence from the G8 countries. Environ. Sci. Pollut. Res. 29, 11654–11662. doi:10.1007/s11356-021-15993-x
Acheampong, A. O., Dzator, J., Dzator, M., and Salim, R. (2022). Unveiling the effect of transport infrastructure and technological innovation on economic growth, energy consumption and CO2 emissions. Technol. Forecast. Soc. Change 182, 121843. doi:10.1016/j.techfore.2022.121843
Akbar, A., Gul, A., Sohail, M., Hedvicakova, M., Haider, S. A., Ahmad, S., et al. (2024). Impact of renewable and non-renewable energy resources on CO2 emission: empirical evidence from SAARC. Int. J. Energy Econ. Policy 14 (1), 141–149. doi:10.32479/ijeep.15049
Ali, H. S., Law, S. H., and Zannah, T. I. (2016). Dynamic impact of urbanization, economic growth, energy consumption, and trade openness on CO 2 emissions in Nigeria. Environ. Sci. Pollut. Res. 23, 12435–12443. doi:10.1007/s11356-016-6437-3
Arshad, A., and Parveen, S. (2024). Exploring the impact of financial inclusion on greenhouse gas emissions (CO2) and energy efficiency: evidence from developing countries. Environ. Dev. Sustain. 26 (11), 27723–27738. doi:10.1007/s10668-023-03780-2
Awan, A. M., and Azam, M. (2022). Evaluating the impact of GDP per capita on environmental degradation for G-20 economies: does N-shaped environmental Kuznets curve exist? Environ. Dev. Sustain. 24 (9), 11103–11126. doi:10.1007/s10668-021-01899-8
Azam, M., Uddin, I., Khan, S., and Tariq, M. (2022). Are globalization, urbanization, and energy consumption cause carbon emissions in SAARC region? New evidence from CS-ARDL approach. Environ. Sci. Pollut. Res. 29 (58), 87746–87763. doi:10.1007/s11356-022-21835-1
Becha, H., Kalai, M., Houidi, S., and Helali, K. (2025). Digital financial inclusion, environmental sustainability and regional economic growth in China: insights from a panel threshold model. J. Econ. Struct. 14 (1), 4–40. doi:10.1186/s40008-025-00347-4
Bilal, A., Li, X., Zhu, N., Sharma, R., and Jahanger, A. (2021). Green technology innovation, globalization, and CO2 emissions: recent insights from the OBOR economies. Sustainability 14 (1), 236. doi:10.3390/su14010236
Cheikh, N. B., and Rault, C. (2024). Financial inclusion and threshold effects in carbon emissions. Energy Policy 192, 114265. doi:10.1016/j.enpol.2024.114265
Chen, Y., and Lee, C. C. (2020). Does technological innovation reduce CO2 emissions? Cross-country evidence. J. Clean. Prod. 263, 121550. doi:10.1016/j.jclepro.2020.121550
Cheng, C., Ren, X., Dong, K., Dong, X., and Wang, Z. (2021). How does technological innovation mitigate CO2 emissions in OECD countries? Heterogeneous analysis using panel quantile regression. J. Environ. Manag. 280, 111818. doi:10.1016/j.jenvman.2020.111818
China Environmental Technologies (2024). Available online at: https://www.trade.gov/market-intelligence/china-environmental-technologies#:∼:text=China%20is%20currently%20estimated%20to,than%20%24260%20billion%20in%202022.
Dickey, D. A., and Fuller, W. A. (1979). Distribution of the estimators for autoregressive time series with a unit root. J. Am. Stat. Assoc. 74 (366a), 427–431. doi:10.2307/2286348
Du, J., Ahmad, M., Uddin, I., Xu, H., and Gu, X. (2023). From growth to sustainability: investigating N-shaped EKC and the role of energy productivity, technological advancement, and human capital in OECD economies. Environ. Sci. Pollut. Res. 30 (46), 102374–102388. doi:10.1007/s11356-023-29514-5
Grossman, G. M., and Krueger, A. B. (1991). Environmental impacts of a north American free trade agreement.
Huang, J., Zhang, D., Zhang, Z., Kong, W., Yan, J., and Xia, F. (2023). Trapped in dilemma: inverted N-shaped EKC evidence of economic growth and ecological land in a spatial spillover perspective. Appl. Geogr. 161, 103145. doi:10.1016/j.apgeog.2023.103145
Hussain, S., Ahmad, T., Ullah, S., Rehman, A. U., and Shahzad, S. J. H. (2024). Financial inclusion and carbon emissions in Asia: implications for environmental sustainability. Econ. Political Stud. 12 (1), 88–104. doi:10.1080/20954816.2023.2273003
Hussain, S., Akbar, M., Gul, R., Shahzad, S. J. H., and Naifar, N. (2023). Relationship between financial inclusion and carbon emissions: international evidence. Heliyon 9 (6), e16472. doi:10.1016/j.heliyon.2023.e16472
Jahanger, A., Hossain, M. R., Onwe, J. C., Ogwu, S. O., Awan, A., and Balsalobre-Lorente, D. (2023). Analyzing the N-shaped EKC among top nuclear energy generating nations: A novel dynamic common correlated effects approach. Gondwana Res., 116, 73–88.
Jie, W., and Rabnawaz, K. (2024). Renewable energy and CO2 emissions in developing and developed nations: a panel estimate approach. Front. Environ. Sci. 12, 1405001. doi:10.3389/fenvs.2024.1405001
Johansen, S., and Juselius, K. (1990). Maximum likelihood estimation and inference on cointegration — with applications to the demand for money. Oxf. Bull. Econ. Stat. 52 (2), 169–210. doi:10.1111/j.1468-0084.1990.mp52002003.x
Kao, C., and Chiang, M. H. (2001). “On the estimation and inference of a cointegrated regression in panel data,” in Nonstationary panels, panel cointegration, and dynamic panels Leeds, UK: Emerald Group Publishing Limited. 179–222. doi:10.1016/S0731-9053(00)15007-8
Khan, K., Luo, T., Ullah, S., Rasheed, H. M. W., and Li, P. H. (2023). Does digital financial inclusion affect CO2 emissions? Evidence from 76 emerging markets and developing economies (EMDE’s). J. Clean. Prod. 420, 138313. doi:10.1016/j.jclepro.2023.138313
Lai, J. T., Yan, I. K., Yi, X., and Zhang, H. (2020). Digital financial inclusion and consumption smoothing in China. China and World Econ. 28 (1), 64–93. doi:10.1111/cwe.12312
Le, T. H., Le, H. C., and Taghizadeh-Hesary, F. (2020). Does financial inclusion impact CO2 emissions? Evidence from Asia. Finance Res. Lett. 34, 101451. doi:10.1016/j.frl.2020.101451
Le, V. L. T., and Pham, K. D. (2024). The impact of financial inclusion and digitalization on CO2 emissions: a cross-country empirical analysis. Sustainability 16 (23), 10491. doi:10.3390/su162310491
Lin, B., and Zhu, J. (2019). Determinants of renewable energy technological innovation in China under CO2 emissions constraint. J. Environ. Manag. 247, 662–671. doi:10.1016/j.jenvman.2019.06.121
Liu, F., Yang, S., Zhou, Y., Huo, W., and Zhu, L. (2024). Does digital financial inclusion have an impact on high-quality development of trade? Evidence from China. J. Knowl. Econ. 16, 788–816. doi:10.1007/s13132-024-02015-7
Liu, N., Hong, C., and Sohail, M. T. (2022). Does financial inclusion and education limit CO2 emissions in China? A new perspective. Environ. Sci. Pollut. Res. 1, 1–8. doi:10.1007/s11356-021-17032-1
Mehmood, U. (2022). Examining the role of financial inclusion towards CO2 emissions: presenting the role of renewable energy and globalization in the context of EKC. Environ. Sci. Pollut. Res. 29 (11), 15946–15954. doi:10.1007/s11356-021-16898-5
Menegaki, A. N. (2019). The ARDL method in the energy-growth nexus field; best implementation strategies. Economies 7 (4), 105. doi:10.3390/economies7040105
Obobisa, E. S., Chen, H., and Mensah, I. A. (2022). The impact of green technological innovation and institutional quality on CO2 emissions in African countries. Technol. Forecast. Soc. Change 180, 121670. doi:10.1016/j.techfore.2022.121670
Pesaran, M. H., Shin, Y., and Smith, R. J. (2001). Bounds testing approaches to the analysis of level relationships. J. Appl. Econ. 16 (3), 289–326. doi:10.1002/jae.616
Phillips, P. C., and Hansen, B. E. (1990). Statistical inference in instrumental variables regression with I (1) processes. Rev. Econ. Stud. 57 (1), 99–125. doi:10.2307/2297545
Phillips, P. C. B., and Perron, P. (1988). Testing for a unit root in time series regression. Biometrika 75, 335–346. doi:10.1093/biomet/75.2.335
Prempeh, K. B., Kyeremeh, C., Danso, F. K., and Yeboah, S. A. (2024). Exploring the impact of financial development on renewable energy consumption within the renewable energy-environmental Kuznets curve framework in Sub-Saharan Africa. Int. J. Renew. Energy Dev. 13 (5), 884–897. doi:10.61435/ijred.2024.60339
Prempeh, K. B., Yeboah, S. A., Danso, F. K., and Frimpong, J. M. (2023). Banking sector development and environmental degradation in the Economic Community of West African States: do technology effects matter? Future Bus. J. 9 (1), 106. doi:10.1186/s43093-023-00286-1
Qin, L., Raheem, S., Murshed, M., Miao, X., Khan, Z., and Kirikkaleli, D. (2021). Does financial inclusion limit carbon dioxide emissions? Analyzing the role of globalization and renewable electricity output. Sustain. Dev. 29 (6), 1138–1154. doi:10.1002/sd.2208
Razzaq, A., Qin, S., Zhou, Y., Mahmood, I., and Alnafissa, M. (2024). Determinants of financial inclusion gaps in Pakistan and implications for achieving SDGs. Sci. Rep. 14 (1), 13667. doi:10.1038/s41598-024-63445-6
Santra, S. (2017). The effect of technological innovation on production-based energy and CO2 emission productivity: evidence from BRICS countries. Afr. J. Sci. Technol. Innovation Dev. 9 (5), 503–512. doi:10.1080/20421338.2017.1308069
Saqib, N., Usman, M., Mahmood, H., Abbas, S., Ahmad, F., Mihai, D., et al. (2023). The moderating role of technological innovation and renewable energy on CO2 emission in OECD countries: evidence from panel quantile regression approach. Econ. Research-Ekonomska Istraživanja 36 (3). doi:10.1080/1331677x.2023.2168720
Shahbaz, M., Li, J., Dong, X., and Dong, K. (2022). How financial inclusion affects the collaborative reduction of pollutant and carbon emissions: the case of China. Energy Econ. 107, 105847. doi:10.1016/j.eneco.2022.105847
Statista (2022). The largest emitters of CO2 in the world. Available online at: https://www.statista.com/statistics/271748/the-largest-emitters-of-co2-in-the-world/.
Stock, J. H., and Watson, M. W. (1993). A simple estimator of cointegrating vectors in higher order integrated systems. Econ. J. Econ. Soc. 61, 783–820. doi:10.2307/2951763
Tsimisaraka, R. S. M., Xiang, L., Andrianarivo, A. R. N. A., Josoa, E. Z., Khan, N., Hanif, M. S., et al. (2023). Impact of financial inclusion, globalization, renewable energy, ICT, and economic growth on CO2 emission in OBOR countries. Sustainability 15 (8), 6534. doi:10.3390/su15086534
Uddin, I., Usman, M., Saqib, N., and Makhdum, M. S. A. (2023). The impact of geopolitical risk, governance, technological innovations, energy use, and foreign direct investment on CO2 emissions in the BRICS region. Environ. Sci. Pollut. Res. 30 (29), 73714–73729. doi:10.1007/s11356-023-27466-4
Udeagha, M. C., and Ngepah, N. (2022). The asymmetric effect of technological innovation on CO2 emissions in South Africa: new evidence from the QARDL approach. Front. Environ. Sci. 10, 985719. doi:10.3389/fenvs.2022.985719
Verma, A., and Giri, A. K. (2024). Does financial inclusion reduce income inequality? Empirical evidence from Asian economies. Int. J. Emerg. Mark. 19 (9), 2428–2445. doi:10.1108/ijoem-02-2022-0271
Wang, Q., Yang, T., and Li, R. (2023). Does income inequality reshape the environmental Kuznets curve (EKC) hypothesis? A nonlinear panel data analysis. Environ. Res. 216, 114575. doi:10.1016/j.envres.2022.114575
Wang, S., Zeng, J., and Liu, X. (2019). Examining the multiple impacts of technological progress on CO2 emissions in China: a panel quantile regression approach. Renew. Sustain. Energy Rev. 103, 140–150. doi:10.1016/j.rser.2018.12.046
Wang, X., Wang, X., Ren, X., and Wen, F. (2022). Can digital financial inclusion affect CO2 emissions of China at the prefecture level? Evidence from a spatial econometric approach. Energy Econ. 109, 105966. doi:10.1016/j.eneco.2022.105966
Wen, Q., Chen, Y., Hong, J., Chen, Y., Ni, D., and Shen, Q. (2020). Spillover effect of technological innovation on CO2 emissions in China's construction industry. Build. Environ. 171, 106653. doi:10.1016/j.buildenv.2020.106653
Yu, Y., and Du, Y. (2019). Impact of technological innovation on CO2 emissions and emissions trend prediction on ‘New Normal’economy in China. Atmos. Pollut. Res. 10 (1), 152–161. doi:10.1016/j.apr.2018.07.005
Zaidi, S. A. H., Hussain, M., and Zaman, Q. U. (2021). Dynamic linkages between financial inclusion and carbon emissions: evidence from selected OECD countries. Resour. Environ. Sustain. 4, 100022. doi:10.1016/j.resenv.2021.100022
Zhang, H., Zhan, Y., and Chen, K. (2025). Do education, urbanization, and green growth promote life expectancy? Front. Public Health 12, 1517716. doi:10.3389/fpubh.2024.1517716
Zhao, J., Shahbaz, M., Dong, X., and Dong, K. (2021). How does financial risk affect global CO2 emissions? The role of technological innovation. Technol. Forecast. Soc. Change 168, 120751. doi:10.1016/j.techfore.2021.120751
Keywords: financial inclusion, technological innovation, Co2e, N-shaped EKC, China
Citation: Sun W, Li Q and Uddin I (2025) Financial inclusion, environmental technology, and sustainable environment in China: evidence from an N-shaped EKC. Front. Environ. Sci. 13:1578559. doi: 10.3389/fenvs.2025.1578559
Received: 17 February 2025; Accepted: 08 May 2025;
Published: 23 May 2025.
Edited by:
Mobeen Ur Rehman, Keele University, United KingdomReviewed by:
Amar Razzaq, Huanggang Normal University, ChinaRidwan Ibrahim, University of Lagos, Nigeria
Kwadwo Boateng Prempeh, Sunyani Technical University, Ghana
Mustafa Naimoglu, Bingöl University, Türkiye
Copyright © 2025 Sun, Li and Uddin. This is an open-access article distributed under the terms of the Creative Commons Attribution License (CC BY). The use, distribution or reproduction in other forums is permitted, provided the original author(s) and the copyright owner(s) are credited and that the original publication in this journal is cited, in accordance with accepted academic practice. No use, distribution or reproduction is permitted which does not comply with these terms.
*Correspondence: Qiang Li, bGlxaWFuZzk2OTU0MTA0NUAxNjMuY29t
†ORCID: Ijaz Uddin, orcid.org/0000-0002-7231-109X