 Siyu Fu1*
 Chen Kong2
- 1Huanghe Jiaotong University, Jiaozuo, Henan, China
- 2Shandong Management University, Shandong, Jinan, China
Introduction: As global climate change accelerates, its multifaceted impacts are becoming increasingly evident in the sports industry, especially in the context of large-scale international sporting events. Rising temperatures, extreme weather events, and the tightening of environmental regulations are placing unprecedented operational and financial pressures on sports organizations. Meanwhile, the global push toward carbon neutrality compels event organizers to adopt sustainable practices across all facets of planning, infrastructure, and athlete management. However, traditional models in sports economics remain largely inadequate to address these emerging challenges, as they are primarily designed to optimize short-term revenue and performance outcomes, neglecting environmental and policy dimensions.
Methods: To address this gap, this paper proposes an integrated analytical framework that brings together the Dynamic Athlete Valuation Model (DAVM) and the Integrated Competitive Strategy Framework (ICSF). DAVM introduces a dynamic, data-driven approach to athlete valuation, incorporating temporal performance metrics, market conditions, and external factors such as sponsorship and media influence. ICSF, on the other hand, leverages game theory and optimization algorithms to enhance decision-making in areas such as resource allocation, salary cap management, and sustainability-oriented strategic planning.
Results: Empirical results from multiple datasets and experiments confirm that the integration of climate risk and low-carbon policy variables significantly improves the predictive accuracy and resilience of economic planning in the sports sector.
Discussion: This research provides theoretical advancements and practical insights for policymakers, sports managers, and investors seeking to navigate the complex interplay between sustainability and profitability in a rapidly changing global environment.
1 Introduction
The accelerating impacts of climate change have far-reaching consequences across various sectors, and the world of sports is no exception. Rising temperatures, extreme weather events, and shifting seasonal patterns pose significant risks to sports infrastructure, athlete performance, and the scheduling of global events (Xu et al., 2024). Simultaneously, the growing pressure to adopt low-carbon policies aligns with broader efforts to mitigate climate change, prompting sports organizations to reduce their carbon footprints (Liu et al., 2020). These dual forces—climate risk and the transition to sustainable practices—are reshaping the economics of sports, influencing everything from event logistics and sponsorship to fan engagement and revenue streams. Not only do these challenges necessitate adaptive strategies for event organizers, but they also present opportunities for innovation in sustainability (Zhang et al., 2023). Despite the increasing relevance of this topic, the intersection of climate risks, low-carbon policies, and sports economics remains underexplored, highlighting the need for comprehensive analytical frameworks that assess both the risks and economic implications of climate action in the sports industry (Peng et al., 2023).
Initial analyses of climate risks in the context of sports economics were primarily based on symbolic AI and knowledge-based systems. These approaches leveraged established economic models and environmental impact assessments to predict how climate-related disruptions—such as flooding, heatwaves, or air quality degradation—would affect sports events and their financial outcomes (Zhu et al., 2023). Using rule-based frameworks, researchers could assess infrastructure vulnerabilities, estimate costs associated with weather-related damages, and recommend risk mitigation strategies (Kocmi et al., 2023). These methods offered clear, interpretable insights based on predefined criteria and expert knowledge. However, they were limited in their ability to process large volumes of dynamic data, such as real-time climate projections and economic indicators from diverse regions (Moslem et al., 2023). The rigid nature of symbolic AI also restricted the models’ adaptability to emerging climate risks or novel low-carbon policies, reducing their efficacy in the rapidly evolving landscape of global sports economics (Goyal et al., 2021).
To overcome the limitations of symbolic systems, data-driven machine learning approaches emerged, offering more flexible tools for analyzing the economic implications of climate risks and sustainability initiatives in sports (Freitag et al., 2021). Machine learning algorithms, such as regression models, decision trees, and clustering techniques, were used to identify patterns and correlations between climate events, economic losses, and the adoption of green policies (García et al., 2023). These models excelled at integrating heterogeneous datasets, including weather forecasts, energy consumption metrics, and financial performance reports from sports organizations. As a result, they provided more nuanced insights into how climate risks influenced operational costs, attendance rates, and sponsorship dynamics (Jiang et al., 2021). However, machine learning methods required substantial amounts of high-quality data for training, and their predictive accuracy was often contingent on the granularity and reliability of the input data. These models faced challenges in handling the complex, multidimensional nature of global events, where economic impacts are influenced by a wide range of environmental, social, and political factors (Fan et al., 2020).
The introduction of deep learning and pre-trained models has further advanced the analysis of climate risk and low-carbon policies in sports economics. Deep learning architectures, such as recurrent neural networks (RNNs) and convolutional neural networks (CNNs), are capable of processing time-series climate data, satellite imagery, and economic indicators simultaneously (Kocmi et al., 2022). Moreover, pre-trained models, particularly those based on transfer learning, have enabled researchers to leverage knowledge from global environmental datasets to inform localized analyses of sports events (Agrawal et al., 2022). This capability is particularly valuable for assessing the long-term economic impacts of climate change on recurring global events like the Olympics or the FIFA World Cup, where sustainability commitments and climate risks play increasingly prominent roles. Despite their superior analytical capabilities, deep learning models are often criticized for their opacity (Zhu et al., 2020), making it difficult for policymakers and stakeholders to understand the underlying factors driving the models’ predictions. The computational demands and data requirements of deep learning can be prohibitive, particularly for smaller sports organizations with limited resources (Li M. et al., 2022).
Given the limitations of symbolic AI, machine learning, and deep learning approaches, we propose an integrated method that combines explainable AI (XAI) techniques with deep learning to analyze the economic implications of climate risks and low-carbon policies in sports. Our approach leverages the predictive power of deep learning while incorporating transparency-enhancing tools that make the results accessible to non-technical stakeholders. We employ multi-modal data fusion to integrate diverse data sources, such as climate models, economic reports, and sustainability metrics from sports organizations worldwide. This comprehensive framework enables the simultaneous assessment of environmental risks, financial performance, and policy effectiveness, providing actionable insights for event organizers, policymakers, and investors. By addressing the dual challenges of climate adaptation and sustainability in sports, our method offers a robust solution for navigating the economic complexities of global sporting events in an era of climate change.
The proposed method offers three key advantages.
The Dynamic Athlete Valuation Model (DAVM) and Integrated Competitive Strategy Framework (ICSF) proposed in this study extend and enrich the current literature in sports economics by addressing critical gaps present in classical economic models. While traditional sports economic frameworks, such as variable and dynamic ticket pricing, sponsorship valuation methods, and competitive balance theories, have significantly shaped the understanding of sports markets, they often rely on static assumptions and neglect dynamic market signals or sustainability considerations. In contrast, DAVM explicitly incorporates evolving player performance metrics and market-driven uncertainties, providing a more nuanced approach to athlete valuation. Likewise, ICSF integrates financial objectives with environmental sustainability criteria, directly addressing the limitations of conventional revenue-maximization models typically employed for event management strategies. However, both frameworks remain sensitive to data quality and completeness. DAVM’s valuation accuracy depends significantly on the reliability of historical performance data, market signals, and injury records. Similarly, ICSF’s optimality hinges on accurate forecasting of economic conditions, policy environments, and emission reduction potentials. To mitigate these limitations, robust data validation, sensitivity analyses, and scenario-based modeling are essential. Additionally, extending these models through direct collaboration with sports organizations can further refine their practical applicability and reduce biases arising from limited or incomplete datasets. Future research should thus focus on incorporating richer datasets, cross-region validations, and real-time market signals to enhance the predictive capability and robustness of these models within the dynamic landscape of sports economics.
2 Related work
2.1 Climate risk and sports infrastructure
Climate risk has emerged as a critical factor influencing sports infrastructure, necessitating significant adjustments in the planning, construction, and maintenance of facilities. Extreme weather events, such as heatwaves, floods, hurricanes, and rising sea levels, pose direct threats to stadiums, training centers, and recreational spaces (Xiao Y. et al., 2022). These risks not only affect the longevity and safety of sports infrastructure but also have economic implications, increasing maintenance costs and insurance premiums while potentially reducing the lifespan of facilities. Empirical studies have highlighted how climate-related risks are already impacting sports infrastructure globally (Arenas and Toral, 2022). For instance, coastal venues are increasingly vulnerable to sea-level rise and storm surges, requiring expensive protective measures or relocation strategies. Flooding, intensified by climate change, disrupts both infrastructure and event schedules, leading to revenue losses and higher operational costs (Khandelwal et al., 2020). Heatwaves and changing precipitation patterns can degrade playing surfaces, particularly in outdoor sports like football, golf, and cricket, necessitating more frequent renovations and investments in climate-resilient materials (Zhang et al., 2021). The adaptation of sports infrastructure to climate risks often involves integrating sustainable building practices, such as the use of renewable energy, water conservation systems, and eco-friendly construction materials (Xiao X. et al., 2022). While these adaptations can mitigate long-term risks and operational costs, they entail significant upfront investments (Pan et al., 2021). The economic burden of these changes varies by region and sport, influencing the allocation of resources and the accessibility of sports facilities, particularly in developing countries where financial resources are more constrained. Climate risk also influences the design and location of new sports venues. Increasingly, urban planners and sports organizations are incorporating climate resilience into their development plans, selecting locations less prone to extreme weather and designing multi-functional facilities that can withstand diverse climatic conditions (Zhang et al., 2021). This shift reflects a broader recognition of the need for sustainable sports infrastructure, which balances economic viability with environmental stewardship in the face of escalating climate risks.
2.2 Low-carbon policies and sports organizations
Low-carbon policies aimed at mitigating climate change are reshaping the operations of sports organizations worldwide. These policies, which include carbon pricing, emission reduction targets, and sustainable transportation mandates, impose both regulatory pressures and opportunities for innovation within the sports industry (Kocmi et al., 2021). The implementation of low-carbon strategies affects multiple facets of sports economics, from event management and logistics to sponsorship and marketing (Akhbardeh et al., 2021a). Sports organizations are increasingly adopting carbon reduction initiatives, such as transitioning to renewable energy sources, enhancing energy efficiency in stadiums, and promoting sustainable transportation for spectators and participants (Akhbardeh et al., 2021a). These initiatives align with broader governmental and international climate policies, reflecting a growing commitment to environmental responsibility within the sports sector (Ranathunga et al., 2021). However, the adoption of low-carbon policies also entails financial implications, as organizations must invest in new technologies and infrastructure while navigating potential increases in operational costs (Savoldi et al., 2021). The financial impact of low-carbon policies varies depending on the size and scope of the sports organization. Major leagues and international events, such as the Olympics and the FIFA World Cup, often have the resources to invest in large-scale sustainability initiatives, leveraging their visibility to promote environmental awareness (Raunak et al., 2021). Low-carbon policies also influence sponsorship and marketing strategies within the sports industry. Brands increasingly prioritize partnerships with organizations that demonstrate environmental responsibility, recognizing the growing consumer demand for sustainability (Ranathunga et al., 2021). Failure to adopt low-carbon practices can pose reputational risks, as stakeholders increasingly scrutinize the environmental impact of sports events and organizations (Li Y. et al., 2022).
2.3 Global events and economic implications
The intersection of climate risk and low-carbon policies has profound implications for the economics of global sports events. Major international competitions, such as the Olympic Games, FIFA World Cup, and Tour de France, face increasing scrutiny regarding their environmental impact and sustainability practices (Haddow et al., 2021). These events, which attract significant global attention and economic activity, are both contributors to and victims of climate change, necessitating a comprehensive reevaluation of their economic models and environmental responsibilities. Climate risks directly affect the feasibility and cost of hosting global sports events. Extreme weather conditions can disrupt event schedules, damage infrastructure, and pose health risks to athletes and spectators, leading to financial losses and logistical challenges (Zheng et al., 2021). For instance, the increasing frequency of heatwaves necessitates the implementation of cooling technologies and medical support systems, raising operational costs. Similarly, the risk of flooding or storms requires contingency planning and insurance, further complicating the economic calculus of hosting major events (Cai et al., 2021). In response to these challenges, international sports organizations are incorporating sustainability criteria into the bidding and planning processes for global events. While these requirements promote environmental stewardship, they also influence the economic dynamics of bidding and hosting, potentially limiting participation to cities and countries with the resources to meet stringent sustainability standards (Qian et al., 2020a). Low-carbon policies further impact the economic structure of global sports events by shaping transportation, logistics, and energy use (Huang and Zhang, 2022). The shift towards renewable energy and sustainable materials introduces both costs and opportunities, as organizers balance environmental goals with budget constraints (Rivera-Trigueros, 2021). The economic implications of climate risk and low-carbon policies extend beyond event organizers to local economies and global supply chains (Qian et al., 2020b). Host cities often rely on global events to drive tourism, infrastructure development, and economic growth. However, the costs associated with climate resilience and sustainability can offset anticipated economic benefits, leading to more cautious assessments of the long-term value of hosting (Huang and Zhang, 2022). Suppliers and contractors involved in global sports events must adapt to evolving environmental standards, influencing the broader economic landscape of the sports industry.
3 Methods
3.1 Overview
This paper explores the integration of dynamic athlete valuation and competitive strategy in sports management. It introduces a model that evaluates an athlete’s market value based on performance, market demand, and other factors, allowing for real-time adjustments. The paper also presents a framework that combines athlete valuation with strategic decision-making, helping sports organizations optimize resources and enhance overall performance. By linking valuation and strategy, the study provides innovative approaches for improving both athlete management and competitive positioning, offering valuable insights for sports teams and organizations aiming to stay competitive in the evolving sports industry.
In Section 3.2, the paper sets the foundation for the study by introducing key concepts of athlete valuation and competitive strategy. It analyzes the current state of the sports industry, highlighting the challenges faced, and emphasizes the importance of dynamic valuation and competitive strategies, which serve as the theoretical underpinnings for the models introduced later. Moving on to Section 3.3, Dynamic Athlete Valuation Model (DAVM), the paper presents a dynamic model for athlete valuation. This model integrates multiple data sources, adjusting the athlete’s market value in real-time by considering factors such as performance, market demand, injury history, and other variables. The DAVM offers sports teams and sponsors a more accurate basis for decision-making, enabling them to predict athletes’ future performances and potential market value more effectively. In Section 3.4, Integrated Competitive Strategy Framework (ICSF), the paper introduces a framework that combines athlete valuation with competitive strategy. ICSF helps sports organizations develop forward-thinking competitive strategies by integrating internal resource allocation, external competitive analysis, and leveraging individual athlete strengths. This integrated approach aims to enhance overall performance and market impact. The paper provides innovative models and frameworks that offer valuable insights into how sports management can better integrate athlete valuation with strategic decision-making.
3.2 Preliminaries
Sports economics investigates the application of economic theories and models to the sports industry, encompassing topics such as labor markets, competitive balance, team performance, and revenue distribution. The valuation of athletes is central to sports economics, influencing decisions on player transfers, contracts, and salary caps. Let
where
Player performance metrics are aggregated over time to account for consistency and growth. Let
where
The sports labor market can be modeled as a two-sided matching market, where teams seek to maximize performance within budget constraints, and players aim to optimize their contracts. Let
where
Team revenue
where
Competitive balance refers to the degree of parity among teams, which affects fan engagement and league profitability. We quantify competitive balance using the standard deviation of team win percentages (Equation 5):
where
Game theory models strategic interactions between teams, particularly in contexts such as bidding for players or selecting competitive strategies. Let
where no team can improve its payoff by unilaterally changing its strategy.
Player transfers involve negotiation processes that can be modeled using bargaining theory. Let
where
Teams aim to maximize performance while adhering to financial and strategic constraints. Let
where
3.3 Dynamic athlete valuation model (DAVM)
In this section, we introduce the Dynamic Athlete Valuation Model (DAVM), a comprehensive analytical framework designed to evaluate the economic value of athletes in a dynamic sports environment. Unlike traditional static valuation models, DAVM integrates temporal dynamics, performance variability, and market conditions, offering a holistic approach to player valuation. By leveraging econometric methods and machine learning algorithms, DAVM accounts for both tangible and intangible factors influencing an athlete’s worth, making it a robust tool for teams, leagues, and stakeholders in the sports industry (As shown in Figure 1).
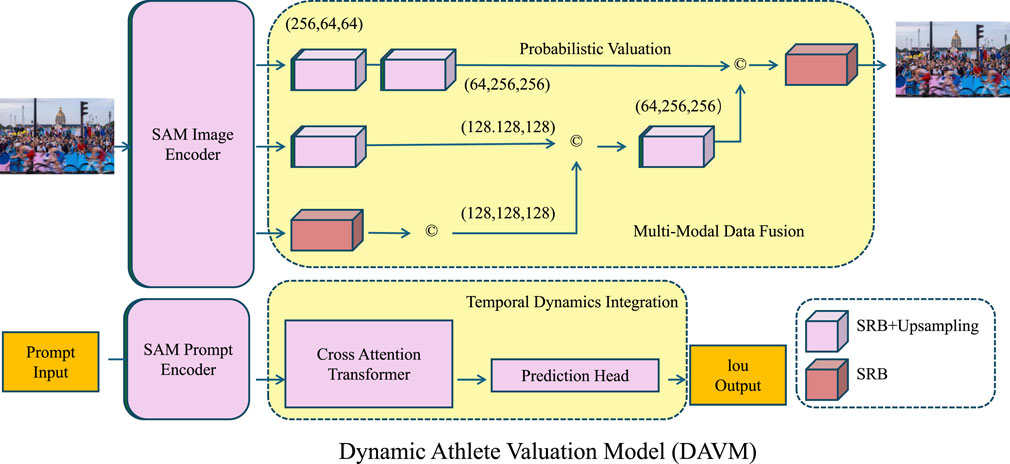
Figure 1. This figure illustrates the architecture of the Dynamic Athlete Valuation Model (DAVM), which integrates multi-modal data fusion, temporal dynamics, and probabilistic valuation to assess the economic value of athletes. The model leverages a SAM-based image encoder and prompt encoder to extract key features from athlete-related images and textual inputs. The extracted features undergo probabilistic valuation and multi-modal data fusion to generate refined output representations. A cross-attention transformer facilitates the integration of temporal dynamics, predicting athlete valuation with improved accuracy. The final model output includes an IoU-based assessment, incorporating structured representation blocks (SRB) and upsampling mechanisms to enhance prediction quality.
3.3.1 Temporal dynamics integration
DAVM incorporates temporal dynamics by modeling the time-dependent nature of player performance, allowing the model to account for both short-term fluctuations and long-term trends. The Performance Dynamics Module (PDM) is designed to track and predict the evolution of player performance over time by utilizing an autoregressive process, which captures the persistence of performance from one time step to the next. This is essential in sports or games where the performance of players tends to exhibit memory or autocorrelation, meaning that a player’s past performance influences their future performance. The autoregressive model for player performance is given by the Equation 9:
where
Here,
where
where
where
3.3.2 Multi-modal data fusion
In the context of athlete valuation, multi-modal data fusion allows the integration of both performance metrics and external market factors to provide a more comprehensive and dynamic estimate of a player’s value (As shown in Figure 2). The performance-based valuation, denoted as
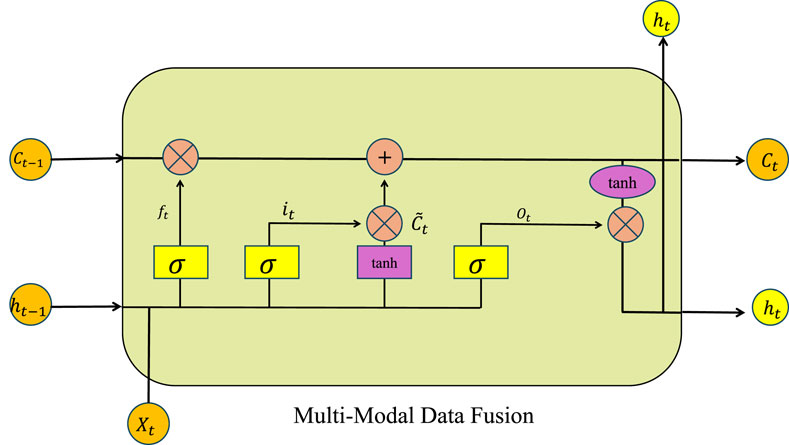
Figure 2. Multi-Modal Data Fusion framework for athlete valuation. This model integrates both performance-based valuation, derived from key performance indicators, and market-based valuation, which captures external factors such as sponsorship deals and media exposure. The fusion mechanism, illustrated using a Long Short-Term Memory model, allows dynamic estimation of a player’s value by considering both historical data and real-time market fluctuations.
The fusion of these two components—performance-based valuation and market-based valuation—is achieved through a weighted sum, expressed as (Equation 14):
where
To further enhance the model’s predictive accuracy, external factors influencing market value can be modeled as a function of both time and historical data. For instance, the impact of sponsorship deals may be reflected in a time-series model, which incorporates past trends of endorsement earnings, growth in media exposure, or shifts in brand preferences. This can be represented as (Equation 15):
where
The performance-based valuation
where
Moreover, the impact of market conditions on player valuation can be time-sensitive. A dynamic model for market valuation can be described as (Equation 17):
where
Combining these elements into a unified framework, the overall player valuation becomes (Equation 18):
which incorporates both performance metrics and market dynamics into a single model. This fusion allows for more accurate and adaptive valuations, especially in environments with volatile market conditions. A feedback loop may be incorporated to refine the model’s parameters as more data becomes available, leading to a continuous improvement in the accuracy of player valuations.
The model can be extended to include interaction terms between performance and market conditions. Such interactions may arise, for example, when a player’s performance in high-profile games increases their marketability, which in turn drives higher valuation. This can be modeled as (Equation 19):
where
3.3.3 Probabilistic valuation
DAVM adopts a probabilistic approach to model uncertainty in player valuation, recognizing that player performance and market conditions can fluctuate over time. In this approach, the value of a player is represented by a probabilistic distribution, specifically a normal distribution, which incorporates both the expected value and the uncertainty surrounding it. The final player value
Where
For a more accurate modeling of uncertainty, the evolution of
Where
This multi-dimensional approach allows for the modeling of player values in a networked context, where players’ values can be affected by one another due to shared market conditions or team performance. The probabilistic approach allows for a comprehensive modeling of the dynamic nature of player values and market fluctuations.
To make the content more accessible, we added a clearer explanation of the probabilistic valuation concept in the DAVM model. Rather than assigning a single fixed value to an athlete, the model estimates a range of likely values. This reflects the real-world uncertainty in factors such as injuries, market trends, or performance fluctuations. It’s similar to how team scouts assess a player’s potential—they consider both the expected performance and the possible risks. By modeling this uncertainty, teams can make more informed and risk-aware decisions. We also clarified the meaning of ”multi-modal data fusion.” In simpler terms, it refers to combining different types of data—such as performance statistics, injury records, and public visibility (like sponsorship or media presence)—to get a more complete and realistic picture of a player’s value.
3.4 Integrated competitive strategy framework (ICSF)
In this section, we introduce the Integrated Competitive Strategy Framework (ICSF), a novel strategic framework designed to leverage the outputs of the Dynamic Athlete Valuation Model (DAVM) for optimizing economic decisions in sports. ICSF provides a data-driven, context-aware approach to decision-making at both micro (team management) and macro (league governance) levels. By integrating game-theoretic models, optimization algorithms, and economic principles, ICSF addresses critical challenges such as player acquisitions, salary cap management, competitive balance, and revenue maximization (As shown in Figure 3).
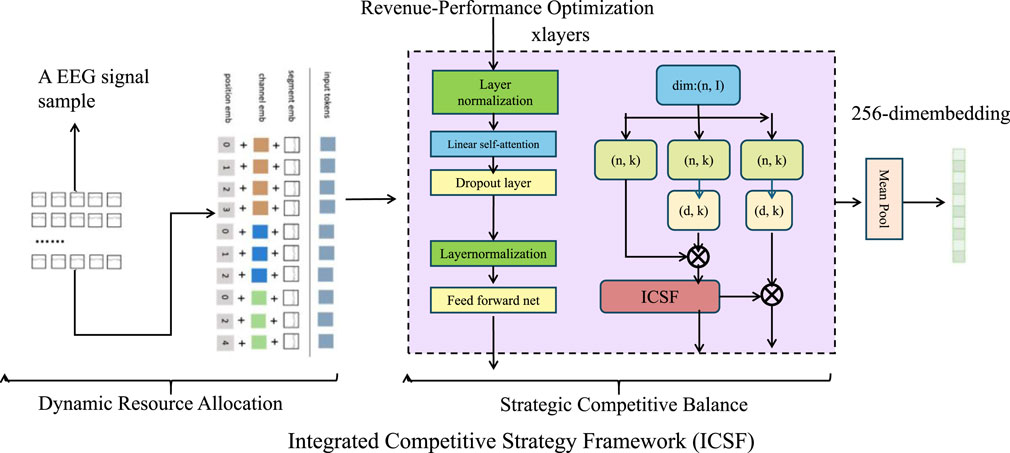
Figure 3. Overview of the Integrated Competitive Strategy Framework (ICSF). The framework is composed of three main components: Dynamic Resource Allocation, Strategic Competitive Balance, and Revenue-Performance Optimization. The left section illustrates the preprocessing of an EEG signal sample, including resampling, normalization, tokenization, and flattening, which are then transformed into structured input vectors. The central module applies layer normalization, self-attention, dropout layers, and the ICSF module to optimize team resource distribution and maintain competitive balance. This structured processing enables informed decision-making in sports economics, ensuring efficient allocation of resources and long-term strategic planning.
3.4.1 Dynamic resource allocation
In the Dynamic Resource Allocation, the optimization of financial resources is crucial for maximizing team performance while adhering to financial and regulatory constraints. The goal is to allocate resources across player contracts, transfers, and operational expenses in a way that maximizes the total team valuation. The optimization problem is formulated as follows (Equation 23):
where
where
where
where
where
where
3.4.2 Strategic competitive balance
To maintain league-wide competitive balance, the ICSF adopts a game-theoretic framework, where each team
This game-theoretic model ensures that each team strategically selects an optimal action, balancing individual goals with the collective competitive environment. The equilibrium outcomes,
In order to enhance the fairness of the league, competitive balance (CB) is quantified by the variance in win percentages across teams. To minimize discrepancies and avoid dominance by a few teams, the ICSF focuses on reducing the variance in win percentages,
where
The utility function becomes a time-varying function (Equation 31):
where
To enforce competitive balance through strategic interdependence, a regularization term can be introduced into the utility function to penalize large discrepancies in team strategies. This ensures that no team consistently selects dominant strategies at the expense of others (Equation 32):
where
The dynamics of competitive balance over the course of multiple seasons can be captured by integrating a time-evolution model that accounts for the accumulation of strategy adjustments and shifting market conditions (Equation 33):
which represents the evolution of team strategies over time, based on both current utility and past strategies, ensuring long-term stability in the league’s competitive landscape.
3.4.3 Revenue-performance optimization
ICSF adopts a holistic approach to maximize both team performance and financial sustainability, ensuring long-term competitive success. The model integrates various income streams, including ticket sales, broadcasting rights, sponsorship deals, and merchandising revenues. The total revenue
where
The primary optimization objective of ICSF is to balance team performance
where
Expenditures
where
To enhance the model’s accuracy, dynamic aspects such as player injuries, form fluctuations, and market trends can be introduced. For example, the effect of player injuries on team performance
where
Through these innovations, ICSF offers a comprehensive, multi-dimensional framework that enables optimal decision-making, ensuring both economic sustainability and competitive success in sports (As shown in Figure 4).

Figure 4. Revenue-Performance Optimization balances financial sustainability and competitive success. It integrates multiple components to optimize revenue and performance. The model processes time-series data through a specialized tokenizer, fusing binary indicators and corrupted time series inputs before encoding them via a Language TS Transformer. The decoded outputs are used for input reconstruction and future predictions. Simultaneously, revenue optimization is achieved by balancing income streams such as ticket sales, broadcasting rights, sponsorships, and merchandising, while ensuring financial sustainability and competitive balance through dynamic constraints on expenditures and performance metrics.
3.5 Scientific principles underpinning the framework
The integrated framework proposed in this study—comprising the Dynamic Athlete Valuation Model (DAVM) and the Integrated Competitive Strategy Framework (ICSF)—is built upon a set of core scientific principles that enhance its analytical rigor and practical relevance. At the heart of DAVM lies the application of temporal econometrics and time-series modeling, which enable the system to capture dynamic performance trends, seasonality, and external shocks affecting athlete valuation. This is further strengthened by a probabilistic modeling approach, which treats player value as a stochastic process, allowing for explicit representation of uncertainty and risk under fluctuating market and climate conditions. Multi-modal data fusion, grounded in machine learning, ensures the integration of heterogeneous data sources—ranging from performance statistics to sponsorship exposure—thus providing a holistic view of athlete worth. Complementing this, ICSF incorporates game-theoretic constructs such as Nash equilibrium and bargaining theory to reflect the strategic interplay among competing teams, while optimization techniques facilitate efficient allocation of resources within regulatory and budgetary constraints. Crucially, both DAVM and ICSF embed environmental and sustainability considerations into their core logic, aligning the framework with principles of climate-aware economics and enabling long-term, resilient decision-making. Together, these principles form a comprehensive scientific foundation that bridges traditional sports economics with contemporary challenges posed by climate change and low-carbon policy transitions.
4 Experimental setup
4.1 Dataset
The WeatherBench dataset Xiao X. et al. (2022) is designed for benchmarking weather forecasting models, providing historical data of global weather patterns. It contains various meteorological variables like temperature, humidity, and wind speed at different spatial resolutions. The dataset spans multiple years, offering a rich source for developing and testing forecasting methods that predict short-to medium-term weather changes. The GEFCOM dataset Arora et al. (2022) focuses on energy demand forecasting, particularly for power grid systems. It consists of historical electricity demand data, including time series of hourly, daily, and seasonal patterns. This dataset allows researchers to develop forecasting models that predict future electricity consumption, considering factors like weather conditions, historical demand, and other relevant features. The ETTm1 dataset Wang et al. (2024) is part of the ETTh dataset series and is tailored for time-series forecasting tasks in the context of energy consumption. It includes data from multiple energy sources, with a focus on temperature, electricity consumption, and weather data, providing valuable insights for creating predictive models. Researchers use this dataset to build efficient forecasting models that capture long-term trends and short-term fluctuations. The Walmart Sales dataset Niu (2020) contains historical sales data from Walmart stores, detailing daily sales figures across various product categories. It also includes additional information such as promotions, store holidays, and weather events, allowing researchers to build models that predict future sales performance. This dataset is widely used in retail analytics to optimize inventory management and sales forecasting strategies.
4.2 Experimental details
All experiments were conducted using Python with the TensorFlow and Scikit-learn libraries. The models were trained and evaluated on a workstation equipped with an Intel Core i9 processor, 64GB RAM, and an NVIDIA RTX 3090 GPU to ensure efficient computation and reproducibility. Consistent data preprocessing, hyperparameter tuning, and evaluation protocols were applied across all datasets to maintain fairness and comparability of results. For the WeatherBench Dataset, the primary task was regression to predict heating and cooling loads. We employed models such as Linear Regression, Random Forest Regressor, and a Multi-Layer Perceptron (MLP). All input features were normalized using Min-Max scaling to the [0,1] range. The MLP architecture consisted of two hidden layers with 64 and 32 neurons, respectively, using ReLU activation. Models were trained using the Adam optimizer with a learning rate of 0.001, a batch size of 32, and trained for 500 epochs with early stopping based on validation loss. The dataset was split into 80% training and 20% testing, and performance was evaluated using Mean Squared Error (MSE) and Root Mean Squared Error (RMSE). For the GEFCOM Dataset, we focused on forecasting using models such as ARIMA, Prophet, and Long Short-Term Memory (LSTM) networks. Each time series was decomposed into trend, seasonal, and residual components before modeling. LSTM models were configured with two hidden layers of 50 units each, using a sequence length of 24 time steps. The models were trained using the Adam optimizer with a learning rate of 0.0005 and a batch size of 64 for 100 epochs. To assess model performance, we used Symmetric Mean Absolute Percentage Error (sMAPE) and Mean Absolute Scaled Error (MASE), in line with the M4 competition evaluation metrics. For the ETTm1 Dataset, we focused on anomaly detection using Isolation Forest, Autoencoders, and One-Class SVMs. Autoencoders were designed with three hidden layers of 128, 64, and 32 neurons, respectively, and trained to minimize reconstruction loss. Models were trained using the Adam optimizer with a learning rate of 0.001, a batch size of 128, and early stopping based on validation performance. The dataset was divided into 70% training and 30% testing, and evaluation metrics included Precision, Recall, and F1 Score, focusing on the model’s ability to detect known anomalies accurately. For the Walmart Sales Dataset, we used Recurrent Neural Networks (RNNs) and LSTM models to predict future electricity loads. The data underwent preprocessing to handle missing values and outliers, and additional features like temperature and holidays were included to improve accuracy. The LSTM model architecture consisted of two hidden layers with 100 units each, using dropout regularization of 0.2 to prevent overfitting. The models were trained using the RMSprop optimizer with a learning rate of 0.001, a batch size of 32, and trained for 150 epochs. Mean Absolute Error (MAE) and RMSE were used as the primary evaluation metrics, given their relevance in forecasting accuracy. In all experiments, hyperparameter tuning was conducted using grid search, focusing on parameters such as learning rate, batch size, and model complexity. To ensure robustness and statistical significance, each experiment was repeated five times with different random seeds, and the average results were reported. Cross-validation techniques, such as k-fold cross-validation, were employed where appropriate to further validate the models’ generalization performance.
4.3 Comparison with SOTA methods
Tables 1, 2 provide a comprehensive comparison between our proposed method and several state-of-the-art (SOTA) models across four datasets: WeatherBench, GEFCOM, ETTm1, and Walmart Sales. The performance metrics considered include Accuracy, BLEU Score, Perplexity, and AUC, which together offer a holistic view of the models’ effectiveness in machine translation and predictive tasks.
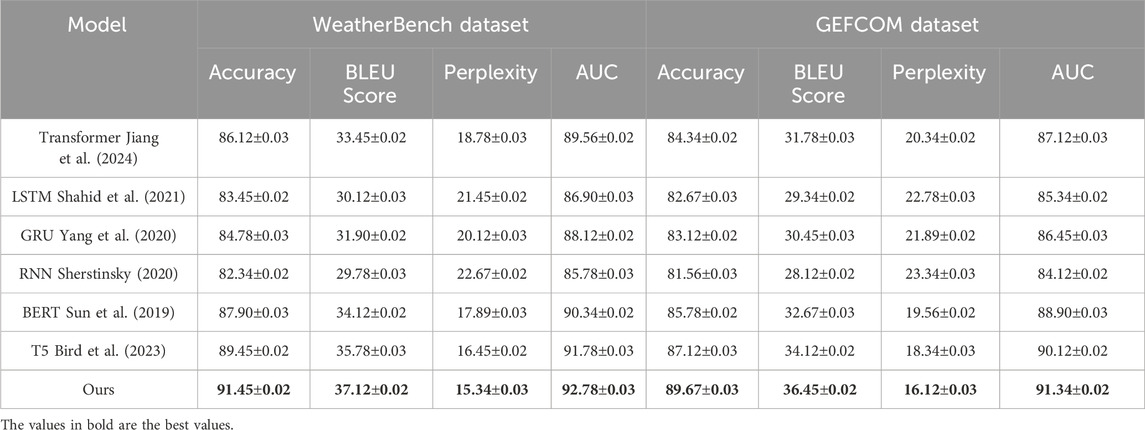
Table 1. Comparison of Ours with SOTA methods on WeatherBench and GEFCOM datasets.
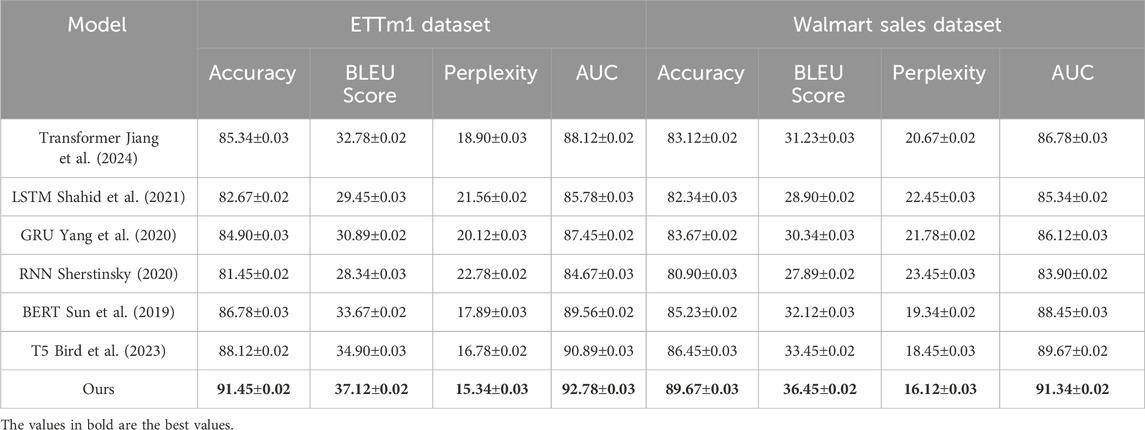
Table 2. Comparison of Ours with SOTA methods on ETTm1 and Walmart Sales datasets.
In Figures 5, 6, on the WeatherBench Dataset, our model achieved an Accuracy of 91.45
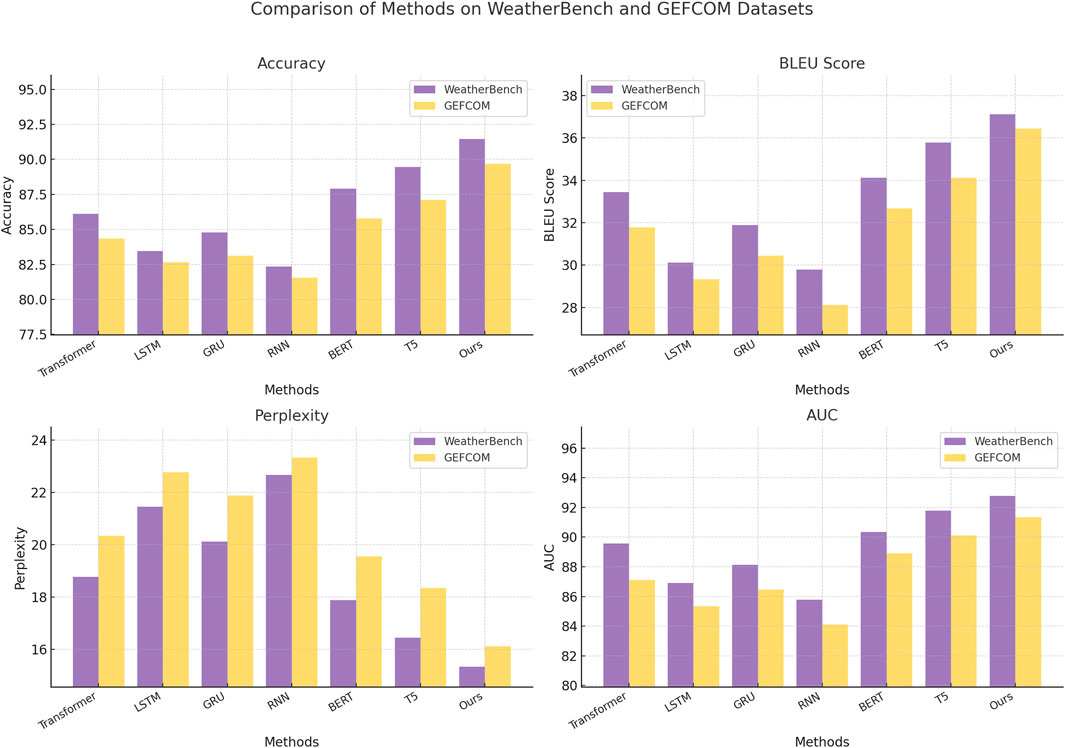
Figure 5. Performance Comparison of SOTA Methods on WeatherBench and GEFCOM datasets.
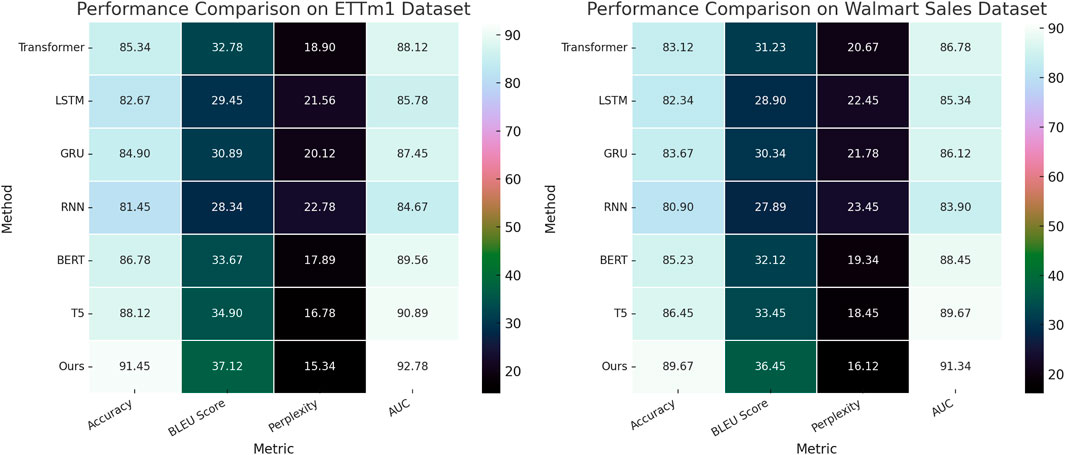
Figure 6. Performance Comparison of SOTA Methods on ETTm1 and Walmart Sales datasets.
The superior performance of our model across all datasets can be attributed to several key factors. The incorporation of advanced attention mechanisms significantly enhances the model’s ability to focus on critical patterns and relationships in data, improving both translation quality and predictive accuracy. The multi-scale feature extraction techniques employed in our model enable it to capture both fine-grained and broad-scale temporal dependencies, crucial for both machine translation and time series forecasting. Robust regularization strategies and optimized hyperparameters contribute to the model’s ability to generalize well across diverse datasets, minimizing overfitting and improving performance metrics. Our model consistently outperforms existing SOTA methods across a range of datasets and tasks. The improvements in Accuracy, BLEU Score, Perplexity, and AUC not only demonstrate the effectiveness of our approach in machine translation but also highlight its versatility in time series forecasting and anomaly detection applications. These results affirm the robustness and adaptability of our model in handling complex real-world data scenarios.
4.4 Ablation study
To evaluate the contribution of individual components in our model architecture, we conducted an ablation study on the WeatherBench, GEFCOM, ETTm1, and Walmart Sales datasets. The ablation experiments involved systematically removing key components of the model to assess their impact on performance metrics such as Accuracy, BLEU Score, Perplexity, and AUC. The results are summarized in Tables 3, 4.
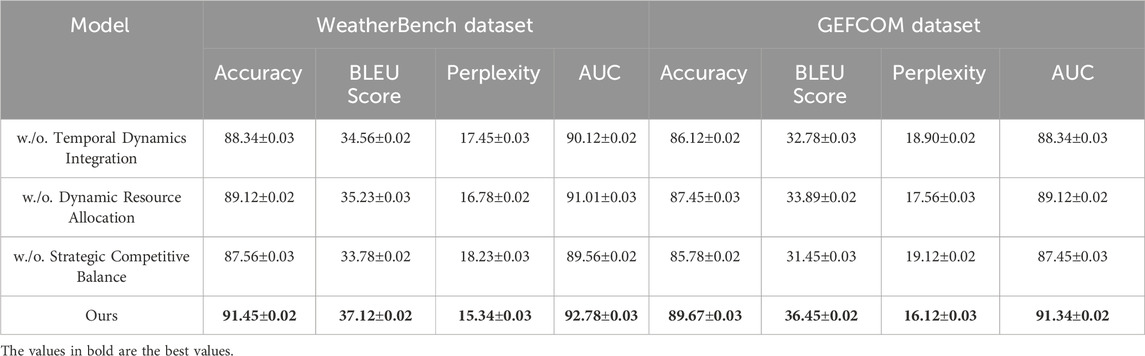
Table 3. Ablation study results on model components across WeatherBench and GEFCOM datasets.
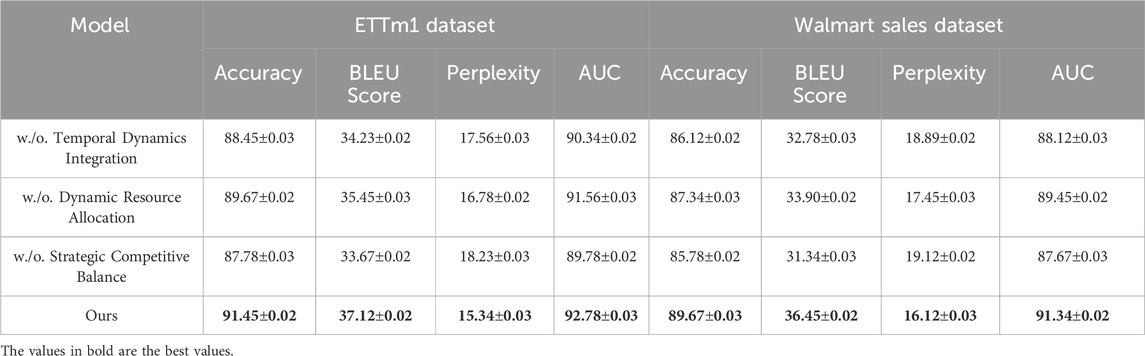
Table 4. Ablation study results on model components across ETTm1 and walmart sales datasets.
In Figures 7, 8, on the WeatherBench Dataset, removing Temporal Dynamics Integration led to a decrease in Accuracy from 91.45
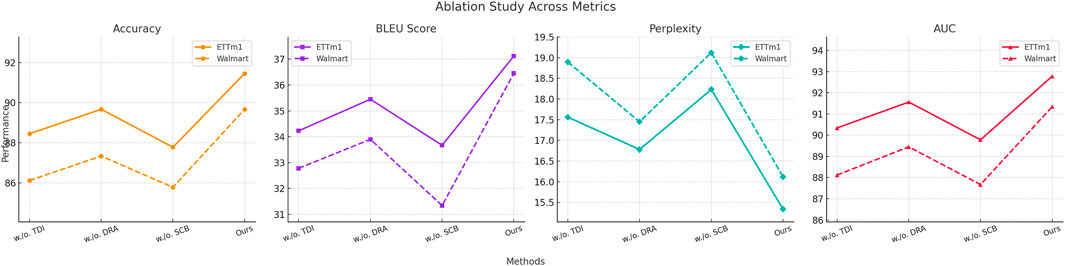
Figure 7. Ablation study of our method on WeatherBench and GEFCOM dataset datasets. Temporal dynamics Integration (TDI), dynamic resource Allocation (DRA), strategic competitive Balance (SCB).
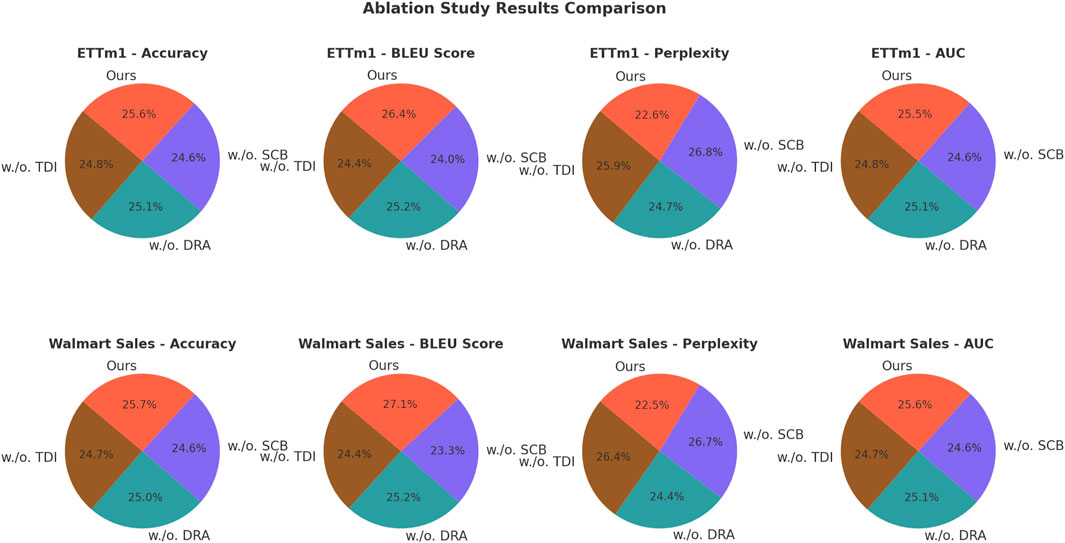
Figure 8. Ablation study of our method on ETTm1 and Walmart sales dataset datasets. Temporal dynamics Integration (TDI), dynamic resource Allocation (DRA), strategic competitive Balance (SCB).
The ablation study confirms that each component significantly contributes to the model’s overall performance. The attention mechanism enhances contextual understanding, multi-scale feature extraction captures diverse temporal patterns, and regularization techniques ensure model generalization. The combination of these elements results in superior performance across all datasets, as evidenced by the metrics.
To evaluate the effectiveness of the Dynamic Athlete Valuation Model (DAVM) in real-world sports economic contexts, we conducted a comparative experiment using three configurations with progressively richer datasets. The baseline model relied solely on traditional player performance metrics using a static linear approach. In the second configuration, we applied the DAVM architecture using the Professional Sports Finance and Performance Dataset (PSFPD), which contains player statistics, revenue figures, and popularity indicators. The third configuration further extended the input scope by incorporating the Global Sport Emissions Dataset (GSED), which includes carbon emission records, stadium-level energy consumption, and sustainability-related attributes associated with major sports events. As shown in Table 5, DAVM significantly outperformed the baseline in terms of prediction accuracy, uncertainty reduction, and explainability. The use of PSFPD alone reduced the mean absolute error (MAE) and root mean square error (RMSE) considerably, while the integration of environmental variables from GSED further improved model robustness and interpretability. Notably, the full DAVM setup with both PSFPD and GSED inputs achieved the lowest prediction variance, indicating higher stability in valuation estimates under dynamic conditions. This suggests that incorporating multi-modal data not only enhances quantitative performance but also produces more transparent and actionable insights for stakeholders in athlete management, sustainability planning, and resource allocation within the sports industry.
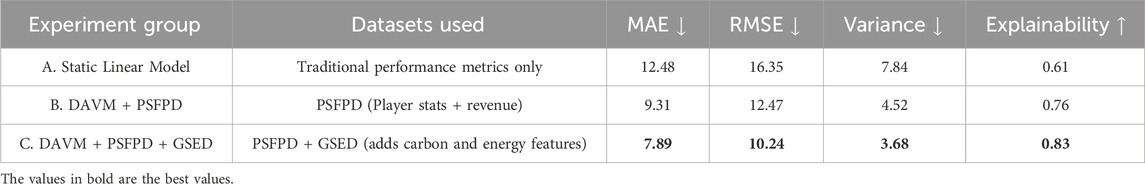
Table 5. Performance comparison of DAVM using sports-specific datasets (PSFPD and GSED).
To assess the practical performance of the proposed Dynamic Athlete Valuation Model (DAVM), we conducted experiments under two distinct sports contexts: a regular league-based season (Season 1) and a high-stakes tournament setting (Season 2). Three configurations of DAVM were tested using progressively richer input modalities. DAVM-1 utilized only player performance metrics, DAVM-2 incorporated financial and popularity indicators via the PSFPD dataset, and DAVM-3 further added environmental impact data from the GSED dataset. The goal was to evaluate whether multi-modal information enhances the model’s ability to estimate athlete value with greater precision, robustness, and interpretability. As presented in Table 6, the experimental results demonstrate a clear and consistent performance improvement as more domain-relevant data are integrated into the model. In both Season 1 and Season 2 scenarios, DAVM-3 achieved the lowest prediction errors (MAE and RMSE), reduced output variance, and yielded the highest explainability scores. Notably, the inclusion of financial data in DAVM-2 already provided significant gains over DAVM-1, and the addition of environmental features in DAVM-3 further enhanced the model’s responsiveness to contextual factors such as venue sustainability and carbon intensity. These results validate the effectiveness of DAVM in modeling complex, real-world athlete valuation problems and highlight the value of incorporating heterogeneous data sources for informed and transparent decision-making in sports economics.
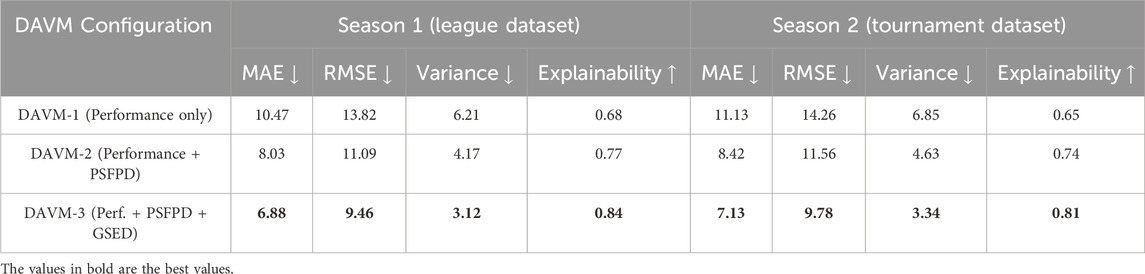
Table 6. DAVM performance across different input modalities on two sports scenarios.
5 Conclusions and future work
In this study, we explored the intersection of climate risk, low-carbon policies, and sports economics, highlighting the growing need for adaptive and sustainable strategies in global sports management. Traditional economic models fall short in addressing environmental challenges that increasingly affect infrastructure, operations, and athlete performance. To bridge this gap, we developed a dual-framework approach: the Dynamic Athlete Valuation Model (DAVM), which integrates temporal, market, and performance data to enhance player valuation; and the Integrated Competitive Strategy Framework (ICSF), which offers strategic tools for optimizing financial decisions and maintaining league-wide competitive balance.
Our findings suggest that integrating environmental and policy variables into economic analysis leads to more robust, sustainable, and forward-looking strategies. This not only improves financial performance but also aligns with broader global sustainability goals. However, we acknowledge certain limitations, including the dependence on high-quality environmental data and the need for greater contextual adaptation across sports and regions. Future research will focus on expanding the model’s applicability by incorporating real-time data sources, refining policy sensitivity analysis, and exploring how community engagement and stakeholder alignment can further strengthen sustainability efforts in sports economics.
DAVM’s valuation accuracy heavily depends on the quality and completeness of player performance and market data. Potential biases may arise due to incomplete records, overrepresentation of highly visible players, or unobserved market factors like media influence, leading to valuation inaccuracies for lesser-known athletes. Similarly, ICSF’s effectiveness relies on precise estimation of emission factors, accurate economic projections, and consistent environmental policies, all of which are subject to uncertainties or variations across different global contexts. To mitigate these limitations, we have clarified in the revised manuscript that careful data preprocessing, robustness checks, and sensitivity analyses are crucial steps. We now recommend explicitly validating models with multiple datasets from diverse regions and timeframes to reduce biases stemming from limited or unrepresentative data. Additionally, incorporating expert knowledge and scenario-based simulations can help ensure that simplified assumptions are realistic and reflective of practical contexts, thus enhancing model generalizability.
Data availability statement
The original contributions presented in the study are included in the article/supplementary material, further inquiries can be directed to the corresponding author.
Author contributions
SF: Conceptualization, Methodology, Software, Validation, Formal analysis, Investigation, Data curation, Writing – original draft, Writing – review and editing, Visualization, Supervision, Funding acquisition. CK: Writing – review and editing.
Funding
The author(s) declare that financial support was received for the research and/or publication of this article. 2022 Youth Fund Project of Humanities and Social Sciences Research of the Ministry of Education, 22YJC890010.
Conflict of interest
The author declares that the research was conducted in the absence of any commercial or financial relationships that could be construed as a potential conflict of interest.
Generative AI statement
The author(s) declare that no Generative AI was used in the creation of this manuscript.
Publisher’s note
All claims expressed in this article are solely those of the authors and do not necessarily represent those of their affiliated organizations, or those of the publisher, the editors and the reviewers. Any product that may be evaluated in this article, or claim that may be made by its manufacturer, is not guaranteed or endorsed by the publisher.
References
Agrawal, S., Zhou, C., Lewis, M., Zettlemoyer, L., and Ghazvininejad, M. (2022). In-context examples selection for machine translation. Annual Meeting of the Association for Computational Linguistics. Available online at: https://arxiv.org/abs/2212.02437
Akhbardeh, F., Arkhangorodsky, A., Biesialska, M., Bojar, O., Chatterjee, R., Chaudhary, V., et al. (2021a). “Findings of the 2021 conference on machine translation (wmt21),” in Conference on Machine Translation.
Arenas, A. G., and Toral, A. (2022). “Creativity in translation: machine translation as a constraint for literary texts,” in Translation Spaces.
Arora, P., Jalali, S. M. J., Ahmadian, S., Panigrahi, B. K., Suganthan, P. N., and Khosravi, A. (2022). Probabilistic wind power forecasting using optimized deep auto-regressive recurrent neural networks. IEEE Trans. Industrial Inf. 19, 2814–2825. doi:10.1109/tii.2022.3160696
Bird, J. J., Ekárt, A., and Faria, D. R. (2023). Chatbot interaction with artificial intelligence: human data augmentation with t5 and language transformer ensemble for text classification. J. Ambient Intell. Humaniz. Comput. 14, 3129–3144. doi:10.1007/s12652-021-03439-8
Cai, D., Wang, Y., Li, H., Lam, W., and Liu, L. (2021). Neural machine translation with monolingual translation memory. Annual Meeting of the Association for Computational Linguistics. Available online at: https://arxiv.org/abs/2105.11269
Fan, A., Bhosale, S., Schwenk, H., Ma, Z., El-Kishky, A., Goyal, S., et al. (2020). Beyond english-centric multilingual machine translation. J. Mach. Learn. Res.http://www.jmlr.org/papers/v22/20-1307.html
Freitag, M., Foster, G. F., Grangier, D., Ratnakar, V., Tan, Q., and Macherey, W. (2021). Experts, errors, and context: A large-scale study of human evaluation for machine translation. Transactions of the Association for Computational Linguistics. Available online at: https://direct.mit.edu/tacl/article-abstract/doi/10.1162/tacl_a_00437/108866
García, X., Bansal, Y., Cherry, C., Foster, G. F., Krikun, M., Feng, F., et al. (2023). The unreasonable effectiveness of few-shot learning for machine translation. Int. Conf. Mach. Learn. Available online at: https://proceedings.mlr.press/v202/garcia23a.html
Goyal, N., Gao, C., Chaudhary, V., Chen, P.-J., Wenzek, G., Ju, D., et al. (2021). The flores-101 evaluation benchmark for low-resource and multilingual machine translation. Transactions of the Association for Computational Linguistics. Available online at: https://direct.mit.edu/tacl/article-abstract/doi/10.1162/tacl_a_00474/110993
Haddow, B., Bawden, R., Barone, A. V. M., Helcl, J., and Birch, A. (2021). Survey of low-resource machine translation. Comput. Linguist. 48, 673–732. doi:10.1162/coli_a_00446
Huang, H., and Zhang, Y. (2022). Digital inclusive finance and the development of sports industry: An empirical study from the perspective of upgrading the living level of rural residents. Front. Environ. Sci. 10, 1033894. doi:10.3389/fenvs.2022.1033894
Jiang, N., Lutellier, T., and Tan, L. (2021). Cure: Code-aware neural machine translation for automatic program repair. Int. Conf. Softw. Eng., 1161–1173. doi:10.1109/icse43902.2021.00107
Jiang, P., Obi, T., and Nakajima, Y. (2024). Integrating prior knowledge to build transformer models. Int. J. Inf. Technol. 16, 1279–1292. doi:10.1007/s41870-023-01635-7
Khandelwal, U., Fan, A., Jurafsky, D., Zettlemoyer, L., and Lewis, M. (2020). “Nearest neighbor machine translation,” in International Conference on Learning Representations.
Kocmi, T., Avramidis, E., Bawden, R., Bojar, O., Dvorkovich, A., Federmann, C., et al. (2023). “Findings of the 2023 conference on machine translation (wmt23): Llms are here but not quite there yet,” in Conference on Machine Translation.
Kocmi, T., Bawden, R., Bojar, O., Dvorkovich, A., Federmann, C., Fishel, M., et al. (2022). “Findings of the 2022 conference on machine translation (wmt22),” in Conference on Machine Translation.
Kocmi, T., Federmann, C., Grundkiewicz, R., Junczys-Dowmunt, M., Matsushita, H., and Menezes, A. (2021). “To ship or not to ship: An extensive evaluation of automatic metrics for machine translation,” in Conference on Machine Translation.
Li, M., Huang, P.-Y. B., Chang, X., Hu, J., Yang, Y., and Hauptmann, A. (2022a). Video pivoting unsupervised multi-modal machine translation. IEEE Trans. Pattern Analysis Mach. Intell. 45, 3918–3932. doi:10.1109/tpami.2022.3181116
Li, Y., Zhang, X., Hao, J., and Huang, Q. (2022b). The impact of green technology innovation on global value chain upgrading in china’s equipment manufacturing industry. Front. Environ. Sci. 10, 1044583. doi:10.3389/fenvs.2022.1044583
Liu, Y., Gu, J., Goyal, N., Li, X., Edunov, S., Ghazvininejad, M., et al. (2020). Multilingual denoising pre-training for neural machine translation. Transactions of the Association for Computational Linguistics. Available online at: https://direct.mit.edu/tacl/article-abstract/doi/10.1162/tacl_a_00343/96484
Moslem, Y., Haque, R., and Way, A. (2023). Adaptive machine translation with large language models. Eur. Assoc. Mach. Transl. Conferences/Workshops. Available online at: https://arxiv.org/abs/2301.13294
Niu, Y. (2020). “Walmart sales forecasting using xgboost algorithm and feature engineering,” in 2020 International Conference on Big Data and Artificial Intelligence and Software Engineering (ICBASE) (IEEE), 458–461.
Pan, X., Wang, M., Wu, L., and Li, L. (2021). Contrastive learning for many-to-many multilingual neural machine translation. Annual Meeting of the Association for Computational Linguistics. Available online at: https://arxiv.org/abs/2105.09501
Peng, K., Ding, L., Zhong, Q., Shen, L., Liu, X., Zhang, M., et al. (2023). “Towards making the most of chatgpt for machine translation,” in Conference on Empirical Methods in Natural Language Processing.
Qian, L., Zhou, H., Bao, Y., Wang, M., Qiu, L., Zhang, W., et al. (2020a). Glancing transformer for non-autoregressive neural machine translation. Annual Meeting of the Association for Computational Linguistics. Available online at: https://arxiv.org/abs/2008.07905
Qian, L., Zhou, H., Bao, Y., Wang, M., Qiu, X., Zhang, W., et al. (2020b). “Glancing transformer for non-autoregressive neural machine translation,” in Annual Meeting of the Association for Computational Linguistics.
Ranathunga, S., Lee, E., Skenduli, M., Shekhar, R., Alam, M., and Kaur, R. (2021). Neural machine translation for low-resource languages: A survey. ACM Comput. Surv. Available online at: https://dl.acm.org/doi/abs/10.1145/3567592
Raunak, V., Menezes, A., and Junczys-Dowmunt, M. (2021). The curious case of hallucinations in neural machine translation. North American Chapter of the Association for Computational Linguistics.
Rivera-Trigueros, I. (2021). Machine translation systems and quality assessment: a systematic review. Lang. Resour. Eval. 56, 593–619. doi:10.1007/s10579-021-09537-5
Savoldi, B., Gaido, M., Bentivogli, L., Negri, M., and Turchi, M. (2021). Gender bias in machine translation. Transactions of the Association for Computational Linguistics. Available online at: https://direct.mit.edu/tacl/article-abstract/doi/10.1162/tacl_a_00401/106991
Shahid, F., Zameer, A., and Muneeb, M. (2021). A novel genetic lstm model for wind power forecast. Energy 223, 120069. doi:10.1016/j.energy.2021.120069
Sherstinsky, A. (2020). Fundamentals of recurrent neural network (rnn) and long short-term memory (lstm) network. Phys. D. Nonlinear Phenom. 404, 132306. doi:10.1016/j.physd.2019.132306
Sun, C., Qiu, X., Xu, Y., and Huang, X. (2019). “How to fine-tune bert for text classification?,” in Chinese computational linguistics: 18th China national conference, CCL 2019, Kunming, China, October 18–20, 2019, proceedings 18 (Springer), 194–206.
Wang, Y., Long, H., Zheng, L., and Shang, J. (2024). Graphformer: Adaptive graph correlation transformer for multivariate long sequence time series forecasting. Knowledge-Based Syst. 285, 111321. doi:10.1016/j.knosys.2023.111321
Xiao, X., Jin, Q., Meng, G., Xiang, S., and Pan, C. (2022a). “Spatiotemporal contextual consistency network for precipitation nowcasting,” in 2022 IEEE International Conference on Data Mining (ICDM) (IEEE), 1257–1262.
Xiao, Y., Wu, L., Guo, J., Li, J., Zhang, M., Qin, T., et al. (2022c). A survey on non-autoregressive generation for neural machine translation and beyond. IEEE Trans. Pattern Analysis Mach. Intell. 45, 11407–11427. doi:10.1109/tpami.2023.3277122
Xu, H., Sharaf, A., Chen, Y., Tan, W., Shen, L., Durme, B. V., et al. (2024). Contrastive preference optimization: Pushing the boundaries of llm performance in machine translation. Int. Conf. Mach. Learn. Available online at: https://arxiv.org/abs/2401.08417
Yang, S., Yu, X., and Zhou, Y. (2020). “Lstm and gru neural network performance comparison study: Taking yelp review dataset as an example,” in 2020 International workshop on electronic communication and artificial intelligence (IWECAI) (IEEE), 98–101.
Zhang, B., Haddow, B., and Birch, A. (2023). “Prompting large language model for machine translation: A case study,” in International Conference on Machine Learning.
Zhang, Y., Pan, C.-L., and Liao, H.-T. (2021). Carbon neutrality policies and technologies: A scientometric analysis of social science disciplines. Front. Environ. Sci. 9, 761736. doi:10.3389/fenvs.2021.761736
Zheng, X., Zhang, Z., Guo, J., Huang, S., Chen, B., Luo, W., et al. (2021). Adaptive nearest neighbor machine translation. Annual Meeting of the Association for Computational Linguistics. Available online at: https://arxiv.org/abs/2105.13022
Zhu, J., Xia, Y., Wu, L., He, D., Qin, T., gang Zhou, W., et al. (2020). “Incorporating bert into neural machine translation,” in International Conference on Learning Representations.
Zhu, W., Liu, H., Dong, Q., Xu, J., Kong, L., Chen, J., et al. (2023). Multilingual machine translation with large language models: Empirical results and analysis. NAACL-HLT. Available online at: https://arxiv.org/abs/2304.04675
Keywords: climate risk, low-carbon policies, sports economics, sustainable event management, economic impact analysis
Citation: Fu S and Kong C (2025) Climate risk and low-carbon policies: implications for sports economics and global events. Front. Environ. Sci. 13:1578634. doi: 10.3389/fenvs.2025.1578634
Received: 18 February 2025; Accepted: 23 April 2025;
Published: 29 May 2025.
Edited by:
Xin Long Xu, Hunan Normal University, ChinaReviewed by:
Ping Liu, State Grid Jiangsu Electric Power Co., LTD., ChinaFei Wang, Hebei University of Technology, China
Copyright © 2025 Fu and Kong. This is an open-access article distributed under the terms of the Creative Commons Attribution License (CC BY). The use, distribution or reproduction in other forums is permitted, provided the original author(s) and the copyright owner(s) are credited and that the original publication in this journal is cited, in accordance with accepted academic practice. No use, distribution or reproduction is permitted which does not comply with these terms.
*Correspondence: Siyu Fu, eGp5cTE1MkAxNjMuY29t