 Jing Chen
 Shan Yang3,4*
- 1School of Public Administration, Hebei University of Economics and Business, Shijiazhuang, China
- 2Hebei Collaborative Innovation Center for Urban-Rural Integrated Development, Hebei University of Economics and Business, Shijiazhuang, China
- 3North China Engineering Investigation Institute Co., Ltd., Shijiazhuang, China
- 4Technology Innovation Center for Groundwater Disaster Prevention and Control Engineering for Metal Mines, Ministry of Natural Resources, China
- 5Geography Group, Shijiazhuang Dongnan Experimental Middle School, Shijiazhuang, China
- 6The Registration Office, Hebei Cartographic Institute, Shijiazhuang, China
Introduction: China’s main grain-producing areas (MGPA) have made outstanding contributions to cultivated land protection and food security. Integrating cultivated land use with socio-economic activities and constructing a horizontal ecological compensation mechanism under the virtual cultivated land (VCL) framework are important measures for achieving the “Trinity Comprehensive Protection” of quantity, quality, and ecology cultivated land.
Methods: We used the North China Plain (NCP) as the research area and the multiregional input–output model to analyze inter-regional VCL flow, and ecological compensation standard was calculated based on the ecosystem services value.
Results: (1) VCL flowed from economically underdeveloped regions (e.g., Hebei, Shandong, and Henan) to economically developed regions (e.g., Beijing and Tianjin). As a net outflow region, the NCP provided VCL for the Yangtze River and Pearl River deltas (2) The compensation standards ranged from 2192–18406 yuan/hectare. Net inflow regions were payment areas, and net outflow regions were receiving areas. Beijing and Tianjin should pay 3.04 and 0.70 billion yuan for other provinces. The NCP should obtain 17.35 billion yuan from other regions in China.
Discussion: The research framework provides a basis for division of responsibility for cultivated land protection and offers ideas and frameworks for horizontal ecological compensation of cultivated land.
1 Introduction
1.1 Background
As a populous country, China uses approximately 9% of the world’s cultivated land to feed 20% of the population (Zuo et al., 2018), making a positive contribution to global food security and human development. The main grain-producing areas (MGPA), as important bases for grain production in China, account for 77.9% of total grain output from China (Cui N. B. et al., 2021), have made outstanding contributions to national food security. However, these regions have lost economic development opportunities because of the excessive burden of cultivated land protection, which has severely affected enthusiasm of farmers for growing grain (Wang Y. et al., 2024), and the high-quality development of regional agriculture (Xiang et al., 2024). Additionally, it leads to excessive consume of cultivated land resources and degradation of ecological service functions, increasing resource and environmental pressure and ecological risks of MGPA (Wei and Jia, 2023). Furthermore, with the spillover effect of the ecological value of cultivated land, MGPA also provides ecological service value to neighboring regions (Niu and Zhang, 2009), and further exacerbates the inequity between MGPA and main food consumption areas (MFSA). Since 2014, the No. 1 Central Document has continuously emphasized policy support for MGPA, steadily increasing fiscal transfer payments in these areas; however, these policies focus on economic compensation and lack sufficient attention to ecological compensation. Currently, the ecological compensation mechanism in China is mainly based on vertical compensation, with less attention paid to horizontal ecological compensation between regions, and the problems such as insufficient compensation funds, a single compensation method, and imperfect compensation mechanisms are prominent (Liu et al., 2024). In recent years, the government has proposed the concept of “precise compensation,” that is, “who benefits, who compensates.” However, due to the externalities of cultivated land, the range of beneficiary areas and the division of compensation responsibilities are not clear, which poses a challenge to the ecological compensation of cultivated land. The Third Plenary Session of the 20th Central Committee of the Communist Party of China in 2024 highlighted that “it is necessary to establishment horizontal benefit compensation mechanism between MGPA and MFSA, and take substantial steps in compensating MGPA.” In this context, it is desiderate to explore horizontal ecological compensation research in MGPA to provide new ideas and methods for improving the ecological compensation mechanism of cultivated land.
1.2 Literature review
1.2.1 Ecological compensation zoning
Ecological compensation zoning is the basis for delimiting the ecological compensation responsibility of cultivated land. Common methods in research on compensation standard are the Ecological Footprint and Food Safety methods. The Ecological Footprint Method uses the difference between the ecological footprint and ecological carrying capacity as the criterion for determining the compensation subject and object (Chen and Wang, 2021; Guan et al., 2022; Yang et al., 2019). The Food Security Method is based on the grain production of a region that can meet its self-sufficiency as an important indicator, with regions having less cultivated land supply than demand being payment areas, and the opposite being ecological compensation receiving areas (Su et al., 2022; Sun et al., 2018). However, both methods reflect a static state of regions and do not capture resource and ecological flow between regions, nor do they clearly identify the issue of “who compensates whom.” With the introduction of the “virtual land” concept (Würtenberger et al., 2006), “virtual cultivated land” (VCL) has been developed and used to calculate the cultivated land resources embodied in food grain (Yawson, 2020). Many scholars have attempted to use the VCL flow amount and direction as important indicators for determining the compensation subjects (Fan et al., 2018; Liang and Zhu, 2019). Common methods for measuring VCL flow include social equity, ecological network analysis, and food balance methods. These methods mostly calculate VCL based on the supply and demand of foodgrain within a region, ignoring the economic trades between regions. Multiregional input–output (MRIO) has been widely used in economic field. By describing the trade flow of goods and services between different regions, MRIO can reflect economic relationships between different sectors and regions (Chen et al., 2018) and accurately and comprehensively reflect the VCL flow amount and direction between regions (Han and Chen, 2018; Su et al., 2023). This method provides a comprehensive and systematic perspective for assessing resource utilization and environmental impacts (Wang Y. W. et al., 2024).
1.2.2 Ecological compensation standard
Determining compensation standards is key to ecological compensation. Various methods have been adopted to study ecological compensation standards, and each method has its own advantages and disadvantages. The essence of the opportunity cost method is the loss of opportunity cost for economic development and industrial transformation and upgrading due to the use of land for agricultural production (Chiodelli and Moroni, 2016), but the composition of opportunity costs has not yet been unified, and the results are higher than the actual compensation value (Chang and Yoshino, 2017). The willingness-to-pay method uses questionnaires to measure the maximum willingness to pay of respondents (Bhandari et al., 2016), considering individuals as research objects, making it difficult to apply it to cross-regional ecological compensation (Jin et al., 2018; Du et al., 2023). The ecosystem service value (ESV) method determines compensation standards by measuring the service values of different ecosystems (Niu et al., 2024), or combines with ecological footprints (Li et al., 2023). However, the ESV method often uses the total ESV as the compensation standard, neglecting the impact of socio-economic factors and leading to compensation standards that are too high to implement (Wei et al., 2023). Therefore, different compensation standards need to be calculated according to the regional economic and social development conditions.
1.3 Aim and question
China has a vast territory, and cultivated land is mostly distributed in major grain-producing and underdeveloped areas. Under the condition of an open grain market, the contradiction between supply and demand can be solved through foodgrain flow in areas with less cultivated land resources. As food grains flow between MGPA and MFSA, the VCL and ESV embodied in food grains also flows among regions (Liang et al., 2020), providing new ideas for establishing an ecological compensation mechanism for cultivated land (Cao et al., 2022). The North China Plain (NCP), a major grain-producing area in China, has lost opportunities for economic development due to the excessive task of cultivated land protection. Under the pressure of rapid urbanization and industrialization, the area of cultivated land has decreased, and the task of protecting cultivated land has gradually intensified. In this paper, the NCP was taken as an example in the present study, and the MRIO model was used to determine VCL flows and compensation zoning, clarifying the issue of “who compensates whom.” The equivalent factor method was used to calculate the ESV, which was then adjusted by natural and socio-economic factors to obtain the ecological compensation standard, addressing the issue of “how much to compensate.”
The marginal contributions of this study include: (1) Current compensation policies for MGPA focus on economic compensation and lack sufficient attention to ecological compensation. This paper conducts horizontal ecological compensation research on cultivated land in MGPA, aligning with the national strategy for protecting the interests of these areas and addressing a gap in the research scale; (2) Research on horizontal ecological compensation for existing cultivated land focuses on regional static studies, failing to reflect resource and ecological flow between regions, and does not clearly identify the issue of “who compensates whom.” This paper uses MRIO tables to describe the virtual flow of cultivated land between regions, distinguishing ecological compensation payment areas and receiving area based on the net flow, and clarifying “who compensates whom” based on the VCL flow direction, and; (3) Current standards for ecological compensation for cultivated land exhibit a “one-size-fits-all” phenomenon and overlook the ecosystem service flow between regions. This paper considering differences in regional natural and socio-economic conditions to determine different ecological compensation standards.
2 Research framework
Based on the public goods theory, externality theory and the theory of transfer of development rights (Yang et al., 2024), economically developed regions with a large population but limited cultivated land should provide financial compensation to economically underdeveloped regions that have taken on too many tasks of cultivated land protection. This is usually done through fiscal transfer payments. In this process, the ESV of cultivated land spillover also needs to be given due attention. Only by fully manifesting the hidden ecological benefits of cultivated land can we effectively coordinate the conflicts of interest in cultivated land ecological protection among regions. The pattern of “transporting grain from the north to the south” in China has emerged (Deng et al., 2023). With the inter-regional flow of foodgrain, the VCL and its ESV embedded in the foodgrain also flow among regions. The pattern of this flow is not only emerged between MGPA and MFSA but also exists within the MGPA. This can provide new ideas and scientific support for the establishment of inter-regional ecological compensation for cultivated land.
Based on the above research theory, this paper takes the NCP as the research area, and divides the ecological compensation payment/receiving area by calculating the VCLF, and revises the horizontal ecological compensation standard based on ESV. The framework consists of two parts: (1) the issue of “who compensates whom” - that is, the delineation of compensation zoning, and (2) the issue of “how much to compensate” - the calculation of horizontal ecological compensation standards. The research framework is shown in Figure 1.
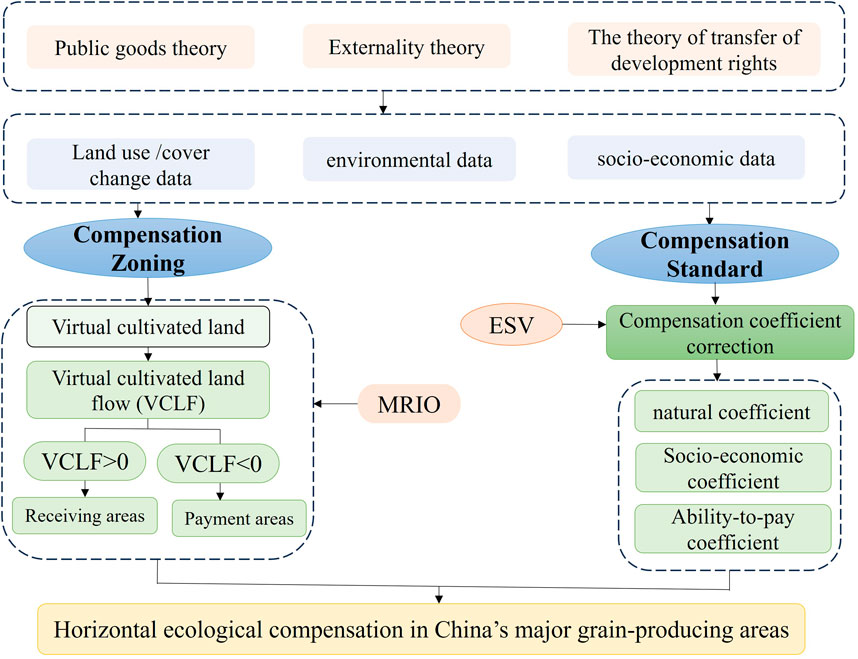
Figure 1. The research framework.
In terms of compensation zoning, firstly, the national provincial and NCP municipal MRIO tables are constructed, and the VCL use intensity is introduced to represent the land area directly and indirectly occupied by each unit of goods/services; then, based on the MRIO table, the VCL embodied in final consumption is calculated. Secondly, based on the inflow (ELI) and outflow (ELE) of VCL, the net flow (ELB) is calculated. Finally, based on the positive or negative of the net flow, the ecological compensation zoning is determined: when ELB is greater than 0, it is the compensation payment area; when ELB is less than 0, it is the compensation receiving area.
In terms of compensation standards, firstly, the value equivalent method is used to calculate the value of ESV in different regions, which serves as the basis for ecological compensation. Secondly, the correction coefficient of natural resources, socio-economic development, and payment ability are introduced to adjust the standards and obtain the ecological compensation standard in different regions. Finally, the ecological compensation amount of each region is calculated based on the net flow of VCL and the revised ecological compensation standard.
3 Materials and methods
3.1 Study area
The NCP is the second largest plain in China and is located in eastern China (32–40°N, 112–124°E) (Figure 2). It is formed by alluvial deposits of the Yellow, Huai, and Hai rivers, and covers seven provinces (Beijing, Tianjin, Hebei, Shandong, Henan, Anhui, and Jiangsu) including 51 cities, with an area of approximately 3 × 10⁵ km2. In 2020, the population of the NCP was 3.28 × 10⁸, accounting for 23.2% of the total population of China.
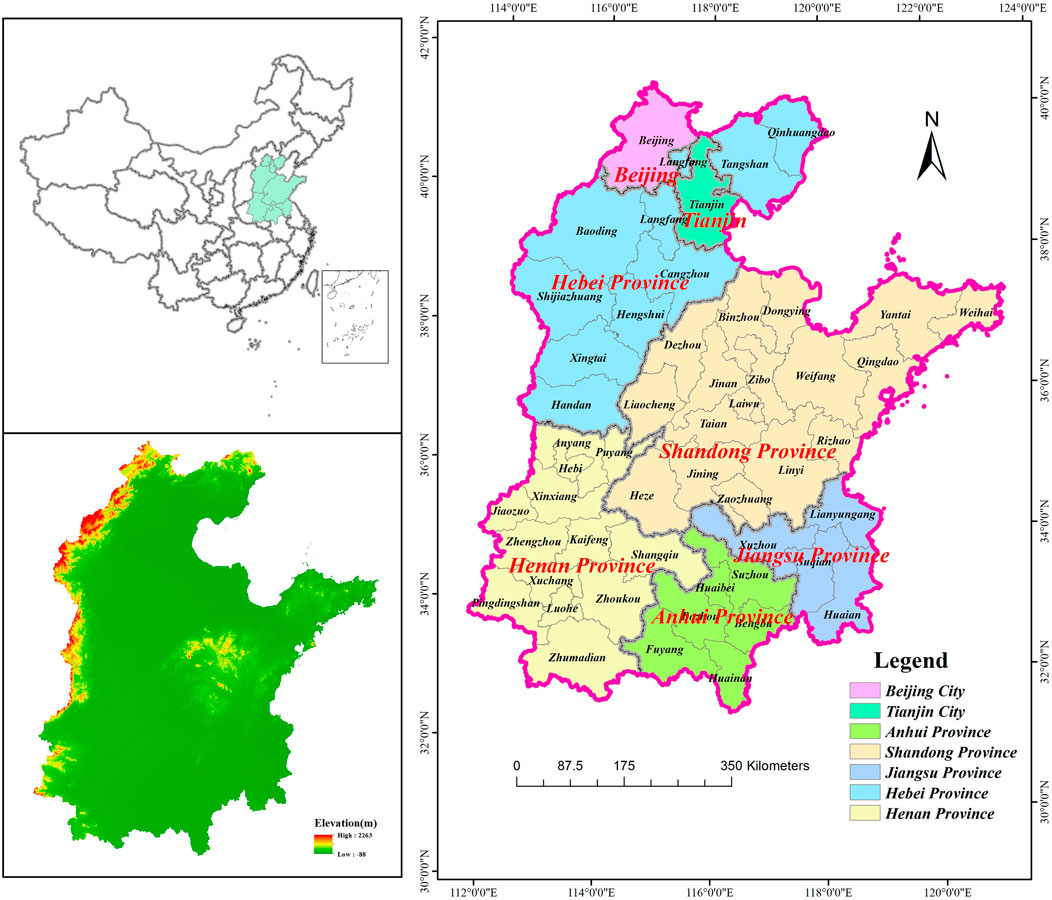
Figure 2. Location and extent of the North China Plain.
The NCP belongs to the warm temperate semi-arid and semi-humid climate, with an annual average temperature of 10°C–15°C, annual precipitation of 500–800 mm, and annual number of sunshine hours from 2,300 to 2,800 h (Li et al., 2019). The terrain is gentle with an average altitude of 111 m (Cui Y. et al., 2021). In 2017, the cultivated land area was 2.39 × 10⁸ hm2, accounting for 17.7% of the total in China. The NCP is an important MGPA in China because of its favorable natural conditions, and grain output accounts for nearly 30% of the national total (Liao et al., 2023). Wheat and corn are the main crops, which account for 57% and 35% of total wheat and corn yields, respectively (Li et al., 2020).
3.2 Methods
3.2.1 VCL quantification using the MRIO model
The MRIO model describes the flow of goods/services trade between different regions, systematically reflecting the economic and trade relations between different sectors and regions (Guo et al., 2020), and also provides a comprehensive understanding of resource flows between different regions (Tian et al., 2019). The MRIO model was used to quantify inter-city VCL flow in the NCP and inter-provincial VCL flow in China. Therefore, two MRIO tables are presented: one is the inter-city MRIO table, containing 42 sectors and 51 cities to analyze the VCL flow within the NCP (Table 1); the other is the inter-provincial MRIO table, which contains 42 sectors and 31 provinces (excluding Taiwan, Hong Kong, and Macao due to data limitation) to analyze VCL flow between the NCP and other regions in China (Table 1).

Table 1. Basic form of MRIO in NCP.
As shown in Table 1,
Economic activities are inseparably linked to resource utilization. The resource utilization coefficient is introduced into the MRIO table to measure resource consumption per unit of monetary value, referring to the sum of direct and indirect cultivated land resource costs per unit of monetary value (Costanza, 1980; Liao et al., 2020). The basic formula is:
where
where
Z is the intermediate use matrix:
The VCL embodied in final consumption is:
Cultivated land flow between regions can be quantified by the transfer of intermediate uses across sectors (Su et al., 2023). The VCL embodied in trade can also be expressed as:
where ELI refers to the amount of VCL imported from other regions; ELE refers to the amount of VCL exported to other regions, and; ELB is the difference between ELI and ELE, representing the net VCL flow.
3.2.2 Calculation of ecological compensation standard of cultivated land
The ESV of cultivated land was evaluated by the equivalent factor method (Costanza et al., 1997). On this basis, Chinese scholar Xie revised the value equivalent applicable to China (Xie et al., 2008; Xie et al., 2015), and calculated the ESV of 14 ecosystem types. Cultivated land ecosystems include paddies and dry fields. Cultivated land in the NCP predominantly consists of dry fields, accounting for 95% of the total, and paddy fields account for 5%. The equivalent value of the cultivated land ecosystem (i.e., 4.0) was calculated by the method of area-weighted summation. A standard equivalent factor of ESV is equal to 1/7 of the value of grain production per unit area (hm2) (Xie et al., 2017); thus, the ESV per unit area of cultivated land is calculated as follows:
where Ai represents the unit ESV of cultivated land (yuan/hm2); Ea represents the standard ESV equivalent (yuan/hm2); n represents the types of grain crops (note: wheat, corn, and rice were selected in this study); mi, pi, and qi, refer to the area (hm2), price (yuan/kg), and yield per unit area of type i grain crop (kg/hm2), respectively, and; M represents the total grain crop area (hm2).
Ecosystems and their ecosystem service values constantly change across different regions and periods; therefore, it is necessary to adjust the ESV according to the actual situation in each region. The equivalent factor was revised based on net primary productivity (NPP) and precipitation (Xie et al., 2015; Xie et al., 2017). The relative formulas are as follows:
where
In addition to natural factors, ecological compensation is also related to the economic level and residents’ ability to pay. The compensation standard is also related to socio-economic development and living standards (Li et al., 2002; Niu et al., 2024). The Pearl S-shaped growth curve and Engel’s coefficient were selected to measure the socio-economic degree and living standards; therefore, it was revised by the social development coefficient and per capita gross domestic productivity. The revised formulas are:
where
Here,
According to Equations 8–13, the ecological compensation standard Pi for cultivated land per unit area in region i is calculated as follows:
3.2.3 Calculation of ecological compensation amount of cultivated land
The ecological compensation amount was determined by multiplying the VCL flow by the ecological compensation standard per unit area, as follows:
Here, when ELB > 0, TP represents the ecological payment amount, and when ELB < 0, TP is the ecological receiving compensation amount.
3.3 Data sources and processing
3.3.1 Socio-economic statistical data
The MRIO table is available for 2012, 2015, and 2017 (Zheng et al., 2021), covers provincial tables of 31 provinces and municipal tables of 309 cities. This paper adopted the latest MRIO table of 2017, obtained from the China Emissions Accounts and Datasets (https://www.ceads.net.cn/). Economic data, such as population, GDP, grain production, urban Engel’s coefficient, rural Engel’s coefficient and urbanization rate, were obtained from the “China Statistical Yearbook” (2018) and Beijing, Tianjin, Hebei, Henan, Shandong, Anhui, and Jiangsu provinces Statistical Yearbooks (2018).
3.3.2 Land use and environmental data
Remote sensing monitoring data were sourced from land-use remote sensing monitoring data provided by the Resource and Environmental Science Data Platform of the Chinese Academy of Sciences (https://www.resdc.cn/). The remote sensing data is corrected, processed and verified to enhance the accuracy of remote sensing image classification (Song et al., 2024; Song et al., 2025). Combined with the human-computer interaction interpretation and the land use remote sensing data, the data of land areas each city is obtained.
Net primary productivity (NPP) data and Precipitation data were obtained from the National Earth System Science Data Center (http://www.geodata.cn/). Annual NPP data with 500 m spatial resolution was provided by MOD17A3HGF V6 products. The annual average NPP of each city and the annual average NPP of the whole country in 2017 are obtained through spatial processing and calculation. Precipitation data is a spatial data set of monthly precipitation with 1 km in China. The annual average precipitation of each city and the annual average precipitation of the whole country in 2017 are obtained through summing up the monthly precipitation.
4 Results
4.1 VCL and VCLF
4.1.1 Final VCL consumption and use intensity
The final VCL consumption and use intensity were calculated by the Equations 1- 4. From the perspective of final consumption (Figure 3), the top three regions were Qingdao, Zhengzhou, and Shijiazhuang, with the amounts at 1.292, 1.163, and 0.882 million hectares, respectively. The three regions with the smallest areas were Huainan, Huaibei, and Laiwu, at 0.117, 0.114, and 0.047 million hectares, respectively. Final VCL consumption is related to economic growth and population. Qingdao, Zhengzhou, and Shijiazhuang were economically developed regions in the NCP, with a huge population and high grain and cultivated land demands, and a large number of cultivated land area is occupied by urban construction and industrial development; therefore, these areas needed to import resources from other regions to meet the demand. In particular, Beijing and Tianjin were not among the top three regions of final consumption, which does not mean that the final consumption was low; rather, this means that they imported a relatively small amount of resources from the NCP and more resources from other regions in China.
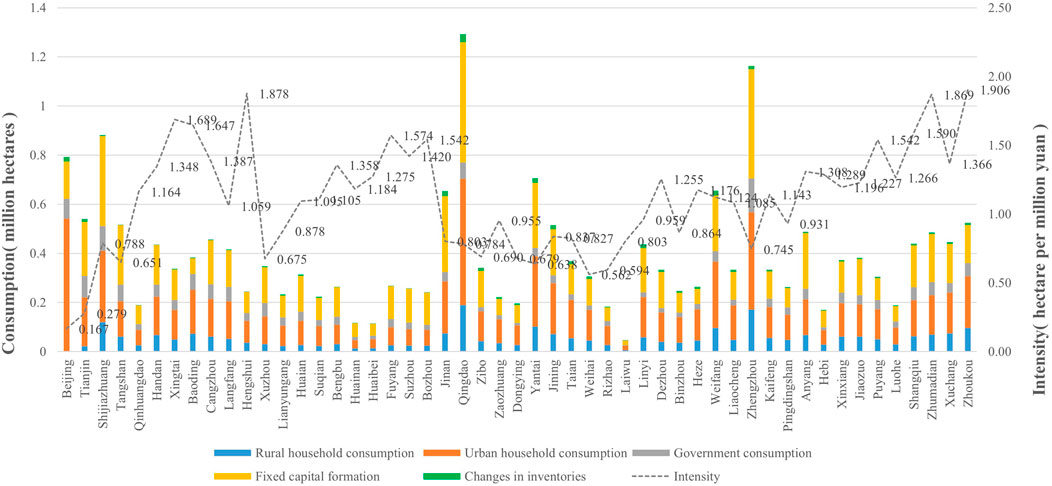
Figure 3. Virtual cultivated land (VCL) embodied in final consumption and its intensity in 51 cities.
From the perspective of cultivated land-use intensity, the three lowest regions were Beijing, Tianjin, and Weihai, with intensities of 0.167, 0.279, and 0.562 ha/million, respectively. The higher the economic level, the lower is the cultivated land use intensity. The top three regions were Zhumadian, Hengshui, and Zhoukou, with the intensities of 1.869, 1.878, and 1.906 ha/million, respectively. The lower the economic level and the higher cultivated land quality, the higher cultivated land use intensity.
4.1.2 VCLF
As cultivated land is embodied in economic trade, VCL flow between regions can be quantified and the net flow can be calculated (Equations 5–7) (Figure 4). Regions where the net flow >0, indicating a trade surplus of the VCL, supplies cultivated land to other regions. Regions where the net flow <0, indicating a trade deficit of the VCL, and consumes cultivated land in other regions (Su et al., 2023).
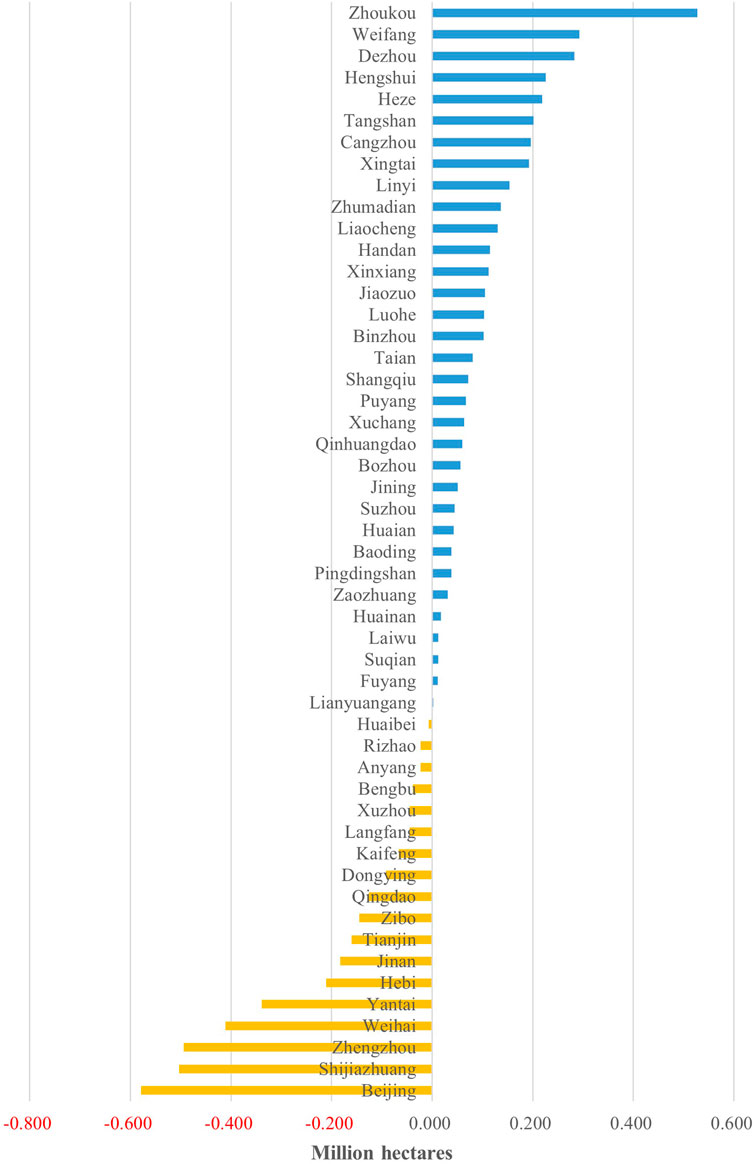
Figure 4. Trade balance of embodied cultivated land of 51 cities.
There were 18 regions with a VCL trade surplus, among which Beijing, Shijiazhuang, Zhengzhou, Weihai, and Yantai had the largest net imports of 0.579, 0.503, 0.494, 0.411, and 0.339 million hectares, respectively. Economically developed regions with large populations had greater food demands and needed to import VCL to other regions. There were 33 regions in the VCL trade deficit, among which Zhoukou, Weifang, Dezhou, Hengshui, and Heze had the largest net export amounts of 0.527, 0.293, 0.283, 0.226, and 0.219 million hectares, respectively. This showed that economically underdeveloped regions with a wide distribution and high-quality cultivated land were able to export VCL to other regions.
4.2 Compensation zoning based on the VCLF
From an inter-provincial perspective (Figure 5), Beijing and Tianjin were the major VCL recipients, mainly from Hebei, Henan, and Shandong provinces. Among these, Hebei Province had the largest outflows of 315.0 and 122.5 thousand hectares into Beijing and Tianjin, respectively, followed by Henan, with outflows of 198.3 and 74.2 thousand hectares, respectively; and Shandong Province provided 121.3 and 33.5 thousand hectares, respectively. Beijing and Tianjin were the most economically developed regions in the NCP, and the permanent resident population and gross regional product were at the forefront of China. They achieved economic development by expanding construction land while importing grain to meet the daily needs of a large population, enjoying the benefits of grain production and cultivated land protection. As major agricultural provinces, Hebei, Henan, and Shandong have high agricultural production levels, and have made outstanding contributions to ensuring food security in Beijing, Tianjin, and across the country.
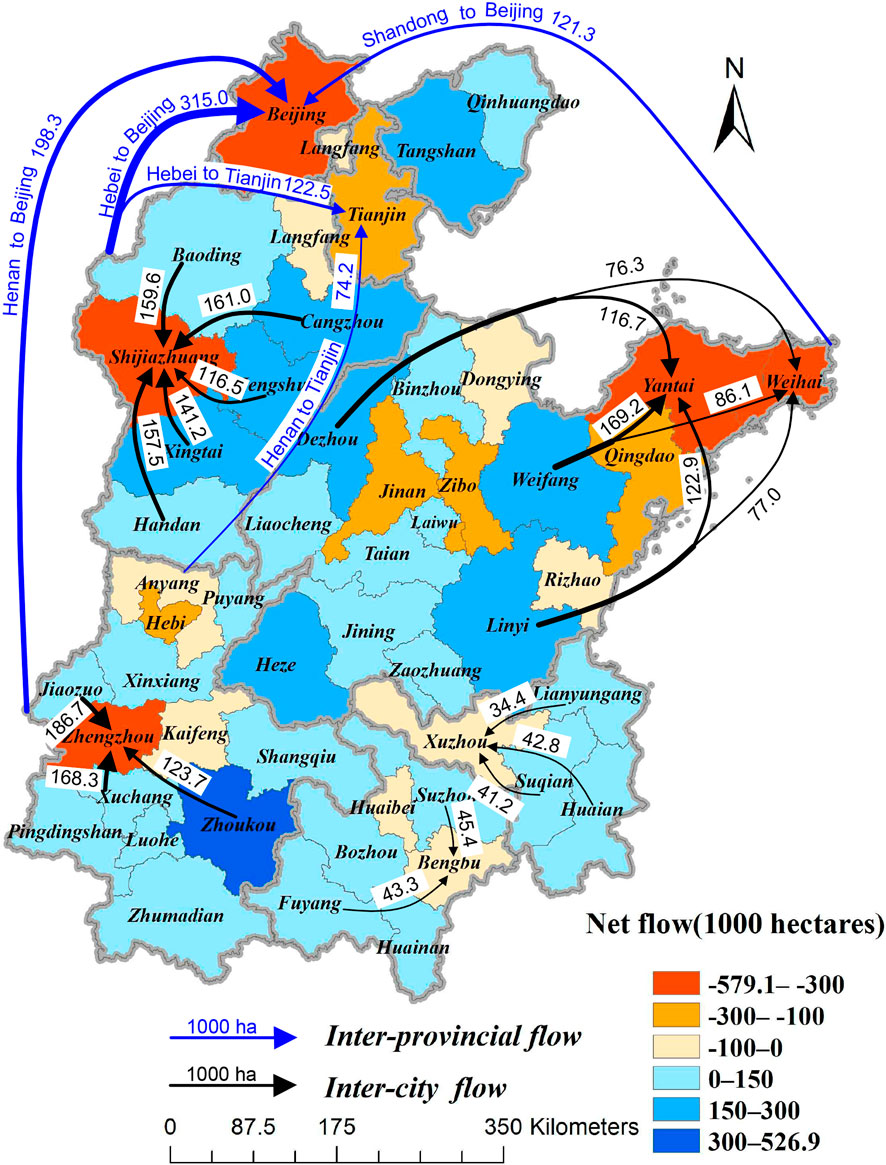
Figure 5. Net flow of virtual cultivated land (VCL) within the North China Plain.
From an inter-city perspective, VCL flow mainly occurred within provinces. In Hebei Province, Shijiazhuang and Langfang were VCL recipients, with Shijiazhuang having the largest net import amounts of 157.5, 159.6, 161.0, 141.2, and 116.5 thousand hectares from Handan, Baoding, Cangzhou, Xingtai, and Hengshui, respectively. In Jiangsu Province, Xuzhou was the VCL recipient, with inflow amounts of 42.8, 41.2, and 34.4 thousand hectares from Huai’an, Suqian, and Lianyung, respectively. In Anhui Province, Bengbu and Huaibei were VCL recipients, with Bengbu having the largest net import amounts of 43.3 and 45.4 thousand hectares from Fuyang and Suzhou, respectively. In Shandong Province, Jinan, Qingdao, Zibo, Dongying, Yantai, Weihai, and Rizhao were VCL recipients, of which Weihai had the largest net imports of 122.9, 116.7, and 169.2 thousand hectares from Linyi, Dezhou, and Weifang, respectively; followed by Yantai, with the amount of 77.7, 76.3, 86.1, respectively. In Henan Province, Zhengzhou, Kaifeng, Anyang, and Hebi were VCL recipients, and Zhengzhou had the largest net imports of 186.70, 168.3, and 123.7 thousand hectares from Jiaozuo, Xuchang, and Zhoukou, respectively.
This demonstrated that VCL flowed from regions with flat terrain, fertile land, favorable farming conditions, and high food production to regions with high economic development levels, large populations, fewer cultivated land resources, and lower grain yields. The NCP has excellent sunlight and temperature conditions and abundant cultivated land resources, and has made outstanding contributions to food security. However, with the rapid development of economy and society, urban, industrial and transportation lands have continued to invade into cultivated land, posing a threaten to cultivated land protection. From 2000 to 2020, the cultivated land area decreased by 1.74 million hectares (Gao, 2023). The tradeoff between construction land expansion and cultivated land reduction in the NCP represents a microcosm of land use/cover change in China (Deng et al., 2023).
4.3 Ecological compensation standard
The ecological compensation standards in each region were obtained using Equations 8–14, with an average of 5,634 yuan/hectare. They were classified into five grades by the natural breakpoint method (Figure 6). Figure 5 shows a significant difference in the compensation standards between regions, ranging from 2,192 to 18,406 yuan/hectare. Compensation standards for Xingtai, Baoding, Handan, Heze, and Suzhou were the lowest, ranging from 2,192 to 2,523 yuan/ha; those of Beijing, Xuzhou and Huai’an were at the highest level, ranging from 11,463 to 18,406 yuan/ha (i.e., more than 5-times the lowest level).
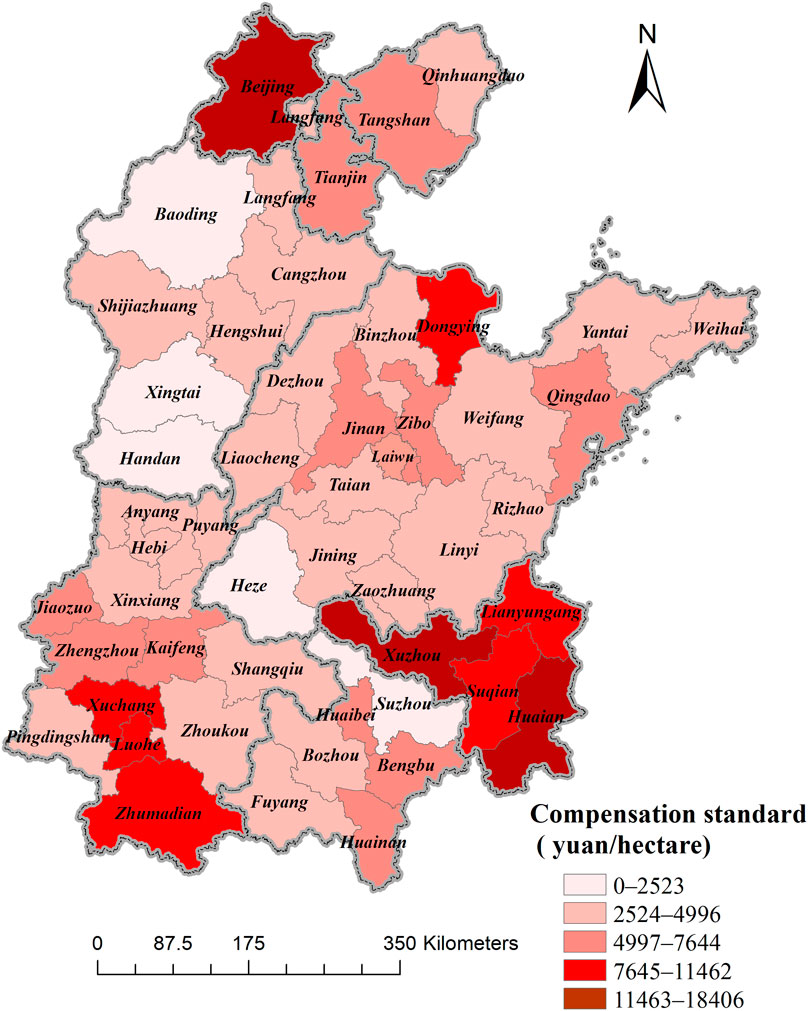
Figure 6. Classification of ecological compensation standard in the North China Plain.
Ecological compensation standards depend not only on the ESV but are also affected by natural factors like NPP and precipitation. Regions such as Xuzhou, Lianyungang, Suqian, Huai’an, Luohe, Zhumadian, and Xuchang had high NPP and abundant annual precipitation, providing favorable natural conditions for cultivated land and leading to higher ecological compensation standards. In addition, the socio-economic development level was directly proportional to the willingness and ability to pay for ecological compensation. Regions such as Beijing, Tianjin, Shijiazhuang, Jinan, Qingdao, Yantai, Weihai, and Zhengzhou, with high per capita GDP and lower Engel’s coefficients, exhibited stronger willingness-to-pay for ecological compensation, resulting in higher compensation standards.
4.4 Horizontal ecological compensation amount within the NCP
Ecological compensation amounts for the 51 regions in the NCP were calculated using Equation 15 and inter-provincial compensation amounts were summarized (Table 2). A positive value indicated the payment amount and a negative value indicated the compensation amount received.
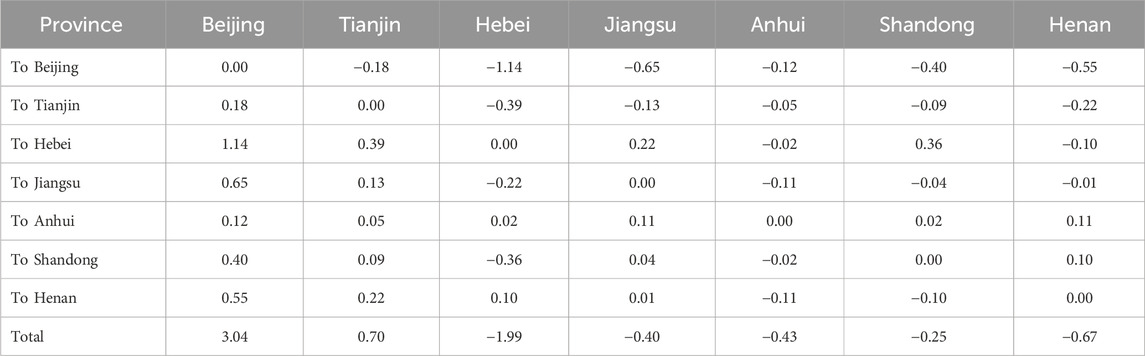
Table 2. Inter-provincial ecological compensation amount in the North China Plain Unit: billion yuan.
From an inter-provincial perspective, Beijing and Tianjin were payment areas, and Hebei, Anhui, Jiangsu, Shandong, and Henan were compensation receiving areas. Beijing had the highest payment amount (3.04 billion yuan) and needed to pay compensation to all other provinces, with the largest amount (1.14 billion yuan) paid to Hebei Province. Tianjin received compensation of 0.18 billion yuan from Beijing and paid 0.88 billion yuan to other provinces, with the largest amount of 0.39 billion yuan paid to Hebei Province. Hebei Province received the largest amount (1.99 billion yuan, primarily from Beijing and Tianjin). As the ecological barrier of Beijing and Tianjin, Hebei Province had made a significant contribution to ecological environment protection and also undertaken the important function of ensuring food security. Jiangsu Province received compensation of 0.78 billion yuan from Beijing and Tianjin, and needed to pay 0.38 billion yuan to other provinces, with a net receiving amount of 0.40 billion yuan. Anhui Province received compensation from all other provinces, receiving a total amount of 0.43 billion yuan. Shandong Province received compensation of 0.63 billion yuan from Beijing, Tianjin, Jiangsu and Henan, and needed to pay 0.38 billion yuan to Hebei and Anhui, with a net receiving amount of 0.25 billion yuan. Henan Province received compensation of 0.88 billion yuan from Beijing, Tianjin, Hebei and Jiangsu, and needed to pay 0.21 billion yuan to Anhui and Shandong, with a net receiving amount of 0.67 billion yuan.
Inter-city compensation mainly occurred within the provinces; therefore, a chord diagram was created to display the horizontal ecological compensation by the Origin model. Jiangsu and Anhui provinces had the advantage of geographical proximity, with VCL flows mainly occurring within these two provinces; therefore, the four regions in Jiangsu and six regions in Anhui were combined. Figure 7 shows a one-to-one correspondence of inter-city ecological compensation.
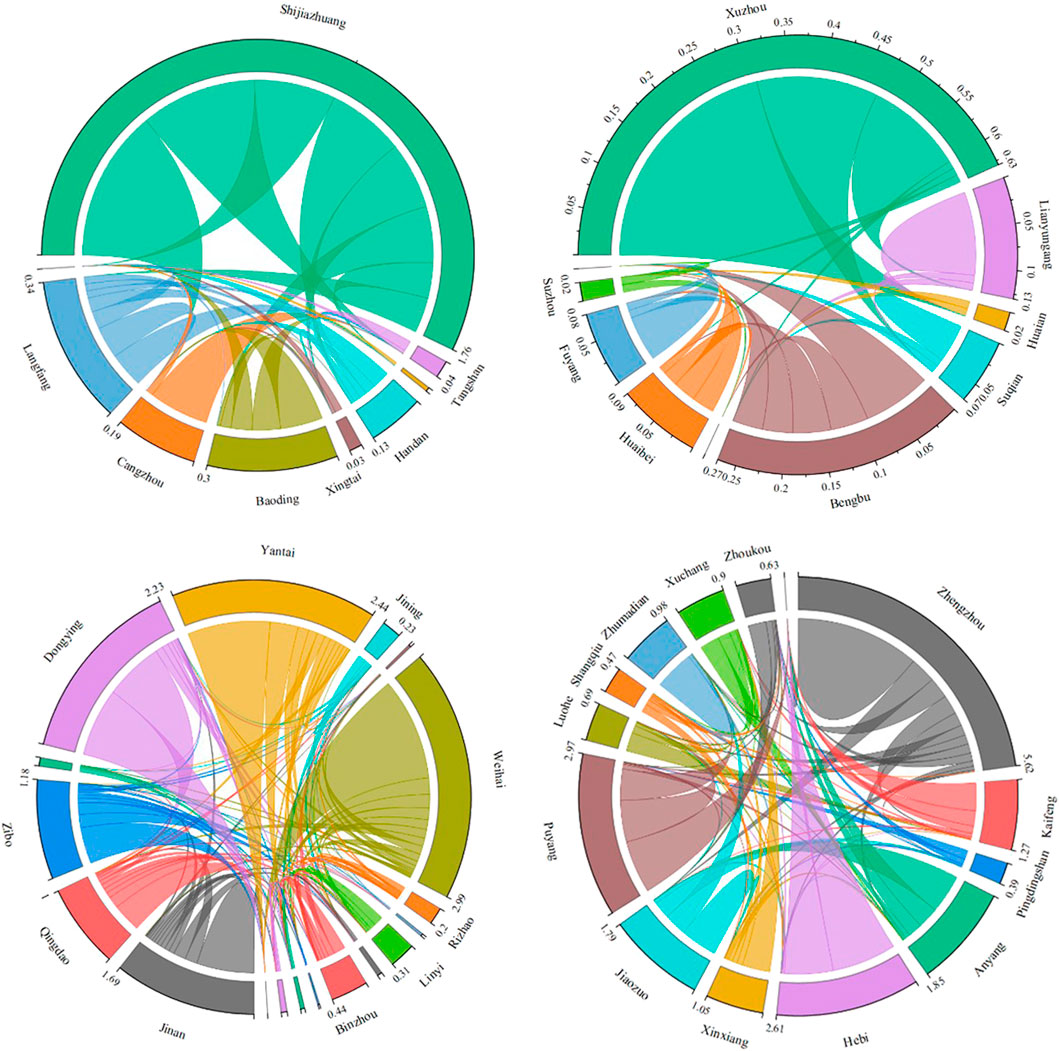
Figure 7. Horizontal ecological compensation within provinces (billion yuan).
In Hebei Province, Shijiazhuang, Langfang, and Baoding were payment areas, with payment amounts of 1.76, 0.24, and 0.13 billion yuan, respectively; other regions were receiving areas, among which Tangshan, Cangzhou, and Hengshui had the largest receiving amounts of 0.65, 0.50, and 0.45 billion yuan, respectively. In Jiangsu and Anhui provinces, Xuzhou and Bengbu are payment areas, with payment amounts of 0.63 and 0.23 billion yuan, respectively; Huai’an and Bozhou were receiving areas, and the receiving amounts were 0.45 and 0.20 billion yuan, respectively; Lianyungang, Huaibei, and Fuyang were balance areas. In Shandong Province, Jinan, Zibo, Dongying, Yantai, Weihai, and Rizhao were payment areas, with payment amounts of 0.84, 0.53, 1.00, 1.21, 1.50, and 0.08 billion yuan, respectively; other regions were receiving areas, among which Weifang, Dezhou, and Heze had the highest receiving amounts of 1.29, 1.18, and 0.55 billion yuan, respectively. In Henan Province, Zhengzhou, Kaifeng, Anyang, Hebi, and Puyang were payment areas, with payment amounts of 2.77, 0.17, 0.47, 1.09, and 1.18 billion yuan, respectively; other regions were receiving areas, among which Zhoukou, Zhumadian, Luohe, and Shangqiu had the highest receiving amounts of 2.19, 1.04, 0.76, and 0.76 billion yuan, respectively.
5 Discussion
5.1 Horizontal ecological compensation between the NCP and other regions in China
As a significant MGPA in China, the NCP produces 30% of the food grain in China. However, due to the low economic returns from grain production, local governments and farmers have limited enthusiasm for grain farming, leading to phenomena such as “non-grain” and “non-agricultural” in some areas (Shao, 2022; Zhang et al., 2021). Chemical fertilizers and pesticides are extensively used and cultivated land resources are excessively exploited and utilized, causing problems such as declining soil fertility, ecological imbalance, and cultivated land deterioration (Wei et al., 2023). Therefore, the conflict between cultivated land protection and ecological security is extremely serious. By analyzing VCL between the NCP and other regions in China, constructing the horizontal ecological compensation mechanism of cultivated land in MGPA can help allocate responsibility for cultivated land protection and ensure ecological security in the NCP.
5.1.1 VCL flow between the NCP and other regions in China
Regarded the NCP as a whole, there was also VCL flow between NCP and other regions in China (Figure 8). The NCP mainly received VCL from major grain-producing provinces in northern China, such as Jilin, Heilongjiang, Inner Mongolia, and Shaanxi, with inflows of 2.53, 2.18, 1.97, and 1.38 million hectares, respectively. The NCP also provides cultivated land to other economically developed regions, mainly concentrated in the Yangtze River and Pearl River deltas, such as Guangdong, Zhejiang, and Shanghai, with outflows of 1.95, 1.77, and 0.46 million hectares, respectively, indicating that the NCP has excessively undertaken the task of cultivated land protection for developed regions.
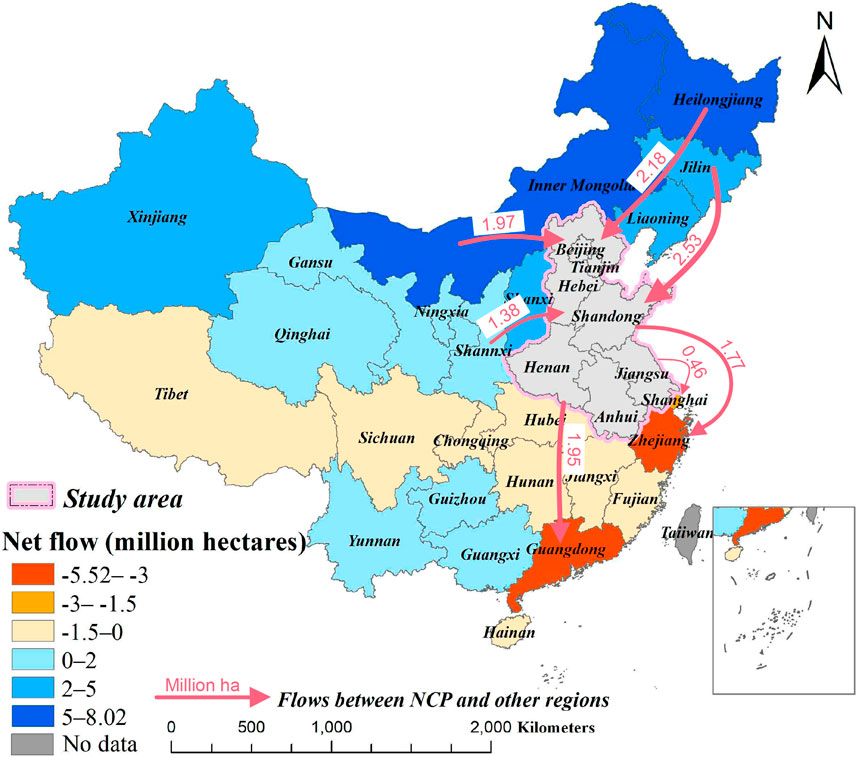
Figure 8. Virtual cultivated land (VCL) flow map between the North China Plain (NCP) and other regions in China.
Description: The NCP in this section includes all cities in Beijing, Tianjin, Hebei, Shandong, Henan, Anhui, and Jiangsu provinces, which differs slightly from the previous section.
5.1.2 Ecological compensation between NCP and other regions in China
We can get the ecological compensation between the NCP and other regions in China from Figure 9. The NCP needed to pay 73.30 billion yuan to other regions and received 90.65 billion yuan. In general, it was able to receive 17.35 billion yuan. Figure 8 shows that the areas receiving compensation were mainly distributed in the northeast and northwest regions in China, among which Jilin, Heilongjiang, Inner Mongolia, and Shaanxi received the largest amounts of 23.27, 22.25, 12.09, and 4.25 billion yuan, respectively. Payment areas were mainly distributed in the Yangtze River and Pearl River deltas, among which Guangdong, Zhejiang, and Shanghai paid the largest amounts (i.e., 46.46, 31.07, and 5.58 billion yuan, respectively).
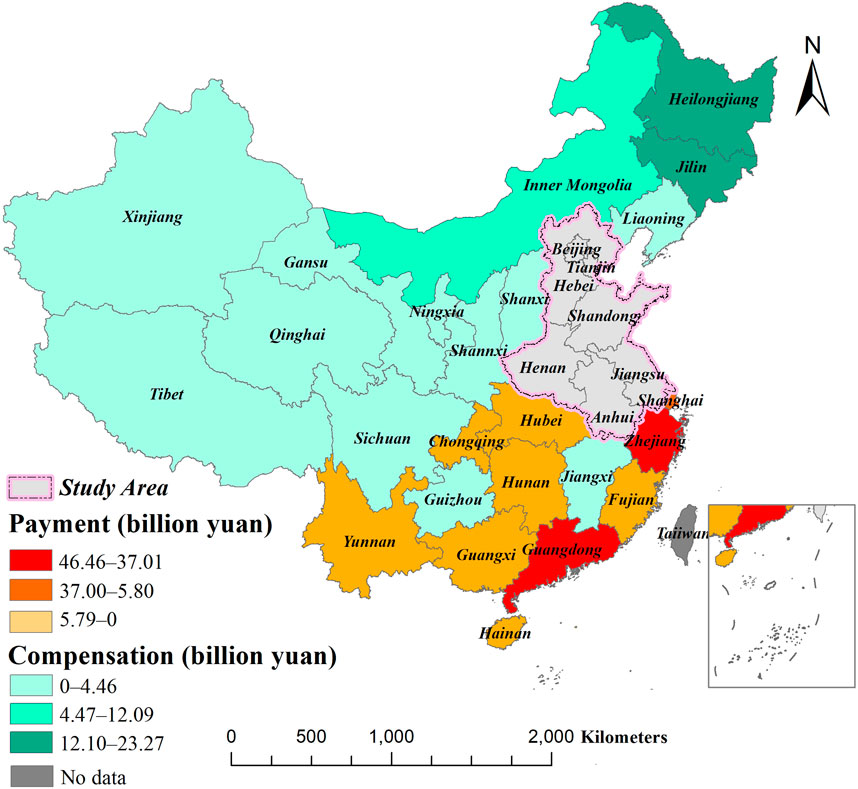
Figure 9. Zone map of ecological compensation between the North China Plain and other regions in China.
5.2 Limitations and future research outlook
First, because of the considerable amount of effort and lack of wide application, the MRIO table is updated every 5 years by the Bureau of Statistics, and the latest MRIO table was updated for 2017; therefore, it is difficult to achieve continuous quantitative analysis of VCL flow and ecological compensation. Second, owing to data limitations, VCL import and export from overseas are difficult to quantify, and we will supplement this in the future study. Finally, owing to the large amount of data and complex calculations, the scope of the NCP is inconsistent in Parts 3 and 4; it includes 51 cities in Beijing, Tianjin, Hebei, Shandong, Henan, Anhui, and Jiangsu provinces in Part 3 and all cities of the seven provinces in Part 4. However, this did not affect the overall analysis, and we hope to improve it in the future.
5.3 Policy implications
5.3.1 Construct ecological compensation mechanism under the VCL framework
Based on the “two horizontal and two vertical” compensation models proposed by Liang et al. (2019), an operation platform was constructed under the VCL framework in MGPA. At the inter-provincial level, a central operation platform was established to realize cross-provincial compensation from the main food consumption province to MGPA. At the inter-city level, a provincial platform was established to realize cross-regional compensation from the net inflow region to the outflow region within the province. The main responsibilities of the platform is to monitor the VCL flow in real time, identify the compensation subject and object, clarify the source of compensation funds and the manner in which money is raised, select suitable compensation methods, and implement supervision and punishment.
5.3.2 Establish ecological compensation fund of cultivated land
According to the principle of “more inflow and more compensation, less inflow and less compensation, no inflow and no compensation,” a certain proportion of local government revenue of MFSA, with financial and social capital, and other source of funds, composed the ecological compensation fund, which is specifically used to support large-scale and intensive management, high-standard prime farmland construction, income subsidy of grain farmers, and agricultural science and technology innovation. A dynamic monitoring mechanism for cultivated-land changes in MGPA and MFSA should be constructed. When the phenomena of “non-grain” or “land abandonment” appears in MFSA, the government should provide compensation for MGPA according to area of cultivated land that has been changed.
5.3.3 Construct development community of grain industry between MGPA and MFSA
On the one hand, the MFSA established the Loan Credit Guarantee Fund for MGPA to solve the capital demand for the grain industry chain; on the other hand, the two-way counterpart support mode of “province–province” and “region–region” has been adopted, meaning that the MFSA provides support to promote the scale and industrialization of food grain by providing large-scale agricultural machinery, improving agricultural infrastructure, ecological protection, environmental governance projects, etc., to form a new cooperation mode of MGPA and MFSA and share the benefits of grain industry development.
6 Conclusion
MGPA have significantly contributed to protecting cultivated land and food security in China. Therefore, it is important to improve the horizontal ecological compensation mechanism of cultivated land in MGPA. Taking the NCP as the research object, this study analyzed VCL flow reflected in inter-regional trade using MRIO, calculated the ecological compensation standard and compensation amount for each region, and proposed suggestions for optimizing the ecological compensation mechanism. The conclusions are as follows:
First, final VCL consumption was positively correlated with the economic level. Economically developed regions such as Beijing (0.579 ha/million), Shijiazhuang (0.503 ha/million), Zhengzhou (0.494 ha/million), Weihai (0.411 ha/million), and Yantai (0.339 ha/million) had large net VCL imports; whereas, economically underdeveloped regions such as Zhoukou (0.527 ha/million), Weifang (0.293 ha/million), Dezhou (0.283 ha/million), Hengshui (0.226 ha/million), and Heze (0.219 ha/million) had large net VCL exports.
Second, VCL flowed from economically underdeveloped to economically developed regions. At the inter-provincial level, VCL flowed from Hebei (315.0, 122.5 thousand hectares), Shandong (121.3, 33.5 thousand hectares), and Henan (198.3, 74.2 thousand hectares) to Beijing and Tianjin. At the inter-city level, VCL flowed from large grain-producing regions to economically developed regions; for example, it flowed from Handan (157.5 thousand hectares), Baoding (159.6 thousand hectares), Cangzhou (161.0 thousand hectares), Xingtai (141.2 thousand hectares), and Hengshui (116.5 thousand hectares) to the provincial capital Shijiazhuang in Hebei Province. The NCP mainly received VCL from economically underdeveloped regions, such as Jilin (2.53 million hectares), Heilongjiang (2.18 million hectares), Inner Mongolia (1.97 million hectares), and Shaanxi (1.38 million hectares), and also provided cultivated land resources for developed regions, such as Guangdong (1.95 million hectares), Zhejiang (1.77 million hectares), and Shanghai (0.46 million hectares).
Finally, net VCL inflow regions were payment areas and net outflow regions were compensation receiving areas. The ecological compensation standard for cultivated land differed, ranging from 2,192 to 18,406 yuan/hectare. Beijing and Tianjin were payment areas, with payment amounts of 3.04 and 0.70 billion yuan, respectively. Other provinces were receiving areas, and Hebei Province received the largest amount (1.99 billion yuan). As an export-oriented region, the NCP received compensation of 17.35 billion yuan from other regions in China. From this study, we propose suggestions to improve the horizontal ecological compensation mechanism of cultivated land from three aspects: constructing an ecological compensation mechanism under the VCL framework; establishing an ecological compensation fund for cultivated land, and; constructing a development community for the grain industry between MGPA and MFSA.
The results can help clarify the responsibilities of MGPA and MFSA and alleviate the pressure on cultivated land protection in MGPA. The findings will assist policymakers in formulating differentiated compensation policies according to the socio-economic resources of different regions and reducing regional imbalances. It is helpful to clarify the responsibility of cultivated land utilization and ecological protection, eliminate contradictions between cultivated land protection and socio-economic development, and provide effective solutions for long-term sustainable development of MGPA and MFSA.
Data availability statement
The raw data supporting the conclusions of this article will be made available by the authors, without undue reservation.
Author contributions
JC: Investigation, Writing – original draft. SY: Validation, Writing – review and editing. HD: Conceptualization, Data curation, Writing – original draft. WL: Software, Supervision, Writing – review and editing. YL: Data curation, Formal analysis. Writing – review and editing.
Funding
The author(s) declare that financial support was received for the research and/or publication of this article. This research was funded by the Humanities and Social Science Research Project of Hebei Education Department, grant number SQ2023195.
Conflict of interest
Author SY was employed by North China Engineering Investigation Institute Co., Ltd.
The remaining authors declare that the research was conducted in the absence of any commercial or financial relationships that could be construed as a potential conflict of interest.
Generative AI statement
The author(s) declare that no Generative AI was used in the creation of this manuscript.
Publisher’s note
All claims expressed in this article are solely those of the authors and do not necessarily represent those of their affiliated organizations, or those of the publisher, the editors and the reviewers. Any product that may be evaluated in this article, or claim that may be made by its manufacturer, is not guaranteed or endorsed by the publisher.
References
Bhandari, P., Kc, M., Shrestha, S., Aryal, A., and Shrestha, U. B. (2016). Assessments of ecosystem service indicators and stakeholder's willingness to pay for selected ecosystem services in the Chure region of Nepal. Appl. Geogr. 69, 25–34. doi:10.1016/j.apgeog.2016.02.003
Cao, C., Zhao, X. H., and Wang, J. J. (2022). “Tail Effect” of agricultural economic growth based on virtual cultivated land resources. Econom. Geogr. 42, 74–81+131. doi:10.15957/j.cnki.jjdl.2022.04.009
Chang, Y., and Yoshino, K. (2017). Theory of willingness to sell to valuate ecosystem services in the contingent valuation method. J. Environ. Inf. 29, 53–60. doi:10.3808/jei.201700362
Chen, X., and Wang, J. (2021). Quantitatively determining the priorities of regional ecological compensation for cultivated land in different main functional areas: a case study of Hubei Province, China. Land. 10, 247. doi:10.3390/land10030247
Chen, B., Han, M. Y., Peng, K., Zhou, S. L., Shao, L., Wu, X. F., et al. (2018). Global land-water nexus: agricultural land and freshwater use embodied in worldwide supply chains. Sci. Total Environ. 613 (614), 931–943. doi:10.1016/j.scitotenv.2017.09.138
Chiodelli, F., and Moroni, S. (2016). Zoning-integrative and zoning-alternative transferable development rights: compensation, equity, efficiency. Land Use Policy 52, 422–429. doi:10.1016/j.landusepol.2016.01.006
Costanza, R. (1980). Embodied energy and economic valuation. Science 210, 1219–1224. doi:10.1126/science.210.4475.1219
Costanza, R., Arge, R., Groot, R., Grasso, M., Hannon, B., Limburg, K., et al. (1997). The value of world’s ecosystem services and natural capital. Nature 386, 253–260. doi:10.1016/S0921-8009(98)00020-2
Cui, N. B., Sheng, S.Y., and Fang, Y. Y. R. (2021a). Standard quantification and mechanism construction of inter-provincial cultivated land ecological compensation from the perspective of food security. J. China Agri. Univ. 26, 232–243. doi:10.11841/j.issn.1007-4333.2021.11.23
Cui, Y., Zhang, B., Huang, H., Zeng, J., Wang, X., and Jiao, W. (2021b). Spatiotemporal characteristics of drought in the North China Plain over the past 58 years. Atmosphere 12, 844. doi:10.3390/atmos12070844
Deng, X. Z., Zhao, H. P., Jiang, S. J., Li, Z. H., and Li, L. F. (2023). Regulation of land use/cover on CO spatial distribution in North China Plain. Acta Ecol. Sin. 43, 4965–4973. doi:10.5846/stxb202203250744
Du, H., Zhao, L., Zhang, P., Li, J., and Yu, S. (2023). Ecological compensation in the Beijing-Tianjin-Hebei region based on ecosystem services flow. J. Environ. Manag. 331, 117230. doi:10.1016/j.jenvman.2023.117230
Fan, P. F., Liang, L. T., Xu, M. J., and Zhang, S. Y. (2018). Study on inter-provincial cultivated land ecological compensation from perspective of virtual cultivated land flow. China Popul. Resour. Environ. 28, 91–101. doi:10.12062/cpre.20170719
Gao, H. (2023). The research of ecological risk of land use change in North China Plain. Jingzhou City, Hubei Province: Changjiang Univ. doi:10.26981/d.cnki.gjhsc.2023.000830
Guan, D. J., Jiang, Y. N., Yan, L. Y., Zhou, J., He, X. J., Yin, B. L., et al. (2022). Calculation of ecological compensation amount in Yangtze River Basin based on ecological footprint. Acta Ecol. Sin. 42, 1–5. doi:10.5846/stxb202010282764
Guo, S., Li, Y., Hu, Y., Xue, F., Chen, B., and Chen, Z. M. (2020). Embodied energy in service industry in global cities: a study of six Asian cities. Land Use Policy 91, 104264. doi:10.1016/j.landusepol.2019.104264
Han, M. Y., and Chen, G. Q. (2018). Global arable land transfers embodied in Mainland China’s foreign trade. Land Use Policy 70, 521–534. doi:10.1016/j.landusepol.2017.07.022
Jin, J., He, R., Wang, W., and Gong, H. (2018). Valuing cultivated land protection: a contingent valuation and choice experiment study in China. Land Use Policy 74, 214–219. doi:10.1016/j.landusepol.2017.09.023
Liu, X. N., and Zhang, R. Y. (2024). A review on the research of farmland ecological compensation: Its operating mechanism and policy practice. Ecol. Econ. 40, 104–111.
Li, J. C. (2002). Value assessment is the key of environmental assessment. China Populat. Resour. Environ. 3, 13–19.
Li, S., Lei, Y., Zhang, Y., Liu, J., Shi, X., Jia, H., et al. (2019). Rational trade-offs between yield increase and fertilizer inputs are essential for sustainable intensification: a case study in wheat–maize cropping systems in China. Sci. Total Environ. 679, 328–336. doi:10.1016/j.scitotenv.2019.05.085
Li, X., Li, S., Li, C., Shi, J., and Wang, N. (2023). The impact of high-quality development on ecological footprint: an empirical research based on STIRPAT model. Ecol. Indic. 154, 110881. doi:10.1016/j.ecolind.2023.110881
Li, Z. X., Wang, L., Liu, S. T., Zhao, B., Qian, X., Li, Q., et al. (2020). Annual high efficiency utilization of water and fertilizer of a wheat-maize double cropping system. Sci. Agric. Sin. 53, 4333–4341. doi:10.3864/j.issn.0578-1752.2020.21.003
Liang, L. T., Gao, P., and Liu, L. K. (2019). The “Two Horizon” inter-regional agro-ecological compensation standard and cross-regional financial transfer mechanism: a study based on virtual cultivated land. Acta Ecol. Sin. 39, 9281–9294. doi:10.5846/stxb201810282324
Liang, L. T., Tang, L. H., Li, S. C., Li, D., Cao, Z., Li, Y., et al. (2020). Virtual cultivated land flow pattern and its stability evaluation of based on ecological network architecture. Econ. Geogr. 40, 140–149. doi:10.15957/j.cnki.jjdl.2020.01.016
Liang, L. T., and Zhu, K. C. (2019). Interregional agricultural eco-compensation based on virtual cultivated land flow: regional division and compensation standard accounting. Geogr. Res. 38, 17.
Liao, L. J., Liu, R., and Zou, Y. F. (2023). A review of climate change in Huang-Huai-Hai Plain and its impact on grain yield. J. Henan Agri. Univ. 57, 10–20. doi:10.16445/j.cnki.1000-2340.20230104.003
Liao, X. W., Zhao, X., Liu, W. F., Li, R. S., Wang, X. X., Wang, W. P., et al. (2020). Comparing water footprint and water scarcity footprint of energy demand in China’s six megacities. Appl. Energy. 269 (1), 115137–5137. doi:10.1016/j.apenergy.2020.115137
Niu, H. P., and Zhang, A. L. (2009). Externality and its calculation of cultivated land protection: a case study of Jiaozuo City. Resour. Sci. 31, 1400–1408.
Niu, J. J., Mao, C. M., and Xiang, J. (2024). Based on ecological footprint and ecosystem service value, research on ecological compensation in Anhui Province, China. Ecol. Indic. 158, 111341. doi:10.1016/j.ecolind.2023.111341
Shao, Y. F. (2022). Research on the spatial pattern differentiation, causes and countermeasures of “non-grainproduction” cultivated land in Henan Province. Hubei Agri. Sci. 61, 234–238. doi:10.14088/j.cnki.issn0439-8114.2022.23.046
Song, H. X., Xie, H. L., Duan, Y. Y., Xie, X., Gan, F., Wang, W., et al. (2025). Pure data correction enhancing remote sensing image classification with a lightweight ensemble model. Sci. Rep. 15, 5507. doi:10.1038/s41598-025-89735-1
Song, H. X., Zhou, Y., Liu, W. B., Zhao, D., Liu, Q., and Liu, J. (2024). Variance consistency learning: enhancing cross-modal knowledge distillation for remote sensing image classification. Ann. Emerg. Technol. Comput. (AETiC) 8 (4), 56–76. doi:10.33166/aetic.2024.04.003
Su, D., Cao, Y., Wang, J. Y., Fang, X. Q., and Wu, Q. (2023). Toward constructing an eco-account of cultivated land by quantifying the resources flow and eco-asset transfer in China. Land Use Policy 132, 106822. doi:10.1016/j.landusepol.2023.106822
Su, D., Wang, J., Wu, Q., Fang, X., Cao, Y., Li, G., et al. (2022). Exploring regional ecological compensation of cultivated land from the perspective of the mismatch between grain supply and demand. Environ. Dev. Sustain 25, 14817–14842. doi:10.1007/s10668-022-02690-z
Sun, J. J., Zhao, K., Cao, H., and Niu, Y. (2018). Zoning and quantity of economic compensation for arable land protection: from the perspective of coordination between provincial cultivated land and economic. Nat. Resour. J. 33, 1003–1017. doi:10.31497/zrzyxb.20170571
Tian, X., Bruckner, M., Geng, Y., and Bleischwitz, R. (2019). Trends and driving forces of China's virtual land consumption and trade. Land Use Policy 89, 104194. doi:10.1016/j.landusepol.2019.104194
Wang, Y., Kong, L. Y., Gao, D. G., and Dong, S. Z. (2024a). The benefit compensation mechanism of major grain producing areas from the perspective of production factors: evidence from major grain producing areas in Northeast China. Chin. Rural. Econom., 117–135. doi:10.20077/j.cnki.11-1262/f.2024.06.006
Wang, Y. W., Bai, Y. P., Hu, Y. C., Deng, X., Weng, C., Shu, J., et al. (2024b). Tele-connecting local consumption to cultivated land use and hidden drivers in China. Sci. Total Environ. 912, 169523. doi:10.1016/j.scitotenv.2023.169523
Wei, H. K., and Jia, X. L. (2023). The shrinking trend and welfare loss of China's main grain producing areas. J. CCPS 27, 65–79. doi:10.14119/j.cnki.zgxb.2023.05.013
Wei, W., Nan, S., Xie, B., Liu, C., Zhou, J., and Liu, C. (2023). The spatial-temporal changes of supply-demand of ecosystem services and ecological compensation: a case study of Hexi Corridor, Northwest China. Ecol. Eng. J. Ecotechnol. 187, 106861. doi:10.1016/j.ecoleng.2022.106861
Wu, X. D., Guo, J. L., Meng, J., and Chen, G. Q. (2019). Energy use by globalized economy: total-consumption-based perspective via multi-region input-output accounting. Sci. Total Environ. 662, 65–76. doi:10.1016/j.scitotenv.2019.01.108
Würtenberger, L., Koellner, T., and Binder, C. R. (2006). Virtual land use and agricultural trade: estimating environmental and socio-economic impacts. Ecol. Econ. 57, 679–697. doi:10.1016/j.ecolecon.2005.06.004
Xiang, H., Zhou, C. M., Dong, C., and Song, H. X. (2024). High-quality agricultural development in the central China: empirical analysis based on the Dongting Lake area. Geomatica 76 (1), 100010. doi:10.1016/j.geomat.2024.100010
Xie, G. D., Zhang, C. X., Zhang, L. M., Chen, W., and Li, S. (2015). Improvement of the evaluation method for ecosystem service value based on per unit area. Nat. Resour. J. 30, 1243–1254. doi:10.11849/zrzyxb.2015.08.001
Xie, G. D., Zhang, C. X., Zhen, L., and Zhang, L. M. (2017). Dynamic changes in the value of China's ecosystem services. Ecosyst. Serv. 26, 146–154. doi:10.1016/j.ecoser.2017.06.010
Xie, G. D., Zhen, L., Lu, C. X., Xiao, Y., and Chen, C. (2008). Expert knowledge based valuation method of ecosystem services in China. Nat. Resour. J. 23, 911–919. doi:10.11849/zrzyxb.2008.05.019
Yang, Q. Y., Wang, W. X., Zhou, L. L., Li, Y., and Lu, J. (2024). Progress and prospects of research on compensation for arable land protection. J. Southwest Univ. Nat. Sci. Ed. 46, 2–14. doi:10.13718/j.cnki.xdzk.2024.10.001
Yang, X., Zhang, F., Luo, C., and Zhang, A. (2019). Farmland ecological compensation zoning and horizontal fiscal payment mechanism in Wuhan Agglomeration, China, from the perspective of ecological footprint. Sustainability 11, 2326. doi:10.3390/su11082326
Yawson, D. O. (2020). Estimating virtual land use under future conditions: application of a food balance approach using the UK. Land Use Policy 101, 105132. doi:10.1016/j.landusepol.2020.105132
Zhang, H. Z., Song, W., Zhang, W. X., Li, X. J., Liu, J. Q., and Li, J. Y. (2021). Analysis of spatial differentiation characteristics and influencing factors of non-grain cultivated land in Shandong Province. China Land Sci. 35, 94–103. doi:10.11994/zgtdkx.20210926.085250
Zheng, H., Bai, Y., Wei, W., Meng, J., Zhang, Z., Song, M., et al. (2021). Chinese provincial multi-regional input-output database for 2012, 2015, and 2017. Sci. Data. 8, 244. doi:10.1038/s41597-021-01023-5
Keywords: virtual cultivated land, horizontal ecological compensation, major grain producing area, North China Plain, compensation zoning and standard
Citation: Chen J, Yang S, Du H, Liang W and Liu Y (2025) Horizontal ecological compensation zoning and standard in China’s major grain-producing areas based on virtual cultivated land flow. Front. Environ. Sci. 13:1578780. doi: 10.3389/fenvs.2025.1578780
Received: 06 March 2025; Accepted: 25 April 2025;
Published: 16 May 2025.
Edited by:
Ding Li, Southwestern University of Finance and Economics, ChinaReviewed by:
Dewen Liu, Nanjing University of Posts and Telecommunications, ChinaHuaxiang Song, Hunan University of Arts and Science, China
Copyright © 2025 Chen, Yang, Du, Liang and Liu. This is an open-access article distributed under the terms of the Creative Commons Attribution License (CC BY). The use, distribution or reproduction in other forums is permitted, provided the original author(s) and the copyright owner(s) are credited and that the original publication in this journal is cited, in accordance with accepted academic practice. No use, distribution or reproduction is permitted which does not comply with these terms.
*Correspondence: Shan Yang, eXlzczE5ODVAMTYzLmNvbQ==