 Zhengpeng Luo1
 Bo Chai
- 1School of Environmental Studies, China University of Geosciences, Wuhan, China
- 2Technical Innovation Center for Geo-Environmental Remediation, Ministry of Natural Resources, Wuhan, China
Introduction: Ecosystem stability confers more abundant and comprehensive ecosystem service values. However, current valuation methods often simplify these ecosystems as undisturbed, ideal, and standardized—neglecting inherent variations in structure and quality—and thereby risk skewing service valuations.
Methods: We propose a coupled calculation model based on patch stability that integrates land cover dynamics with transitions in the Remote Sensing-based Ecological Index (RSEI). From this model, we derive a novel valuation metric, the Effective Forest Area (EFA). We validate both the model and the metric using Heshan City—a coal mining city facing resource depletion—as a case study.
Results: Between 2010 and 2020, despite a net increase in total forest area, management practices driven by fast-growing forestry industries degraded the quality of stable forests and resulted in a persistent decline in their extent. Even in regions with intensive ecological compensation, achieving desired restoration outcomes proved challenging, a situation that ultimately reduced the overall function and service value of the regional forest ecosystem. The results show that, compared to the EFA model, traditional calculation methods overestimated the forest ecosystem service value in all regions, with the overestimation being highest in the Spontaneously Developed Rural Area (35%), followed by the Industrial Heritage Tourism Area (29%), and the Urbanization Area (26%).
Discussion: The EFA model underscores the critical impact of structural and quality changes on ecosystem service value, thereby enabling more comprehensive evaluations—assessments that are essential for developing nature-based solutions and strategies to enhance ecosystem quality.
1 Introduction
Ecosystems deliver a wide and diverse array of functions and services—that is, the natural environmental conditions and derivative products (in terms of materials, energy, and information) generated and sustained through ecological processes, for humans, the value derived from an ecosystem’s cultural, provisioning, regulating, and supporting services is referred to as its ecosystem service values (Costanza et al., 1997). In terms of volume, diversity, and supply stability, forest ecosystems play a critical role in delivering ecosystem service values (Costanza et al., 2014; Grassi et al., 2017; Houghton and Nassikas, 2017; Li C. et al., 2023). However, global forest systems are threatened by degradation resulting from pests, diseases, extreme weather events (including forest fires), and human disturbances (Van Lierop et al., 2015). To confront these challenges, initiatives such as afforestation (Feng et al., 2022), forest restoration (Guerra et al., 2020), improved forest management (Tolessa et al., 2017), deforestation prevention (Chazdon et al., 2016), and measures to enhance forest system stability (including the contribution of growth associated with aging) (Daigneault et al., 2022), along with other afforestation-related efforts, are essential for maintaining and boosting the value of ecological services.
To evaluate the effectiveness of these management actions and the value of ecosystem services, various assessment models have been developed, including market-based, non-market, and modeling approaches (e.g., InVEST) (Tanner et al., 2019; Obeng et al., 2020; Börger et al., 2018; Bai et al., 2020). While useful for fostering social consensus, these methods often simplify ecosystem complexity, critically neglecting the influence of disturbance history and management practices on the actual ecological quality and functionality of forests. For instance, many assessments assume forests exist in an idealized, homogeneous, stable state (Popp et al., 2017), or simply multiply physical area changes by a fixed unit value. This oversimplification fails to capture the inherent heterogeneity and dynamics of forest ecosystems (Barreiro-Lostres et al., 2015; Pinna et al., 2019; Paz et al., 2022; Maurice et al., 2024), leading to significant discrepancies between estimated and actual ecosystem service values, particularly in areas with high human activity (Shen and Zeng, 2022).
Anthropic disturbances affect ecosystem service functionality through complex ecological processes (Barreiro-Lostres et al., 2015; Pinna et al., 2019; Li Z. et al., 2023; Paz et al., 2022; Maurice et al., 2024). Yet many assessments of forest ecosystem service values assume that forests exist in an ideal, stable state—yielding high valuations—while failing to distinguish plantation forests from natural forests (Birhane et al., 2024). This implicit assumption can lead to systematic overestimation of service values.
Moreover, unfavorable forest management practices—such as mono-culture plantations, site disturbance by heavy machinery, and herbicide application—can exacerbate disturbances and degrade ecosystem quality. (Watson et al., 2018; Sun et al., 2022; Jardim et al., 2022), thereby diminishing their true value (Wang et al., 2021). The theory of patch stability in landscape ecology further supports this view by highlighting how spatial continuity and patch integrity underpin ecosystem resilience (Yan et al., 2021; Galia and Máčka, 2023). Therefore, before assessing ecosystem service values, it is crucial to accurately identify the “effective” forest area—i.e., the portion of forest that remains relatively undisturbed and capable of delivering expected services—rather than relying solely on gross physical area measurements. This study focuses on a resource-depleted coal-mining city that exemplifies the urgent need for industrial and land-management adjustments. Field investigations reveal that the area’s rapid economic transformation depends on reshaping local forestry to support the timber and related sectors, making it a representative case (Figure 1). As economic recovery increasingly relies on commercial forestry, large-scale plantations of fast-growing species such as eucalyptus have been established. While this practice has boosted overall forest cover, the intense anthropic disturbances associated with plantation establishment—such as heavy machinery operations and herbicide application—are progressively threatening the continuous patch structure and diverse understory characteristic of formerly stable natural forests, thereby undermining their capacity to deliver expected ecosystem services (Cao, 2011; Descheemaeker et al., 2006; Jaleta et al., 2017; Liu and Li, 2010; Lu et al., 2018; Moges et al., 2020).
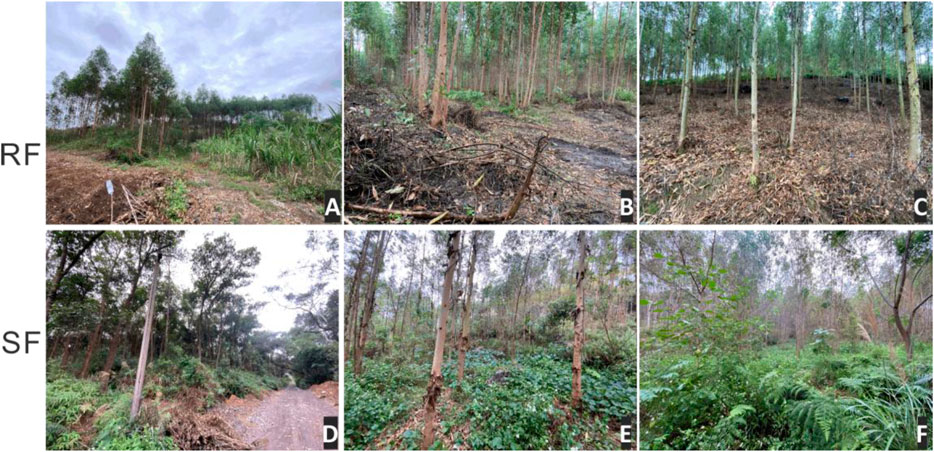
Figure 1. Field investigation of stable natural forest and regenerated forest patches. ((A) Located adjacent to farmland, this patch is highly susceptible to disturbances and non-point source pollution. (B) Experiences significant mechanical disturbance from heavy machinery. (C) Receives herbicide applications. (D) Exhibits a high degree of rewilding. (E) Possesses a more developed understory structure. (F) Displays high above-ground biomass, Figures A-C show regenerated commercial forests, while Figures D-F depict stable forests).
Existing methods for valuing forest ecosystem services typically overlook the structural characteristics and quality of the forests under assessment. To optimize these widely used approaches, our objective is to propose an enhanced valuation metric—termed the Effective Forest Area (EFA). This metric refines traditional, area-based ecosystem service assessments by quantifying the status of both forest quality and structure in the region under assessment using remote sensing techniques.
This paper, grounded in the context of Heshan, a resource-depleted city, proposes a calculation model and technical workflow for calculating Effective Forest Area (EFA). The results present the changes in EFA during the decade before the implementation of mine ecological restoration projects (2000–2010) and the decade after (2010–2020) in Heshan. Furthermore, the study discusses the differential impacts of mine ecological restoration on EFA changes across three distinct zones: the Urbanization Area, the Industrial Heritage Tourism Area, and the Spontaneously Developed Rural Area.
2 Materials and methods
2.1 Study area
Heshan City, located in the central part of Guangxi in southwestern China, has a coal mining history spanning nearly 120 years, dating back to 1905. It exemplifies urban development driven primarily by coal mining activities. Coal extraction and pithead power generation once formed the backbone of the city’s economy. However, by 2009, the exploitable coal resources in the Heshan coalfield were essentially exhausted, and in March of that year, Heshan City was designated as one of the nation’s second batch of resource-depleted cities (Tang et al., 2013). The study area lies within a subtropical monsoon climate, with a long-term mean annual temperature of 21.2 °C (extreme maximum 39.0 °C; extreme minimum −1.8 °C). Mean annual precipitation is 1 282 mm, unevenly distributed: 77.5% falls between April and September, with the wettest month receiving up to 705 mm and the single highest daily total reaching 263 mm. Mean annual evaporation is 1 244.4 mm, peaking from May to October. A vegetation survey recorded 87 species across 39 families and 61 genera. Major tree species include weeping fig (Ficus benjamina), camphor tree (Cinnamomum camphora), Hong Kong orchid tree (Bauhinia variegata L.), Chinese fan palm (Livistona chinensis), and bamboo (Dendrocalamus latiflorus). Dominant shrubs are oleander (Nerium oleander), bougainvillea (Bougainvillea spectabilis), and purple-leaf sand cherry (Padus virginiana ‘Canada Red’). Common ligneous plants and herbaceous plants include sago palm (Cycas revoluta), and ramie (Boehmeria nivea) artificial afforestation is dominated by the planting of fast-growing tree species with economic value, such as eucalyptus.
Mining-induced goafs now cover 32.9% of the city’s administrative area. Disorganized piles of coal gangue, severely damaged topography and landscapes, and devastated surface vegetation vividly illustrate the extensive impact of mining activities. Moreover, geological challenges such as soil erosion and water pollution have become increasingly prominent (Li et al., 2023). Over the years, in an effort to mitigate these issues and promote the transformation of this resource-depleted city, the Heshan municipal government has implemented various policies and allocated funds to restore and manage the local ecological environment.
The study area for this research is defined as the core region during Heshan City’s historical coal mining period and comprises five interconnected mining zones (The five mining areas all commenced coal mining operations at the same time and were declared closed simultaneously, with coordinated restoration planning initiated at that point.): (1) Lilan (∼27 km2), (2) Shangtang (∼6 km2), (3) Suhe (∼24 km2), (4) Dong (∼57 km2), and (5) Liuhua (∼19 km2) (Figure 2). According to Heshan City’s mine geological environmental restoration planning, the Lilan, Shangtang, and Suhe areas are designated as the Urbanization Area, these areas have implemented specialized ecological restoration designs and projects tailored to the needs of urban development. As the primary zone for industrial tourism development utilizing its preserved mining heritage, the Dong District belongs to the Industrial Heritage Tourism Area, which involved specially designed ecological restoration projects around the industrial sites. In contrast, the remaining areas are characterized primarily by spontaneous restoration. The Liuhua mining area serves as a key example. Located in a rural township, it has not undergone specially designed ecological restoration projects; instead, activities there are dominated by spontaneous restoration and forestry management initiated by local residents.
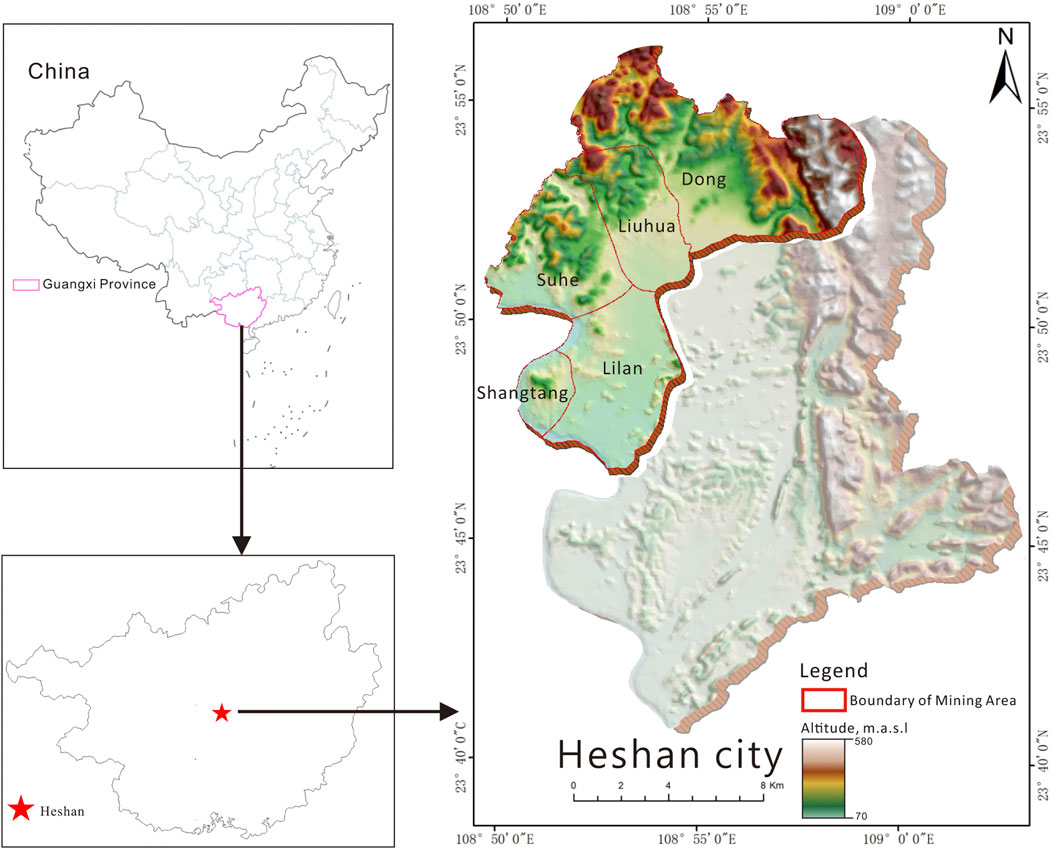
Figure 2. The study area location and primary mining area.
2.2 Data sources and pre-processing
In this study, the Google Earth Engine (GEE) was employed to retrieve and process post-atmospheric correction imagery from Landsat (Landsat 5 and Landsat 8) and Sentinel-2 for the period from April to October during 2000–2020, ensuring a cloud cover of less than 4% (Gorelick et al., 2017). To minimize information loss due to cloud removal, a linear interpolation method was applied to interpolate missing spectral data in the time-series curves. Using GEE algorithms, multispectral bands—including blue, green, red, near-infrared (NIR), shortwave infrared 1 (SWIR 1), and shortwave infrared 2 (SWIR 2)—were extracted to calculate various indices, such as the Bare Soil Index (BSI), Impervious Building Index (IBI), Normalized Difference Built-up and Bare Soil Index (NDBSI), Wetness Index (WET), Normalized Difference Vegetation Index (NDVI), and Land Surface Temperature (LST).
Furthermore, the study utilized the Global Canopy Height Model based on Sentinel-2 imagery (Lang et al., 2023) to obtain information on carbon storage within canopy patches. This model is available at: https://nlang.users.earthengine.app/view/global-canopy-height-2020. Finally, the Normalized Difference Water Index (NDWI) (Xu, 2008) was used to mask water bodies, effectively eliminating their interference in the RSEI analysis.
2.3 Calculation model of effective forest area
A region’s stable forest (SF)—defined here as those patches that remain classified as forest across two consecutive land-use maps—most closely approximates a reference ecosystem. Typically, this forest exhibits the highest average ecological quality measured by the RSEI, and it maintains a stable, continuous spatial distribution, thereby providing the best ecosystem services within the region (Li X. et al., 2023).
For the baseline year we record the mean RSEI of the stable forest (SFBR) and its mean patch size (SFBA). For the evaluation year we obtain the corresponding values SFR (mean RSEI), SFA (mean patch size), and the physical extent of stable forest A. Combining the relative change in ecological quality (SFR/SFBR) and the relative change in structural stability (SFA/SFBA) yields the stable-forest quality coefficient (optimization coefficient)
so that α·A represents the quality-adjusted area of the evaluation-year stable forest (Equation 1a).
The quality of regenerated forest (RF)—patches that first appear as forest in the evaluation year—is assessed relative to the contemporaneous stable forest. This assessment is based on a comparison of its mean RSEI (RFR) and mean patch size (RFA) against the corresponding values of the stable forest (SFR and SFA, respectively). The resulting quality coefficient, β, captures the ecological and structural quality of RF relative to the SF reference (Equation 1b).
The following is an example of a practical application using data from the Shang mining area:
Calculate the stable forest quality coefficient:
and its contribution:
Calculate the regenerated forest quality coefficient:
and its contribution:
Thus,
Although the raw physical forest area in the evaluation year is approximately 2 × 10⁶ m2, the quality-adjusted Effective Forest Area is reduced to about 1.55 × 10⁶ m2 (Equations 1a, b).
2.4 Workflow of EFA
The following are the specific prerequisite materials and preparation steps for calculating the EFA (Figure 3).
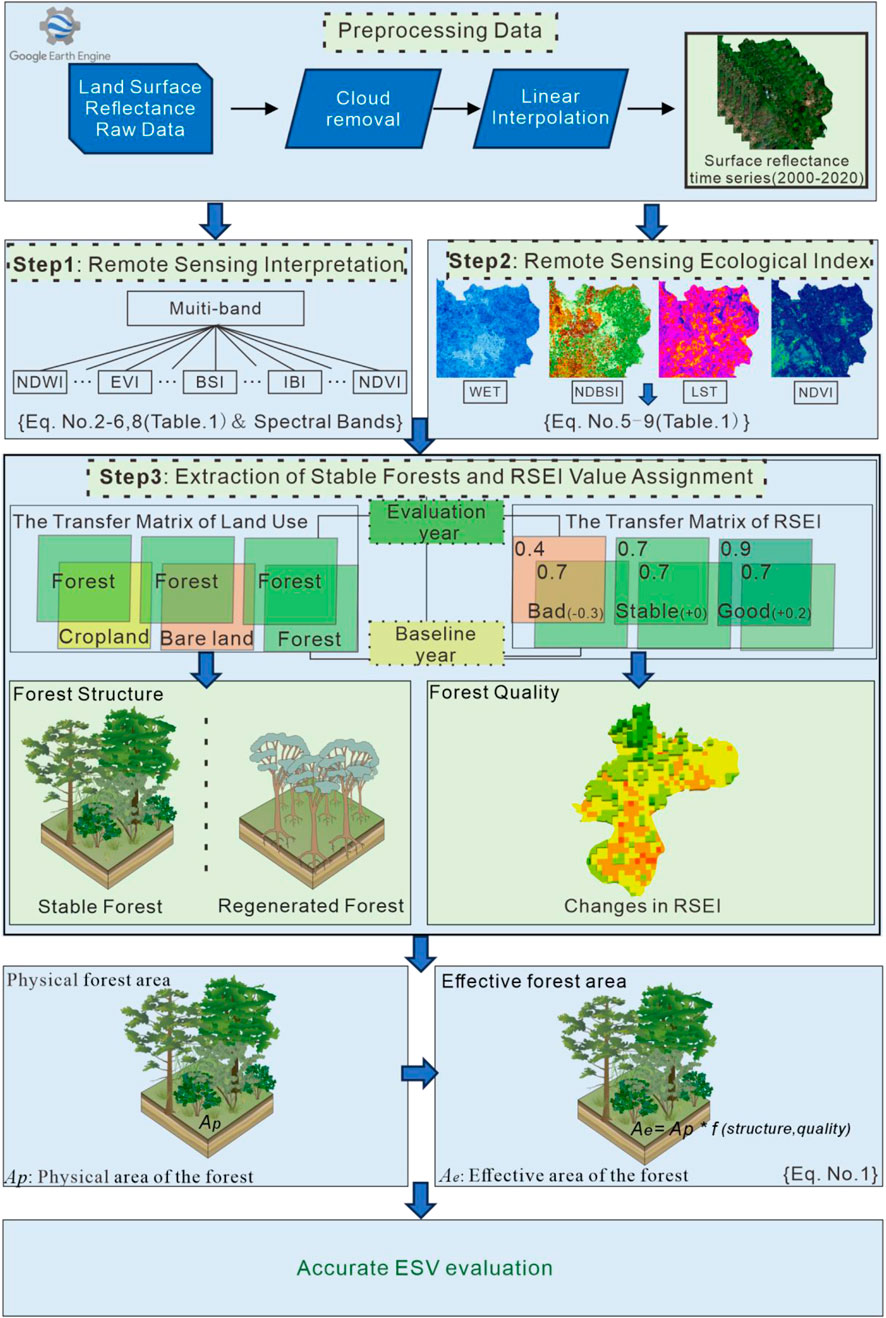
Figure 3. Overall technical workflow of this study.
2.4.1 Remote sensing interpretation and transfer matrix of land use
Based on multi-temporal and multi-variable remote sensing data obtained from GEE (Table 1), we classified land cover using the random forest algorithm (Duro et al., 2012). The classification delineated six categories: farmland, forest, grassland, water bodies (including rivers and lakes), impervious surfaces (encompassing roads, construction sites, and mining areas), and bare land (Kaufman and Didier, 1992; Skakun et al., 2017; Tucker, 1979; Xu, 2008). The accuracy of these classified maps was assessed using 300 random points against high-resolution Google Earth imagery, consistently yielding an average Kappa coefficient above 0.8. To analyze the temporal dynamics of these classified land uses, this study employs the conceptual framework of a baseline year and an evaluation year. The baseline year serves as the reference point, typically representing either a year with a relatively optimal ecosystem state or one selected for specific comparative objectives. The evaluation year is the time point for assessing the impacts of subsequent policies, measures, or disturbances. For this research, we established a 10-year interval, setting 2010 as the baseline and 2020 as the evaluation year. This specific timeframe was chosen primarily to assess the effectiveness of ecological restoration measures implemented during this decade, while also aligning with the typical harvesting cycle of local eucalyptus commercial forests, as determined through policy analysis and field surveys.
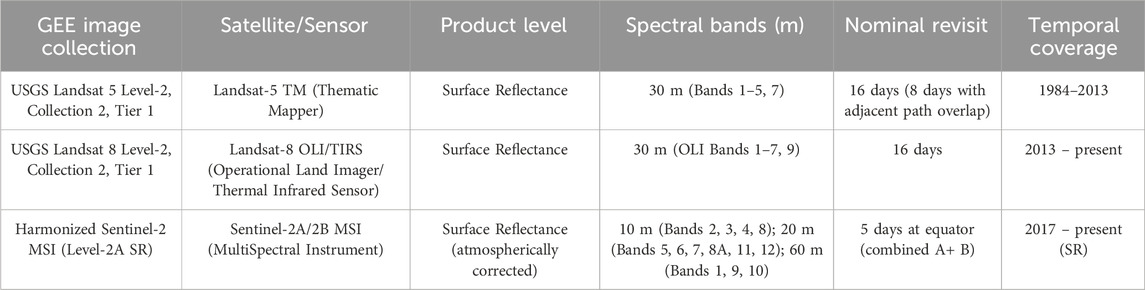
Table 1. GEE datasets and associated sensor information.
2.4.2 Remote sensing-based ecological index (RSEI)
Incorporates four objective indicators closely linked to human survival (Xu, 2013): Wetness, Greenness, Dryness, and Heat. In this research, image data acquired from GEE were used to characterize these indicators via the NDVI for Greenness, the wetness component from the Tasseled Cap Transformation (TCW) for Wetness, the Normalized Difference Built-up Index (NDBSI) for Dryness, and Land Surface Temperature (LST) for Heat. Additionally, Principal Component Analysis (PCA) was performed to reduce dimensionality while retaining maximum information and ensuring objectivity in weight distribution. As a result, the RSEI index for the study area was obtained for the period 2000–2020 (calculation methods are shown in Table 2).
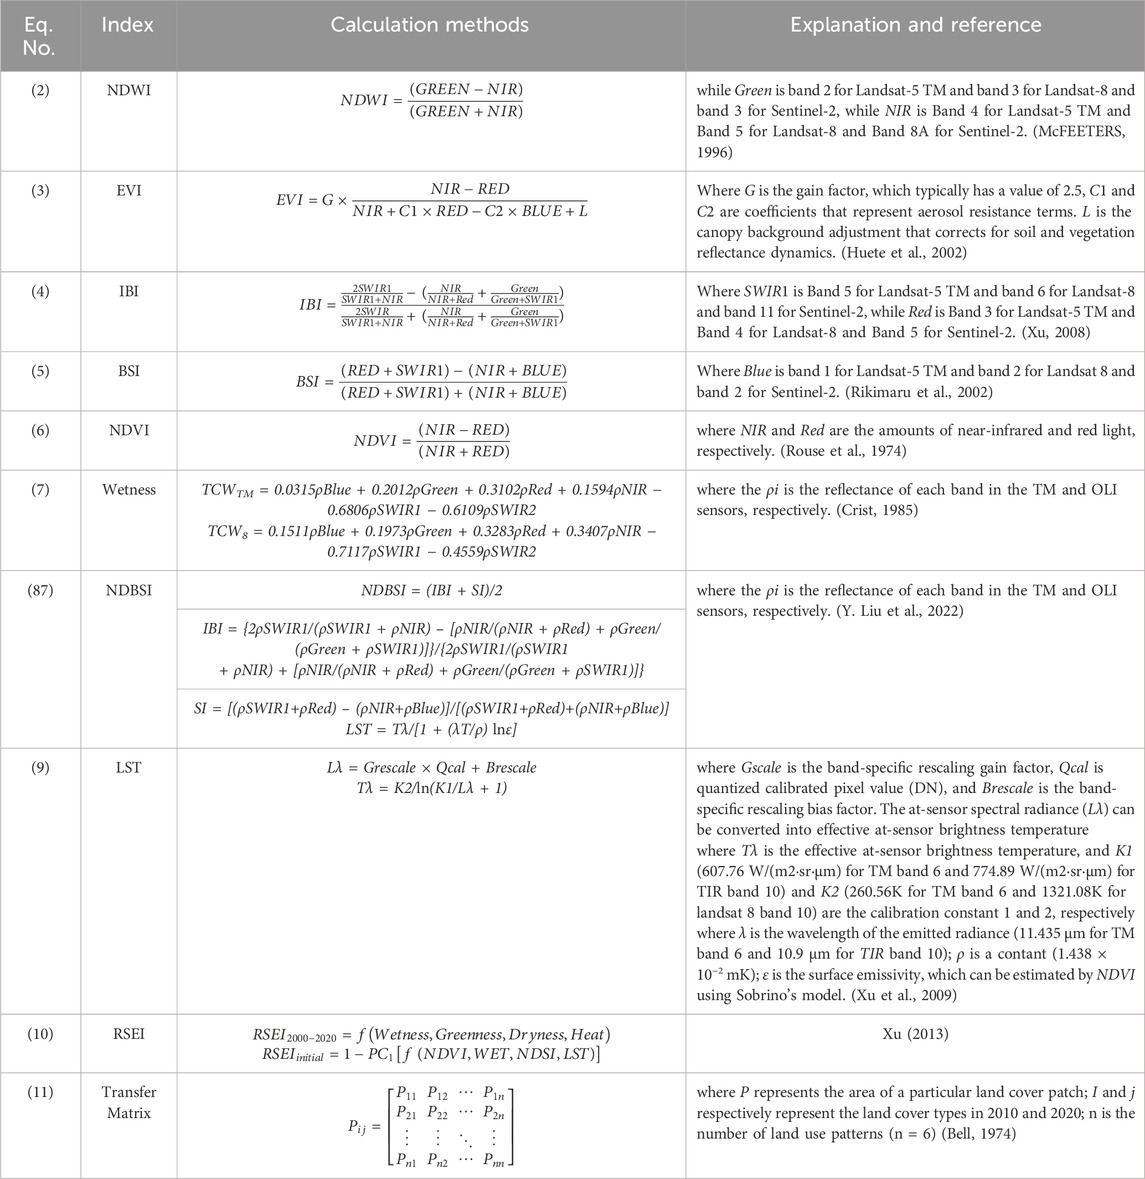
Table 2. Calculation formula, and explanation.
2.4.3 Extraction of stable forests and RSEI value assignment
In this study, land-use transition matrices are employed to quantify stable forests, a process that requires defining a baseline year and an evaluation year. This method allows us to extract a set of “stable forest” patches—those that remained classified as forest and occupied the same geographic location throughout the 10-year period. Patches that transitioned from other land cover types into forest during this interval were designated as “Regenerated Forests.” Subsequently, RSEI values from the evaluation year were assigned to their corresponding patches, yielding a distinct set of RSEI values for each patch type (i.e., Stable Forest and Regenerated Forest) for that year.
3 Results
3.1 Evolutionary trends of patch structure based on the transition matrix
Figure 4 displays the evolution trends of the forest and grassland ecosystems in the study area from 2000 to 2020. Overall, over the course of these 20 years, the study area has experienced varying degrees of degradation in both stable forests and stable grasslands, showing a tendency to be increasingly encroached upon by other land cover types.
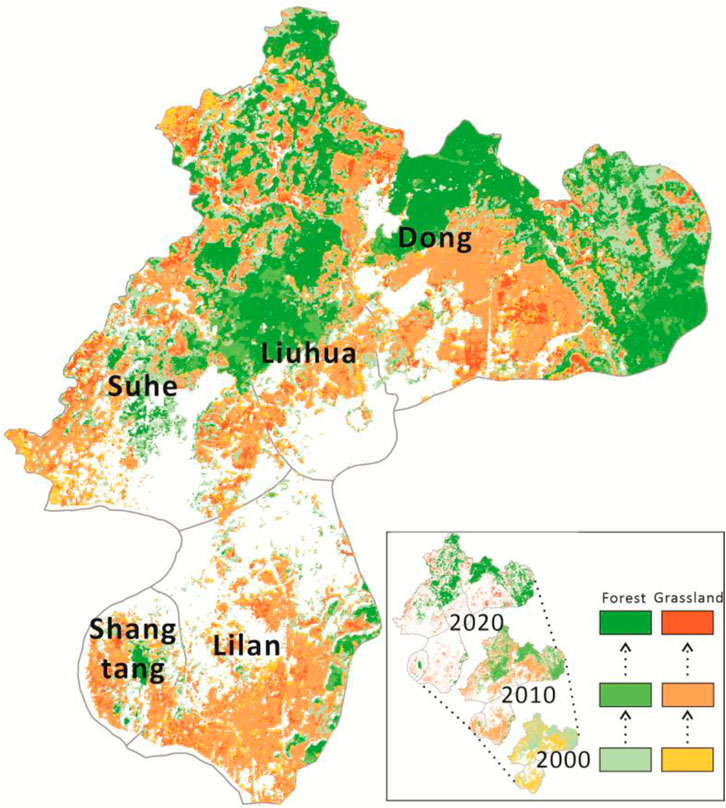
Figure 4. Evolution trend of Heshan’s stable forest and stable grassland systems from 2000 to 2020.
From 2000 to 2010, overall forest area declined from 53.99 km2 to 38.34 km2; nonetheless, the retention rate of stable forest patches generally remained high. By 2020, even though the total forest area in the study region had expanded—reaching 107% of its 2000 level (compared to only 71% in 2010)—the loss rate of stable forest and grassland patches steadily increased. Among the stable forest patches that existed in 2000, only 47% remained within the study area’s total forest cover by 2020. This indicates that nearly 50% of these patches were lost over the 20-year period (Table 4).
3.2 RSEI-based ecological quality characterization
Based on the RSEI definition combined with LULC data, the patch types most representative of the two positive indicators—namely forests and grasslands—were identified for ecological quality analysis. A box plot with individual data points and a kernel density estimation plot on a single vertical axis to display the Remote Sensing-based Ecological Index (RSEI) values for four patch types. Each point represents an individual pixel sample, collectively illustrating the full data distribution. The dashed outline indicates the kernel density, while the box plot summarizes key statistics such as the median, interquartile range, and outliers. Analysis of the data’s central tendency, dispersion, and distributional shape shows that Stable Forest has the highest mean and median RSEI values, which indicates that these forests provide the most consistent and highest-quality ecosystem services in the region (Figure 5).
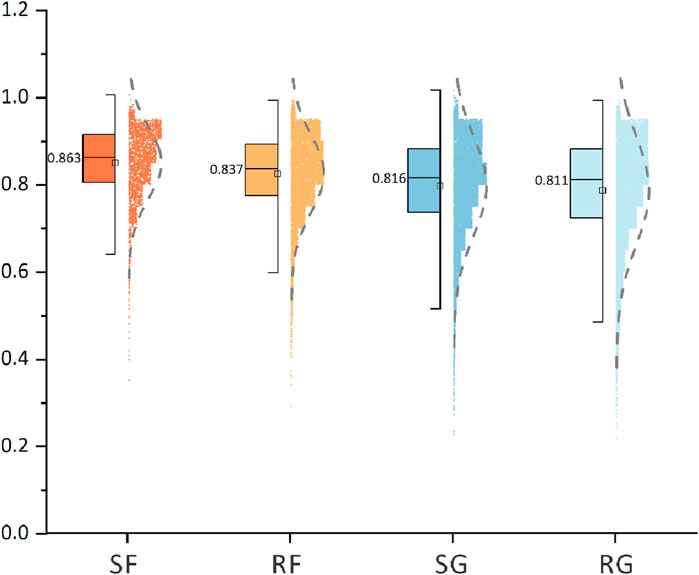
Figure 5. RSEI Data Box diagram of Heshan mining in 2020.
In addition, regenerated forests show significant differences from regenerated grasslands in terms of RSEI (p ≤ 0.05).
According to the results from Table 3, there is a significant difference (p ≤ 0.05) when comparing the overall data of SF (Stable Forest) with the other three categories. This indicates that stable forest ecosystems achieve the highest efficiency and ecological service value in the RSEI evaluation, which is consistent with established knowledge in ecology and environmental science.
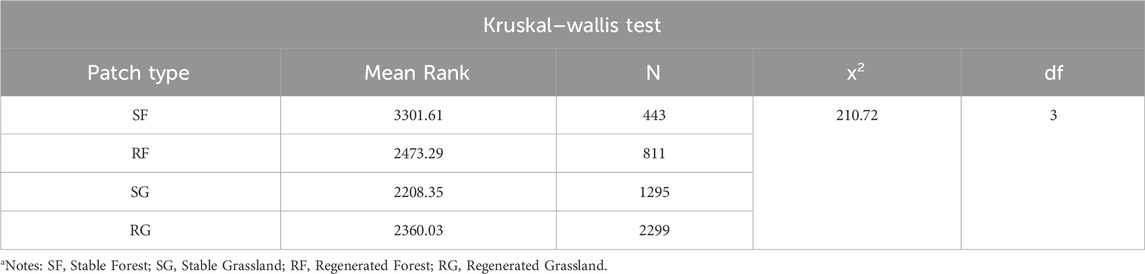
Table 3. Kruskal–Wallis test conducted on stable and regenerate patches.
3.3 EFA model calculation results
The optimization coefficients and the results from the optimized model show a significant discrepancy with the simple growth in area (Table 4, 5).
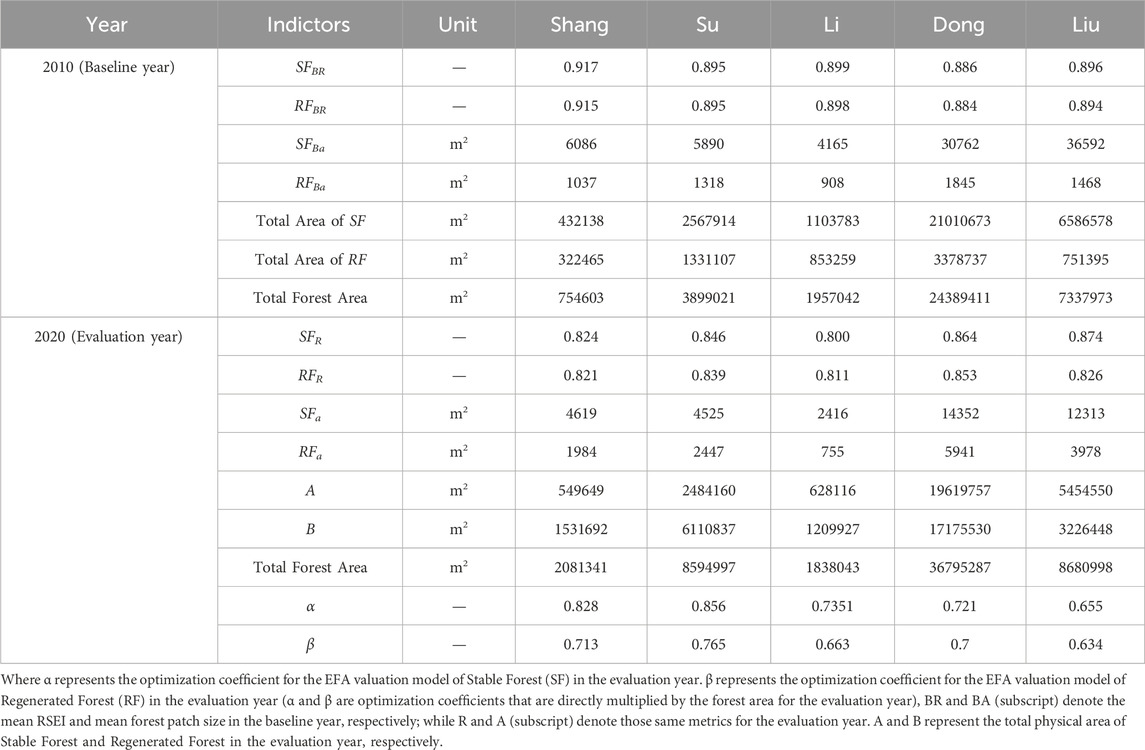
Table 4. The parameters related to the EFA valuation model for the mining areas in Heshan City in the years 2010 and 2020.
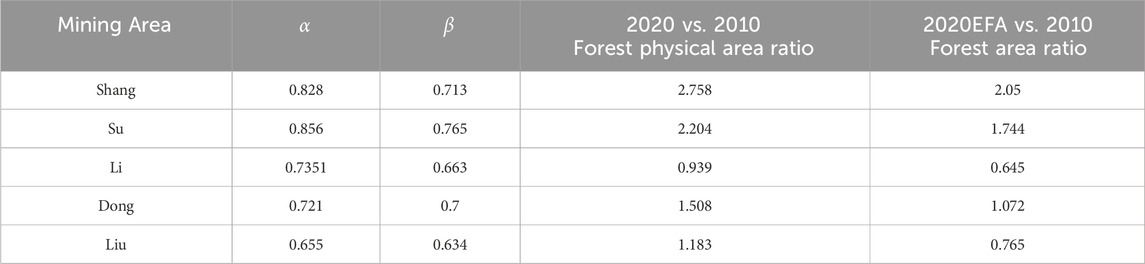
Table 5. Optimization model and verification of the EFA in the primary mining areas of Heshan City.
Specifically, despite an increase in forest area, the quality of the forest ecosystem at Liuhua Mine has declined—primarily due to the deterioration of its stable forest ecosystem. In contrast, although Dong Mine has implemented the most robust and intensive ecological compensation measures aimed at ecological restoration and tourism development, the overall quality of its forest ecosystem has only slightly improved compared to 2010, even though the forest area has expanded by 1.5 times. In the Shangtang and Suhe mining areas, extensive planting of regenerated forests coupled with effective protection of the region’s stable forests has led to a significant improvement in forest ecosystem quality. On the other hand, Li Mine, located at the heart of Heshan City’s urban development, has experienced a decrease in forest area since 2010 and a more severe degradation of its stable forest ecosystem, resulting in a substantial overall decline in forest ecological quality (Table 5).
4 Discussion
The land use transition matrix indicates the impact of different policies on ecosystem stability. In this study, ecosystem stability is defined by whether land cover patch types changed during the 10-year period. Specifically, the six basic land use categories are subdivided into nine categories (reflecting differences in ecosystem functions and stability) in the outer circle, which are then grouped into a middle circle (representing human disturbance intensity) and an inner circle (representing policy and management) for statistical analysis. This approach illustrates the differences in ecosystem substructures and conditions brought about by varying policy orientations and management methods.
As shown in Figure 6, land use and cover (LULC) patterns, as well as the stability of ecological patches, are influenced by the delineation of functional areas and the varying intensities of human disturbances within these zones. In this study, the Urbanization Areas (Li, Shang, and Su mines) exhibit the densest grey infrastructure at 6.2%. Their land use is primarily characterized by semi-natural ecosystems, consisting mainly of farmland (13.6%), regenerated forest land (6.6%), and regenerated grassland (3.8%). However, these areas retain only minimal amounts of stable forest (2.7%) and stable grassland (3.4%).
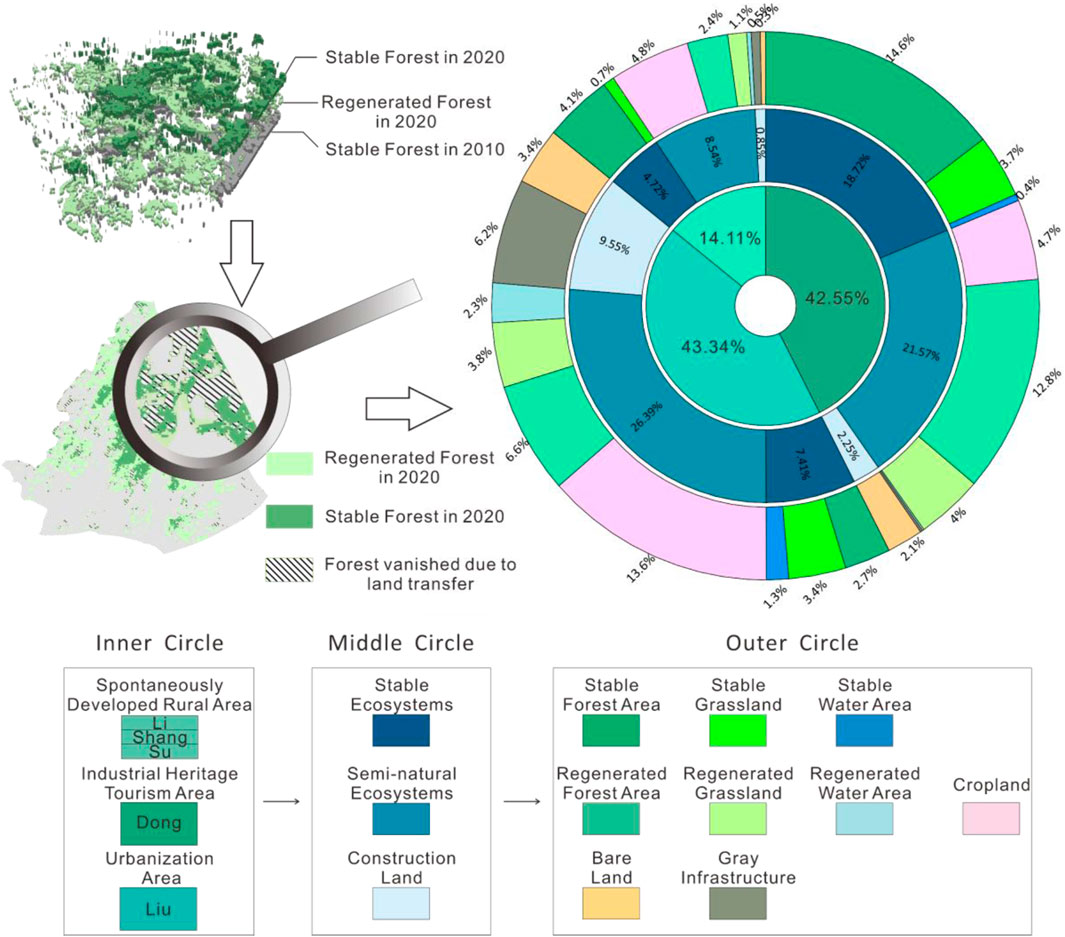
Figure 6. Impacts of different management strategies on ecosystem stability and structural composition.
In contrast, the Industrial Heritage Tourism Area designated for ecological tourism development (Dong mine) possesses the most stable ecosystem at 18.72%, with the largest retained areas of stable forest (14.6%) and stable grassland (3.7%). Additionally, within its semi-natural ecosystem, the proportion of regenerated forest is the highest at 12.8%, indicating that the management policies in this mining area are more oriented toward ecological compensation. Meanwhile, the Spontaneously Developed Rural Area, which focuses primarily on natural restoration (Liu mine), displays a more balanced composition of land classes, with no clear policy-driven trend.
The period from 2000 to 2010 was characterized by a decline in overall forest area, yet the retention rate of stable forest patches remained high. This trend shifted dramatically after 2010, as Heshan City embarked on an industrial transformation centered on agriculture and forestry. Driven by social and industrial demand, this new phase promoted the rapid establishment of fast-growing commercial forests. The consequences of this policy shift are stark. By 2020, while the total forest area in the study region had significantly expanded—rebounding to 107% of its 2000 level from a low of 71% in 2010—the loss rate of stable forest patches simultaneously accelerated. Crucially, only 47% of the stable forest patches that existed in 2000 remained by 2020. This means nearly half of these high-quality habitats were lost over the two-decade period, leading to a significant reduction in the ecosystem service value they provided (Figure 7).
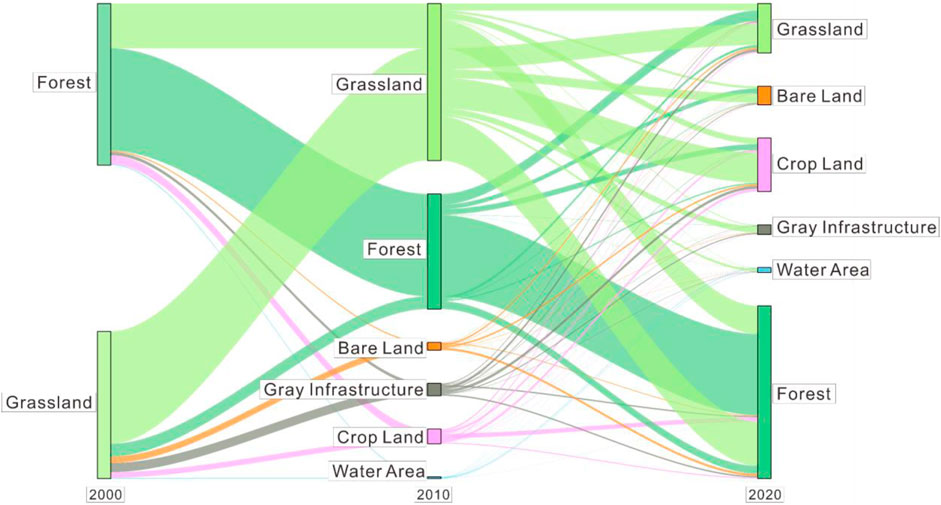
Figure 7. Loss and compensation of stable ecosystems in Heshan city.
A Grouped Marginal Plot with Distribution Curves (Figure 8) was used to statistically illustrate the forest patch ecosystem quality in 2010 and 2020, with areas scaled using the natural logarithm. Prior to 2010—before the implementation of industrial transformation policies—the RSEI values for forest ecosystems across various mining areas in Heshan City were generally high, with points clustering on the right side of the x-axis. Moreover, the shapes of the marginal curves indicated an almost normal distribution for both axes’ data, suggesting minimal human disturbance and a predominance of natural succession. However, by 2020, the data distribution had undergone significant deformation. Compared to 2010, the points were more dispersed and shifted noticeably toward the third quadrant (as evidenced by comparing the data centroids between the two periods). Additionally, the marginal curves transitioned from a near-normal to a non-normal distribution, accompanied by a marked reduction in peak heights. These changes indicate that, in 2020, the forest ecosystems across all mining areas in Heshan City experienced stronger human disturbances, resulting in a decrease in the overall average ecosystem quality. Furthermore, the forest ecosystems in the first column mining areas—Shang, Su, and Li (Urbanization Area)—exhibited more severe degradation (as seen by centroid offset distances and changes in marginal curve shapes), whereas Dong Mine (Industrial Heritage Tourism Area) maintained a better overall condition, and Liu Mine (Spontaneously Developed Rural Area) fell between the two.

Figure 8. Impacts of different management strategies on ecosystem quality.
Compared to stable forests, newly established forests underperform on several key indicators, making it difficult for them to consistently deliver ecosystem services. If policymakers do not intensify efforts to safeguard stable forests, this ongoing neglect may eventually result in a long-term decline in the overall ecosystem service value of forest systems (Hua et al., 2022).
Our observations indicate that stable forests generally exhibit greater average tree height, diameter at breast height (DBH), above-ground biomass, and a more complex understory structure compared to regenerated forests—findings that are consistent with recent research (Feng et al., 2022). Moreover, most regenerated forest patches are dominated by fast-growing commercial species.
The case of Heshan City (2010–2020) starkly illustrates the limits of relying solely on aggregate indicators such as region-wide RSEI or total forest area, which can suggest ecological improvement despite underlying degradation (Table 5). This pattern aligns with critiques of ecosystem-service valuation approaches that depend heavily on coarse land-use categories (Deng and Wu, 2012; Hu and Xu, 2018; Firozjaei et al., 2019; Wang et al., 2023), because such methods mask important within-class variation in ecosystem structure, condition, and quality. The blind spot is amplified when decision-makers—pressed by urgent economic-development objectives—favor these simplistic, often area-based metrics. Such reliance fosters the belief that expanding green cover alone can resolve complex ecological and socio-economic challenges (Funk et al., 2019; Zhang et al., 2023). Ultimately, this approach fails to capture how dynamic changes in forest composition and configuration affect ecosystem-service provision under evolving policies and environmental conditions. These issues appear in some studies of ecosystem service valuation, which often apply idealized estimates to quantify the total ecological value of all forest patches within a given area without distinguishing between forest condition or management regime. Even if these estimates are adjusted slightly to suit the study region or objectives, they can still overstate the region’s ecosystem resources and misguide future management strategies.
A comparison between the EFA model and conventional calculations shows that, in 2020, the forest ecosystem service value of Heshan City amounted to only about 71 percent of the traditional valuation (Table 6).
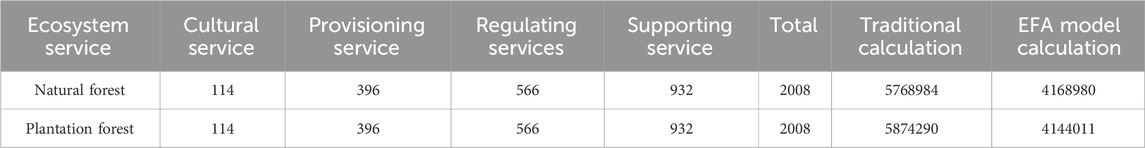
Table 6. Global coefficients ($USD ha−1 year−1), from Costanza and Birhane.
In Heshan City, this disconnect between superficial metrics and ecological reality manifested significantly between 2010 and 2020. While conventional assessments might indicate progress, our analysis reveals a gradual loss of “ideal” or stable forests due to prevailing management practices and policies favoring rapid afforestation, often neglecting the intrinsic condition of the ecosystem. Although tree planting increased overall forest area and potentially influenced RSEI positively in some locations, this apparent gain masked the substantial ecological cost: the erosion of original, high-quality forests that delivered stable ecosystem services (Costanza et al., 2014; Wang et al., 2021). We contend that this focus on quantity over quality results in a “pseudo-valuation,” effectively creating a value bubble where reported gains in ecological assets do not reflect genuine functional improvement or may even conceal functional decline.
Importantly, our findings provide quantitative support for this quality distinction: we observed a positive correlation between patch stability (associated with larger patch sizes typical of stable forests) and higher ecological quality indicators (RSEI) (Figure 8). This aligns with related landscape ecology research emphasizing the importance of habitat configuration and quality beyond mere area (Fan et al., 2019; Masoudi and Tan, 2019; Yan et al., 2021; Galia and Máčka, 2023).
5 Conclusion
Accurately assessing ecosystem service values is essential for developing effective resource management and ecological restoration strategies. Unlike valuation models that rely solely on changes in ecosystem area, this study integrates patch stability theory with an RSEI–land use change approach to propose an optimized ecosystem service valuation model known as Effective Forest Area (EFA). The results show that combining a land-use transition matrix with RSEI can effectively track long-term ecosystem quality over large areas; comparative analysis indicates that traditional ecosystem value estimation methods overestimate Heshan City’s forest ecosystem service value by nearly 30%.
Integrating forest structure, quality, and stability information, the Effective Forest Area (EFA) model and its research method clarify the actual impact of anthropogenic disturbances and management practices on ecosystem quality. By quantifying the real ecological quality and health condition, this approach uncovers potential underlying degradation issues within ecosystems. (Boongaling et al., 2018; Ouyang et al., 2010; Zong et al., 2020). EFA thus offers a more precise and comprehensive assessment framework than traditional area-based metrics, thereby deepening understanding of forest-quality dynamics. Further research on how forest quality and structure should inform the weighting of ecosystem-service functions would provide a more rigorous scientific basis for improving ecosystem-service valuation and for formulating eco-compensation strategies and management policies.
Data availability statement
Publicly available datasets were analyzed in this study. This data can be found here: https://earthengine.google.com/.
Author contributions
ZL: Conceptualization, Data curation, Formal Analysis, Investigation, Methodology, Software, Supervision, Validation, Visualization, Writing – original draft, Writing – review and editing. BC: Conceptualization, Project administration, Resources, Supervision, Writing – review and editing. WW: Conceptualization, Supervision, Validation, Writing – review and editing.
Funding
The author(s) declare that financial support was received for the research and/or publication of this article. This work was supported by the National Natural Science Foundation of China (No. 42377186), and we are grateful to Danhui Su for the assistance provided to this study.
Conflict of interest
The authors declare that the research was conducted in the absence of any commercial or financial relationships that could be construed as a potential conflict of interest.
Generative AI statement
The author(s) declare that no Generative AI was used in the creation of this manuscript.
Any alternative text (alt text) provided alongside figures in this article has been generated by Frontiers with the support of artificial intelligence and reasonable efforts have been made to ensure accuracy, including review by the authors wherever possible. If you identify any issues, please contact us.
Publisher’s note
All claims expressed in this article are solely those of the authors and do not necessarily represent those of their affiliated organizations, or those of the publisher, the editors and the reviewers. Any product that may be evaluated in this article, or claim that may be made by its manufacturer, is not guaranteed or endorsed by the publisher.
References
Bai, Y., Chen, Y., Alatalo, J. M., Yang, Z., and Jiang, Bo (2020). Scale effects on the relationships between land characteristics and ecosystem services-a case study in taihu Lake basin, China. Sci. total Environ. 716, 137083. doi:10.1016/j.scitotenv.2020.137083
Barreiro-Lostres, F., Brown, E., Moreno, A., Morellón, M., Abbott, M., Hillman, A., et al. (2015). Sediment delivery and lake dynamics in a mediterranean mountain watershed: human-climate interactions during the last millennium (el tobar Lake record, iberian range, Spain). Sci. total Environ. 533, 506–519. doi:10.1016/j.scitotenv.2015.06.123
Bell, E. J. (1974). Markov analysis of land use Change—An application of stochastic processes to remotely sensed data. Socio-Economic Plan. Sci. 8 (6), 311–316. doi:10.1016/0038-0121(74)90034-2
Birhane, E., Negash, E., Getachew, T., Gebrewahed, H., Gidey, E., Gebremedhin, M. A., et al. (2024). Changes in total and per-capital ecosystem service value in response to land-use land-cover dynamics in north-central Ethiopia. Sci. Rep. 14 (1), 6540. doi:10.1038/s41598-024-57151-6
Boongaling, C. G. K., Faustino-Eslava, D. V., and Lansigan, F. P. (2018). Modeling land use change impacts on hydrology and the use of landscape metrics as tools for watershed management: the case of an ungauged catchment in the Philippines. Land use policy 72, 116–128. doi:10.1016/j.landusepol.2017.12.042
Börger, T., Böhnke-Henrichs, A., Hattam, C., Piwowarczyk, J., Schasfoort, F., and Austen, M. C. (2018). The role of interdisciplinary collaboration for stated preference methods to value marine environmental goods and ecosystem services. Estuar. Coast. Shelf Sci. 201, 140–151. doi:10.1016/j.ecss.2017.03.009
Cao, S. (2011). Impact of China's large-scale ecological restoration program on the environment and society in arid and semiarid areas of China: achievements, problems, synthesis, and applications. Crit. Rev. Environ. Sci. Technol. 41 (4), 317–335. doi:10.1080/10643380902800034
Chazdon, R. L., Broadbent, E. N., Rozendaal, D. M. A., Bongers, F., Almeyda Zambrano, A. M., Mitchell Aide, T., et al. (2016). Carbon sequestration potential of second-growth forest regeneration in the Latin American tropics. Sci. Adv. 2 (5), e1501639. doi:10.1126/sciadv.1501639
Costanza, R., d'Arge, R., De Groot, R., Farber, S., Grasso, M., Hannon, B., et al. (1997). The value of the world's ecosystem services and natural capital. nature 387 (6630), 253–260. doi:10.1038/387253a0
Costanza, R., De Groot, R., Sutton, P., Van der Ploeg, S., Anderson, S. J., Kubiszewski, I., et al. (2014). Changes in the global value of ecosystem services. Glob. Environ. change 26, 152–158. doi:10.1016/j.gloenvcha.2014.04.002
Crist, E. P. (1985). A TM tasseled cap equivalent transformation for reflectance factor data. Remote Sens. Environ. 17 (3), 301–306. doi:10.1016/0034-4257(85)90102-6
Daigneault, A., Baker, J. S., Guo, J., Lauri, P., Favero, A., Forsell, N., et al. (2022). How the future of the global forest sink depends on timber demand, forest management, and carbon policies. Glob. Environ. Change 76, 102582. doi:10.1016/j.gloenvcha.2022.102582
Deng, C., and Wu, C. (2012). BCI: a biophysical composition index for remote sensing of urban environments. Remote Sens. Environ. 127, 247–259. doi:10.1016/j.rse.2012.09.009
Descheemaeker, K., Nyssen, J., Poesen, J., Raes, D., Haile, M., Muys, B., et al. (2006). Runoff on slopes with restoring vegetation: a case study from the Tigray highlands, Ethiopia. J. hydrology 331 (1-2), 219–241. doi:10.1016/j.jhydrol.2006.05.015
Duro, D. C., Franklin, S. E., and Dubé, M. G. (2012). Multi-scale object-based image analysis and feature selection of multi-sensor Earth observation imagery using random forests. Int. J. Remote Sens. 33 (14), 4502–4526. doi:10.1080/01431161.2011.649864
Fan, H., Yu, Z., Yang, G., Liu, T. Y., Liu, T. Y., Hung, C. H., et al. (2019). How to cool hot-humid (asian) cities with urban trees? An optimal landscape size perspective. Agric. For. Meteorology 265, 338–348. doi:10.1016/j.agrformet.2018.11.027
Feng, Y., Schmid, B., Loreau, M., Forrester, D. I., Fei, S., Zhu, J., et al. (2022). Multispecies forest plantations outyield monocultures across a broad range of conditions. Science 376 (6595), 865–868. doi:10.1126/science.abm6363
Firozjaei, M. K., Alavipanah, S. K., Liu, H., Sedighi, A., Mijani, N., Kiavarz, M., et al. (2019). A PCA–OLS model for assessing the impact of surface biophysical parameters on land surface temperature variations. Remote Sens. 11 (18), 2094. doi:10.3390/rs11182094
Funk, J. M., Aguilar-Amuchastegui, N., Baldwin-Cantello, W., Busch, J., Chuvasov, E., Evans, T., et al. (2019). Securing the climate benefits of stable forests. Clim. Policy 19 (7), 845–860. doi:10.1080/14693062.2019.1598838
Galia, T., and Máčka, Z. (2023). Living woody vegetation as a storage element for large wood in the channel. Sci. Total Environ. 892, 164717. doi:10.1016/j.scitotenv.2023.164717
Gorelick, N., Hancher, M., Dixon, M., Ilyushchenko, S., Thau, D., and Moore, R. (2017). Google Earth engine: Planetary-scale geospatial analysis for everyone. Remote Sens. Environ. 202, 18–27. doi:10.1016/j.rse.2017.06.031
Grassi, G., House, Jo, Dentener, F., Federici, S., Elzen, M. den, and Penman, J. (2017). The key role of forests in meeting climate targets requires science for credible mitigation. Nat. Clim. Change 7 (3), 220–226. doi:10.1038/nclimate3227
Guerra, A., Reis, L. K., Borges, F. L. G., Ojeda, P. T. A., Pineda, D. A. M., Miranda, C. O., et al. (2020). Ecological restoration in Brazilian biomes: identifying advances and gaps. For. Ecol. Manag. 458, 117802. doi:10.1016/j.foreco.2019.117802
Houghton, R. A., and Nassikas, A. A. (2017). Global and regional fluxes of carbon from land use and land cover change 1850–2015. Glob. Biogeochem. Cycles 31 (3), 456–472. doi:10.1002/2016GB005546
Hu, X., and Xu, H. (2018). A new remote sensing index for assessing the spatial heterogeneity in urban ecological quality: a case from fuzhou city, China. Ecol. Indic. 89, 11–21. doi:10.1016/j.ecolind.2018.02.006
Hua, F., Adrian Bruijnzeel, L., Meli, P., Martin, P. A., Zhang, J., Nakagawa, S., et al. (2022). The biodiversity and ecosystem service contributions and trade-offs of forest restoration approaches. Science 376 (6595), 839–844. doi:10.1126/science.abl4649
Huete, A., Didan, K., Miura, T., Patricia Rodriguez, E., Gao, X., and Ferreira, L. G. (2002). Overview of the radiometric and biophysical performance of the MODIS vegetation indices. Remote Sens. Environ. 83 (1-2), 195–213. doi:10.1016/S0034-4257(02)00096-2
Jaleta, D., Mbilinyi, B. P., Mahoo, H. F., and Mulugeta, L. (2017). Effect of eucalyptus expansion on surface runoff in the central highlands of Ethiopia. Ecol. Process. 6, 1–8. doi:10.1186/s13717-017-0071-y
Jardim, A. M. da R. F., Júnior, G. do N. A., Silva, M. V. da, dos Santos, A., Silva, J. L. B. da, Pandorfi, H., et al. (2022). Using remote sensing to quantify the joint effects of climate and land use/land cover changes on the caatinga biome of northeast Brazilian. Remote Sens. 14 (8), 1911. doi:10.3390/rs14081911
Kaufman, Y. J., and Didier, T. (1992). Atmospherically resistant vegetation index (ARVI) for EOS-MODIS. IEEE Trans. Geoscience Remote Sens. 30 (2), 261–270. doi:10.1109/36.134076
Lang, N., Jetz, W., Schindler, K., and Jan, D. W. (2023). A high-resolution canopy height model of the Earth. Nat. Ecol. and Evol. 7 (11), 1778–1789. doi:10.1038/s41559-023-02206-6
Li, C., Zong, Z., Qie, H., Fang, Y., and Liu, Q. (2023). CiteSpace and bibliometric analysis of published research on forest ecosystem services for the period 2018–2022. Land 12 (4), 845. doi:10.3390/land12040845
Li, Z., Chang, J., Li, C., and Gu, S. (2023). Ecological restoration and protection of national land space in coal resource-based cities from the perspective of ecological security pattern: a case study in huaibei city, China. Land 12 (2), 442. doi:10.3390/land12020442
Li, X., Li, Y., Wang, H., Qin, S., Wang, X., Yang, H., et al. (2023). Ecological restoration evaluation of afforestation in gudao oilfield based on multi-source remote sensing data. Ecol. Eng. 197, 107107. doi:10.1016/j.ecoleng.2023.107107
Liu, H., and Li, J. (2010). The study of the ecological problems of eucalyptus plantation and sustainable development in maoming xiaoliang. J. Sustain. Dev. 3 (1), 197. doi:10.5539/jsd.v3n1p197
Liu, Y., Meng, Q., Zhang, L., and Wu, C. (2022). NDBSI: a normalized difference bare soil index for remote sensing to improve bare soil mapping accuracy in urban and rural areas. Catena 214, 106265. doi:10.1016/j.catena.2022.106265
Lu, C., Zhao, T., Shi, X., and Cao, S. (2018). Ecological restoration by afforestation May increase groundwater depth and create potentially large ecological and water opportunity costs in arid and semiarid China. J. Clean. Prod. 176, 1213–1222. doi:10.1016/j.jclepro.2016.03.046
Masoudi, M., and Tan, P. Y. (2019). Multi-year comparison of the effects of spatial pattern of urban green spaces on urban land surface temperature. Landsc. Urban Plan. 184, 44–58. doi:10.1016/j.landurbplan.2018.10.023
Maurice, K., Bourceret, A., Youssef, S., Boivin, S., Laurent-Webb, L., Damasio, C., et al. (2024). Anthropic disturbances impact the soil microbial network structure and stability to a greater extent than natural disturbances in an arid ecosystem. Sci. Total Environ. 907, 167969. doi:10.1016/j.scitotenv.2023.167969
McFeeters, S. K. (1996). The use of the normalized difference water index (NDWI) in the delineation of open water features. Int. J. remote Sens. 17 (7), 1425–1432. doi:10.1080/01431169608948714
Moges, D. M., Kmoch, A., Bhat, H. G., and Uuemaa, E. (2020). Future soil loss in highland Ethiopia under changing climate and land use. Reg. Environ. Change 20 (1), 32. doi:10.1007/s10113-020-01617-6
Obeng, E. A., Obiri, B. D., Oduro, K. A., Pentsil, S., Anglaaere, L. C., Foli, E. G., et al. (2020). Economic value of non-market ecosystem services derived from trees on cocoa farms. Curr. Res. Environ. Sustain. 2, 100019. doi:10.1016/j.crsust.2020.100019
Ouyang, W., Skidmore, A. K., Fanghua, H., and Wang, T. (2010). Soil erosion dynamics response to landscape pattern. Sci. Total Environ. 408 (6), 1358–1366. doi:10.1016/j.scitotenv.2009.10.062
Paz, L. E., Rodriguez, M., Gullo, B., and Rodrigues Capítulo, A. (2022). Impacts of urban and industrial pollution on functional traits of benthic macroinvertebrates: are some traits advantageous for survival? Sci. Total Environ. 807, 150650. doi:10.1016/j.scitotenv.2021.150650
Pinna, M. S., Bacchetta, G., Cogoni, D., and Fenu, G. (2019). Is vegetation an indicator for evaluating the impact of tourism on the conservation status of mediterranean coastal dunes? Sci. total Environ. 674, 255–263. doi:10.1016/j.scitotenv.2019.04.120
Popp, A., Calvin, K., Fujimori, S., Havlik, P., Humpenöder, F., Stehfest, E., et al. (2017). Land-use futures in the shared socio-economic pathways. Glob. Environ. Change 42, 331–345. doi:10.1016/j.gloenvcha.2016.10.002
Rikimaru, A., Roy, P. S., and Miyatake, S. (2002). Tropical forest cover density mapping. Trop. Ecol. 43 (1), 39–47.
Rouse, J. W., Haas, R. H., Schell, J. A., and Deering, D. W. (1974). Monitoring vegetation systems in the great plains with ERTS. NASA Spec. Publ. 351 (1), 309.
Shen, L., and Zeng, Q. (2022). Multiscenario simulation of land use and land cover in the zhundong mining area, Xinjiang, China. Ecol. Indic. 145, 109608. doi:10.1016/j.ecolind.2022.109608
Skakun, S., Franch, B., Vermote, E., Roger, J.-C., Becker-Reshef, I., Justice, C., et al. (2017). Early season large-area winter crop mapping using MODIS NDVI data, growing degree days information and a Gaussian mixture model. Remote Sens. Environ. 195, 244–258. doi:10.1016/j.rse.2017.04.026
Sun, Z., Feng, M., Zhang, X., Zhang, S., Zhang, W., Yang, Li, et al. (2022). A healthier water use strategy in primitive forests contributes to stronger water conservation capabilities compared with secondary forests. Sci. Total Environ. 851, 158290. doi:10.1016/j.scitotenv.2022.158290
Tang, Z. H., Zhang, H., Zhou, C. X., Zhang, H., and Zhou, J. W. (2013). “Risk assessment of geological environment and closure plan of heshan coal mine, southwest China,” in Mine closure 2013: proceedings of the eighth international seminar on mine closure (Perth, WA, Australia: Australian Centre for Geomechanics), 547–556. doi:10.36487/ACG_rep/1352_46_Tang
Tanner, M. K., Moity, N., Costa, M. T., Marin Jarrin, J. R., Aburto-Oropeza, O., and Salinas-de-León, P. (2019). Mangroves in the Galapagos: ecosystem services and their valuation. Ecol. Econ. 160, 12–24. doi:10.1016/j.ecolecon.2019.01.024
Tolessa, T., Senbeta, F., and Kidane, M. (2017). The impact of land use/land cover change on ecosystem services in the central highlands of Ethiopia. Ecosyst. Serv. 23, 47–54. doi:10.1016/j.ecoser.2016.11.010
Tucker, C. J. (1979). Red and photographic infrared linear combinations for monitoring vegetation. Remote Sens. Environ. 8 (2), 127–150. doi:10.1016/0034-4257(79)90013-0
van Lierop, P., Lindquist, E., Sathyapala, S., and Franceschini, G. (2015). Global forest area disturbance from fire, insect pests, diseases and severe weather events. For. Ecol. Manag. 352, 78–88. doi:10.1016/j.foreco.2015.06.010
Wang, L.-J., Ma, S., Zhao, Y.-G., and Zhang, J.-C. (2021). Ecological restoration projects did not increase the value of all ecosystem services in northeast China. For. Ecol. Manag. 495, 119340. doi:10.1016/j.foreco.2021.119340
Wang, X., Liu, G., Xiang, A., Xiao, S., Lin, D., Lin, Y., et al. (2023). Terrain gradient response of landscape ecological environment to land use and land cover change in the hilly watershed in south China. Ecol. Indic. 146, 109797. doi:10.1016/j.ecolind.2022.109797
Watson, J. E. M., Evans, T., Venter, O., Williams, B., Tulloch, A., Stewart, C., et al. (2018). The exceptional value of intact forest ecosystems. Nat. Ecol. and Evol. 2 (4), 599–610. doi:10.1038/s41559-018-0490-x
Xu, H. (2008). A new index for delineating built-up land features in satellite imagery. Int. J. remote Sens. 29 (14), 4269–4276. doi:10.1080/01431160802039957
Xu, H., Ding, F., and Wen, X. (2009). Urban expansion and heat island dynamics in the quanzhou region, China. IEEE J. Sel. Top. Appl. earth observations remote Sens. 2 (2), 74–79. doi:10.1109/JSTARS.2009.2023088
Yan, J., Zhu, Z., Zhou, J., Chu, X., Sui, H., Cui, B., et al. (2021). Saltmarsh resilience controlled by patch size and plant density of habitat-forming species that trap shells. Sci. Total Environ. 778, 146119. doi:10.1016/j.scitotenv.2021.146119
Zhang, Yu, Duan, M.-Ge, Huang, P.-H., Li, M., Meng, H.-Hu, Qiao, H.-J., et al. (2023). Perspective: blinded by the Bright—Afforestation is affecting widespread sampling deficiency in plant collections. For. Ecol. Manag. 530, 120765. doi:10.1016/j.foreco.2022.120765
Keywords: anthropic disturbances, ecosystem service values(ESV), remote sensing-based ecological index (RSEI), stable forest, effective forest area(EFA)
Citation: Luo Z, Chai B and Wang W (2025) An improved RSEI-based evaluation for effective forest area by integrating forest structure and quality. Front. Environ. Sci. 13:1580169. doi: 10.3389/fenvs.2025.1580169
Received: 20 February 2025; Accepted: 27 August 2025;
Published: 09 September 2025.
Edited by:
Vinicius Londe, Independent Researcher, Bothell, WA, United StatesReviewed by:
Zhongping Yang, Chongqing University, ChinaEskinder Gidey, University of the Witwatersrand, South Africa
Fangyuan Lu, University of Nanking, China
Copyright © 2025 Luo, Chai and Wang. This is an open-access article distributed under the terms of the Creative Commons Attribution License (CC BY). The use, distribution or reproduction in other forums is permitted, provided the original author(s) and the copyright owner(s) are credited and that the original publication in this journal is cited, in accordance with accepted academic practice. No use, distribution or reproduction is permitted which does not comply with these terms.
*Correspondence: Bo Chai, Y2hhaWJvQGN1Zy5lZHUuY24=