 Jin Xiang1
 Decai Tang
- 1School of Business, Jiangsu Open University, Nanjing, China
- 2School of Industry and Urban Construction, Hengxing University, Qingdao, China
- 3School of Management Science and Engineering, Nanjing University of Information Science and Technology, Nanjing, China
- 4Jiangsu Trendy Information Technology Co., Ltd., Nanjing, China
This paper focuses on the Yangtze River Economic Belt (YREB) in China as its research subject. It utilizes provincial data from 2005 to 2023, employing a regression analysis framework that incorporates green finance (GF) and environmental regulation (ER). Additionally, it explores these factors further using the panel threshold regression model and the spatial econometric model. The findings show that GF and ER apply a relatively significant positive influence on the advancement of the industrial structure but a significant inhibitory effect on the rationalization of industrial structure. Moreover, the impact on the upgrading of industrial structure is not significant, but it has a significant inhibitory effect on the rationalization of industrial structure when considering the interaction term of the two. The impact of GF and ER on industrial transformation exhibits a clear heterogeneity. As the intensity of ER grows, the promoting effect of GF on the upgrading of the industrial structure will weaken, while its inhibitory effect on the rationalization of the industrial structure will significantly increase. The impact of GF and ER on the optimization of industrial structures has a spatial spillover effect. Consequently, industrial transformation is influenced not only by the external constraints of ER but also by the indispensable financial support from GF. It is imperative for these two elements to collaborate synergistically. The study’s findings provide policy recommendations for optimizing the industrial structure of the YREB and lay the foundation for advancing the green industry and promoting sustainable economic development.
1 Introduction
China’s economic development has advanced remarkably in terms of pace and quality throughout the reform and opening-up era, and the industrial structure has also undergone major changes (Liu X. et al., 2021). However, due to the limitations of the development level of science and technology and the quality of the labor force in the country, the country’s economic growth is mainly driven by the development of the secondary industry, especially industry. Although the tertiary sector has gained momentum in recent years and has shown a strong driving force, the secondary industry, due to its substantial scale and outdated technology, has emitted a large number of pollutants in the process of development for decades, thus imposing a certain burden on the environment. The prevailing GDP-only development paradigm of local governments has resulted in a neglect of ecological and environmental preservation during the process of economic development, ultimately compromising the environment in exchange for subpar economic growth. As one of the foundations and central elements of economic progress, the industrial structure plays a pivotal role in determining the efficient utilization of production factors and resources, as well as the productivity of the economic system. Optimizing the industrial structure is the focus of economic reform (Ge et al., 2022) and a key strategy to promote the harmonious coexistence of the economy and the environment (Zhao C. et al., 2025). The optimization of industrial structure is a strategic choice that must be made to achieve regional sustainable development and has played a positive role in promoting China’s economy to shift from a rapid development model to green and high-quality development (Wang M.-l. et al., 2023). Therefore, promoting the optimization of the industrial structure is an inevitable requirement for China’s development.
With the continuous advancement of informatization and digitalization, GF has become an important engine for economic growth and innovation (Zhang G., 2023). GF refers to financial services provided to support economic activities such as environmental improvement, climate change, resource conservation, and efficient utilization. It is an organic combination of the green development concept and financial supply and is of great significance in promoting the transformation of the economic development mode, optimizing the economic development environment, and accelerating the construction of ecological civilization. In contrast to Western countries, China’s development of GF has adopted a government-led “top-down” model. As China approaches the peak of the environmental Kuznets curve, government intervention becomes crucial to expedite high-level design and improve institutional development. As of March 2023, the balance of local- and foreign-currency green loans from China’s major financial institutions exceeded RMB 22 trillion, accounting for approximately 10% of all loan balances. Additionally, the balance of green bonds has experienced substantial growth, exceeding RMB 2.5 trillion, exceeding RMB 2.5 trillion, establishing GF as a pivotal force supporting the optimization of industrial structures.
Furthermore, ER is also a key element for optimizing China’s industrial structure (Zhao K. et al., 2025). To accelerate the optimization of the industrial structure, governments of various countries have promulgated a series of policies and regulations, such as research and development subsidies, environmental regulations, and tax incentives. Among them, ER plays an important role in alleviating resource pressure, guiding society to fulfill environmental governance responsibilities, and promoting regional green transformation (Zhao Y. et al., 2025). The Chinese government has also continuously introduced environmental control policies (such as the “Yellow River Protection Law”, etc.) (Zhang et al., 2024) to promote the sustained and healthy adjustment of the industrial structure. As a demonstration zone for high-quality economic development and ecological civilization construction in China, the YREB has played a significant role in promoting the realization of the goals of “carbon peak” and “carbon neutrality”. The study of the industrial structure of the YREB provides important data support and policy innovation for the coordination and balance of cross-regional industrial structures. Therefore, studying the economic effects and mechanisms of GF and ER in the YREB on the optimization of industrial structure is of great reference significance for differentiated industrial structure upgrading policies.
This study focuses on the impacts of GF and ER on the optimization of industrial structure in the YREB, aiming to reveal the synergistic mechanism of the two types of policy tools and their regional suitability. By identifying the optimal policy combinations of each province, the study can promote the construction of a differentiated policy toolbox and help solve the contradiction between industrial transfer and ecological protection in the basin. In terms of national strategies, its experience can provide references for regions such as the Yellow River Basin and the Guangdong-Hong Kong-Macao Greater Bay Area, such as the design of cross-provincial eco-compensation mechanisms, and the path of digital integration of green financial instruments and industries. Globally, the findings of the study have a triple spillover value: firstly, it provides a model of “policy combinations” for emerging economies; for example, Southeast Asian countries can learn from the synergistic mechanism of green financial incentives and traditional industries’ exit, to avoid the trap of “polluting first and governing later”; secondly, it promotes the mutual recognition of international green financial standards and the mutual recognition of international green financial standards, and the mutual recognition of international green financial standards. The second is to promote the mutual recognition of international green financial standards and reduce the cost of cross-border green investment by analyzing the interface between China’s green bond certification system and the EU’s Sustainable Finance Classification Scheme; and the third is to provide insights for transnational governance in large river basins, for example, the Rhine River Basin can refer to the YREB’s pollution prevention and joint control mechanism, and design the rules of transnational eco-compensation. In addition, by verifying the non-linear effects of policy combinations on industrial upgrading, the study provides methodological support for policy design under global climate governance and helps the efficient implementation of the goals of the Paris Agreement.
The innovation of this paper lies in that, compared with the existing literature, this paper incorporates GF and ER into the analytical framework together, explores the impact of both on the optimization of industrial structure, and attempts to answer the following question: Can GF and ER effectively improve the distorted situation of factor allocation, alleviate the contradiction between economic development and environmental protection, and promote the optimization of regional industrial structure? To what extent can the coordinated effect of GF and ER provide guidance for the optimization of regional industrial structure? Does the impact of the two on the optimization of the industrial structure exist in terms of regional heterogeneity, threshold effect, and spatiality?
The paper is organized into the following sections. The second part is a literature review. The third part sorts out and analyzes the relevant policies and puts forward relevant hypotheses for the studied issues. The fourth part briefly explains and analyzes the data used in the empirical study and introduces the relevant models. The fifth part empirically examines the impact of GF and ER on the optimization of industrial structures. Finally, the sixth part provides a discussion of the findings, and the seventh draws conclusions while putting forth policy recommendations based on the empirical results.
2 Literature review
2.1 Green finance and industrial structure optimization
The rapid development of GF has had a profound impact on industrial structure. GF plays a key role in promoting industrial upgrading and reducing environmental pollution caused by regional differences (Agyekum et al., 2021; Wang and Wang, 2021; Zhang et al., 2021) and has a profound impact on environmental sustainability (Zakari and Khan, 2022). GF can promote the rational adjustment of the industrial structure by allocating green bonds, green credit funds, supporting environmental protection projects, etc. (Mohamad Nur et al., 2020), and facilitate the green development of an economy (Chen and Bian, 2023; Wang, 2023). The development of GF has significantly enhanced the level of green productivity, guided social funds to invest in environmentally friendly and clean industries, restricted the scale of industries with high energy consumption, high pollution, and overcapacity, and promoted economic decarbonization (Lee et al., 2023). The optimization of the industrial structure of high energy-consuming and high-polluting enterprises (Wang and Wang, 2021; Zhang M. et al., 2022) and its role in economically underdeveloped areas is significantly greater than that in economically developed countries (Liu, 2023). In provinces with better economic and social conditions, lower public participation in environmental protection, and higher pollution levels, the development of GF can effectively promote the level of green total factor productivity (Lee and Lee, 2022). This will balance labor productivity, improve the proportional relationship among industries, and optimize and enhance the efficient allocation and utilization of resources among industries. Some studies have also found that GF has a significant inhibitory effect on the rationalization of the industrial structure in adjacent regions, and it is believed that the negative effect is caused by the restrictions of local environmental policies on GF (Gao et al., 2022). Zhang and Dilanchiev (2022) hold that GF catalyzes the upgrading of the industrial structure, promotes the development of the efficient part of the economy, promotes technological innovation, and has a positive correlation with the efficiency of natural resources. It plays an important role in promoting the optimization of industrial structures.
2.2 Environmental regulations and industrial structure optimization
Environmental regulations have an important impact on the optimization of industrial structures (Zhu et al., 2024). Currently, three primary academic perspectives exist on the relationship between ER and ISO: the compensation cost theory, the innovation compensation theory, and the uncertainty view. According to the ‘compensation cost theory,’ as ER becomes stricter, businesses must allocate more resources to environmental protection. This can lead to highly polluting enterprises moving to areas with less ER, creating a ‘pollution shelter’ effect. However, this effect is detrimental to high-quality economic development and ISO (Song et al., 2022). In addition, ER exhibits regional variations, with obvious impacts on ISO in the eastern region but less significant effects on ISO in the central and western regions. In some cases, these regulations can even weaken the degree of rationalization in the local industrial structure (Liu et al., 2023). The “innovation compensation theory” posits that ER can force enterprises to engage in technological research and development by increasing the cost of environmental protection (Kong et al., 2025). The resulting innovation effects can compensate for the cost efficiency (Lin and Xie, 2023) and promote the rationalization of the industrial chain (Hu et al., 2021; Li Z. et al., 2023; Xie et al., 2023), exerting a significant positive impact on industrial structure upgrading in both resource-based and non-resource-based cities. Recognizing the importance of the time element, some scholars argue that environmental regulation (ER) can expedite interregional industrial transfer and industrial transformation in a short timeframe while optimizing the industrial structure overall over an extended period of time (He and Zheng, 2023). The Uncertainty Perspective argues that the influence of ER on ISO is contingent upon geographical location and the level of economic development (Muhammad et al., 2022). According to this perspective, the role of ER in promoting ISO is more pronounced in regions with favorable geography and those characterized by a higher level of economic development. “The Uncertainty Perspective” also suggests that different environmental policies play a significant role in influencing the ISO, with energy efficiency targets being effective in promoting low-carbon upgrading, both by fostering low-carbon innovations and guiding the restructuring of high-carbon industries; however, it notes that sewage charges may inhibit low-carbon upgrading (Li K. et al., 2023; Wang F. et al., 2021). Additionally, the relationship between ER and green total factor energy efficiency exhibits a non-linear pattern, which depends on various environmental decentralization conditions and the degree of such decentralization (Wu et al., 2020).
2.3 The role of green finance and environmental regulation in industrial structure optimization
Green finance and environmental regulations can jointly influence industrial structure (Gu et al., 2021; Zhao et al., 2022). Some studies argue that ER can force enterprises to increase R&D costs for new equipment and technologies, reduce their efficiency, and cause some enterprises to scale down or even exit the market (Jiakui et al., 2023; Liu Y. et al., 2021), thus moderating the impact of GF on industrial structure. Other studies suggest that ER can promote pollution control, encouraging high-pollution industries to implement environmental protection and emission reduction measures. This will improve the environmental access criteria for green credit and green bonds, or restrict the negative externalities of polluting industries, regulating their environmental behavior, and promoting industrial green transformation (Xu and Dong, 2023). However, some research also argues that under different ERs, the impact of GF on industrial structure may vary. Command-and-control ER, which strictly controls the financing of high-energy consumption, high-pollution, and overcapacity industries, can limit industrial access to green financial products such as green credit, hindering the transformation and upgrading of traditional industries (Zhao et al., 2024). In contrast, incentive-based and voluntary ER can guide funds towards green emerging industries with low input, low pollution, and high output, optimizing the allocation of credit resources (Razzaq and Yang, 2023) and enhancing the role of GF in ISO and upgrading (Jian and Afshan, 2023).
2.4 Summary
At present, research on the measurement of green finance, environmental regulation, and industrial structure optimization is still somewhat comprehensive, but there are still controversies in terms of indicator selection. Additionally, research on GF mainly focuses on corporate financing (Fu, 2024; Yu et al., 2021; Zhang T., 2023) and green technological innovation (Jiang et al., 2022; Zeng et al., 2023), while studies on ER are primarily centered on environmental governance (He et al., 2025; Liu et al., 2025) and green innovation (Li et al., 2025; Lu et al., 2025). Research on the relationship between GF, ER, and ISO is often limited to two variables at a time, with a lack of studies on the interactions between all three variables. Whether these interactions exhibit threshold effects and spatial effects is still unclear. Therefore, this paper selects panel data from the YREB from 2005 to 2023 as the research subject and integrates GF and ER into the analytical framework. The study uses the double-difference model, threshold effect model, and spatial econometric model to explore the impact of both on ISO.
3 Policy background and assumptions
The theory of externalities and the theory of public goods provide the basic support for the necessity of ER: the negative externality generated by economic activities and the public attributes of ecological resources lead to market failure, and environmental costs need to be internalized through environmental protection taxes, emission standards, and other regulatory means, while GF guides capital to fill in the gap in the supply of public environmental products through a market-based mechanism. Secondly, Porter’s hypothesis and industrial upgrading theory focus on the impact of policy on the behavior of micro-objects, the former reveals how ER pushes enterprises to technological innovation, and the latter analyzes the intrinsic motivation of upgrading the industrial structure from high-carbon to greening, which jointly point to the driving logic of “constraints - incentives” policy combinations on industrial transformation.
With the concept of sustainable development gaining importance, countries worldwide have begun to focus on achieving low-carbon, green development, and growing demand for industrial transformation. In China, a developing country with a huge industrial sector, the financial system has lagged behind. In response, the Chinese government has placed great emphasis on industrial structure adjustment and environmental governance. In 2005, the National Development and Reform Commission introduced the “Industrial Structure Adjustment Guidance Catalogue (2005 version),” which, for the first time, clearly categorized industries into encouraged, restricted, and eliminated categories. This aimed to guide social investment towards sectors aligned with national development strategies, thereby promoting macroeconomic control and optimizing industrial structure. Subsequently, the catalogue was revised in 2011 and 2013, playing a key role in guiding industrial upgrading, restricting high-pollution industries, and promoting the development of clean energy. This institutional arrangement reflects a policy orientation that organically combines ER with resource allocation mechanisms—namely, the “constraint-incentive” policy combination, which constrains backward production capacity through policy signals and incentivizes the development of green industries.
As China’s economy steadily advances toward a stage of high-quality development, it faces dual pressures from resource and environmental constraints as well as the middle-income trap. Since 2015, China has, for the first time, explicitly proposed the establishment of a GF system to support industrial transformation. The country has continuously explored and refined this system, including the formation of a GF Study Group during the G20 Summit. In 2018, China introduced a sustainable finance development initiative centered on GF. In 2019, the government updated and released the “Industrial Structure Adjustment Guidance Catalogue (2019 edition)”, identifying greenness, safety, innovation, and efficiency as key evaluation criteria for industrial policy, further strengthening the institutional foundation of green-oriented industrial policies. This update closely aligns with the internal mechanism of Porter’s Hypothesis, which emphasizes that a “well-designed ER” can stimulate technological innovation, and it also corresponds to the theoretical logic in industrial upgrading theory that highlights green transformation as a core driving force. As regulatory tools and environmental governance methods have gradually improved, the strength and enforcement of such policies have shown significant variation across regions and industries. This variation in regulatory intensity serves as an important “threshold variable” for the effectiveness of GF policies. When ER is at a moderate level (such as the indicative standards in the “encouraged” category of the 2019 Catalogue), its primary function is to clarify policy expectations and the direction of transformation. At this stage, compliance costs remain within a bearable range for enterprises. GF, by providing access to capital, significantly lowers financial barriers for firms to adopt clean technologies or develop green products. This, in turn, stimulates innovation-driven compensation, promotes the upgrading of the industrial structure, and guides the gradual green transformation of traditional industries rather than forcing their immediate exit, thereby minimizing the disruption to industrial rationalization. In contrast, high-intensity ER (such as the rigid provisions in the “eliminated” category or the stringent “ultra-low emission” standards in the 2019 Catalogue) imposes significant mandatory expenditures on traditional industries. In this context, GF funds are often diverted to meet basic compliance costs essential for survival rather than being used for proactive innovation or high-end capacity expansion that would genuinely enhance competitiveness and value—i.e., industrial upgrading. Consequently, the positive effect of GF on upgrading is weakened under high regulatory pressure. Furthermore, strong regulations force traditional industries to downsize non-core operations and focus narrowly on green transition, which can lead to insufficient rationalization in the short term. Some firms unable to bear the environmental costs may exit the market, resulting in partial supply chain disruption and suppressing the process of industrial structure rationalization.
In addition, the YREB, which spans eastern, central, and western China, includes provinces with vastly different levels of development. As a result, the effects of GF and ER on ISO vary across regions. Moreover, the evolution of industrial structure is not only influenced by local policies and market conditions but also affected by spillover effects from neighboring regions’ policy environments, financial resource allocation, and environmental regulatory intensity. These spillover effects—transmitted through supply chains, technology diffusion, and other mechanisms—can influence the adjustment of industrial structures in adjacent regions.
Combining the above literature and policies, the following hypotheses are proposed:
H1: Green finance and environmental regulations can have an impact on the optimization of industrial structures. Specifically, green finance and environmental regulations can promote the advanced level of industrial structure and curb the rationalization of industrial structure.
H2: There is heterogeneity in the impact of green finance and environmental regulation on industrial structure.
H3: With environmental regulation as the threshold variable, green finance has a threshold effect on industrial structure.
H4: The impact of green finance and environmental regulations on the optimization of industrial structures has a spatial effect.
4 Research design
4.1 Study area and data sources
The Yangtze River Economic Belt includes 11 provinces and municipalities (Upstream: Chongqing, Sichuan, Guizhou, and Yunnan; Midstream: Jiangxi, Hubei, and Hunan; Downstream: Shanghai, Jiangsu, Zhejiang, and Anhui). It spans across China’s eastern, central, and western regions, carrying over 40% of the national population and economic total. It is one of the key “three major strategies” implemented by the central government (Yuan et al., 2023a). The YREB is a globally influential inland economic zone and a coordination and development area for the interaction and cooperation between the eastern, central, and western regions. It serves as a model zone for China’s high-quality economic development and ecological civilization construction (Yuan et al., 2023b). Studying the industrial structure of the Yangtze River Economic Belt provides essential data support and policy innovation for the coordination and balance of cross-regional industrial structures. It holds significant reference value for differentiated industrial structure upgrading policies. Therefore, this paper takes the YREB as the study area (see Figure 1).
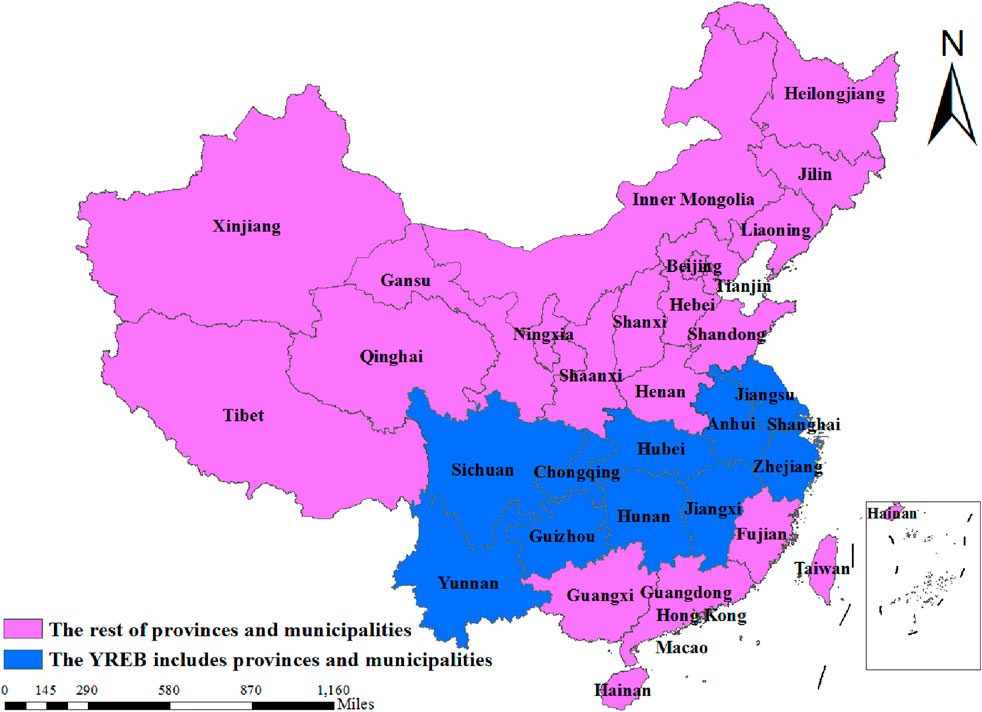
Figure 1. The Yangtze river economic belt.
The year 2005 marks the starting point for the gradual improvement of China’s sustainable development policy framework. From this year onward, the concept of green development began to transition from theory to practice. The government initiated the institutionalization and normalization of energy conservation, emission reduction, and environmental protection policies, laying the groundwork for the implementation of GF and ER. Notably, 2005 also marks the beginning of the 11th Five-Year Plan, which, for the first time, included a binding target for reducing energy consumption per unit of GDP. This signified the preliminary incorporation of ER into the economic management system and explicitly proposed the construction of a resource-conserving and environmentally friendly society, thus providing a strong policy foundation for research on green development.
Given that the most recent data available from the National Bureau of Statistics, provincial and municipal statistical yearbooks, and other official sources is updated only through 2023, this study selects panel data from 2005 to 2023 for 11 provinces and municipalities along the YREB for empirical analysis. The data of green insurance is sourced from the China Insurance Statistical Yearbook. Green securities are sourced from the choice database, and green credit data are sourced from the China Industrial Statistical Yearbook. The original data of other variables are derived from the National Bureau of Statistics, China Environmental Statistical Yearbook, statistical yearbooks of various provinces and cities over the years, the CSMAR database, and the EPS database. The missing values are filled by linear interpolation to ensure the integrity of the data.
4.2 Variables
4.2.1 Explained variable: Industrial structure optimization (ISO)
Effective promotion of local economic development can be achieved by adjusting the type, quantity, intensity, and combination of industrial structure development. The current development trend of the world’s industrial structure is mainly manifested in the industrialization of high and new technologies, making the information industry the pillar industry, and the automation of the labor structure. In alignment with global development trends, China has formulated various plans for industrial structure adjustment and other related issues. It has and has progressively promoted the ISO in the development of the three industries, and the pace of adjustment has evolved from “one, two, three” to “two, one, three”, and further to “two, three, one”, and then to “three, two, one”. The pace of adjustment is basically from “one, two, three” to “two, one, three” and then to the structural transformation of “two, three, one” and “three, two, one”, i.e., the structural transformation indicates a shit from the primary industry as the mainstay to the secondary industry as the mainstay and finally to the tertiary industry as the mainstay. This is the fundamental principle of industrial development and the inevitable trend of human society. Within the context of international competition, industrial upgrading is manifested in the ongoing improvement of international competitiveness, especially in the medium- and high-technology manufacturing industries, which can be upgraded only if international competitiveness is continuously improved.
4.2.1.1 Rationalization of industrial structure (RIS)
For a considerable duration, China’s industrial structure has exhibited a state of imbalance, and the gradual adjustment has gradually transformed it from rationalization to advancement. If the industrial structure is imbalance for an extended time and the development is not rational, even if it advances, it remains a form of “false advancement”. Rationalization and advancement serve as the two major pillars for the development of industrial structure. Hence, the industrial structure should encompass the dimensions of rationalization and advancement. In this paper, we refer to Wang (Wang S. et al., 2023) to construct the industrial structure rationalization using the following formula:
Where:
4.2.1.2 Upgrading of industrial structure (UIS)
Under the precondition of RIS, the gradual upgrading of industrial structure from primary industry to tertiary industry, i.e., the advanced level, is also the focus of research. This paper expresses UIS as the logarithm of the sum of the product of each industry’s proportion in the regional GDP and its labor productivity, as soon in the following Equation 2:
Where:
4.2.2 Explanatory variables
4.2.2.1 Green finance (GF)
Green finance restricts the promotion of polluting activities and fosters the development of environmentally friendly projects by creating a diverse green financial instrument. This ultimately leads to the ISO. Following Yi et al. (2023) and Yu et al. (2023), this study evaluates the green financial environment from the perspectives of green credit, green securities, green insurance, carbon finance, and green investment, using the entropy method to construct a composite index. As an objective weighting technique, the entropy method effectively reflects the informational differences and contribution levels of various indicators, ensuring the scientific rigor and fairness of the evaluation. A higher composite score indicates more efficient green financial resource allocation, clearer environmental orientation, and a more rational development path in a given region. (1) Green credit is measured by the interest proportion of high energy-consuming industries (Zhang Z. et al., 2023), which can intuitively reflect the financial support of financial institutions for green projects and the credit policy orientation for high energy-consuming industries. The low proportion of loan interest obtained by high energy-consuming industries indicates that more funds flow into green and low-carbon fields, which is conducive to promoting the green transformation of industries and reflects the financial support orientation for green development. (2) For green securities, we use the market value of high energy-consuming companies to reflect the financial support effect of the capital market on high energy-consuming companies. The changes in the market value of high energy-consuming companies reflect the recognition of the capital market towards them. The lower the market value, the more the capital market leans towards green industries and guides resources to be allocated to them. (3) Environmental liability insurance for Chinese enterprises has been implemented since 2013, but there is a lack of long-term data. Agriculture is closely related to the natural environment. Therefore, we measure green insurance by the scale of agricultural insurance. The development level of agricultural insurance can indirectly reflect the green insurance market’s maturity and thereby reflect GF’s coverage and support capacity for environmental risk management. (4) For the green investment environment, investment in environmental pollution control was selected. It can directly reflect the investment intensity of the government and social capital in environmental governance. An increase in investment is conducive to optimizing the green investment environment, attracting investment in green industries, and promoting the development of GF. (5) Carbon finance reflects the development level of the carbon trading market and is measured by the ratio of carbon emissions to GDP in each region. The ratio of high carbon emissions to low GDP may indicate that the implementation effect of GF policies in this region is poor, while the lower ratio may suggest that the carbon trading market plays a role in promoting emission reduction and that this region has achieved a relatively efficient green transformation.
The calculation process of the entropy method is as follows:
Firstly, since the dimensions of the data of each indicator are different, they cannot be comprehensively compared, so standardization processing is carried out.
Among them, Equations 4, 5 respectively standardize the positive and negative indicators.
Since zero values may occur after standardization, the following Equation 6 is carried out on the standardized data to avoid zero values:
The entropy value of the kth indicator is expressed as Equation 8:
The information entropy redundancy of the kth indicator is measured by Equation 9:
The weight value of the k-th indicator is defined by Equation 10:
Finally, the composite measure of GF score in the jth province in the year i is obtained through Equation 11:
The weights of each indicator of GF calculated through the above process are shown in Table 1.
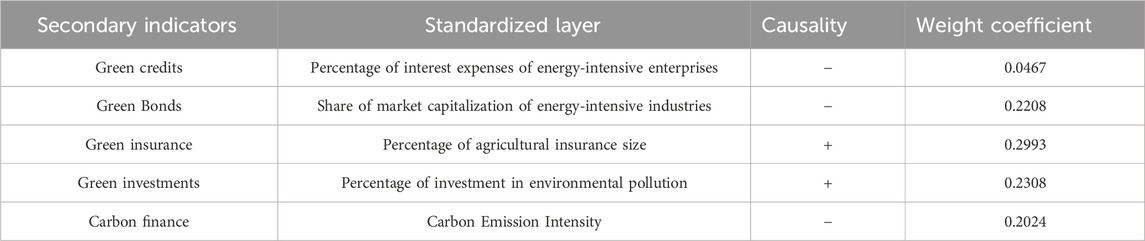
Table 1. Green finance.
Combined with Figure 2, the overall development of green finance in YREB shows a gradual upward trend, with the index generally fluctuating around 0.4 in each province. On the whole, GF is higher in the downstream regions, followed by the midstream regions, and trailing in the upstream regions. Currently, the downstream provinces and cities, notably Shanghai, are economically well-developed and possess relatively active financial markets. Consequently, they have attracted a substantial number of green financial institutions, created a novel system for evaluating and assessing green loans, and continued to support the development and expansion of GF. In contrast, the geographical constraints on the upstream areas do not increase the level of GF, which illustrates the high downstream and low upstream characteristics of regionalization.
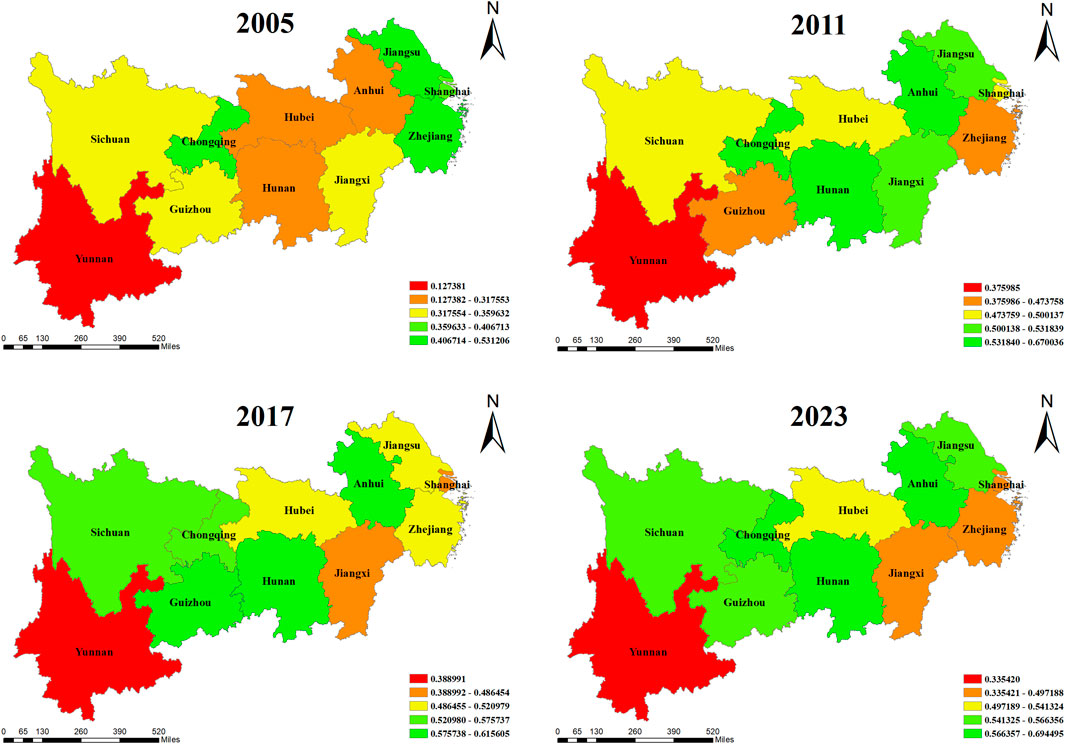
Figure 2. Green finance. Note: The values in the lower right corner of each picture are the GF values measured by the entropy method.
4.2.2.2 Environmental regulation (ER)
In terms of measuring methods of environmental regulation, they can currently be divided into the following four categories. First, the single index method; it includes environmental governance inputs, environmental policy performance indicators, and environmental regulatory regulations, measured by a single index (Li and Lin, 2022). Second, the comprehensive index method: it starts by creating the comprehensive index based on pollution emissions, such as identifying five distinct indicators, the rate at which industrial soot is removed or sulfur dioxide is removed, and creating a comprehensive index to represent the ER in a given area (Wang T. et al., 2021). Secondly, the comprehensive index is based on multiple perspectives, such as the environmental performance index through the index system’s creation, and finally gives a comprehensive index reflecting the environmental protection and sustainable development of each country. Thirdly, the classification examination method entails measurement based on the perspectives of different ER tools and different ER subjects, such as classifying ER into three categories of command-and-control, market incentive, and voluntary, and analyzing the impacts on the efficiency of energy conservation and emission reduction (Zhang Y. et al., 2022). Therefore, this paper takes into account not only the impact of industrial production and other environmental consequences but also the impact of life on the environment and considers ER in a comprehensive manner. This paper uses the ratio of the emissions of the three wastes to the added value of the secondary industry, the comprehensive rate of industrial solid waste, and the harmless treatment rate of domestic waste, and employs the entropy weight method to measure the intensity and effect of ER (Table 2). This indicator system can reflect the implementation effect, supervision intensity, and actual impact on pollution control of government ER from multiple dimensions and has strong representativeness and explanatory power. The higher the score of this comprehensive index is, the stricter the government’s regulation of the environment will be. Among them, the discharge volume of the three wastes reflects the degree of environmental pollution caused by each unit of industrial output. The ratio of it to the added value of the secondary industry can eliminate the interference of industrial scale expansion and directly reflect the “hard constraints” of ER on industrial pollution. A lower ratio usually indicates that the regional environmental protection standards are higher and, the ER are stricter, and enterprises have taken necessary pollution control and clean production measures in the production process. The comprehensive utilization rate of industrial solid waste is an important indicator for measuring the implementation effect of ER on resource reuse, clean production, and circular economic policies. The high utilization rate indicates that local governments attach great importance to the treatment of industrial solid waste, with sound policy guidance and supervision mechanisms, effectively promoting green production methods and pollution reduction. The harmless treatment rate of domestic waste reflects the public governance efficiency of local governments in ER. The higher this proportion is, the more complete the environmental governance system is and the more effective the regulatory measures are.
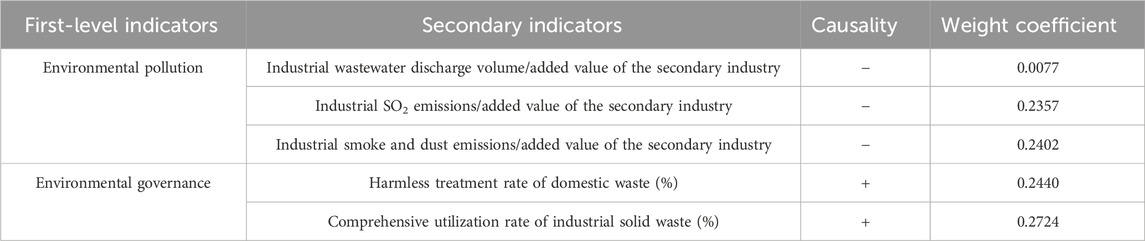
Table 2. Evaluation system of environmental regulation indicators.
It can be observed from Figure 3 that the ER in the YREB shows regional differentiation characteristics. The overall intensity of ER in the upper reaches of provinces and cities is relatively low, followed by the middle reaches, and the intensity of ER in the lower reaches is the highest. This is because the upstream regions, such as Yunnan, are resource-based areas, but their economic development levels are relatively low. When local governments balance development and environmental protection, they tend to prioritize economic growth, resulting in limited environmental protection investment and relatively lenient regulatory measures. The economic foundation of the midstream region has improved to some extent, but it is still dominated by traditional manufacturing and heavy industry, and the pressure on environmental protection is gradually increasing. In downstream regions such as Shanghai, the economy is developed, the proportion of the service industry is high, the degree of ISO is high, and at the same time, environmental awareness and public participation are strong. They have a more complete environmental governance system and stronger policy implementation ability. Therefore, the intensity of ER is significantly higher than that in the middle and upper reaches.
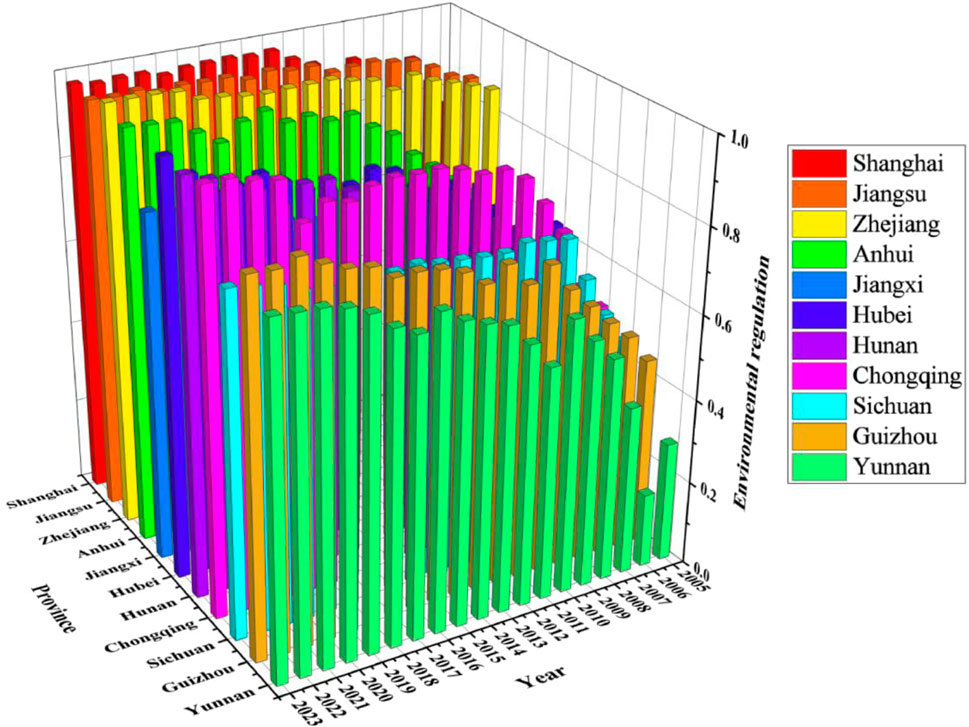
Figure 3. Environment regulation.
4.2.3 Control variables
(a) High-tech talent level (HTL) is crucial in improving the quality of the labor force; it involves the cultivation and introduction of high-skilled and quality talents, which adds to technological innovation and meets the needs of industrial upgrading. This is expressed using the ratio of the number of college students in school to the total population of the region at the end of the year. (b) The level of urbanization (UL) plays a significant role in reallocating social resources, improving the urban environment, and promoting industrial upgrading (Huang et al., 2021). In this paper, it is expressed as a percentage of the urban population. (c) Government support intensity (GOV) is related to the correlation between government behavior and polluting industries (Zhou et al., 2023). This paper adopts the ratio of the local government’s budgeted fiscal expenditure to regional GDP to represent the marketisation level of the region. (d) R&D investment intensity (IRD), this paper uses the ratio of R&D expenditure to local GDP.
4.3 Model setting
4.3.1 Basic model setting
The basic model of the study is as follows:
Where:
4.3.2 Panel threshold modelling
As the impact of GF and ER on regional industrial transformation is multidimensional, its impact may be characterized differently with the development of GF and the intensity of ER being in different intervals, followed by a nonlinear relationship. The panel threshold regression model (Equation 16) is utilized to test for the existence of nonlinear relationships between the variables.
On the basis of the one-threshold model, the feasibility of having multiple thresholds in the model also needs to be considered, so a two-threshold model is also set up in Equation 17:
Where 1 (·) represents the schematic function, which takes the value of 0 when the expression in the parentheses is false, and vice versa takes the value of 1.
4.3.3 Spatial model setting
The difference between the spatial econometric model and the traditional econometric model is that the spatial connections among individuals are considered in the model. Traditional measurement models hold that individuals are independent of each other, but in real life, it should be recognized that there are connections among individuals. The commonly used spatial econometric models include the Spatial autoregressive Model (SAR), the Spatial Error Model (SEM), and the Spatial Durbin Model (SDM), with their respective formulas given by Equations 18–21. The SAR is usually used to study the influence of spatial dependence, which can be reflected by introducing the spatial autoregressive term. The core idea of the SEM is that the error term of each region is affected by the error terms of the surrounding regions. SDM takes into account both spatial autoregression and spatial error. It is a combination of SAR and SEM models and considers the influence of the explained variable and the lag term of the explained variable on the explained variable at the same time.
Spatial autoregressive model:
Spatial Error Model:
Spatial Durbin Model:
Among them,
The 0–1 adjacency matrix focuses on whether different provinces are adjacent and their adjacency relationship. It is a commonly used matrix for analyzing spatial effects and its calculation method is given by Equation 22:
5 Empirical results and analysis
5.1 Descriptive statistics and correlation test
Table 3 presents the descriptive statistical results of the main variables. It can be found that the average value of UIS is −0.1370, the minimum value is −1.3976, the maximum value is 0.8841, and the standard deviation is 0.5605. The average value of RIS is 14.5238, the minimum value is 1.2706, the maximum value is 133.6572, and the standard deviation is 21.8085, indicating that there is still room for improvement in the optimization level of industrial structure in various provinces and cities of the YREB and the development is unbalanced. Tables 4 and 5 show the correlations among various variables. It can be found that, on the whole, there are rich and significant correlations among the variables, and the next step of regression analysis can be carried out.
Table 3. Descriptive statistics.

Table 4. Correlation Test-UIS.
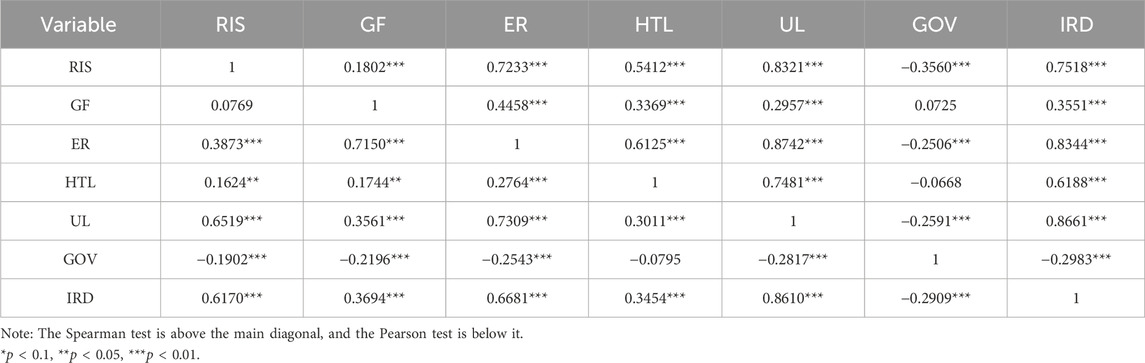
Table 5. Correlation Test-RIS.
5.2 Panel regression analysis
Based on previous studies, this paper adds the interaction term of GF and ER to explore the synergy effect of GF and ER on the optimization of industrial structure.
The Hausman test shows the concomitant probability of 0.0000, leading to the use of the “fixed effect model (FE).” Concerning the UIS (Table 6), Columns (1) and (2) reveal that GF and ER promote the UIS and play a significant role, indicating that both GF and ER directly influence the ISO of the YREB, thereby validating Hypothesis 1. This is because green finance provides financial support and capital guidance for industries such as environmental protection, low carbon, and high-tech sectors, which gradually leads to the exit of traditional high-pollution, high-energy-consuming industries from the market. Meanwhile, clean energy, new energy, and high-tech content industries continuously expand their market share. This helps improve the quality and level of the economic structure and promotes industrial upgrading. ER forces enterprises to innovate technologies, optimize production processes, and eliminate backward production capacity by increasing the cost of pollution, thereby promoting the upgrading of the industrial structure. In terms of the control variables, the existence of high-tech talents and the improvement of urbanization levels also have a significant promoting effect on the upgrading of the industrial structure. This is because high-tech talents bring innovative vitality, knowledge, and technology, which prompts the industries in the YREB to gradually shift from labor-intensive to technology-intensive and promotes the industrial structure to develop towards a higher level. With the advancement of urbanization, the agglomeration effect of resources such as labor and capital has been further enhanced, which is conducive to improving production efficiency and promoting infrastructure construction and the development of the service industry.
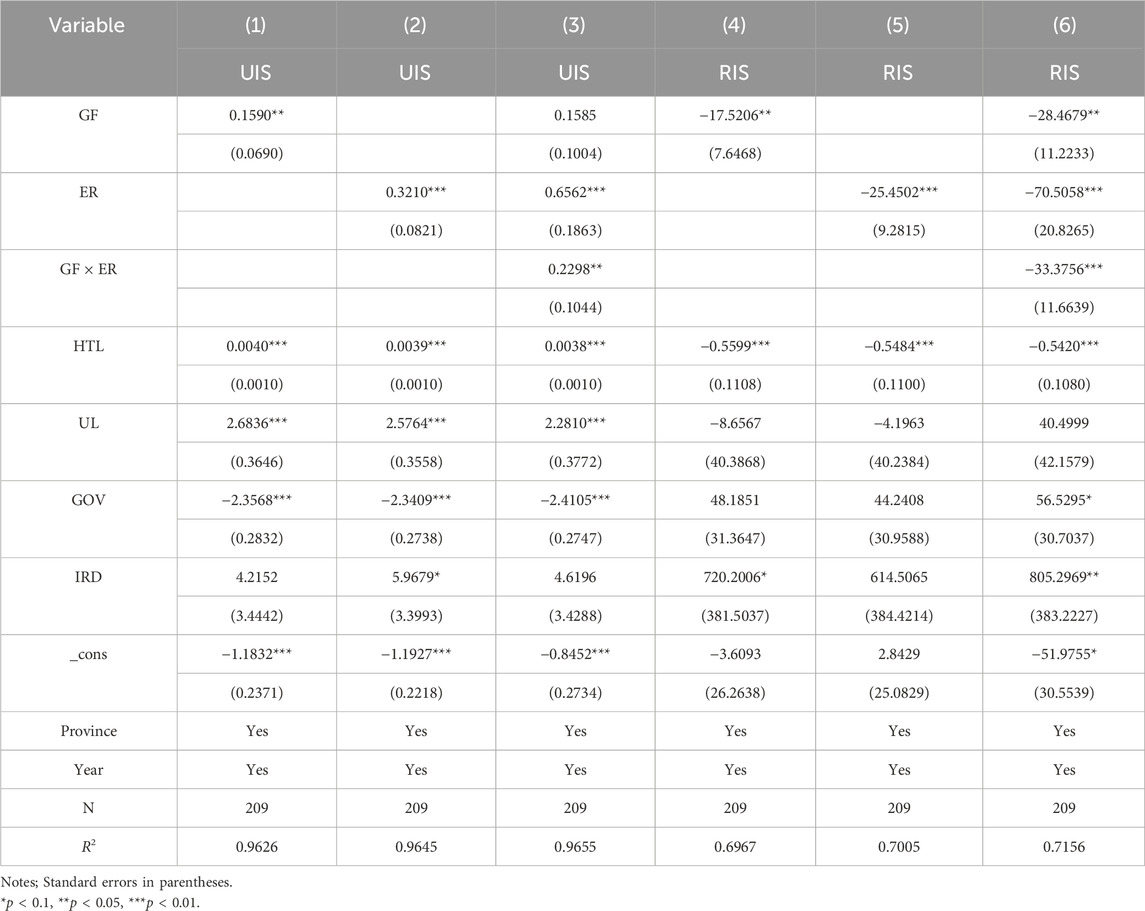
Table 6. Panel regression results.
Regarding the RIS, Columns (4) and (5) show that GF and ER have a significant inhibitory effect on the rationalization of the industrial structure. This might be because the imposition of GF and ER may lead to the exit or transformation of certain industries, thereby having a certain impact on the balanced layout of the industrial structure and the rational allocation of resources. GF, through capital guidance, invests more funds in clean industries, which may lead to excessive concentration of funds in certain green industries, accelerate the elimination of traditional high-pollution industries, cause the proportion of some industries to decline rapidly, and affect the rationality of the industrial structure in the short term. ER requires enterprises to invest a large amount of funds in the treatment of “three wastes” projects, which leads to the exit of some enterprises or overcapacity, accelerating the elimination of high energy-consuming traditional industries. However, emerging green industries have not yet formed a scale substitution, resulting in a gap in the supply and demand connection among industries and affecting the rationality and stability of the industrial structure.
It is worth noting that after incorporating the interaction term of GF and ER, the effects of GF and ER on the UIS are still positive, but at this time, the role played by GF is not significant. This phenomenon indicates that although GF can independently promote the upgrading of the industrial structure, the interaction with ER may lead to the weakening of the effectiveness of GF. It might be that there is a certain degree of functional overlap or conflict in the collaborative process between the two. The strong constraints of ER may make enterprises, when facing the dual pressure of policies, more inclined to solve compliance issues in the short term rather than long-term industrial upgrading. Therefore, the role of GF may not have been fully exerted. Meanwhile, both have a significant synergistic inhibitory effect on the rationalization of the industrial structure. This might be because the mandatory capacity reduction by ER resonates with the selective industrial support of GF, further compressing the survival space of traditional industries and amplifying the development gap among industries in the short term. There is a lack of effective coordination between the two during the implementation process. GF is committed to promoting the rapid development of high-tech industries, while ER focuses on restricting the existence of polluting enterprises. The policy effects of the two may make it difficult to achieve good coordination in the short term. Instead, it will exacerbate the imbalance and irrationalization of the industrial structure.
5.3 Robust test
5.3.1 Replacement of explanatory variables ER
In the previous paper, a comprehensive environmental regulation (ER) indicator was constructed, incorporating factors such as three-waste emissions. To ensure the robustness of the empirical results, this paper constructs a new ER indicator, ER1, based on the ratio of industrial smoke and dust emissions to the added value of the secondary industry in the region. This indicator is a negative one. The regression results are shown in Table 7. ER has a positive promoting effect on UIS and an inhibitory effect on RIS, indicating that ER has an important influence on OIS. GF has a significant promoting effect on UIS and a significant inhibitory effect on RIS. The synergy between GF and ER will also weaken the promoting effect of GF on RIS and significantly inhibit the rational development of the industrial structure. Consistent with the conclusion of the previous text, it verifies the robustness of the conclusion of this paper.

Table 7. Robustness test 1.
5.3.2 The explanatory variables lag by one period
Furthermore, to test the stability of the empirical results, this paper analyzes the explanatory variables with a lag of one period. The regression results are shown in Table 8. It can be observed that the significance of GF, ER, and their interaction terms is the same as that of the benchmark regression results. Both GF and ER can effectively promote the upgrading of the industrial structure. The synergy between the two will reduce the promoting effect of GF. GF and ER will significantly inhibit the rational development of the industrial structure, and the synergy between the two will exacerbate this phenomenon. Consistent with the previous conclusion, the empirical results are stable.

Table 8. Robustness test 2.
5.4 Heterogeneity analysis
The YREB runs across the east and west, with the Sichuan Basin in the upper reaches, the Three Gorges in Hubei moving to extend to the eastern coastline, and the distribution of China’s largest lower and middle Yangtze River coastal belt plain, with a vast hinterland, abundant resources, and diverse ecological and environmental problems. Based on this, this paper conducts an analysis of resource heterogeneity and regional heterogeneity. Resource heterogeneity divides the YREB into resource-based regions and non-resource-based regions (Zhang H. et al., 2023). The resource-based regions include Sichuan, Guizhou, and Yunnan. The other provinces are regarded as non-resource-based regions. Regional heterogeneity divides the YREB into the upper reaches, middle reaches, and lower reaches (Tang et al., 2024). The upstream includes four provinces and municipalities: Chongqing, Sichuan, Guizhou, and Yunnan. The midstream includes Jiangxi, Hubei, and Hunan. The downstream includes Shanghai, Jiangsu, Zhejiang, and Anhui.
5.4.1 Resource heterogeneity
From Table 9, it is evident that the role of GF policies is constrained in resource-based regions; GF has a beneficial impact on the advancement of RIS and UIS, although this effect is not statistically significant, indicating that GF, by guiding capital to clean industries, in the short term, it is conducive to the transformation of industry in this type of region. ER has a positive promoting effect on the rationalization of the industrial structure, but the effect is not significant. Meanwhile, it also has a negative effect on the upgrading of the industrial structure. The synergistic effect of the two has an equally insignificant promoting effect on the optimization of the industrial structure. This might be due to the fact that the economy of resource-based regions has long relied on resource development, and the industrial structure is highly dependent on resource-based industries, featuring path dependence and rigidity. Against this background, ER can promote the transformation of traditional, highly polluting industries to a certain extent (He and Zheng, 2023; Tariq and Hassan, 2023), thereby exerting a positive effect on the rationalization of the industrial structure. However, due to the lack of support from emerging industries and industrial substitution paths, its promoting effect is not significant. Meanwhile, ER may have weakened the economic foundation of these regions, thereby having a negative impact on the upgrading of the industrial structure. Furthermore, as supporting mechanisms such as GF are not yet mature in resource-based regions, the synergy between ER and other policies is difficult to exert, which restricts the process of overall optimization of the industrial structure. For non-resource-based regions (see Table 10), the coefficients of GF, ER, and their interaction terms are all significantly positive, indicating that the development of GF and ER still promotes industrial transformation. Their synergy is also conducive to the advanced development of the industrial structure. GF and ER policies have more significant effects in non-resource-based regions. In comparison, GF and ER have a significant inhibitory effect on the RIS in non-resource-based regions. However, they do not exert a significant synergistic effect, and Hypothesis two holds. This might be because non-resource-based regions rely on manufacturing and service industries. GF and ER can better guide resources for gathering in emerging industries. The two form an innovation compensation effect and contribute to the advanced development of the industrial structure. However, the industrial structure of these regions is still in the adjustment stage. Overly strict ER and green financial policies may lead to the rapid exit or transformation of some traditional industries that have not formed sufficient alternative industrial chains, resulting in structural imbalance. Moreover, there are differences in the policy goals and implementation paths of the two, and there is a lack of an effective connection mechanism. They have not formed a powerful synergy in guiding the rational allocation of industrial resources, resulting in an insignificant synergy between the two.

Table 9. Resource-based regression results.

Table 10. Non-resource-based regression Results.
5.4.2 Regional heterogeneity
Table 11–13 presents the results of dividing the YREB into the upper, middle, and lower reaches for separate analysis. For upstream provinces, GF and ER have no significant effect on the optimization of the industrial structure, but the synergy of the two has a significant inhibitory effect on the rationalization of the industrial structure. This might be because the industrial structure of the upstream provinces is still dominated by traditional resource processing and low-end manufacturing, the green financial system is not yet sound, and the enforcement capacity of ER is limited, making it difficult to independently influence the optimization of the industrial structure. However, due to the combined effect of both factors accelerating the phasing out of high energy-consuming industries, while emerging industries have yet to form an effective replacement, resource allocation has become inefficient, disrupting the balance of the original industrial structure. For midstream provinces, ER is not conducive to the advanced development of the industrial structure. However, their synergy with GF is beneficial to promoting the upgrading of the industrial structure. Moreover, GF and ER have no significant impact on the rationalization of the industrial structure. This is because the midstream heavy chemical industry accounts for a large share, and ER, in the short term, squeezes the profits of pillar industries such as steel and chemicals, restrains investment in technological research and development, and holds back the process of high-end development. However, the synergy between GF and ER is conducive to guiding funds towards green emerging industries, alleviating the cost of enterprises’ green transformation, enhancing the efficiency of green investment, and thereby effectively promoting industrial upgrading. Moreover, due to the relatively complete midstream industrial chain, the marginal effect of GF and ER in regulation has weakened, thus having no significant impact on rational development. For downstream provinces, both GF and ER can directly promote the advanced development of the industrial structure, but the synergy of the two does not have a significant impact on the advanced development of the industrial structure. Both GF and ER have significantly inhibited the rationalization of the industrial structure, but the synergy between the two has not had a significant impact on the rationalization of the industrial structure. Perhaps it is because the downstream provinces have a relatively high level of economic development, a complete GF system, strict and effectively enforced ER, and a solid foundation in emerging industries and high-end manufacturing. This enables GF and ER to promote the upgrading of the industrial structure effectively. However, as the industrial structure in such regions has tended to be advanced, the marginal improvement space of the synergy policy effect is limited. Therefore, the synergy between the two has not had a significant incremental effect on the advancement. Meanwhile, in the process of eliminating inefficient production capacity and promoting green upgrading, GF and ER tilt resources towards emerging industries, restricting the development of traditional industries and thereby significantly suppressing rational development. The synergy mechanism has not exerted its balancing and regulating function, nor has it demonstrated a significant synergy effect on the rationalization of the industrial structure.
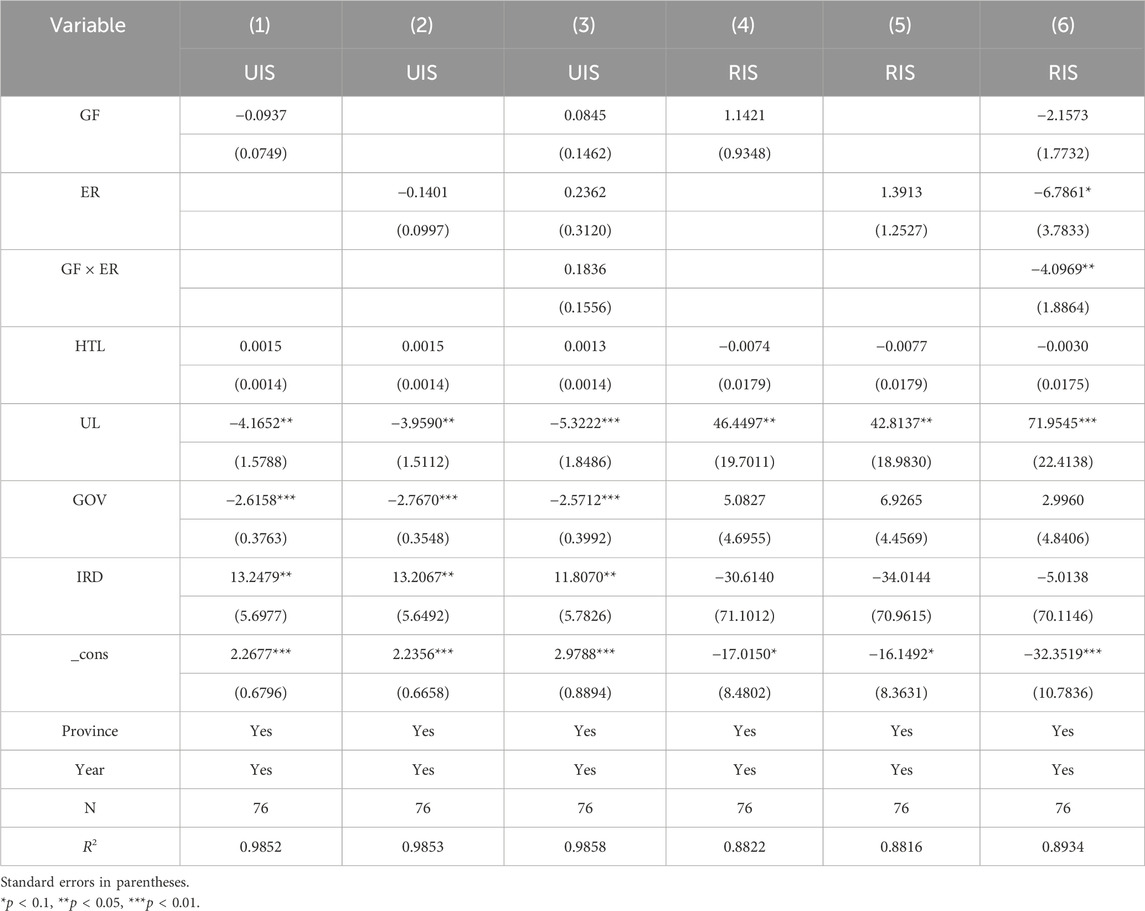
Table 11. Upstream regression results.

Table 12. Midstream regression results.

Table 13. Downstream regression results.
Thus, Hypothesis two is once again verified; that is, the effect of GF and ER on the optimization of industrial structure will vary due to different regions and resource endowments.
5.5 Threshold regression analysis
Through literature and policy analyses, it can be found that the intensity of ER will affect the effect of GF on the optimization of industrial structure, but there are few studies on this in the existing literature. This paper takes ER as a threshold variable to explore the role its development plays in the process of GF influencing the optimization of industrial structure, providing a reference for the government to promote the optimization of industrial structure under different intensities of ER.
In this paper, we initially employ LLC to test the smoothness of each variable. The results indicate that all variables pass the test and exhibit smoothness. The degree of environmental pollution will show a growing tendency during the industrialization process along with an increase in per capita GDP; year by year, the degree of environmental pollution will show a declining trend as per capita GDP continues to rise. Consequently, the threshold variable in this work is ER, and the Bootstrap times are set to 300 to conduct tests on the rationalization of industrial structure (RIS) and the upgrading of industrial structure (UIS) in sequence. The test results show (Table 14) that when ER is used as a threshold variable, the F-statistics of industrial structure rationalization (RIS) and industrial structure upgrading (UIS) are significant at the 1% and 5% levels, respectively, with a single threshold. However, neither the double threshold nor the triple threshold passes the 10% significance test, indicating that both UIS and RIS have only a single threshold, signalling no need to divide the intervals further. Table 15 shows the effective threshold values of ER when UIS and RIS are respectively used as explained variables. For UIS, the threshold value of ER is −0.4132, and its 95% confidence interval is [-0.4455, −0.4112]. Since the confidence interval does not include 0 and after 300 repeated sampling under the bootbar method, the range of the 95% interval is narrow (with a width of only 0.0343). It indicates that the threshold value has high estimation accuracy and is statistically significant (p < 0.05). For RIS, the threshold value of ER is −0.0213, which is significant at the 1% level, indicating that this threshold value is effective. Hypothesis 3 is verified.
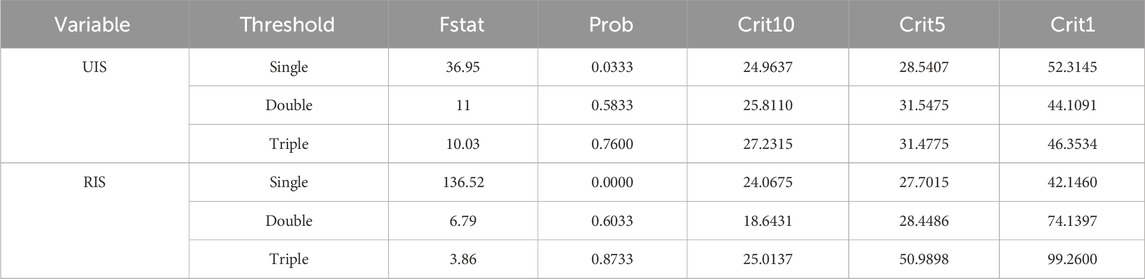
Table 14. Threshold test.
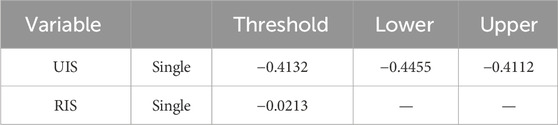
Table 15. Threshold value.
According to the principle of the threshold model, the threshold estimate is the
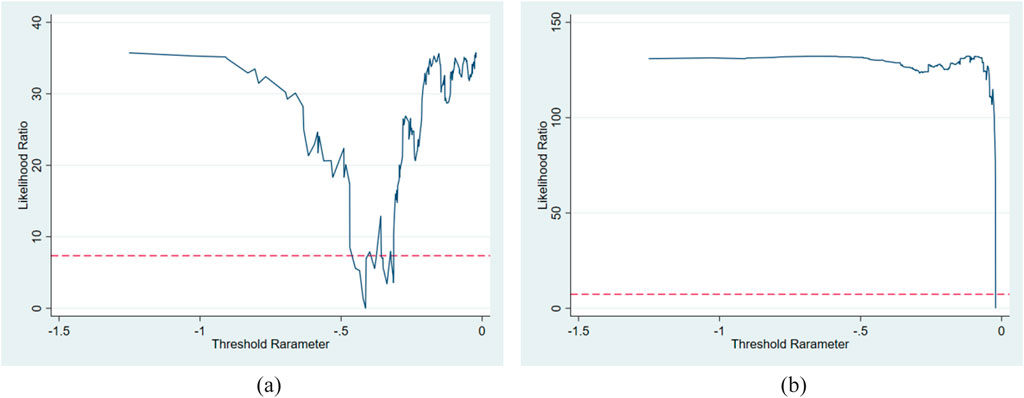
Figure 4. LR statistical figure of the threshold. Note: (a) Explained variable: UIS; ER threshold: −0.4132. (b) Explained variable: RIS; ER threshold: −0.0213.
While obtaining the threshold values, the regression results of the panel thresholds for RIS and UIS are obtained. See Table 16 for details.
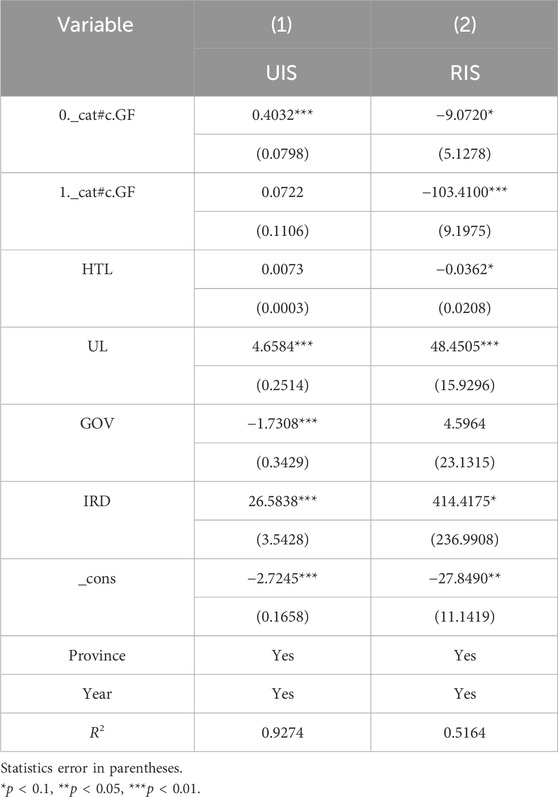
Table 16. Threshold return.
Regarding the threshold regression of industrial structure upgrading, when ER is relatively lenient (
For the threshold regression of industrial structure rationalization, when ER is relatively loose (
5.6 Spatial regression analysis
Based on previous studies, this paper further uses the spatial econometric model to explore the impact of GF and ER on the optimization of industrial structure and promote regional coordinated development.
In the field of spatial economics, to deeply explore the interdependence and degree of dependence of the same variable in the spatial dimension among different regions, the method of spatial autocorrelation analysis is often adopted. This method aims to reveal the direction and degree of mutual influence among the research variables more comprehensively and truly. Before conducting spatial regression, a spatial autocorrelation test is carried out on the spatial aggregation phenomenon of ISO. This verification process mainly relies on the Moran index. Through its calculation and analysis, the spatial aggregation degree and autocorrelation of ISO can be quantitatively evaluated, thereby providing a solid foundation for subsequent regression analysis.
The calculation method of the global Moran index is shown in Equations 23, 24:
Among them,
The spatial autocorrelation of ISO was calculated using the Moran Index, and the results are shown in Table 17. It can be seen that most of the Moran indices for the UIS did not pass the significance test. The Moran indices for the RIS are significantly positive at the significant levels of 5% or 1%, indicating that the rationalization levels of industrial structure among various regions in the YREB show a positive correlation in space, that is, the rationalization level of industrial structure in the local regions is relatively high. The rationalization level of the industrial structure in the surrounding areas is also relatively high. The rationalization level of the industrial structure in the local area is relatively low, and that in the surrounding areas is also relatively low. This indicates that the rationalization level of the industrial structure among adjacent provinces and cities shows the characteristics of “the same high and the same low”, and there is a significant spatial spillover effect.
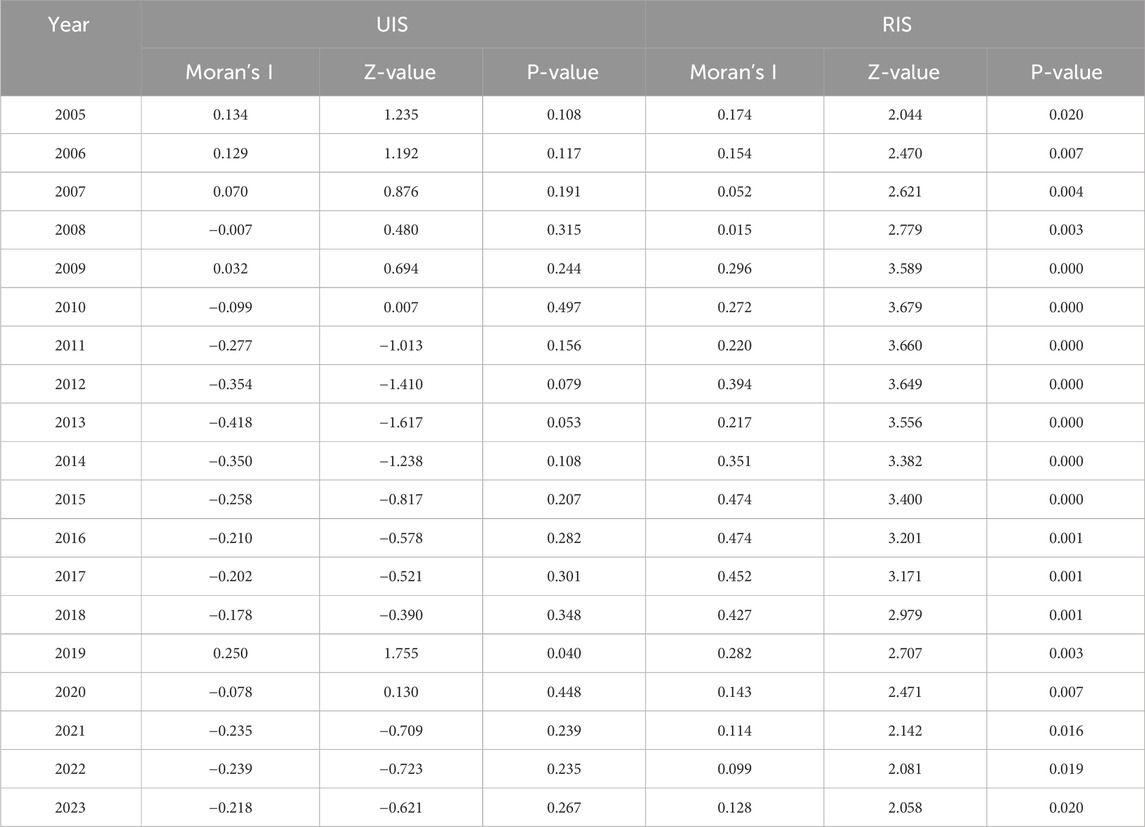
Table 17. Moran index test for industrial structure optimization.
To present the spatial agglomeration and spatiotemporal evolution of green economic development more intuitively, a Moran scatter plot was drawn with 2005 and 2023 as the time nodes. As shown in Figure 5, the Moran index distribution of industrial structure upgrading is relatively scattered, and the degree of spatial agglomeration is relatively low. The Moran index for the RIS is mainly distributed in the third quadrant. The RIS in most provinces has the same characteristics, showing a positive spatial correlation and spatial agglomeration of low-low (L-L) agglomeration.
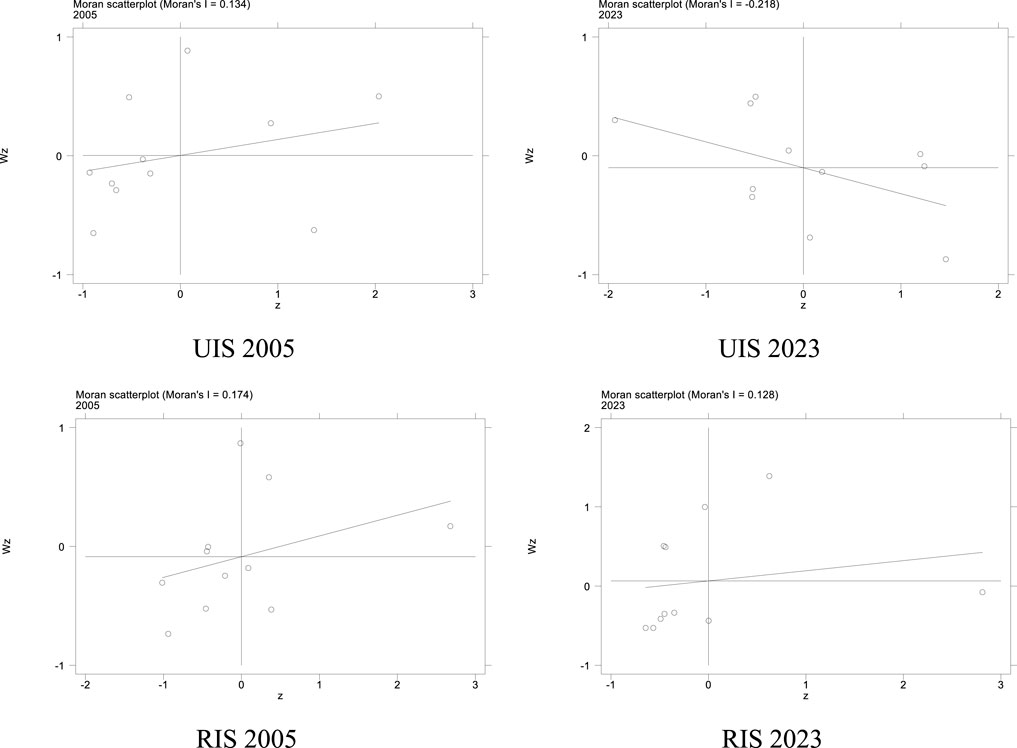
Figure 5. Moran scatter plot for industrial structure optimization.
Although the Moran Index for the UIS does not show obvious significance, in order to further confirm the spatial effect of GF and ER on the optimization of industrial structure, this paper also takes the UIS as the explained variable for further judgment.
The selection of spatial econometric models still requires further verification and identification. Firstly, the LM test is used to determine whether it has spatial distribution attributes and whether it is necessary to use a spatial econometric model for the model. This test is compared with the mixed OLS. Then, the Wald and LR tests are used to determine whether the SDM model will degenerate into the SAR or SEM model. Finally, the Hausman test is used to test whether the model will use random effects or fixed effects. The test results are shown in Table 18. The first three columns in Table 18 are the regression results of industrial structure upgrading, and the last three columns are the regression results of industrial structure rationalization. It can be seen that both the LM test and the robust LM test results of UIS are significant. Further, using the LR test and Wald test, the test results were all significant at the 1% level, indicating that the SDM model is the best choice for the spatial effect analysis of UIS. The Hausman test results show that both the fixed effect and the random effect can be selected. Therefore, in this paper, the fixed SDM is chosen for analysis. However, RIS only passed the robust LM test, indicating that the SEM model should be selected.
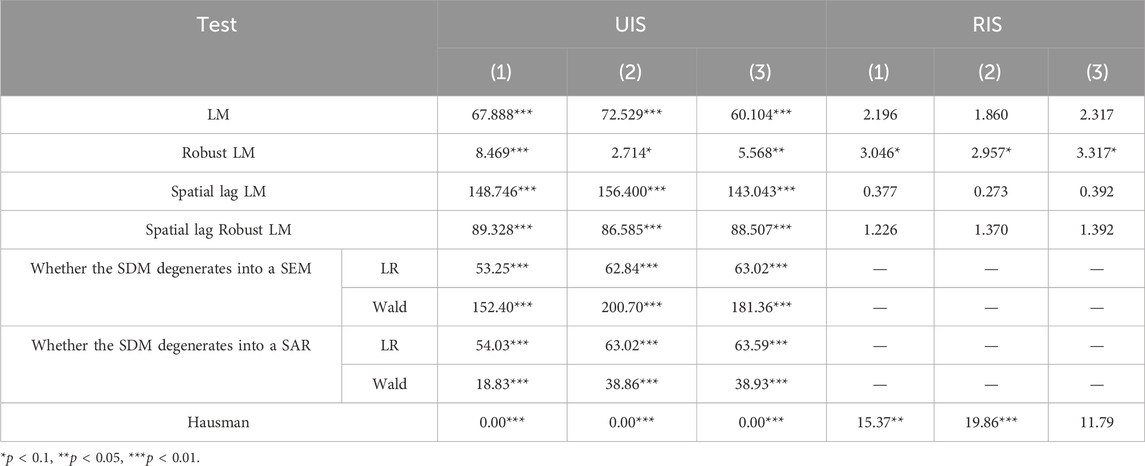
Table 18. Test results of space applicability.
Using the SDM model, the impact of GF and ER on the UIS was explored, and the results are shown in Tables 19–21. Firstly, it can be found that the coefficient of the spatial lag term
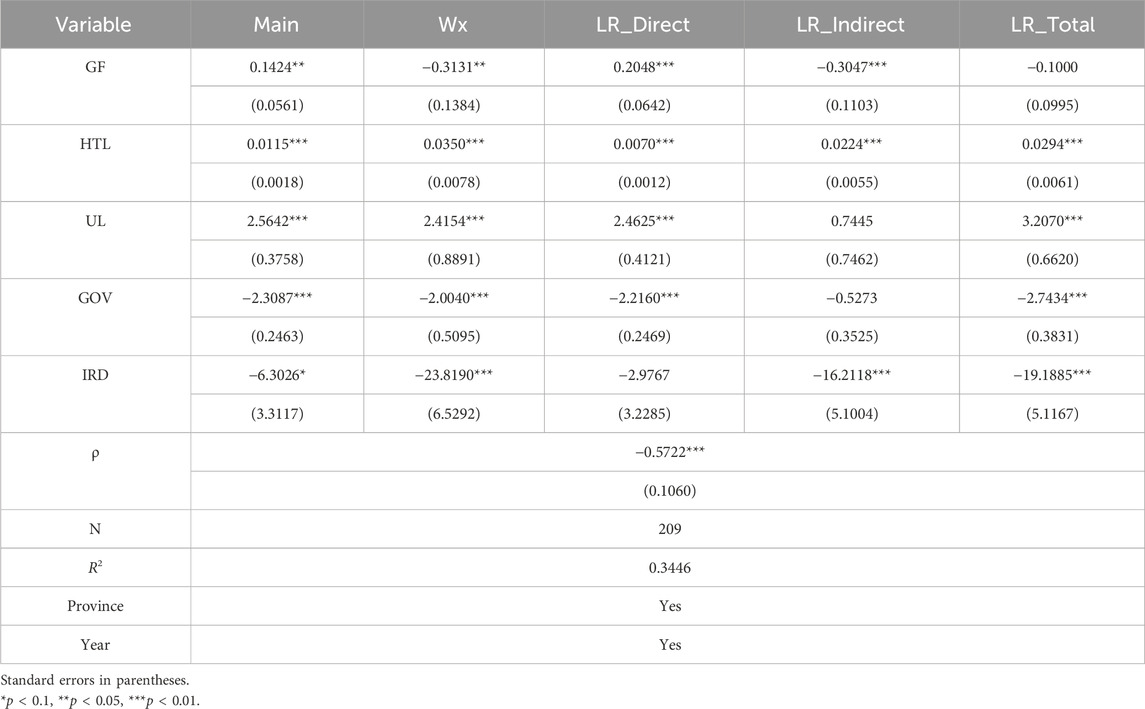
Table 19. The spatial effect of green finance on the upgrading of industrial structure.
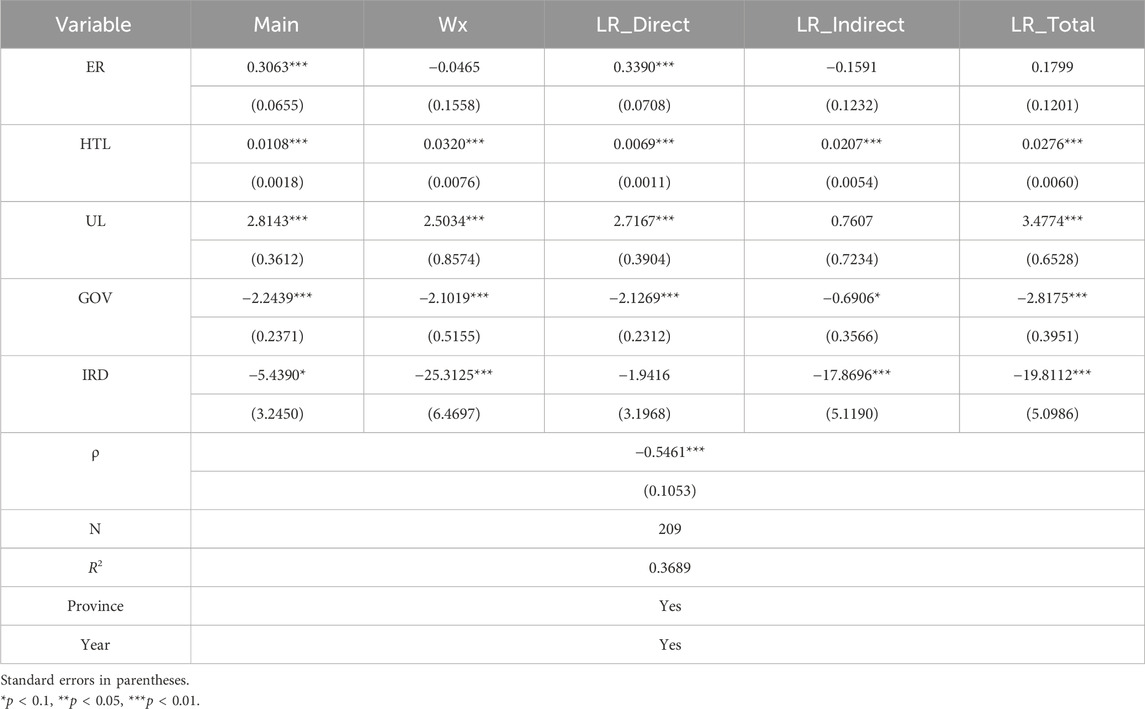
Table 20. Spatial effects of ER on the upgrading of industrial structure.
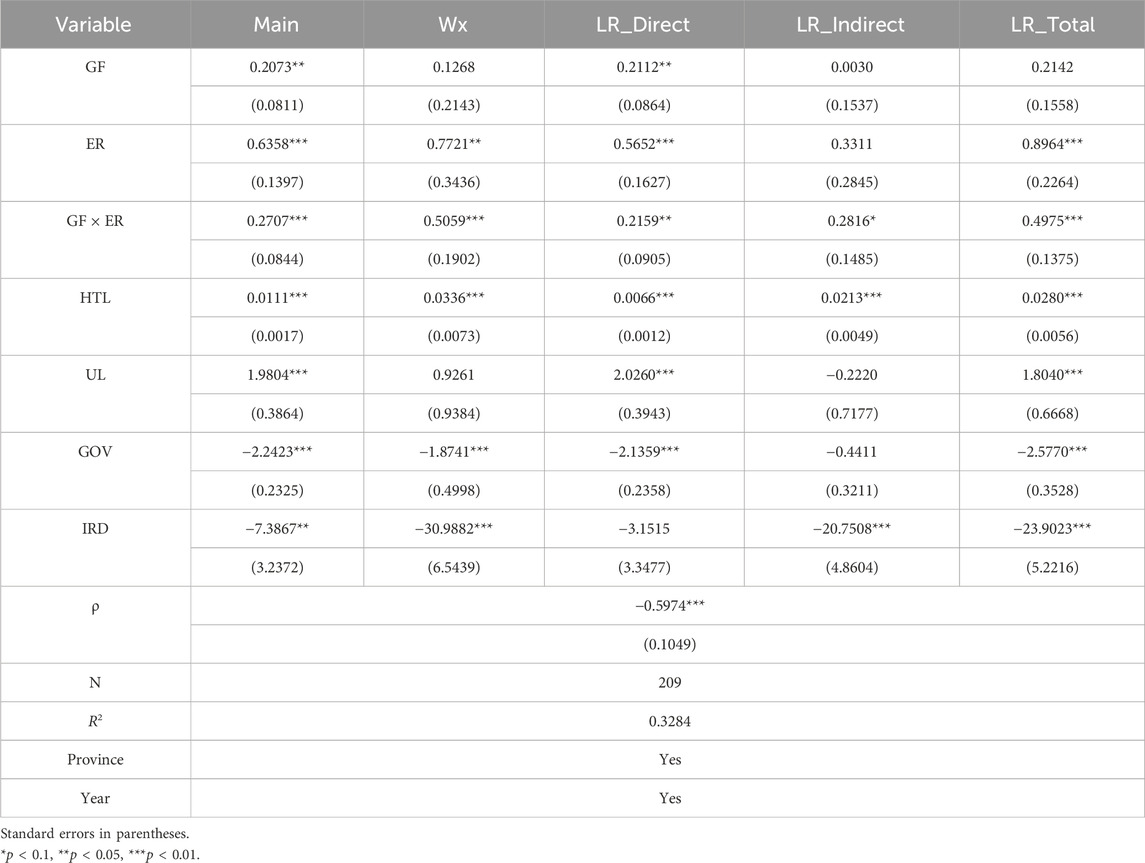
Table 21. Spatial effects of GF and ER on the UIS.
Table 20 shows the spatial regression results of ER on the UIS. Observing the Main column, the coefficient of ER is significantly positive; that is, the local ER has a positive effect on the advanced development of the local industrial structure. The Wx item of ER is also negative but not significant; that is, strengthening local ER will have a certain negative spillover effect on the industrial structure upgrading of neighboring areas. Further decomposition of the spatial spillover effect shows that the direct effect of ER is significant, while the coefficients of indirect effects and total effects are not significant. That is, ER only promotes the advanced development of the local industrial structure and has no spatial spillover effect on the advanced development of the industrial structure in the surrounding areas. This might be due to the fact that ER has a strong local characteristic. Their policy tools mainly act on local enterprises, and there are differences in economic development levels and industrial foundations across regions, resulting in limited policy transmission effects. Furthermore, during the implementation of local governments’ environmental policies, there may be a phenomenon of competitive easing. To attract investment, the surrounding areas may not strengthen ER standards simultaneously, thereby weakening the regional synergy effect of the policies.
Adding the interaction terms of GF and ER, the regression results are shown in Table 21. The coefficient of the interaction term is significantly positive; that is, GF and ER have a synergistic promoting effect on the advanced development of the industrial structure. Specific observation shows that the coefficient of GF is 0.2073 and is significant at the 5% level. Compared with Table 19, the coefficient of GF has increased significantly. Compared with Table 20, the coefficient of ER (0.6358) has also increased significantly. Thus, the coordinated development of GF and ER can enhance the promotion effect of the upgrading of the industrial structure. This is because GF provides financial support for local enterprises, and ER exerts pressure to encourage enterprises to carry out green innovation and industrial upgrading, thereby strengthening the promoting effect on the upgrading of the local industrial structure. The direct effect of GF is significantly positive, while the rest are not significant. The direct effect and the total effect of ER are significantly positive, and the coefficient of the total effect is greater than that of the direct effect, but the indirect effect is not significant. The coefficients of the direct effect, indirect effect, and total effect of the interaction term between the two are all significantly positive, indicating that the coordinated development of GF and ER can effectively promote local UIS and UIS of adjacent areas at the same time, and there is a spatial spillover effect. This is because the coordinated development of GF and ER creates a favorable atmosphere and policy environment for green development. The successful experiences of technological innovation and industrial upgrading spread to neighboring regions through knowledge dissemination, industrial association, and other means, providing excellent examples for other regions to promote the UIS.
Using the SEM model, we explore the impact of GF and ER on industrial structure rationalization, with the results shown in Table 22. The coefficients for both GF and ER are significantly negative, regardless of whether their interaction term is included, indicating that both GF and ER have a negative impact on industrial structure rationalization. The interaction term between the two is also significantly negative, suggesting that GF and ER exert a synergistic inhibiting effect on industrial structure rationalization.
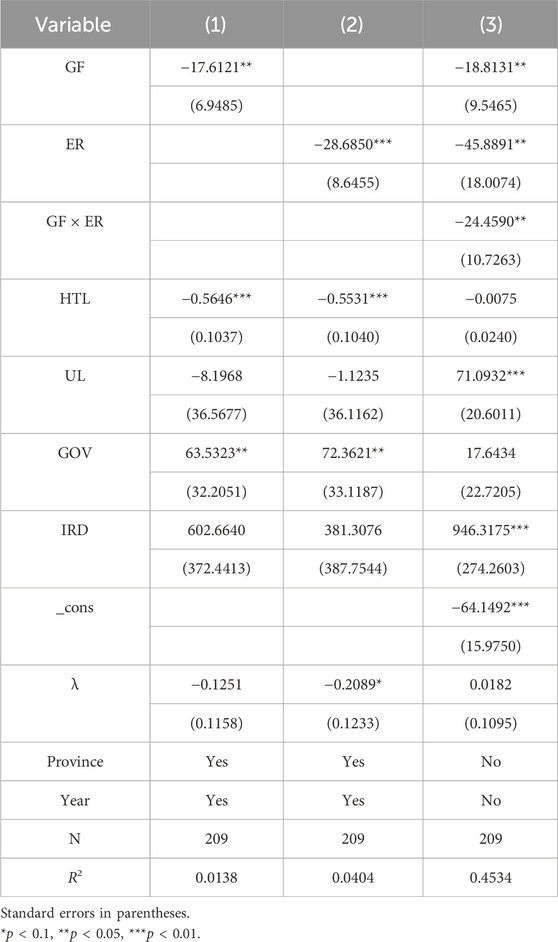
Table 22. Spatial effects of GF on industrial structure rationalization.
Moreover, only the spatial lag term of ER is significantly negative, while the spatial lag term in the regressions involving GF and its interaction term is not significant. This indicates that the inhibitory effect of ER on industrial structure rationalization has a spatial spillover effect. This could be due to inter-regional competition, policy misalignment between regions, or industrial transfer, leading to resource misallocation and disrupting industrial structure, thereby affecting rationalization. In contrast, the effect of GF is largely localized, with insufficient cross-regional capital flow and policy coordination, leading to a lack of significant spatial spillovers. This confirms Hypothesis 4.
6 Discussion
With the rapid development of the green economy, local governments are gradually realizing the importance of the dynamic balance between GF and ER for local economic development. This study attempts to investigate the joint effects of ER and GF on ISO, using the respective effects of the two variables as a point of comparison. For the influence of the single variables, both GF and ER have a significant promoting effect on UIS, which is consistent with the view of Liu and Zhang (2024), Lu et al. (2024) and Su and Cheng (2023), but contrary to the research results of Hu and Zhang (2023) (GF can inhibit the UIS and promote the RIS). Both of them have inhibitory effects on the rationalization of the industrial structure, contrary to the research results of Yu et al. (2024). Furthermore, this paper also finds that the synergy between GF and ER can have an impact on the optimization of the industrial structure. However, unlike Li (2024), which holds that the synergy between GF and ER would have a negative effect on the upgrading of the industrial structure and a positive effect on the rationalization of the industrial structure, this study finds that the synergy between GF and ER has no significant impact on the upgrading of the industrial structure and has a significant inhibitory effect on the rationalization of the industrial structure. The impact of GF and ER on the optimization of industrial structure is heterogeneous (Yu et al., 2024). Different intensities of ER can affect the effect of GF on the optimization of industrial structure. Furthermore, this paper finds that the impact of GF and ER on the optimization of industrial structure has a spatial effect (Hu and Zheng, 2024). GF has a negative spatial spillover effect on the upgrading of the industrial structure, while ER only promotes the upgrading of the local industrial structure. This is different from the discovery of Zeng and Liu (2023), who found that ER has no impact on the upgrading of the local industrial structure but has a positive spatial spillover effect on upgrading the industrial structure in surrounding areas. The inhibitory effect of ER on the RIS has a negative spatial spillover effect. GF and its synergy have no spatial spillover effect on the rationalization of the industrial structure. The synergy of the two has a positive spatial spillover effect on the upgrading of the industrial structure but no spatial spillover effect on the rationalization of the industrial structure.
This paper’s research is of great significance both in theoretical deepening and practical application. On the one hand, it theoretically enriches the research paradigm of the influence mechanism of GF and ER on the optimization of industrial structures. Especially by introducing the three dimensions of the synergy effect of the two, the threshold effect and the spatial spillover effect, this study deepens the understanding of the regulatory effect of the linkage of policy tools and regional heterogeneity. Compared with previous literature that mostly takes a single policy dimension or a single region as the research object, this paper systematically explores for the first time the synergy and dynamic relationship between GF and ER in different regions (resource-based/non-resource-based, upstream and downstream provinces), revealing the complexity of policy effects under the background of green development. The result that the interaction term between GF and ER significantly inhibits the rationalization of the industrial structure suggests that while encouraging green investment and strengthening environmental constraints, it may also inhibit the deepening of the industrial division of labor and the improvement of allocation efficiency, providing a topic space with sufficient theoretical tension for subsequent research. Meanwhile, this study introduces the spatial econometric model for research, suggesting that it is necessary to enhance policy coordination and resource sharing among regions, avoid the negative spatial spillover effect of GF, give full play to the positive spatial spillover advantage of coordinated policies, and promote coordinated regional development.
On the other hand, this article has strong practical guiding significance and provides an important reference for local governments to formulate industrial policies. Firstly, this research has confirmed that GF and ER can effectively promote the upgrading of the industrial structure, providing a policy basis for the government to promote the transformation of industries towards high-end. The inhibitory effect on the rationalization of the industrial structure warns policymakers that they need to pay attention to the coordination of the industrial structure and avoid industrial imbalance caused by excessive policy inclination. Secondly, this research finds that green policies have heterogeneous effects in different regions, suggesting that local governments should formulate green development strategies in combination with local industrial foundations and resource endowments when formulating industrial and environmental policies and avoid blindly promoting industrial upgrading. Furthermore, the results of the spatial effects suggest that regions need to enhance policy coordination and resource sharing, avoid the negative spatial spillover effect of GF, give full play to the positive spatial spillover advantages of coordinated policies, and promote coordinated regional development.
7 Conclusions and policy recommendations
Promoting industrial transformation and upgrading is essential for China to attain sustainable economic development. While industrial transformation is subject to external constraints related to environmental protection, it is also inseparable from the financial support provided by GF, and it is more necessary to play a synergistic role. In this study, GF and ER are incorporated into the analytical framework to explore the optimization and upgrading of industrial structures in the YREB. It systematically verifies the preset four assumptions and basically achieves the research goals. The empirical findings: Green finance and ER have a significant positive impact on the upgrading of the industrial structure; however, they significantly inhibit the rationalization of the industrial structure. After considering the interaction term between the two, the impact on industrial upgrading becomes insignificant, while the inhibitory effect on industrial rationalization remains significant. The study reveals the complex impact mechanism under their interaction, providing new evidence for the application of externality theory and Porter’s hypothesis in the field of industrial transformation. The impact of GF and ER on industrial transformation exhibits clear heterogeneity. Specifically, in resource-based regions, the effects of GF and ER on ISO are not significant. In non-resource-based regions, both GF and ER, along with their synergy, can promote industrial upgrading. At the same time, they can significantly inhibit the rationalization of the industrial structure, though their combined effect is not significant. In upstream provinces, GF and ER do not significantly affect ISO, but their synergy significantly inhibits industrial rationalization. In midstream provinces, ER is detrimental to industrial upgrading, but its synergy with GF is beneficial for promoting industrial upgrading with no significant impact on the RIS. In downstream provinces, both GF and ER can promote industrial upgrading and inhibit the RIS, but there is no synergy between them. Using ER as a threshold variable, the study finds that as the intensity of ER increases, the promoting effect of GF on industrial upgrading weakens, while its inhibitory effect on industrial rationalization significantly strengthens. This finding provides theoretical support for relevant policy formulation, indicating that GF and ER should adopt differentiated implementation strategies in different regions and industrial chains, helping to avoid a one-size-fits-all approach and improving policy precision. Moreover, the effect of GF on industrial upgrading has a negative spatial spillover effect, ER has no spatial spillover effect, and their synergy exhibits a positive spatial spillover effect. The inhibitory effect of ER on industrial rationalization has spatial spillover effects, whereas GF and their synergy do not. These findings have important implications for promoting regional collaborative development and improving the ecological compensation mechanism. In conclusion, this study enriches the theoretical literature on GF and ER and provides important practical references for policymakers in the process of promoting green development and ISO, especially in formulating regionally differentiated policies.
In response to these findings, the following suggestions are offered:
At the macro policy level, first, the synergy mechanism between GF and ER should be strengthened. The GF standard system should be improved, with clear standards for defining green projects to avoid greenwashing. A unified environmental information disclosure platform should be established to improve the transparency and accessibility of environmental data, helping financial institutions to accurately identify green projects and enhance the efficiency of GF resource allocation. At the same time, the combination of ER tools should be optimized, using measures such as environmental taxes, pollution permits, and carbon emission trading, and establishing a dynamic adjustment mechanism for the intensity of ER to prevent excessive regulation from stifling enterprise vitality or lenient regulation from hindering ISO. Furthermore, given that the interaction between GF and ER has no significant impact on the upgrading of the industrial structure, innovative policy tools can be explored. For instance, government funds can be used to guide social green financial resources to flow precisely into strategic emerging industries. At the same time, in combination with ER requirements, strict environmental protection standards and technical thresholds can be set for the projects supported by the fund to promote the coordinated efforts of policies.
In terms of regionally differentiated policies, differentiated strategies should be implemented based on the specific conditions of different regions to effectively promote industrial upgrading and rationalization. For resource-based regions, on the one hand, attention should be paid to the flow of GF funds, and green financial products and services should be innovated. Special bonds for the transformation of resource-depleted cities and green supply chain financial products should be developed to meet the transformation and upgrading needs of resource-based industries, guiding capital investment into deep processing, recycling, and the cultivation of alternative industries, thereby reducing the economy’s reliance on a single resource. On the other hand, ER strategies should be adjusted moderately to avoid one-size-fits-all high-intensity regulation. By formulating phased and differentiated environmental standards, a buffer period for technological transformation and industrial upgrading should be provided for enterprises, and incentive measures for resource-based industries should be increased to reduce transformation costs and encourage green technological innovation. For non-resource-based regions, the promoting effects of GF and ER should be fully utilized. ER standards should be further raised, and the elimination of high-pollution and high-energy-consuming enterprises should be strengthened, promoting technological innovation in green industries and the popularization of green consumption. This will force enterprises to increase investment in technological innovation and push the industry towards higher-end, intelligent, and green development. GF reform should be deepened, using GF policies to support high-tech, high-value-added green industries and promote the transformation of traditional industries towards green, intelligent, and digital directions. At the same time, the construction of GF infrastructure, such as establishing GF service centers and green project databases, should be strengthened to support the upgrading of the industrial structure. Efforts should be made to explore green collaborative development in the construction of financial markets and policy coordination across regions, effectively curbing inefficient industrial development, avoiding overdevelopment of low-value-added, high-pollution industrial structures, and ensuring the simultaneous rationalization and greening of industrial structures.
In terms of spatial collaborative development, downstream provinces, as economically developed regions, should play a leading role in GF and ER, strengthen policy coordination, and share their experience with upstream and midstream regions. They should drive industrial upgrading in upstream and midstream regions through technology output and industrial transfer. At the same time, the inter-regional ecological compensation mechanism should be improved to reasonably compensate upstream and midstream regions for the environmental pressures arising from undertaking industrial transfers. Upstream and midstream provinces need to optimize the business environment, enhance GF services, actively attract green capital inflows from downstream regions, and strictly control environmental access standards to avoid creating new environmental issues. Moreover, because there are spatial spillover effects of the synergistic development of GF and ER, regions should also strengthen regional cooperation, establish a cross-regional GF and ER collaborative governance mechanism, unify environmental standards and regulatory rules, break down administrative barriers, and promote the free flow of factors and optimal resource allocation, achieving collaborative progress in regional ISO.
Although this study explores in depth the effects of GF and ER on ISO and their regional heterogeneity, there are still some limitations. First, this study focuses on regional-level analysis and lacks an in-depth analysis of micro-level enterprise behaviors. Differences in factors such as industry-specific characteristics, enterprise size, and technological innovation capacity across regions will influence ISO. Second, the study only focuses on domestic regions and does not involve cross-country comparisons. Drawing on international experience will help China develop more precise policies in GF and ER. Furthermore, in practical applications, industrial structure transformation will also be influenced by the digital economy and market development, which may affect the explanatory power of GF and ER on ISO.
Therefore, in future research, we will focus on combining industry characteristics and micro-level enterprise data to further explore the impact of GF and ER on specific industry structure optimization. Cross-country research will be conducted to compare the differences in GF policy design and ER models, as well as their impact on industrial structures between developed countries and emerging economies, providing a richer experience for policy formulation in the YREB and China. More research variables will be incorporated to analyze their interaction with GF and ER in optimizing industrial structures. Attempts will be made to introduce machine learning, big data analysis, and other methods to explore the impact of GF and ER on ISO.
Data availability statement
The original contributions presented in the study are included in the article/supplementary material, further inquiries can be directed to the corresponding author.
Author contributions
JX: Conceptualization, Data curation, Formal Analysis, Methodology, Resources, Validation, Writing – original draft. DT: Conceptualization, Formal Analysis, Project administration, Validation, Visualization, Writing – review and editing. YZ: Data curation, Formal Analysis, Investigation, Methodology, Resources, Writing – original draft. QC: Formal Analysis, Investigation, Visualization, Writing – review and editing.
Funding
The author(s) declare that no financial support was received for the research and/or publication of this article.
Conflict of interest
Author QC was employed by Jiangsu Trendy Information Technology Co., Ltd.
The remaining authors declare that the research was conducted in the absence of any commercial or financial relationships that could be construed as a potential conflict of interest.
Generative AI statement
The author(s) declare that no Generative AI was used in the creation of this manuscript.
Any alternative text (alt text) provided alongside figures in this article has been generated by Frontiers with the support of artificial intelligence and reasonable efforts have been made to ensure accuracy, including review by the authors wherever possible. If you identify any issues, please contact us.
Publisher’s note
All claims expressed in this article are solely those of the authors and do not necessarily represent those of their affiliated organizations, or those of the publisher, the editors and the reviewers. Any product that may be evaluated in this article, or claim that may be made by its manufacturer, is not guaranteed or endorsed by the publisher.
References
Agyekum, E. B., Amjad, F., Mohsin, M., and Ansah, M. N. S. (2021). A bird's eye view of Ghana’s renewable energy sector environment: a multi-criteria decision-making approach. Util. Policy 70, 101219. doi:10.1016/j.jup.2021.101219
Chen, K., and Bian, R. (2023). Green financing and renewable resources for China's sustainable growth: assessing macroeconomic industry impact. Resour. Policy 85, 103927. doi:10.1016/j.resourpol.2023.103927
Fu, Q. A. (2024). Green finance and the mitigation of corporate debt financing in China: evidence and implications for sustainable finance. Front. Environ. Sci. 12, 1426837. doi:10.3389/fenvs.2024.1426837
Gao, L., Tian, Q., and Meng, F. (2022). The impact of green finance on industrial reasonability in China: empirical research based on the spatial panel Durbin model. Environ. Sci. Pollut. Res. Int. 30, 61394–61410. doi:10.1007/s11356-022-18732-y
Ge, T., Cai, X., and Song, X. (2022). How does renewable energy technology innovation affect the upgrading of industrial structure? The moderating effect of green finance. Renew. Energy 197, 1106–1114. doi:10.1016/j.renene.2022.08.046
Gu, B., Chen, F., and Zhang, K. (2021). The policy effect of green finance in promoting industrial transformation and upgrading efficiency in China: analysis from the perspective of government regulation and public environmental demands. Environ. Sci. Pollut. Res. 28, 47474–47491. doi:10.1007/s11356-021-13944-0
He, Y., and Zheng, H. (2023). How does environmental regulation affect industrial structure upgrading? Evidence from prefecture-level cities in China. J. Environ. Manag. 331, 117267. doi:10.1016/j.jenvman.2023.117267
He, X., Tang, X. M., Liu, T. Y., and Kholaif, M. (2025). The competitive effect of heterogeneous subjects dominant environmental regulations on environmental quality and its asymmetric strategies. Front. Environ. Sci. 13, 1530560. doi:10.3389/fenvs.2025.1530560
Hu, J., and Zhang, H. (2023). Has green finance optimized the industrial structure in China? Environ. Sci. Pollut. Res. 30, 32926–32941. doi:10.1007/s11356-022-24514-3
Hu, Y., and Zheng, C. (2024). “Environmental regulation, land use effiiciency, and industrial structure upgrading: test analysis based on spatial durbin model and threshold effect,” in Spatial spillovers: viewpoints from Asia. Editors A. A. Batabyal, Y. Higano, and P. Nijkamp (Singapore: Springer Nature Singapore), 243–264.
Hu, G., Wang, X., and Wang, Y. (2021). Can the green credit policy stimulate green innovation in heavily polluting enterprises? Evidence from a quasi-natural experiment in China. Energy Econ. 98, 105134. doi:10.1016/j.eneco.2021.105134
Huang, L., Yang, P., Zhang, B., and Hu, W. (2021). Spatio-temporal coupling characteristics and the driving mechanism of population-land-industry urbanization in the Yangtze River economic belt. Land 10, 400. doi:10.3390/land10040400
Jiakui, C., Abbas, J., Najam, H., Liu, J., and Abbas, J. (2023). Green technological innovation, green finance, and financial development and their role in green total factor productivity: empirical insights from China. J. Clean. Prod. 382, 135131. doi:10.1016/j.jclepro.2022.135131
Jian, X., and Afshan, S. (2023). Dynamic effect of green financing and green technology innovation on carbon neutrality in G10 countries: fresh insights from CS-ARDL approach. Econ. Research-Ekonomska Istraživanja 36, 2130389. doi:10.1080/1331677x.2022.2130389
Jiang, S., Liu, X., Liu, Z., Shi, H., and Xu, H. (2022). Does green finance promote enterprises' green technology innovation in China? Front. Environ. Sci. 10, 981013. doi:10.3389/fenvs.2022.981013
Kong, L., Yao, Y., and Xu, K. (2025). Can environmental regulation improve the industrial ecology efficiency? Evidence from China’s environmental protection tax reform. J. Environ. Manag. 373, 123792. doi:10.1016/j.jenvman.2024.123792
Lee, C.-C., and Lee, C.-C. (2022). How does green finance affect green total factor productivity? Evidence from China. Energy Econ. 107, 105863. doi:10.1016/j.eneco.2022.105863
Lee, C.-C., Wang, F., Lou, R., and Wang, K. (2023). How does green finance drive the decarbonization of the economy? Empirical evidence from China. Renew. Energy 204, 671–684. doi:10.1016/j.renene.2023.01.058
Li, J. (2024). Impact of green finance on industrial structure upgrading: implications for environmental sustainability in Chinese regions. Environ. Sci. Pollut. Res. 31, 13063–13074. doi:10.1007/s11356-024-32001-0
Li, Z., and Lin, B. (2022). Analyzing the impact of environmental regulation on labor demand: a quasi-experiment from clean Air Action in China. Environ. Impact Assess. Rev. 93, 106721. doi:10.1016/j.eiar.2021.106721
Li, K., Qi, S., and Shi, X. (2023a). Environmental policies and low-carbon industrial upgrading: heterogenous effects among policies, sectors, and technologies in China. Technol. Forecast. Soc. Change 191, 122468. doi:10.1016/j.techfore.2023.122468
Li, Z., Huang, Z., and Su, Y. (2023b). New media environment, environmental regulation and corporate green technology innovation:evidence from China. Energy Econ. 119, 106545. doi:10.1016/j.eneco.2023.106545
Li, Y., Zou, C., Huang, Y. C., and Wan, A. W. (2025). Environmental regulation, green innovation, and corporate brand value. Sustainability 17, 3445. doi:10.3390/su17083445
Lin, B., and Xie, J. (2023). Does environmental regulation promote industrial structure optimization in China? A perspective of technical and capital barriers. Environ. Impact Assess. Rev. 98, 106971. doi:10.1016/j.eiar.2022.106971
Liu, Y. (2023). How does economic recovery impact green finance and renewable energy in Asian economies. Renew. Energy 208, 538–545. doi:10.1016/j.renene.2023.01.084
Liu, X., and Zhang, Y. (2024). Green finance, environmental technology progress bias and cleaner industrial structure. Environ. Dev. Sustain. 26, 8643–8660. doi:10.1007/s10668-023-03062-x
Liu, X., Zhao, T., Chang, C.-T., and Fu, C. J. (2021a). China’s renewable energy strategy and industrial adjustment policy. Renew. Energy 170, 1382–1395. doi:10.1016/j.renene.2021.02.045
Liu, Y., Lei, J., and Zhang, Y. (2021b). A study on the sustainable relationship among the green finance, environment regulation and green-total-factor productivity in China. Sustainability 13, 11926. doi:10.3390/su132111926
Liu, X., Yang, J., Xu, C., Li, X., and Zhu, Q. (2023). Environmental regulation efficiency analysis by considering regional heterogeneity. Resour. Policy 83, 103735. doi:10.1016/j.resourpol.2023.103735
Liu, Z. B., Zhao, Y. W., and Lin, L. M. (2025). Research on the impact of environmental regulation and environmental accountability on public satisfaction with environmental governance. Pol. J. Environ. Stud. 34, 1255–1267. doi:10.15244/pjoes/187128
Lu, W., Qin, Z., and Yang, S. (2024). Heterogeneity effects of environmental regulation policy synergy on ecological resilience: considering the moderating role of industrial structure. Environ. Sci. Pollut. Res. 31, 8566–8584. doi:10.1007/s11356-023-31647-6
Lu, H. Y., Zhang, Y. D., Jiang, J. J., and Cao, G. L. (2025). Do market-based environmental regulations always promote enterprise green innovation commercialization? J. Environ. Manag. 375, 124183. doi:10.1016/j.jenvman.2025.124183
Ma, M., Zhu, X., Liu, M., and Huang, X. (2023). Combining the role of green finance and environmental sustainability on green economic growth: evidence from G-20 economies. Renew. Energy 207, 128–136. doi:10.1016/j.renene.2023.02.046
Mohamad Nur, U., Sri, R., Kaujan, K., and Soni Agus, I. (2020). Environmental performance, environmental disclosure, and firm value: empirical study of non-financial companies at Indonesia stock Exchange. Green Finance 2, 100–113. doi:10.3934/gf.2020006
Muhammad, S., Pan, Y., Agha, M. H., Umar, M., and Chen, S. (2022). Industrial structure, energy intensity and environmental efficiency across developed and developing economies: the intermediary role of primary, secondary and tertiary industry. Energy 247, 123576. doi:10.1016/j.energy.2022.123576
Razzaq, A., and Yang, X. (2023). Digital finance and green growth in China: appraising inclusive digital finance using web crawler technology and big data. Technol. Forecast. Soc. Change 188, 122262. doi:10.1016/j.techfore.2022.122262
Song, M., Tao, W., and Shen, Z. (2022). Improving high-quality development with environmental regulation and industrial structure in China. J. Clean. Prod. 366, 132997. doi:10.1016/j.jclepro.2022.132997
Su, Y., and Cheng, Z. (2023). Has green finance reform promoted green growth in Chinese industry? Environ. Sci. Pollut. Res. 30, 63136–63147. doi:10.1007/s11356-023-26518-z
Tang, D., Zhao, Z., Li, J., and Boamah, V. (2024). Research on coupling coordination degree of digital finance and economic resilience in the Yangtze River economic belt. Nat. Hazards 120, 14279–14309. doi:10.1007/s11069-024-06776-x
Tariq, A., and Hassan, A. (2023). Role of green finance, environmental regulations, and economic development in the transition towards a sustainable environment. J. Clean. Prod. 413, 137425. doi:10.1016/j.jclepro.2023.137425
Wang, X. (2023). Exploring the role of resource industry dependence and green finance in green development efficiency in the context of post-Covid-19 period. Resour. Policy 85, 103866. doi:10.1016/j.resourpol.2023.103866
Wang, X., and Wang, Q. (2021). Research on the impact of green finance on the upgrading of China's regional industrial structure from the perspective of sustainable development. Resour. Policy 74, 102436. doi:10.1016/j.resourpol.2021.102436
Wang, F., Cai, W., and Elahi, E. (2021a). Do green finance and environmental regulation play a crucial role in the reduction of CO2 emissions? An empirical analysis of 126 Chinese cities. Sustainability 13, 13014. doi:10.3390/su132313014
Wang, T., Peng, J., and Wu, L. (2021b). Heterogeneous effects of environmental regulation on air pollution: evidence from China’s prefecture-level cities. Environ. Sci. Pollut. Res. 28, 25782–25797. doi:10.1007/s11356-021-12434-7
Wang, M.-l., Zhang, H.-m., and Zhang, M. (2023a). Industrial structure servitization, financial structure marketization and economic growth — based on PVAR model. Procedia Comput. Sci. 221, 1432–1439. doi:10.1016/j.procs.2023.08.135
Wang, S., Tian, W., and Lu, B. (2023b). Impact of capital investment and industrial structure optimization from the perspective of “resource curse”: evidence from developing countries. Resour. Policy 80, 103276. doi:10.1016/j.resourpol.2022.103276
Wu, H., Hao, Y., and Ren, S. (2020). How do environmental regulation and environmental decentralization affect green total factor energy efficiency: evidence from China. Energy Econ. 91, 104880. doi:10.1016/j.eneco.2020.104880
Xie, B., Yang, C., Song, W., Song, L., and Wang, H. (2023). The impact of environmental regulation on capacity utilization of China’s manufacturing industry: an empirical research based on the sector level. Ecol. Indic. 148, 110085. doi:10.1016/j.ecolind.2023.110085
Xu, S., and Dong, H. (2023). Green finance, industrial structure upgrading, and high-quality economic development–intermediation model based on the regulatory role of environmental regulation. Int. J. Environ. Res. Public Health 20, 1420. doi:10.3390/ijerph20021420
Xu, Y., Li, S., Zhou, X., Shahzad, U., and Zhao, X. (2022). How environmental regulations affect the development of green finance: recent evidence from polluting firms in China. Renew. Energy 189, 917–926. doi:10.1016/j.renene.2022.03.020
Yi, H., Hao, L., Liu, A., and Zhang, Z. (2023). Green finance development and resource efficiency: a financial structure perspective. Resour. Policy 85, 104068. doi:10.1016/j.resourpol.2023.104068
Yu, C.-H., Wu, X., Zhang, D., Chen, S., and Zhao, J. (2021). Demand for green finance: resolving financing constraints on green innovation in China. Energy Policy 153, 112255. doi:10.1016/j.enpol.2021.112255
Yu, B., Liu, L., and Chen, H. (2023). Can green finance improve the financial performance of green enterprises in China? Int. Rev. Econ. Finance 88, 1287–1300. doi:10.1016/j.iref.2023.07.060
Yu, H., Xu, J., Hu, H., Shi, X., Wang, J., and Liu, Y. (2024). How does green technology innovation influence industrial structure? Evidence of heterogeneous environmental regulation effects. Environ. Dev. Sustain. 26, 17875–17903. doi:10.1007/s10668-023-03369-9
Yuan, L., Li, R., Wu, X., He, W., Kong, Y., Ramsey, T. S., et al. (2023a). Decoupling of economic growth and resources-environmental pressure in the Yangtze River economic belt, China. Ecol. Indic. 153, 110399. doi:10.1016/j.ecolind.2023.110399
Yuan, L., Yang, D., Wu, X., He, W., Kong, Y., Ramsey, T. S., et al. (2023b). Development of multidimensional water poverty in the Yangtze River economic belt, China. J. Environ. Manag. 325, 116608. doi:10.1016/j.jenvman.2022.116608
Zakari, A., and Khan, I. (2022). The introduction of green finance: a curse or a benefit to environmental sustainability? Energy Res. Lett. 3. doi:10.46557/001c.29977
Zeng, G., and Liu, T. (2023). Analysis on spatial effect of environmental regulation on upgrading of industrial structure in China. Environ. Sci. Pollut. Res. 30, 55485–55497. doi:10.1007/s11356-023-26186-z
Zeng, Q., Tong, Y., and Yang, Y. (2023). Can green finance promote green technology innovation in enterprises: empirical evidence from China. Environ. Sci. Pollut. Res. 30, 87628–87644. doi:10.1007/s11356-023-28342-x
Zhang, G. (2023a). The heterogeneous role of green finance on industrial structure upgrading - based on spatial spillover perspective. Finance Res. Lett. 58, 104596. doi:10.1016/j.frl.2023.104596
Zhang, T. (2023b). Can green finance policies affect corporate financing? Evidence from China’s green finance innovation and reform pilot zones. J. Clean. Prod. 419, 138289. doi:10.1016/j.jclepro.2023.138289
Zhang, Y., and Dilanchiev, A. (2022). Economic recovery, industrial structure and natural resource utilization efficiency in China: effect on green economic recovery. Resour. Policy 79, 102958. doi:10.1016/j.resourpol.2022.102958
Zhang, K., Li, Y., Qi, Y., and Shao, S. (2021). Can green credit policy improve environmental quality? Evidence from China. J. Environ. Manag. 298, 113445. doi:10.1016/j.jenvman.2021.113445
Zhang, M., Zhang, X., Song, Y., and Zhu, J. (2022a). Exploring the impact of green credit policies on corporate financing costs based on the data of Chinese A-share listed companies from 2008 to 2019. J. Clean. Prod. 375, 134012. doi:10.1016/j.jclepro.2022.134012
Zhang, Y., Song, Y., and Zou, H. (2022b). Non-linear effects of heterogeneous environmental regulations on industrial relocation: do compliance costs work? J. Environ. Manag. 323, 116188. doi:10.1016/j.jenvman.2022.116188
Zhang, H., Wang, Y., Li, R., Si, H., and Liu, W. (2023a). Can green finance promote urban green development? Evidence from green finance reform and innovation pilot zone in China. Environ. Sci. Pollut. Res. Int. 30, 12041–12058. doi:10.1007/s11356-022-22886-0
Zhang, Z., Hao, L., Linghu, Y., and Yi, H. (2023b). Research on the energy poverty reduction effects of green finance in the context of economic policy uncertainty. J. Clean. Prod. 410, 137287. doi:10.1016/j.jclepro.2023.137287
Zhang, Z., Li, R., Song, Y., and Sahut, J.-M. (2024). The impact of environmental regulation on the optimization of industrial structure in energy-based cities. Res. Int. Bus. Finance 68, 102154. doi:10.1016/j.ribaf.2023.102154
Zhao, T., Zhou, H., Jiang, J., and Yan, W. (2022). Impact of green finance and environmental regulations on the green innovation efficiency in China. Sustainability 14, 3206. doi:10.3390/su14063206
Zhao, K., Wu, C., Liu, J., and Liu, Y. (2024). Green finance, green technology innovation and the upgrading of China’s industrial structure: a study from the perspective of heterogeneous environmental regulation. Sustainability 16, 4330. doi:10.3390/su16114330
Zhao, C., Lei, Z., Zhao, X., and Wang, Y. (2025a). Carbon finance development, industrial structure and green financial instruments. North Am. J. Econ. Finance 78, 102430. doi:10.1016/j.najef.2025.102430
Zhao, K., Gao, Y., and Liu, X. (2025b). The impact of environmental regulation on industrial structure upgrading: a case study of low carbon city pilot policy. Energy Policy 197, 114432. doi:10.1016/j.enpol.2024.114432
Zhao, Y., Shen, C., and Han, C. (2025c). The impact of environmental regulations and foreign direct investment on industrial structure upgrading. Finance Res. Lett. 76, 107004. doi:10.1016/j.frl.2025.107004
Zhou, D., Wang, H., and Wang, M. (2023). Does local government competition affect the dependence on polluting industries? Evidence from China’s land market. J. Environ. Manage 325, 116518. doi:10.1016/j.jenvman.2022.116518
Keywords: green finance, environmental regulation, yangtze river economic belt, industrial structure optimization (ISO), panel threshold
Citation: Xiang J, Tang D, Zhou Y and Chen Q (2025) Green finance, environmental regulation, and the optimization of industrial structure in China’s Yangtze River economic belt. Front. Environ. Sci. 13:1585693. doi: 10.3389/fenvs.2025.1585693
Received: 01 March 2025; Accepted: 05 August 2025;
Published: 01 September 2025.
Edited by:
Mobeen Ur Rehman, Keele University, United KingdomReviewed by:
Liang Yuan, China Three Gorges University, ChinaJun Zhang, Harbin Institute of Technology, China
Feng Hu, Zhejiang Gongshang University, China
Copyright © 2025 Xiang, Tang, Zhou and Chen. This is an open-access article distributed under the terms of the Creative Commons Attribution License (CC BY). The use, distribution or reproduction in other forums is permitted, provided the original author(s) and the copyright owner(s) are credited and that the original publication in this journal is cited, in accordance with accepted academic practice. No use, distribution or reproduction is permitted which does not comply with these terms.
*Correspondence: Decai Tang, dGFuZ2RlY2FpMjAwM0AxNjMuY29t