 Till Fretschner1*
 Edgar Elon Zeisler1Steffi Scheller1Andreas Aurenz1Beate Schneider2Marcus Lukas2
 Ulrike Braun2Timo Greiner3Jakob Schumacher3
 Hans Christoph Selinka1
 Birgit Walther1†
 René Kallies1*†
- 1Section II 1.4 Microbiological Risks, German Environment Agency, Berlin, Germany
- 2Section III 2.5 Waste Water Analysis, Monitoring Methods, German Environment Agency, Berlin, Germany
- 3Unit 32 Surveillance, Robert Koch Institute, Berlin, Germany
Influenza, caused by Influenza A and B viruses, represents a significant global health burden due to recurrent seasonal epidemics and the risk of pandemics. To gauge the large volume of seasonal influenza cases, it may be helpful to complement classical surveillance systems with additional approaches such as wastewater-based epidemiology (WBE), which can aid in the early trend assessment of seasonal epidemics. WBE has emerged as a promising tool for population-level surveillance, enabling the detection of viral nucleic acids in wastewater and offering unique advantages over individual-based surveillance. This study evaluates the performance of different combinations of virus concentration (i.e., PEG precipitation, centrifugal filtration, and silica membrane filtration) together with two distinct RNA extraction methods for the detection of Influenza A and B viruses in wastewater. Composite samples from four wastewater treatment plants in North Germany were analyzed using precipitation, filtration, and automated extraction protocols. Method performance for six combinations was evaluated by quantitative recovery of viral RNA and a spike-and-recovery experiment. Recovery efficiencies were determined from controlled spiking experiments, which provide a standardised method of comparison but may not fully reflect the complexity of real wastewater samples, in which viral genomes may be fragmented and associated with solids. The combination of PureYield™ filtration and Maxwell® RSC extraction (PYC/EX1) consistently demonstrated the highest recovery rates for both Influenza virus A and B, achieving recovery efficiencies of up to 44.4% and 76.4%, respectively. This method also enabled reliable detection of low viral loads, which is critical for an early detection of rising incidence. Our findings demonstrate the importance of rigorous method evaluation to optimize WBE for influenza surveillance. By providing robust, sensitive, and reproducible protocols, this study highlights the potential of WBE to improve public health preparedness, enables timely interventions and reduces the spread of influenza viruses within communities.
1 Introduction
Influenza, a highly contagious respiratory illness, poses a significant global health threat, causing recurring seasonal epidemics associated with substantial morbidity and mortality worldwide (Harrington et al., 2021). The primary culprits are Influenza A (IAV) and B (IBV) viruses, which drive most seasonal outbreaks. Other types, such as Influenza C and D viruses, also exist and can cause infections, though their public health impact is less pronounced (White et al., 2016; Sederdahl and Williams, 2020; Hammond et al., 2022). In 2019, the World Health Organization (WHO) highlighted the threat of another severe influenza pandemic as one of the top ten global health concerns, underscoring the urgent need for preparedness (WHO, 2019). Surveillance systems play a crucial role in controlling the spread of Influenza by providing timely and accurate data to public health (PH) authorities (Hammond et al., 2022). However, traditional surveillance methods, such as passive, active, and sentinel systems, primarily capture data from individuals seeking medical care. As a result, they may underestimate the true burden of infection within the community, particularly in individuals with mild or asymptomatic courses who continue to contribute to viral transmission (Montgomery et al., 2024).
Wastewater-based epidemiology (WBE) has gained increasing attention as an innovative tool for public health surveillance, particularly during the COVID-19 pandemic (Kramarsky-Winter et al., 2023; Carmo dos Santos et al., 2024). By detecting viral nucleic acids in wastewater, WBE provides a more comprehensive picture of community-level infections, independent of healthcare-seeking behavior. This approach is a valuable addition to traditional, individual-based surveillance methods, and is being increasingly explored and implemented for influenza in national WBE programs. (Kilaru et al., 2023; Li et al., 2024).
Influenza viruses, particularly Influenza virus A and B, are among the most important causes of respiratory infections, making them desirable targets for WBE. However, despite its success with viruses like SARS-CoV-2, WBE for influenza virus remains underdeveloped (Grassly et al., 2025). There are several studies from different countries on the detection of influenza virus in wastewater, which have already been able to detect IAV and IBV with promising results (Zheng et al., 2023; Maida et al., 2024; Nadeau et al., 2024). The challenges include the detection of relatively low viral loads in wastewater and the need for highly sensitive and specific methods to extract and quantify influenza viral RNA (Cheshomi et al., 2024). In this context, “low concentrations” usually refers to levels that are several orders of magnitude lower than those observed for abundant markers, such as PMMoV. It also refers to viral signals that can approach the limit of detection outside peak influenza seasons. Implementing WBE for influenza virus requires overcoming these technical hurdles, but successful detection could improve Influenza surveillance by providing earlier warnings of outbreaks and better capturing the dynamics of virus spread within communities.
The reliability of WBE for detecting influenza virus depends heavily on the quality of the methods used for virus concentration and RNA extraction. Influenza virus RNA in wastewater is often present in low concentrations, especially outside of peak transmission seasons, making sensitive detection methods crucial (Zafeiriadou et al., 2024; Boehm et al., 2023; Maida et al., 2024). In addition to the commonly used methods of concentrating the liquid phase through precipitation, centrifugation or filtration, studies have also demonstrated the effectiveness of preparing the sample using its solid phase (Schoen et al., 2023; Roldan-Hernandez et al., 2025). Effective testing requires a combination of virus concentration and nucleic acid extraction techniques that are robust enough to work with the complex and variable matrix of wastewater. These methods must be optimized not only for sensitivity and specificity but also for practical considerations such as costs, processing time, and equipment availability. Factors such as sample volume, the potential presence of inhibitors in wastewater, and the viral recovery rate significantly influence the success of the detection process (Zafeiriadou et al., 2024).
In this study, we evaluated various combinations of concentration and extraction methods to identify the optimal approach for detecting Influenza A and B virus RNA in wastewater. As part of the AMELAG (German: Abwassermonitoring zur epidemiologischen Lagebewertung) project, one of Germany’s largest wastewater monitoring initiatives (Marquar et al., 2024; Saravia et al., 2024), we conducted a series of experiments to evaluate specific virus concentration and RNA extraction methods for SARS-CoV-2 and surrogate markers. These methods were selected based on their proven effectiveness within AMELAG but do not necessarily represent the variety of methods for influenza virus detection in WBE. In the present paper, our goal was to identify the combination of methods that provide the highest recovery rates for Influenza A and B virus RNA in wastewater samples.
Initially, 24-h composite samples from multiple wastewater treatment plants (WWTP) were collected and processed using six different method combinations. These methods included both precipitation and filtration-based concentration techniques, paired with automated nucleic acid extraction protocols, but do not necessarily represent the variety of methods for influenza virus detection in WBE, and no classification of environmental parameters or spatiotemporal analyses were performed. Performances of various method combinations were evaluated regarding detection of Influenza A and B RNA, with Pepper Mild Mottle Virus (PMMoV) serving as an endogenous process control. Next, we conducted a spike-and-recovery experiment to assess the recovery efficiency of the best-performing method combination. Inactivated Influenza A and B viruses were spiked into raw wastewater and PBS at three different concentration levels, and the recovery rates were determined by comparing the detected viral loads to the known input concentrations.
Our study highlights the critical importance of thorough method evaluation to ensure reliable detection and quantification of influenza viruses in wastewater. Simultaneous improvements of both concentration and extraction techniques can avoid misinterpretation of results and allows provision of accurate data for public health authorities, thereby enhancing their ability to make informed decisions for the prevention and control of Influenza outbreaks.
2 Materials and methods
2.1 Wastewater collection
A total of 16 raw wastewater samples were collected from four different wastewater treatment plants (WWTP) in Northern Germany during the seasonal Influenza, calendar week (CW) 46/2023 to 21/2024. Twenty-four-hour composite samples of grit removed wastewater were transported at 4 °C to the Microbiological Risks Laboratory of the German Environment Agency on the same day. For the spike-and-recovery experiment, 3 L of a 2-h composite sample were collected and further processed (see below for detailed description). After homogenization for 15 min, 50 mL aliquots were centrifuged at 250 × g at 4 °C for 15 min to remove solid matter.
2.2 Virus spike and recovery experiment
To further validate the performance of the tested method combinations under controlled conditions, a spike-and-recovery experiment was conducted. To this end, 4 L of wastewater were homogenised for 30 min and subsequently divided into four 1-L aliquots. Inactivated whole influenza A virus (IAV) and influenza B virus (IBV) (Zeptometrix, Buffalo, NY, United States) were spiked into three of the aliquots at three different concentrations: 106, 105, and 104 gene copies per liter (gc/L). These concentrations are referred to as “high,” “medium” and “low” spike levels, respectively. Each aliquot received both IAV and IBV at the same concentrations. The fourth aliquot served as a negative control. After thorough mixing, 18 45-mL subsamples were prepared from each 1-L aliquot and processed in triplicate across all six concentration–extraction method combinations.
All influenza spike materials were inactivated prior to use. Wastewater handling was performed under BSL-2 conditions in accordance with institutional SOPs.
To assess potential matrix effects, phosphate-buffered saline (PBS) was spiked using the same procedure. Only the two best-performing method combinations identified in Section 3.2 (PYC/EX1 and PEG/EX1) were applied for these experiments.
Finally, the spike-in input material was extracted directly and analyzed by ddPCR to determine the actual concentrations of IAV and IBV in gene copies per litre, rather than relying on the theoretical concentrations provided by the manufacturer.
2.3 Concentration methods and viral RNA extraction
Three different concentration methods were performed. Forty ml supernatant of each sample were precipitated with Polyethylene glycol 8,000 (Carl Roth, Karlsruhe, Germany; Cat. No. 0263.2), subsequently abbreviated as PEG, centrifugal filtration with Centricon 70-Plus filter cartridges (Merck, Darmstadt, Germany; Cat. No. UFC701008), abbreviated as CEN and PureYield™ Filtration using a silica membrane with Vac-Man® Laboratory Vacuum Manifold (Promega, Walldorf, Germany; Cat. Nos. AS1831 and A3110), abbreviated as PYC, following the manufacturer’s instructions. For PEG, 40 mL of supernatant from each sample was mixed with 10% w/v PEG 8000 and 0.9 g NaCl. The samples were incubated at room temperature until the PEG dissolved completely (approx. 20–30 min), followed by centrifugation at 12,000 × g for 90 min at 4 °C, resulting in a clearly visible pellet at the bottom of the tube. The resulting pellets were resuspended in 500 µL of PBS (Gibco™ PBS Tablets). RNA was extracted using either the Maxwell® RSC Enviro Total Nucleic Acid Kit (Promega, Walldorf, Germany) on a Maxwell® RSC automated instrument (Promega), abbreviated as EX1 or the innuPREP AniPath DNA/RNA Kit (Analytik Jena, Jena, Germany) on an InnuPure® C16 touch (Analytik Jena, Jena, Germany) system, abbreviated as EX2, following the manufacturer’s instructions. In contrast to the manufacturer’s protocol RNA was eluted in 100 µL RNase-free water. A summary of the different concentration and nucleic acid extraction methods is given in Table 1.
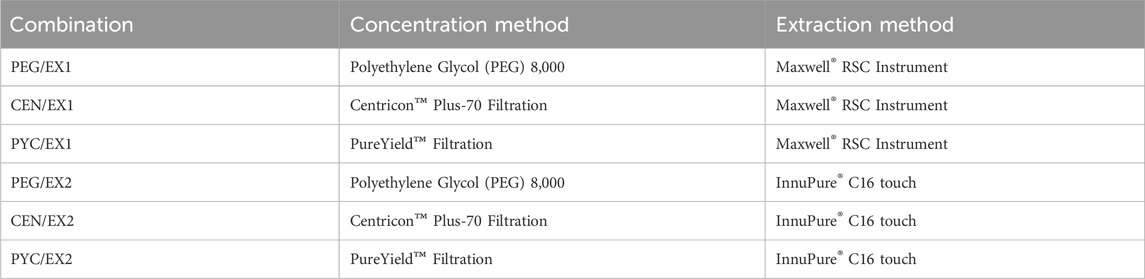
Table 1. Combinations of concentration and extraction methods.
2.4 Reverse transcription droplet digital PCR (RT-ddPCR)
The RT-ddPCR was performed using the QX600 AutoDG Droplet Digital PCR System (Bio-Rad Laboratories, Hercules, Ca, United States) with the QX Manager Standard Edition v2.1.0 software, following a previously published protocol (Markt et al., 2023). The One-Step RT-ddPCR Advanced Kit for Probes (Bio-Rad Laboratories) was used with specific primers, probes, and positive controls for Influenza viruses A and B, as described more detailed in the Supplementary Material (Supplementary Table S1). Each RT-ddPCR run included both, a negative and positive control for each target virus. The forward and reverse primers were used at a final concentration of 1 μM, probes labelled with FAM for Influenza virus A and HEX for Influenza virus B were used at a final concentration of 250 nM. The reaction mix consisted of 2.6 µL of the primer/probe mix, 5 µL ddPCR supermix, 1 µL DTT (300 mM), 2 µL reverse transcriptase, 0.4 µL water, and 9 µL of sample, for a total reaction volume of 20 µL. The RT-ddPCR cycling conditions were as follows: reverse transcription was performed at 50 °C for 60 min, reverse transcriptase deactivation at 95 °C for 10 min and denaturation at 94 °C for 30 s followed by an annealing/extension at 55 °C for 1 min (40 cycles). The final steps included enzyme deactivation at 98 °C for 10 min and droplet stabilization at 4 °C for 30 min, followed by an indefinite hold at 4 °C. Droplet generation and detection were carried out using the Bio-Rad AutoDG Droplet Digital PCR System, and the thresholds between positive and negative droplets were set with QuantaSoft Software and confirmed manually. The limit of quantification (LOQ) was determined according to the manufacturer’s instructions.
RT-ddPCR for the fecal indicator PMMoV was performed using the following conditions: The final concentrations of forward and reverse primers were 500 nM. The PMMoV probe had a final concentration of 250 nM and was FAM labelled. The reaction mix consisted of 1.2 µL of the primer/probe mix, 5 µL ddPCR supermix, 1 µL DTT (300 mM), 2 µL reverse transcriptase, 1.8 µL water, and 9 µL of sample, for a total reaction volume of 20 µL. The RNA sample was diluted 1:1,000 for PMMoV detection. The same cycling conditions as described for IAV and IBV was used.
To check for potential inhibition, the RNA extracts were analyzed at various dilutions. No dilution-dependent shifts in the signal were observed, which confirms the absence of relevant PCR inhibitors. Due to the robustness of ddPCR against inhibitors, no further tests were conducted.
Data on the compliance with MIQE criteria for ddPCR analyses of IAV, IBV, and PMMoV are provided in the Supplementary Material (Supplementary Table S1).
2.5 Data analysis and statistics
In this study, the Friedman test was chosen as a non-parametric alternative to the repeated measures ANOVA, as it is suitable for comparing multiple groups when the assumption of normality is violated. In this study, the data did not meet the assumptions of normal distribution. No data transformation was applied. Therefore, the Friedman test was chosen as a non-parametric alternative (Sheskin, 2003; Hollander et al., 2014). This test ranks the data and assesses differences across related samples, making it particularly suitable for comparing the six investigated methods. Following the Friedman test, the Nemenyi post hoc test was applied to perform multiple comparisons between the groups. The Nemenyi test is a non-parametric test designed to determine which specific groups differ from each other after finding a significant result in the Friedman test (Nemenyi, 1963; Hollander et al., 2014). It adjusts for multiple comparisons, reducing the risk of Type I errors, and is particularly useful for data that violate parametric test assumptions. This combination of tests allowed for a robust and reliable analysis of the method comparison.
A descriptive adjustment was applied to demonstrate the effect that method selection has on detection sensitivity. To this end, a scaling factor was calculated to represent the average difference in detection levels between the most effective method (PYC/EX1) and each alternative combination over the course of the study. This factor was then used to recalculate viral loads, simulating the outcomes if the alternative methods had been used instead of PYC/EX1. This approach is not a predictive or mechanistic model, but rather a descriptive tool that visualizes how differences in method sensitivity translate into apparent changes in detection timing and magnitude. All statistical tests were performed using R version 4.3.1, and p-values below 0.05 were considered significant (*p < 0.05; **p < 0.01; ***p < 0.001). Following packages were used: readxl, dplyr, tidyr, flextable, officer, ggplot2, openxlsx, tidyverse, lubridate, plotrix, ggbreak, gridExtra, svglite.
3 Results
3.1 Method comparison across selected time points
To evaluate the sensitivity and reliability of different wastewater concentration and extraction methods, six method combinations were tested at four selected time points during the winter season 2023/2024. Each method was assessed for its ability to detect IAV, IBV and PMMoV in wastewater samples collected from four wastewater treatment plants (Figure 1). The method combination consisting of PureYield™ filtration and Maxwell® RSC extraction (PYC/EX1) displayed the most successful detection rates with respect to the three viruses among all samples representing four distinct WWTPs.
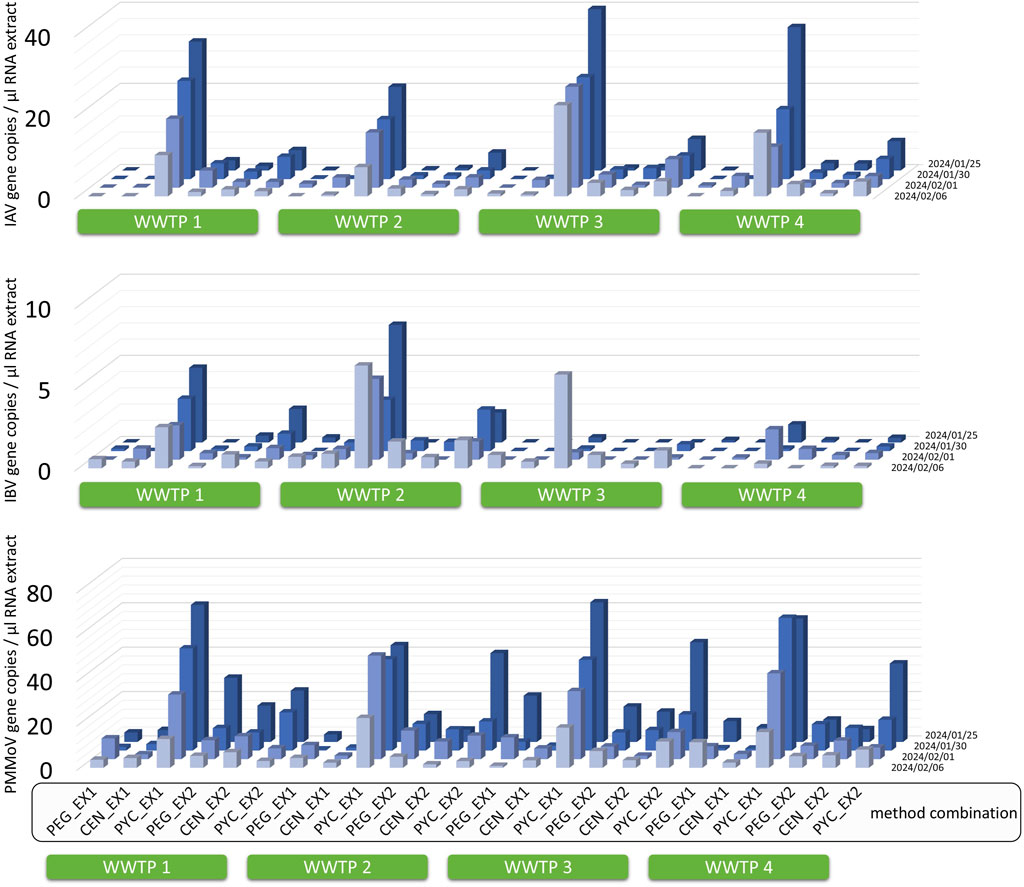
Figure 1. Temporal overview of the concentrations of RNA from the Influenza A virus (IAV), the Influenza B virus (IBV) and the Pepper Mild Mottle Virus (PMMoV) in wastewater. Gene copy numbers obtained using six different combinations of concentration and RNA extraction methods are shown. PEG (polyethylene glycol 8,000 precipitation), CEN (Centricon™ Plus-70 filtration) and PYC (PureYield™ filtration), each combined with either EX1 (RNA extraction using the Maxwell® RSC instrument) or EX2 (RNA extraction using the InnuPure® C16 Touch instrument). Wastewater was collected from four wastewater treatment plants (WWTPs) at four time points during the 2023/24 influenza season. The figure illustrates variability in detection performance across methods, with PMMoV providing a stable faecal marker reference. Key findings are described in more detail in the Results section to facilitate interpretation of this complex dataset.
A more detailed analysis of this comparative method assessment is presented in Figures 2–4. As shown in Figure 2 for IAV, the concentration/extraction combinations PYC/EX1, PYC/EX2, and CEN/EX2 yielded positive results for all 16 tested samples (16/16). In contrast, PEG/EX1, CEN/EX1, and PEG/EX2 detected IAV RNA in 3/16, 10/16, and 15/16 samples, respectively (Figure 2A). The efficiency of the methods was further evaluated by calculating IAV gc/L of wastewater (Figures 2A,B). The concentration methods PEG, CEN, and PYC combined with the extraction method EX2 detected IAV RNA with mean concentrations ranging from 14,356 to 21,371 gc/L, lacking significant differences across the sample set (Figure 2B). However, the combination PYC/EX1 achieved the highest mean concentration (24,872 gc/L), significantly exceeding mean values obtained by the other tested combinations (p < 0.001, Figure 2C). There was no statistically significant difference between EX1 and EX2 when used in combination with PYC (Figure 2C), highlighting the robustness of both extraction methods with this concentration technique.

Figure 2. RT-ddPCR based comparison of Influenza A Virus (IAV) component concentration and RNA extraction from wastewater. (A,B) Number of IAV positive replicates and mean IAV gene copies and standard deviation (SD) for each method combination. Red dots are indicating measurements below limit of detection (LOQ). (C) Results of Nemenyi Post-hoc Test for each method combination; n.s. = not significant, p < 0.05 = significant, p < 0.01 strong significant, p < 0,0001 = very strong significant.
For IBV, the concentration/extraction combinations PYC/EX1 and PYC/EX2 yielded positive results in 12/16 and 11/16 samples, respectively (Figure 3A). Other combinations, such as PEG/EX1, CEN/EX1, and PEG/EX2, achieved fewer positive results, with only 3 to 6 positive samples depending on the combination (Figure 3A). When efficiency was assessed by calculating IBV gc/L of wastewater, the concentration methods PEG, CEN, and PYC combined with EX2 detected IBV RNA with mean concentrations ranging from 5,252 to 7,631 gc/L (Figure 3B). The highest mean concentration (16,270 gc/L), achieved by the combination PYC/EX1, was significantly above those achieved by other combinations, except for PYC/EX2 (p < 0.01, Figure 3C). A general fluctuation in IBV gc across time points was observed, with the lowest or undetectable values associated with the concentration methods PEG and CEN, further emphasizing the reliability of PYC/EX1 and PYC/EX2 for IBV detection.

Figure 3. RT-ddPCR based comparison of Influenza B Virus (IBV) component concentration and RNA extraction from wastewater. (A,B) Number of IBV positive replicates and mean IBV gene copies and standard deviation (SD) for each method combination. Red dots are indicating measurements below limit of detection (LOQ). (C) Results of Nemenyi Post-hoc Test for each method combination; n.s. = not significant, p < 0.05 = significant, p < 0.01 strong significant, p < 0,0001 = very strong significant.
PMMoV was measured as a surrogate virus to serve as a fecal control parameter and to evaluate the functionality and efficiency of the tested combinations. Overall, PMMoV was detected in all 16 wastewater samples across all method combinations (Figure 4). This consistent detection confirms the robustness of the methods and validates their comparability. The mean PMMoV concentrations ranged from 2.6 × 10⁷ gc/L for CEN/EX1 to 1.8 × 10⁸ gc/L for PYC/EX1. Notably, the combination PYC/EX1 yielded the highest average concentrations, with significantly less scatter compared to values achieved by PEG/EX1. The variability observed with PEG/EX1 suggests less consistent recovery efficiency for PMMoV.
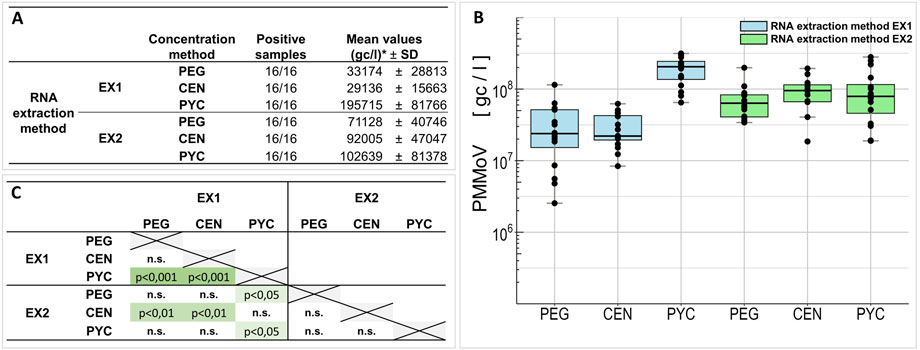
Figure 4. RT-ddPCR based comparison of Pepper Mild Mottle Virus (PMMoV) component concentration and RNA extraction from wastewater. (A,B) Number of PMMoV positive replicates and mean PMMoV gene copies and standard deviation (SD) for each method combination. Red dots are indicating measurements below limit of detection (LOQ). * Values are expressed in thousands. (C) Results of Nemenyi Post-hoc Test for each method combination; n.s. = not significant, p < 0.05 = significant, p < 0.01 strong significant, p < 0,0001 = very strong significant.
Statistical analysis with the Nemenyi post hoc test confirmed significant differences between PYC/EX1 and each of the other methods (p < 0.05), underscoring the advantage of using optimized protocols for detecting low-abundance viral fragments. This comparison provided a robust foundation for selecting PYC/EX1 as the primary method for subsequent analyses. These results highlight the importance of robust methods like PYC/EX1, which not only demonstrated superior performance for IAV and IBV detection but also ensured stable and reliable PMMoV measurements across all samples. The consistent detection of PMMoV across all combinations reinforces its utility as a fecal control in wastewater-based epidemiology.
3.2 Spike experiment to determine the recovery efficiency of Influenza A and B virus
Spike-and-recovery experiments were performed using raw wastewater seeded with inactivated IAV and IBV at three input levels (106, 105, and 104 gc/L) to assess recovery efficiencies across all tested methods. Each condition was analyzed in triplicate and negative controls confirmed the absence of influenza RNA. The results are summarized in Table 2; Figure 5.
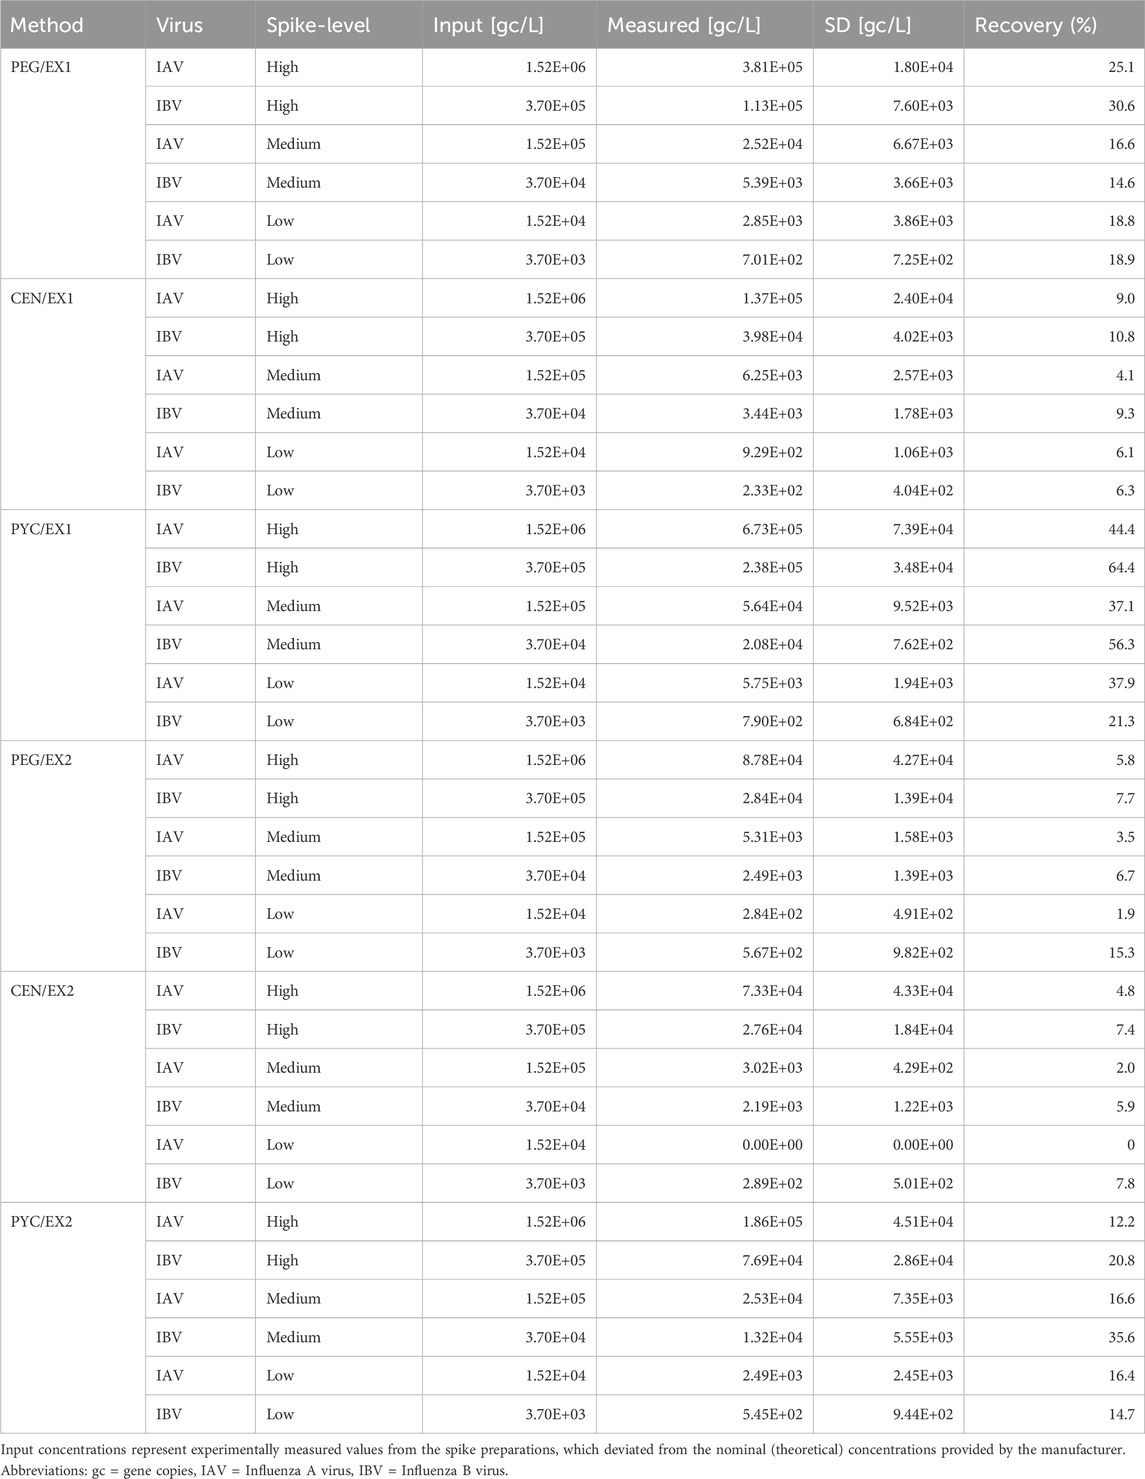
Table 2. Mean values, standard deviation (SD) and recovery rates for Influenza A (IAV) and Influenza B (IBV) obtained from the spike-and-recovery experiments in wastewater.
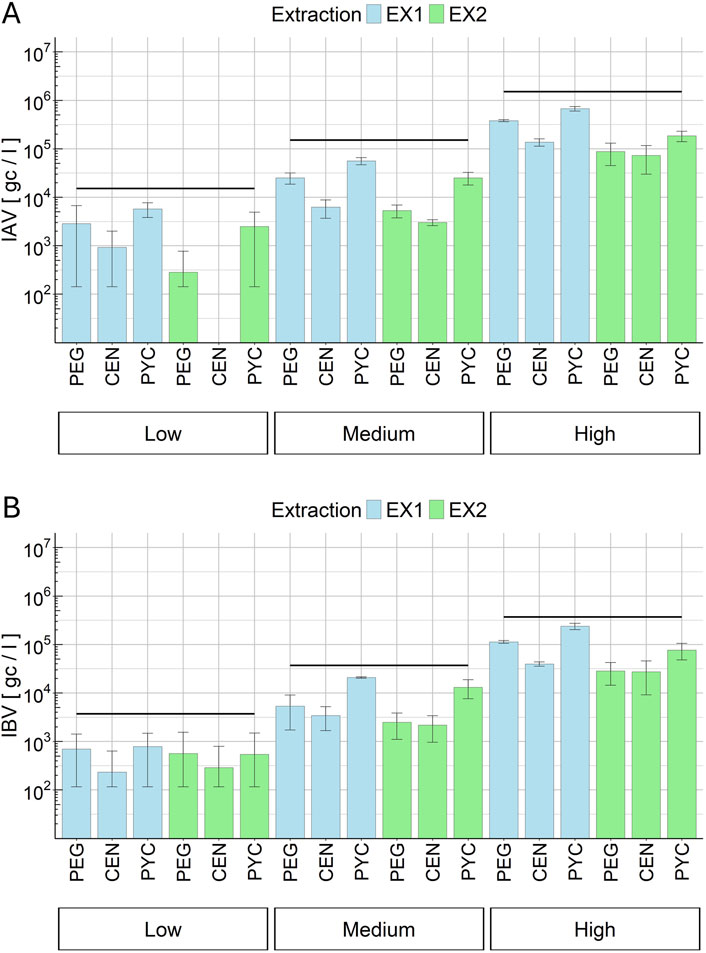
Figure 5. Spike-and-recovery experiments for Influenza A virus (IAV) (A) and Influenza B virus (IBV) (B) in wastewater. Shown are mean recovered genome copies per liter (gc/L) with standard deviations for three spike levels (low: 104, medium: 105, high 106 gc/L). Input concentrations represent experimentally measured values from the spike preparations, which deviated from the nominal (theoretical) concentrations provided by the manufacturer. Black horizontal lines indicate the input concentrations used for comparison. Six method combinations of concentration and extraction were tested: PEG = Polyethylene glycol 8,000 precipitation; CEN = Centricon™ Plus-70 centrifugal filtration; PYC = PureYield™ silica membrane filtration; EX1 = Maxwell® RSC RNA extraction; EX2 = InnuPure® C16 touch RNA extraction.
Recovery rates varied substantially between method combinations, ranging from <1% (CEN/EX2, low spike) to >60% (PYC/EX1, high spike). Overall, the PYC/EX1 method consistently achieved the highest recovery rates for both viruses and all spike levels. This was followed by the PEG/EX1 method and the PYC/EX2 method. In contrast, the CEN-based methods and the EX2 method generally performed poorly. Method-dependent variability was particularly evident at lower spike levels, where some combinations failed to reliably detect influenza RNA. The practical limit of quantification (LOQ) for PYC/EX1 was determined to be 2,261 gc/L, confirming the method’s capability for sensitive detection and quantification in complex wastewater matrices.
In addition, spike experiments in PBS were conducted to assess matrix effects. PYC/EX1 achieved recoveries of 66.5%–83.5% for both IAV and IBV here, while PEG/EX1 showed markedly lower efficiencies (<20%) These results are summarized in Table 3. Compared to these PBS results, recoveries in wastewater were substantially lower, highlighting the significant impact of matrix complexity.
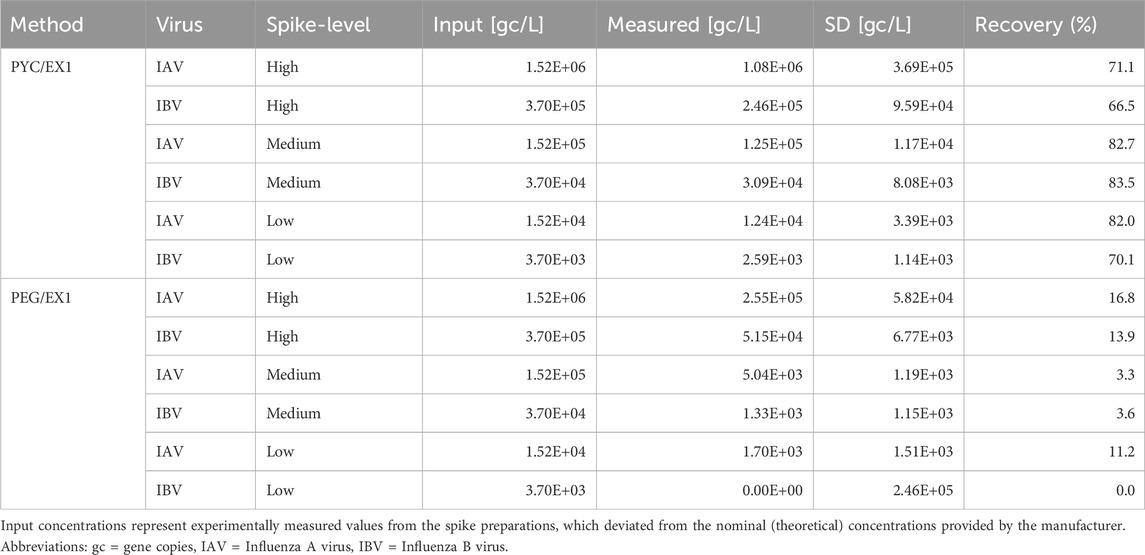
Table 3. Mean values, standard deviation (SD) and recovery rates for Influenza A (IAV) and Influenza B (IBV) obtained from spike-and-recovery experiments in phosphate-buffered saline (PBS).
Overall, these experiments confirm the superior performance of PYC/EX1 and emphasize the importance of careful method selection in WBE applications.
3.3 Viral load trends for IAV, IBV, and PMMoV across the winter season
Using the validated PYC/EX1 method, we monitored viral loads for IAV, IBV, and PMMoV in wastewater throughout the winter season 2023/2024 across four WWTPs located in Mecklenburg Western Pomerania, Germany. Seasonal trends for IAV and IBV in each WWTP are presented in Figure 6 and data for PMMoV are listed in the Supplementary Material (Supplementary Table S3). Periodic increases in viral loads were observed, corresponding to known Influenza peaks during the winter season. These increases were consistent across all WWTPs, with some variation in magnitude, likely reflecting differences in local population size and Influenza activity. PMMoV was consistently detected at high concentrations throughout the monitoring period. The stable presence of PMMoV across all samples confirmed sample integrity and validated the comparability of the data collected across the four WWTPs. For all IAV/IBV analyses, raw data points were included in the graphical representations to provide transparency in the observed values. Loess regression curves with a span of 0.7 were applied to highlight trends over time, balancing smoothing with data fidelity. This approach allowed for reliable and continuous viral monitoring while accounting for day-to-day variability in wastewater viral loads.
![Two line graphs compare virus concentrations from weeks 47 to 21 in 2023/2024. Graph A shows IAV [gc/l], with data points and four trend lines indicating peaks between weeks 51 to 08. Graph B shows IBV [gc/l], with data points and similar trend lines peaking between weeks 02 to 10. Both graphs include a line labeled LOQ at the bottom.](https://www.frontiersin.org/files/Articles/1586893/fenvs-13-1586893-HTML/image_m/fenvs-13-1586893-g006.jpg)
Figure 6. Influenza virus gene copies detected from four wastewater treatment plants in Mecklenburg Western Pomerania, Germany during the influenza season 2023/2024. Each wastewater treatment plant has one color (blue, orange, green or violet). The dots are indicating the calculated gene copies per liter and the lines are calculated by using the LOESS regression. Limit of detection (LOQ) is shown as a grey line. (A) Influenza A virus (IAV) gene copies per liter winter season 2023/2024. (B) Influenza B virus (IAV) gene copies per liter winter season 2023/2024.
3.4 Simulation using factor-based adjustment
To demonstrate the practical implications of using less sensitive method combinations, we made a descriptive adjustment to the observed data. Specifically, we used the average difference between the most sensitive method (PYC/EX1) and each of the other combinations to generate simulated detection curves. These simulations are not intended to represent recovery corrections or predictive models, but rather to serve as a didactic tool highlighting how the choice of method can influence the timing and sensitivity of detection.
Figure 7A1 shows the aggregated detection levels for IAV across the four tested WWTPs. The blue curve shows the actual IAV concentrations measured using PYC/EX1 and smoothed using LOESS regression. The dotted lines show the recalculated concentrations for the other methods (PYC/EX2, PEG/EX2, CEN/EX2, CEN/EX1 and PEG/EX1), based on their mean differences from PYC/EX1. The grey area highlights the range of concentrations that would have been expected if less sensitive methods had been used. A key observation is that the limit of quantification (LOQ) is reached later for the other methods than for PYC/EX1 (see Figure 7A1). Figure 7A2 provides a magnified view that illustrates the earlier rise of IAV detection using PYC/EX1, which occurred approximately 1 week before the second-best method (PYC/EX2).
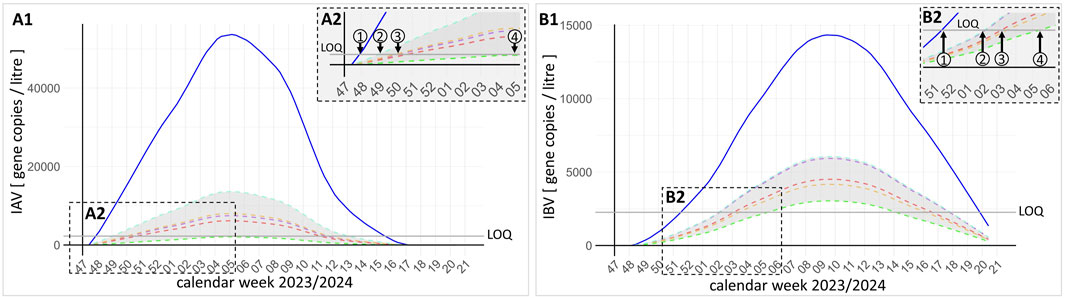
Figure 7. Scaling factor-based simulation of method combination performance compared to the most sensitive protocol (PYC\EX1, PureYield™ Filtration/Maxwell® RSC Instrument RNA extraction). This figure provides a descriptive illustration of methodological differences in detection sensitivity and timing, not a predictive model or correction of recoveries, and not a comparison to clinical data. Shown are Influenza A virus [IAV, (A1)] and Influenza B virus (IBV, (B1)] gene copies aggregated from four wastewater treatment plants in Mecklenburg-Western Pomerania, Germany. The blue line represents LOESS regression of concentrations measured with PYC\EX1. Dashed lines (light blue, violet, red, orange, green) indicate recalculated values for the other tested method combinations. The grey shaded area highlights the range between the second-best and least sensitive method. The horizontal grey line marks the limit of quantification (LOQ). Insets (A2,B2)] show how different methods would cross the LOQ at different times, illustrating the methodological lead in detection achievable with PYC\EX1.
Similar trends were observed for IBV (Figures 7B1, 7B2). The blue line shows the IBV RNA concentrations measured using PYC/EX1, while the dotted lines depict the recalculated concentrations for the other methods. The grey-shaded area again illustrates the variability that would have been observed if less sensitive methods had been used. The grey horizontal line marks the LOQ for PYC/EX1. These simulations highlight that methodological sensitivity directly affects detection timing in wastewater surveillance. While not intended as a quantitative correction, this descriptive exercise emphasises the value of highly sensitive methods, such as PYC/EX1, for early-warning applications.
4 Discussion
Precise and accurate quantification of viral nucleic acid copies in wastewater is essential for the successful application of WBE. Overall, this study highlights the importance of comparing multiple methods to ensure reliable and reproducible results. By systematically evaluating six method combinations, we demonstrated how differences in sensitivity and efficiency can impact the detection and quantification of viral targets, including IAV, IBV, and PMMoV. Comparison of methods is particularly critical for low-abundance targets like IBV, where small variations in sensitivity could lead to false-negative results. Conversely, robust methods are necessary to avoid overestimations and false-positive interpretations for high-abundance targets like PMMoV. This illustrates the need for method validation tailored to specific WBE goals, such as early detection of emerging pathogens or tracking seasonal trends of endemic viruses. Ultimately, the careful selection and comparison of methods help to minimize uncertainties and to ensure that WBE systems can reliably detect viral signals at an early stage, enabling timely public health interventions.
4.1 Method combination performance
Comparison of methods for virus detection in wastewater has been a key focus in WBE research. Numerous studies have evaluated individual methods for virus concentration and extraction, particularly in the context of emerging pathogens like SARS-CoV-2 (Dumke et al., 2021; Forés et al., 2021; Pearson et al., 2021; Othman et al., 2023; Antkiewicz et al., 2024). However, limited data exist on the performance of method combinations, which integrate both concentration and extraction steps, and their impact on the detection of specific viral targets. The inclusion of both IAV and IBV as targets addresses a critical gap in the existing literature, as most prior studies have focused on high-abundance surrogate markers or emerging pathogens with higher stability (Farkas et al., 2020; Boehm et al., 2023). Some studies have begun to fill important knowledge gaps and have shown promising results for the detection of IAV and IBV in wastewater (Mercier et al., 2022; Zafeiriadou et al., 2024; Mancini et al., n.d.). Building on previous studies that evaluated individual methods, our study highlights that comparing method combinations is crucial to understanding how different protocols influence detection sensitivity, recovery efficiency, and overall reliability, particularly for low-abundance targets like e.g., IBV (Dlamini et al., 2024). By investigating six different method combinations, this study aims to identify protocols that provide robust and consistent results, minimize false negatives, and ensure accurate viral quantification. We chose these combinations of methods because they are already used in the nationwide wastewater surveillance for SARS-CoV-2 in Germany (Dumke et al., 2022; Marquar et al., 2024). The evaluation of such methods is important to ensure the reliability of the detection methods and to minimize inaccuracies in terms of precision and accuracy. Furthermore, this comparison is especially important for developing early-warning systems that rely on precise and timely detection of viral signals in wastewater, enabling public health measures such as targeted vaccination campaigns to be implemented within the calculated time frame.
The results across all three targets - IAV, IBV, and PMMoV - consistently show that PYC-based methods outperform both PEG and CEN combinations tested in this study. This trend holds true across both extraction protocols (EX1 and EX2), but the most striking performance was observed with PYC/EX1, which consistently yielded the highest recovery rates and the most reliable results for all targets. The superior performance of PYC methods may reflect their ability to efficiently concentrate viral particles while minimizing the loss of RNA during the concentration step. This is particularly critical for low-abundance targets like IBV, where even minor losses can result in concentrations near or below the detection limit. The consistent results for PMMoV across all methods highlight its robustness as a process control but also demonstrates the relative challenges associated with influenza virus detection. In contrast, PEG and CEN methods showed reduced recovery rates, particularly for IBV. This finding contrasts with previous studies where PEG precipitation has been highlighted as a robust method for viral concentration (Dumke et al., 2022; Farkas et al., 2022). However, PEG precipitation protocols vary considerably across studies in terms of incubation time, temperature and processed sample volume, leading to notable differences in reported recovery rates. In the present study, we applied a widely used and previously published protocol (Dumke et al., 2021) to ensure comparability and manageability given the large number of samples processed. We acknowledge that alternative variants, including overnight incubation at 4 °C, could enhance recovery efficiency and should be considered in future optimization efforts. The reduced performance observed here could stem from target-specific challenges, such as the fragility of influenza viruses or matrix-specific inhibitors that affect PEG efficiency in these samples. While no significant differences between EX1 and EX2 were observed for IAV and IBV, the findings for PMMoV indicate that EX1 can outperform EX2 in certain scenarios. The higher recovery rates observed with PYC/EX1 compared to PYC/EX2 highlight the potential impact of subtle differences in extraction protocols, such as lysis efficiency, inhibitor removal, or elution conditions as discussed before (Ahmed et al., 2021; Barril et al., 2021; Gouthro et al., 2024; Linzner et al., 2024).
Across all targets, PYC/EX1 provided the highest sensitivity and recovery efficiency, making it the optimal choice for WBE applications. The significant advantage of PYC/EX1 over PYC/EX2 for PMMoV also highlights its broader utility for robust virus detection. The observed difference between PYC/EX1 and PYC/EX2 for PMMoV suggests that even small adjustments in extraction protocols can affect recovery efficiency. Laboratories should validate extraction protocols not only for target sensitivity but also for consistency across multiple viral markers. The reduced performance of PEG and CEN methods reinforces the need for optimization, particularly for low-abundance or fragile targets. While these methods remain viable for high-abundance targets like PMMoV, their limitations should be carefully considered in WBE workflows.
In addition to the experimental recovery data, we conducted a factor-based simulation (see Figure 7) to demonstrate the impact of methodological variations on the apparent timing of detection in wastewater surveillance. This approach is not a predictive model, but rather a descriptive tool that highlights the relative sensitivity gaps between methods. The simulation shows that using less sensitive methods could delay detection by up to 2 weeks compared to PYC/EX1. While the absolute values should not be overinterpreted, this exercise emphasises the practical importance of method selection when WBE is used for early-warning applications.
4.2 Spike experiment and sensitivity validation
The spike-and-recovery experiments conducted in this study serve as a critical validation tool for assessing the reliability of concentration and extraction methods in WBE. Recovery rates across all tested method combinations for IAV and IBV varied widely, from <1% to >60%, depending on the method and spike level. This highlights pronounced method-dependent variability and underscores the importance of selecting appropriate workflows for robust influenza detection. PYC/EX1 consistently achieved the highest recovery rates across both viruses and all spike levels, whereas CEN-based methods and EX2 protocols generally performed poorly.
To further assess the influence of sample matrix, spike experiments were also conducted in PBS. Under these simplified conditions, PYC/EX1 achieved recoveries of 66%–84% for both IAV and IBV, while PEG/EX1 remained markedly lower (<20%). Compared to PBS, recoveries in wastewater were substantially reduced, clearly demonstrating the strong effect of matrix complexity on viral detection. This matrix dependency emphasizes that recovery rates obtained under idealized conditions may overestimate actual performance in real-world wastewater samples.
The observed variability is consistent with prior studies on other RNA viruses in wastewater, such as SARS-CoV-2, which have shown recovery efficiencies typically ranging from 4% to approximately 100% depending on the method and matrix (Dumke et al., 2021; Fonseca et al., 2022; Zheng et al., 2022; Toribio-Avedillo et al., 2023; 2024). For influenza viruses, the relatively fragile nature of the RNA genome and their lower abundance compared to fecal markers like PMMoV further accentuate these challenges. The recovery rates observed here demonstrates the robustness of the evaluated protocol for detecting low-abundance targets like influenza viruses. However, variability in recovery rates across spike levels highlights the influence of sample matrix and methodological details, such as the efficiency of lysis and RNA extraction steps. While these recovery rates are suitable for quantitative applications, they also point to the need for caution in interpreting absolute viral concentrations. Differences in recovery efficiency can lead to under- or overestimations of viral loads, which must be accounted for when drawing conclusions about viral prevalence or trends. The practical implications of these findings for WBE applications are significant. Reliable recovery ensures that even low concentrations of viral RNA, such as those observed for IBV in this study, can be detected and quantified. Ensuring sensitivity at low viral loads is a key aspect of wastewater-based early-warning systems, as it enables more timely and effective public health responses. However, the variability observed also reinforces the importance of integrating recovery controls and standardized protocols into routine surveillance workflows to minimize uncertainties. From a comparative perspective, these results contribute to a growing body of evidence emphasizing the importance of method validation for each target virus. While surrogate viruses like PMMoV offer valuable process controls, their recovery efficiencies do not necessarily predict the performance of methods for other targets. The distinct challenges posed by influenza viruses, including their lower abundance and RNA stability in wastewater, highlight the need for tailored validation studies to ensure that methods are fit for purpose. In conclusion, the spike-and-recovery experiments not only confirm the feasibility of detecting influenza viruses in wastewater but also illustrate the significant role of sample matrix and protocol choice in shaping recovery outcomes. Continuous method refinement and careful data interpretation are therefore essential when using WBE for early-warning or quantitative assessments of influenza trends.
4.3 Public health implications
The findings of this study highlight the critical need to select and validate method combinations for WBE, especially when targeting temporarily low-frequency viruses like IAV and IBV. PYC/EX1 emerged as the most reliable and sensitive method across all tested targets, but the observed variability among other combinations highlights the necessity of tailoring methods to specific surveillance objectives. Such findings emphasize the critical role of early detection in public health planning and intervention. Additionally, timely detection enables public health advisories to be issued to healthcare providers and communities, raising awareness and promoting preventative measures (Gahlot et al., 2023). Furthermore, early warning systems facilitate the prioritization of medical and logistical resources, ensuring that regions showing signs of increasing viral loads are adequately prepared to manage potential outbreaks (Clark et al., 2023; Grassly et al., 2025). The observed variability in performance among the tested method combinations highlights the need for further research to improve the reliability and applicability of WBE. First, traditional concentration methods such as PEG precipitation and Centricon filtration require optimization to enhance their efficiency for low-abundance targets like IAV and IBV. This could involve integrating additional steps, such as enzymatic lysis or improved buffer formulations, to increase RNA recovery rates and reduce variability. Second, high-performing methods like PYC/EX1, which demonstrated consistent sensitivity and reliability in this study, should be validated across diverse wastewater matrices and environmental conditions. Such validation would ensure that these methods perform robustly in different geographical and operational contexts, supporting their broader implementation in WBE programs. Finally, the development of standardized protocols is essential to improve the comparability of WBE data across regions and studies. Standardization would facilitate more accurate meta-analyses, enhance data integration, and provide a clearer picture of viral trends at local, national, and global levels. By addressing these challenges, WBE can evolve into an even more reliable and impactful tool for public health surveillance.
In conclusion, this study builds upon previous research in the field of wastewater-based epidemiology by offering the first systematic comparison of various methods for detecting both Influenza A and B viruses. Unlike previous studies, which primarily focused on SARS-CoV-2 or surrogate markers, our research demonstrates that the choice of concentration–extraction protocol significantly impacts recovery efficiency, sensitivity and, consequently, the timeliness of detection. By incorporating spike-and-recovery experiments in both wastewater and PBS, we quantified the impact of matrix complexity on viral recovery. Together, these findings emphasise the distinctive methodological challenges of influenza WBE and establish a solid foundation of evidence for selecting dependable protocols in future surveillance efforts.
Data availability statement
The original contributions presented in the study are included in the article/Supplementary Material, further inquiries can be directed to the corresponding author.
Author contributions
TF: Conceptualization, Data curation, Formal Analysis, Investigation, Methodology, Validation, Visualization, Writing – original draft, Writing – review and editing. EZ: Data curation, Formal Analysis, Investigation, Methodology, Writing – review and editing. SS: Formal Analysis, Investigation, Methodology, Writing – review and editing. AA: Formal Analysis, Investigation, Methodology, Writing – review and editing. BS: Methodology, Writing – review and editing. ML: Project administration, Writing – review and editing. UB: Funding acquisition, Project administration, Writing – review and editing. TG: Funding acquisition, Project administration, Writing – review and editing. JS: Funding acquisition, Project administration, Writing – review and editing. HCS: Conceptualization, Methodology, Writing – review and editing. BW: Conceptualization, Funding acquisition, Project administration, Supervision, Validation, Visualization, Writing – original draft, Writing – review and editing. RK: Conceptualization, Supervision, Validation, Visualization, Writing – original draft, Writing – review and editing.
Funding
The author(s) declare that financial support was received for the research and/or publication of this article. This work was funded and supported by the German Federal Ministry of Health as part of the project “Abwassermonitoring für die epidemiologische Lagebewertung” (AMELAG).
Acknowledgments
We sincerely appreciate the support of the wastewater treatment plant operators and staff for providing the wastewater samples, with special thanks to the wastewater disposal companies in Mecklenburg-Vorpommern - Nordwasser GmbH Rostock, Schweriner Abwasserentsorgung Eigenbetrieb der Landeshauptstadt Schwerin, Neubrandenburger Wasserbetriebe GmbH, and Abwasserwerk Greifswald, Eigenbetrieb der Universitäts-und Hansestadt Greifswald. In addition, we would especially like to thank our RKI colleagues Udo Buchholz and Susan Abunjiela for their useful comments and advice and our UBA colleagues Cristina J. Saravia and Alexander Kerndorff for their help with providing the samples for the recovery rate experiments. We would like to thank the entire AMELAG team for the fruitful discussions and helpful input.
Conflict of interest
The authors declare that the research was conducted in the absence of any commercial or financial relationships that could be construed as a potential conflict of interest.
Generative AI statement
The author(s) declare that no Generative AI was used in the creation of this manuscript.
Any alternative text (alt text) provided alongside figures in this article has been generated by Frontiers with the support of artificial intelligence and reasonable efforts have been made to ensure accuracy, including review by the authors wherever possible. If you identify any issues, please contact us.
Publisher’s note
All claims expressed in this article are solely those of the authors and do not necessarily represent those of their affiliated organizations, or those of the publisher, the editors and the reviewers. Any product that may be evaluated in this article, or claim that may be made by its manufacturer, is not guaranteed or endorsed by the publisher.
Supplementary material
The Supplementary Material for this article can be found online at: https://www.frontiersin.org/articles/10.3389/fenvs.2025.1586893/full#supplementary-material
References
Ahmed, W., Bivins, A., Simpson, S. L., Smith, W. J. M., Metcalfe, S., McMinn, B., et al. (2021). Comparative analysis of rapid concentration methods for the recovery of SARS-CoV-2 and quantification of human enteric viruses and a sewage-associated marker gene in untreated wastewater. Sci. Total Environ. 799, 149386. doi:10.1016/j.scitotenv.2021.149386
Antkiewicz, D. S., Janssen, K. H., Roguet, A., Pilch, H. E., Fahney, R. B., Mullen, P. A., et al. (2024). Wastewater-based protocols for SARS-CoV-2: insights into virus concentration, extraction, and quantitation methods from two years of public health surveillance. Environ. Sci. Water Res. and Technol. 10, 1766–1784. doi:10.1039/D3EW00958K
Barril, P. A., Pianciola, L. A., Mazzeo, M., Ousset, M. J., Jaureguiberry, M. V., Alessandrello, M., et al. (2021). Evaluation of viral concentration methods for SARS-CoV-2 recovery from wastewaters. Sci. Total Environ. 756, 144105. doi:10.1016/j.scitotenv.2020.144105
Boehm, A. B., Hughes, B., Duong, D., Chan-Herur, V., Buchman, A., Wolfe, M. K., et al. (2023). Wastewater concentrations of human influenza, metapneumovirus, parainfluenza, respiratory syncytial virus, rhinovirus, and seasonal coronavirus nucleic-acids during the COVID-19 pandemic: a surveillance study. Lancet Microbe 4, e340–e348. doi:10.1016/S2666-5247(22)00386-X
Carmo dos Santos, M., Cerqueira Silva, A. C., dos Reis Teixeira, C., Pinheiro Macedo Prazeres, F., Fernandes dos Santos, R., de Araújo Rolo, C., et al. (2024). Wastewater surveillance for viral pathogens: a tool for public health. Heliyon 10, e33873. doi:10.1016/j.heliyon.2024.e33873
Cheshomi, N., Alum, A., Smith, M. F., Lim, E. S., Conroy-Ben, O., and Abbaszadegan, M. (2024). Viral concentration method biases in the detection of viral profiles in wastewater. Appl. Environ. Microbiol. 0, e01339-24–24. doi:10.1128/aem.01339-24
Clark, J. R., Terwilliger, A., Avadhanula, V., Tisza, M., Cormier, J., Javornik-Cregeen, S., et al. (2023). Wastewater pandemic preparedness: toward an end-to-end pathogen monitoring program. Front. Public Health 11, 1137881. doi:10.3389/fpubh.2023.1137881
Dlamini, M., Msolo, L., Ebomah, K. E., Nontongana, N., and Okoh, A. I. (2024). A systematic review on the incidence of influenza viruses in wastewater matrices: implications for public health. PLOS ONE 19, e0291900. doi:10.1371/journal.pone.0291900
Dumke, R., de la Cruz Barron, M., Oertel, R., Helm, B., Kallies, R., Berendonk, T. U., et al. (2021). Evaluation of two methods to concentrate SARS-CoV-2 from untreated wastewater. Pathogens 10, 195. doi:10.3390/pathogens10020195
Dumke, R., Geissler, M., Skupin, A., Helm, B., Mayer, R., Schubert, S., et al. (2022). Simultaneous detection of SARS-CoV-2 and influenza virus in wastewater of two cities in southeastern Germany, January to may 2022. Int. J. Environ. Res. Public Health 19, 13374. doi:10.3390/ijerph192013374
Farkas, K., Walker, D. I., Adriaenssens, E. M., McDonald, J. E., Hillary, L. S., Malham, S. K., et al. (2020). Viral indicators for tracking domestic wastewater contamination in the aquatic environment. Water Res. 181, 115926. doi:10.1016/j.watres.2020.115926
Farkas, K., Pellett, C., Alex-Sanders, N., Bridgman, M. T. P., Corbishley, A., Grimsley, J. M. S., et al. (2022). Comparative assessment of Filtration- and precipitation-based methods for the concentration of SARS-CoV-2 and other viruses from wastewater. Microbiol. Spectr. 10, e01102-22. doi:10.1128/spectrum.01102-22
Fonseca, M. S., Machado, B. A. S., Rolo, C. de A., Hodel, K. V. S., Almeida, E. dos S., and de Andrade, J. B. (2022). Evaluation of SARS-CoV-2 concentrations in wastewater and river water samples. Case Stud. Chem. Environ. Eng. 6, 100214. doi:10.1016/j.cscee.2022.100214
Forés, E., Bofill-Mas, S., Itarte, M., Martínez-Puchol, S., Hundesa, A., Calvo, M., et al. (2021). Evaluation of two rapid ultrafiltration-based methods for SARS-CoV-2 concentration from wastewater. Sci. Total Environ. 768, 144786. doi:10.1016/j.scitotenv.2020.144786
Gahlot, P., Alley, K. D., Arora, S., Das, S., Nag, A., and Tyagi, V. K. (2023). Wastewater surveillance could serve as a pandemic early warning system for COVID-19 and beyond. WIREs Water 10, e1650. doi:10.1002/wat2.1650
Gouthro, M., Hayes, E. K., and Gagnon, G. A. (2024). Maximizing viral nucleic acid yield from passive samplers: evaluating elution and extraction protocols. Sci. Total Environ. 957, 177834. doi:10.1016/j.scitotenv.2024.177834
Grassly, N. C., Shaw, A. G., and Owusu, M. (2025). Global wastewater surveillance for pathogens with pandemic potential: opportunities and challenges. Lancet Microbe 6, 100939. doi:10.1016/j.lanmic.2024.07.002
Hammond, A., Kim, J. J., Sadler, H., and Vandemaele, K. (2022). Influenza surveillance systems using traditional and alternative sources of data: a scoping review. Influenza Other Respir. Viruses 16, 965–974. doi:10.1111/irv.13037
Harrington, W. N., Kackos, C. M., and Webby, R. J. (2021). The evolution and future of influenza pandemic preparedness. Exp. Mol. Med. 53, 737–749. doi:10.1038/s12276-021-00603-0
Hollander, M., Douglas, A., and Chicken, E. (2014). Nonparametric statistical methods. John Wiley and Sons.
Kilaru, P., Hill, D., Anderson, K., Collins, M. B., Green, H., Kmush, B. L., et al. (2023). Wastewater surveillance for infectious disease: a systematic review. Am. J. Epidemiol. 192, 305–322. doi:10.1093/aje/kwac175
Kramarsky-Winter, E., Yaniv, K., and Kushmaro, A. (2023). Editorial: wastewater-Based epidemiology as a tool for monitoring public health. Front. Water 5, 1283810. doi:10.3389/frwa.2023.1283810
Li, Z., Meng, F., Wu, B., Kong, D., Geng, M., Qiu, X., et al. (2024). Reviewing the progress of infectious disease early warning systems and planning for the future. BMC Public Health 24, 3080. doi:10.1186/s12889-024-20537-2
Linzner, N., Bartel, A., Schumacher, V., Grau, J. H., Wyler, E., Preuß, H., et al. (2024). Effective inhibitor removal from wastewater samples increases sensitivity of RT-dPCR and sequencing analyses and enhances the stability of wastewater-based surveillance. Microorganisms 12, 2475. doi:10.3390/microorganisms12122475
Maida, C. M., Mazzucco, W., Priano, W., Palermo, R., Graziano, G., Costantino, C., et al. (2024). Detection of influenza virus in urban wastewater during the season 2022/2023 in sicily, Italy. Front. Public Health 12, 1383536. doi:10.3389/fpubh.2024.1383536
Mancini, P., Brandtner, D., Veneri, C., Bonanno Ferraro, G., Iaconelli, M., Puzelli, S., et al. (n.d.). Evaluation of trends in influenza A and B viruses in wastewater and human surveillance data: insights from the 2022–2023 season in Italy. Food Environ. Virology 17, 6. doi:10.1007/s12560-024-09622-2
Markt, R., Stillebacher, F., Nägele, F., Kammerer, A., Peer, N., Payr, M., et al. (2023). Expanding the pathogen panel in wastewater epidemiology to influenza and norovirus. Viruses 15, 263. doi:10.3390/v15020263
Marquar, N., Pütz, P., Buchholz, U., Exner, T., Fretschner, T., Greiner, T., et al. (2024). SARS-CoV-2-Abwassersurveillance in Deutschland im Rahmen des Projekts AMELAG. doi:10.25646/12208
Mercier, E., D’Aoust, P. M., Thakali, O., Hegazy, N., Jia, J.-J., Zhang, Z., et al. (2022). Municipal and neighbourhood level wastewater surveillance and subtyping of an influenza virus outbreak. Sci. Rep. 12, 15777. doi:10.1038/s41598-022-20076-z
Montgomery, M. P., Morris, S. E., Rolfes, M. A., Kittikraisak, W., Samuels, A. M., Biggerstaff, M., et al. (2024). The role of asymptomatic infections in influenza transmission: what do we really know. Lancet Infect. Dis. 24, e394–e404. doi:10.1016/S1473-3099(23)00619-9
Nadeau, S., Devaux, A. J., Bagutti, C., Alt, M., Hampe, E. I., Kraus, M., et al. (2024). Influenza transmission dynamics quantified from RNA in wastewater in Switzerland. Swiss Med. Wkly. 154, 3503. doi:10.57187/s.3503
Nemenyi, P. B. (1963). Distribution-free multiple comparisons. Princeton University. Available online at: https://catalog.princeton.edu/catalog/9920813653506421 (Accessed January 17, 2025).
Othman, I., Helmi, A., Slama, I., Hamdi, R., Mastouri, M., and Aouni, M. (2023). Evaluation of three viral concentration methods for detection and quantification of SARS-CoV-2 in wastewater. J. Water Health 21, 354–360. doi:10.2166/wh.2023.264
Pearson, J. D., Trcka, D., Lu, S., Hyduk, S. J., Jen, M., Aynaud, M.-M., et al. (2021). Comparison of SARS-CoV-2 indirect and direct RT-qPCR detection methods. Virology J. 18, 99. doi:10.1186/s12985-021-01574-4
Roldan-Hernandez, L., Oost, C. V., and Boehm, B. (2025). Solid–liquid partitioning of Dengue, west nile, Zika, hepatitis A, influenza A, and SARS-CoV-2 viruses in wastewater from across the USA. Environ. Sci. Water Res. and Technol. 11, 88–99. doi:10.1039/D4EW00225C
Saravia, C. J., Pütz, P., Wurzbacher, C., Uchaikina, A., Drewes, J. E., Braun, U., et al. (2024). Wastewater-based epidemiology: deriving a SARS-CoV-2 data validation method to assess data quality and to improve trend recognition. Front. Public Health 12, 1497100. doi:10.3389/fpubh.2024.1497100
Schoen, M. E., Bidwell, A. L., Wolfe, M. K., and Boehm, A. B. (2023). United States influenza 2022–2023 season characteristics as inferred from Wastewater Solids, influenza hospitalization, and syndromic data. Environ. Sci. Technol. 57, 20542–20550. doi:10.1021/acs.est.3c07526
Sederdahl, B. K., and Williams, J. V. (2020). Epidemiology and clinical characteristics of influenza C virus. Viruses 12, 89. doi:10.3390/v12010089
Sheskin, D. J. (2003). Handbook of parametric and nonparametric statistical procedures: third edition. 3rd Edn. New York: Chapman and Hall/CRC. doi:10.1201/9781420036268
Toribio-Avedillo, D., Gómez-Gómez, C., Sala-Comorera, L., Rodríguez-Rubio, L., Carcereny, A., García-Pedemonte, D., et al. (2023). Monitoring influenza and respiratory syncytial virus in wastewater. Beyond COVID-19. Sci. Total Environ. 892, 164495. doi:10.1016/j.scitotenv.2023.164495
Toribio-Avedillo, D., Gómez-Gómez, C., Sala-Comorera, L., Galofré, B., and Muniesa, M. (2024). Adapted methods for monitoring influenza virus and respiratory syncytial virus in sludge and wastewater. Sci. Total Environ. 918, 170636. doi:10.1016/j.scitotenv.2024.170636
White, S. K., Ma, W., McDaniel, C. J., Gray, G. C., and Lednicky, J. A. (2016). Serologic evidence of exposure to influenza D virus among persons with occupational contact with cattle. J. Clin. Virology 81, 31–33. doi:10.1016/j.jcv.2016.05.017
WHO (2019). Ten health issues WHO will tackle this year. Available online at: https://www.who.int/news-room/spotlight/ten-threats-to-global-health-in-2019 (Accessed September 20, 2024).
Zafeiriadou, A., Kaltsis, L., Thomaidis, N. S., and Markou, A. (2024). Simultaneous detection of influenza A, B and respiratory syncytial virus in wastewater samples by one-step multiplex RT-ddPCR assay. Hum. Genomics 18, 48. doi:10.1186/s40246-024-00614-8
Zheng, X., Deng, Y., Xu, X., Li, S., Zhang, Y., Ding, J., et al. (2022). Comparison of virus concentration methods and RNA extraction methods for SARS-CoV-2 wastewater surveillance. Sci. Total Environ. 824, 153687. doi:10.1016/j.scitotenv.2022.153687
Keywords: influenza virus, wastewater-based epidemiology, recovery efficiency, method performance, method evaluation, wastewater, ddPCR, early detection (of emerging pathogens)
Citation: Fretschner T, Zeisler EE, Scheller S, Aurenz A, Schneider B, Lukas M, Braun U, Greiner T, Schumacher J, Selinka HC, Walther B and Kallies R (2025) Comparative assessment of combined concentration and extraction methods for Influenza A and B virus detection in wastewater. Front. Environ. Sci. 13:1586893. doi: 10.3389/fenvs.2025.1586893
Received: 03 March 2025; Accepted: 27 August 2025;
Published: 15 September 2025.
Edited by:
Michael Gormley, Heriot-Watt University, United KingdomReviewed by:
Roberto Rodriguez, Indiana University, United StatesDavey Jones, Bangor University, United Kingdom
Copyright © 2025 Fretschner, Zeisler, Scheller, Aurenz, Schneider, Lukas, Braun, Greiner, Schumacher, Selinka, Walther and Kallies. This is an open-access article distributed under the terms of the Creative Commons Attribution License (CC BY). The use, distribution or reproduction in other forums is permitted, provided the original author(s) and the copyright owner(s) are credited and that the original publication in this journal is cited, in accordance with accepted academic practice. No use, distribution or reproduction is permitted which does not comply with these terms.
*Correspondence: Till Fretschner, dGlsbC5mcmV0c2NobmVyQHViYS5kZQ==; René Kallies, cmVuZS5rYWxsaWVzQHViYS5kZQ==
†These authors share last authorship