 Yuanxiao Hong
 Lindong Ma
 Song Kang4
- 1College of Textile Science and Engineering, Zhejiang Sci-Tech University, Hangzhou, China
- 2Xingzhi College, Zhejiang Normal University, Jinhua, China
- 3School of Management, Zhejiang University of Technology, Hangzhou, China
- 4College of Economics and Management, Zhejiang Sci-Tech University, Hangzhou, China
As the world’s largest producer, consumer, and exporter of textiles and apparel, China plays a pivotal role in the carbon emission reduction of the industry. This paper employs the “Tapio” decoupling model to analyze the decoupling relationship between carbon emissions and economic growth in China’s textile industry across 30 provinces from 2001 to 2020. The LMDI model is then used to decompose the influencing factors of carbon emissions, followed by a comparative study of four distinct periods and three regions. The findings reveal that: (1) From 2001 to 2020, both carbon emissions and GDP growth in China’s textile industry exhibited a “rise then decline” trend. Carbon emissions primarily stemmed from coal consumption, followed by gasoline and natural gas. The energy structure had been gradually optimized, with the shares of coal and gasoline in total consumption declining, while the share of natural gas has increased. (2) Carbon emissions in China’s textile industry had achieved strong decoupling from economic growth over the 20-year study period. The decoupling status at different periods was as follows: weak decoupling (2001–2005), weak decoupling (2006–2010), strong decoupling (2011–2015), and weak negative decoupling (2016–2020). Comparing different regions, Central China exhibited strong decoupling, while East China and West China both experienced weak decoupling. (3) Per capita output value was the main driving factor behind the growth of carbon emissions, while energy consumption intensity factor played the most significant role in inhibiting emissions. Additionally, employment scale factor promoted carbon emissions in the first two periods but significantly suppressed them in the last two periods. The energy structure factor gradually strengthened its suppressive effect on carbon emissions, although its overall impact remained limited. Finally, based on these findings, feasible and practical policy recommendations are proposed.
1 Introduction
Under the severe challenge of global climate change, reducing greenhouse gas emissions and promoting green and low-carbon development have become the shared consensus and guiding principles for the international community. As a key pillar of the global economy, the textile industry not only meets basic human needs and enhances quality of life, but is also a major contributor to energy consumption and carbon emissions. Due to the complexity of the textile supply chain, extensive energy consumption occurs throughout the production process, from raw material sourcing and textile manufacturing to the transportation of fabrics and apparel. Additionally, the high energy intensity of textile production itself makes the industry a significant emitter, which contributes about 10% of global greenhouse gas emissions (UNFCCC, 2025). As the world’s largest producer, consumer, and exporter of textiles and apparel, China plays a pivotal role in the international textile industry (Peng et al., 2022). Data from the China National Textile and Apparel Council (CNTAC) and other organizations indicate that China’s textile and apparel sector emits approximately 230 million tons of greenhouse gases annually (Liu, 2024), accounting for about 2% of the country’s total emissions. For years, China’s textile industry has faced enormous pressure to improve energy efficiency and reduce emissions (Li et al., 2022).
In China, the textile industry is a cornerstone of the national economy and social development, a vital sector for improving livelihoods and enhancing the quality of life, as well as a key player in international cooperation and integration. In 2020, the revenue of industrial enterprises above a designated size in China’s textile industry (including textile and apparel industry) reached approximately 3.73 trillion CNY, nearly 4.78 times the figure in 2001, while exports amounted to approximately 276 billion USD, accounting for 35.6% of global textile exports in that year (Leal Filho et al., 2022). The textile industry’s position in the industrial economy has been declining in recent years, with its share in industrial sectors dropping from 8.13% in 2001 to 3.5% in 2020. Its ranking also fell sharply from 5th to 16th (Zhang J. L. et al., 2024). In 2024, the total operating revenue of 38,000 large-scale textile enterprises nationwide increased by 4% year-on-year, marking a 4.8% rebound compared to the previous year. According to data from the National Bureau of Statistics, the capacity utilization rate of China’s textile industry reached 78.5% in 2024, representing an increase of 2.1% over the previous year. The figure is higher than the national industrial average of 75% for the same period. Over the past 2 decades, China’s textile industry has seen significant changes in its carbon emissions. Zhuo and Cai (2014) proved that from 2000 to 2012, carbon emissions in China’s textile and apparel sector more than doubled, although carbon emission intensity decreased. Wang and Liu (2020) observed that after 2012, carbon emissions from the garment manufacturing sector stabilized, though there was no significant reduction. The energy consumption structure has been optimized, with the share of fossil energy consumption, such as raw coal, decreasing. Huang and Zhang (2024) found that from 2012 to 2021, the carbon emissions of the three sub-sectors showed a similar fluctuation trend to the industry as a whole, with the textile sub-sector having the greatest impact on the overall carbon emissions of the industry.
As the world’s largest emitter of carbon, China has taken on the responsibility of addressing climate change. In September 2020, President Xi Jinping proposed the “dual carbon goals”: peaking carbon emissions by 2030 and achieving carbon neutrality by 2060. As a pillar of the Chinese economy, the textile industry plays a crucial role in the country’s green transformation (Wei et al., 2023). During the “13th Five-Year Plan” period, China’s textile industry made remarkable progress in green development. The energy structure continued to optimize, with secondary energy accounting for 72.5% of total energy use. Energy efficiency improved, with comprehensive energy consumption per ten thousand yuan of output dropping by 25.5% (14th Five-Year Plan for The Development of The Textile Industry, 2021). By 2020, most of China’s textile industry indicators had reached, or even surpassed, global advanced levels, establishing the most comprehensive modern textile manufacturing system in the world. In June 2021, the Chinese government released the “14th Five-Year Plan for the Development of the Textile Industry,” aiming to elevate the industry’s green development to new heights. Specific targets were set, with a few key examples listed as follows: by the end of the “14th Five-Year” period, the textile industry’s energy structure should be further optimized, and the efficiency of energy and water resource use should be significantly improved. Energy consumption and carbon dioxide emissions per unit of industrial added value are expected to decrease by 13.5% and 18% (14th Five-Year Plan for The Development of The Textile Industry, 2021).
Since the beginning of the 21st century, China’s textile industry has undergone significant changes in both economic development and carbon emissions. However, the dynamic evolution of these two aspects and their decoupling relationship remains insufficiently explored. Furthermore, a deeper understanding of the factors influencing carbon emissions in the textile sector is essential for identifying key drivers of emission growth and formulating more targeted reduction policies. Based on the above background, this study investigates the decoupling relationship between carbon emissions and economic growth in China’s textile industry from 2001 to 2020, as well as the driving factors behind carbon emission changes. Specifically, first, based on energy consumption data for China’s textile industry from 2001 to 2020, this study uses the IPCC coefficient method to calculate carbon emissions in the textile industry across 30 provinces in China. Second, Tapio decoupling method is applied to analyze the decoupling relationship between carbon emissions and economic growth at both the national and provincial levels from 2001 to 2020. Third, the Logarithmic Mean Divisia Index (LMDI) method is employed to decompose the driving factors of carbon emissions in the industry. Fourth, a comparative analysis is conducted from both temporal and spatial perspectives. In terms of the temporal perspective, the 20-year study period is divided into four periods: the 10th Five-Year Plan (2001–2005), the 11th Five-Year Plan (2006–2010), the 12th Five-Year Plan (2011–2015), and the 13th Five-Year Plan (2016–2020). In terms of the spatial perspective, the study covers 30 provinces in China, grouped into three regions: East, Central, and West China. Finally, based on the findings, practical recommendations are provided. This research aims to provide theoretical support for the green and low-carbon development of China’s textile industry and offer valuable insights for other developing countries exploring sustainable development pathways.
The succeeding parts of the article are framed as follows: Section 2 reviews the relevant literature; Section 3 outlines the methodologies and data sources; Section 4 presents an empirical analysis; Section 5 discusses the results in the context of China’s national conditions; and Section 6 concludes with key findings and policy recommendations.
2 Literature review
2.1 Decoupling and decomposition methods
Decoupling theory, as an important tool for studying the relationship between economic growth and resource-environment pressures, has gained widespread application in the field of environmental economics in recent years. The concept was formally introduced in the 2002 report by the Organisation for Economic Co-operation and Development (OECD) titled “Indicators for Decoupling Economic Growth from Environmental Impacts”. This report defines “decoupling” and its models from an economic perspective and uses them to assess the relationship between economic growth and resource consumption or environmental pollution (Liu et al., 2018). According to the OECD model, decoupling state is divided into two types: relative decoupling and absolute decoupling. Based on the concept of decoupling elasticity, Tapio (2005), in his study of the decoupling situation in the European transport sector, defined three types of decoupling states: decoupling, coupling, and negative decoupling, further subdividing them into eight possibilities based on the elasticity value, namely: weak decoupling, strong decoupling, recessive decoupling, expansive coupling, recessive coupling, weak negative decoupling, strong negative decoupling, and expansive negative decoupling. Compared with the OECD decoupling model, the Tapio model does not require the selection of a base period for measurement and is not affected by statistical dimensions, making its decoupling indicator system more comprehensive (Qiao and Wu, 2025). As a result, the Tapio model has become the most commonly used model in decoupling analysis (Hu et al., 2023). However, while decoupling indexes reflect the dependency between the economy and carbon emissions, they could not reveal the underlying reasons (Hu et al., 2023). Therefore, further analysis of the driving factors behind these changes is necessary. Currently, the most commonly used method for driving factor decomposition is the Logarithmic Mean Divisia Index (LMDI), proposed by Ang et al. (1998). This method addresses the inherent issues of residuals and zero values in index decomposition analysis and offers the advantages of complete decomposition and unique results (Wang et al., 2020). The LMDI model has become the mainstream research tool in the energy and environmental fields (Rivera-Niquepa et al., 2023). Many scholars use it to conduct in-depth studies on the driving factors of carbon emission when analyzing the decoupling relationship between the economy and carbon emissions (Wei et al., 2023).
Researchers from various countries have frequently applied the LMDI method alongside the Tapio decoupling index in their studies to obtain more refined results. In the context of China, for instance, using the Tapio decoupling model and the LMDI method, Hu et al. (2023) analyzed the decoupling relationship between energy consumption and economic growth in China’s agricultural sector from 2000 to 2019 and further decomposed the driving factors. Similarly, Zhou and Li (2022) examined the decoupling state between economic growth and carbon emissions in the manufacturing sector in Jiangsu Province, China, and applied the LMDI method to explore the factors influencing carbon emissions. Xie et al. (2019) investigated how to achieve a strong decoupling relationship between CO2 emissions and GDP in China’s power industry, identifying the key driving forces behind the decoupling relationship with the LMDI method. Globally, In Colombia, Román-Collado et al. (2018) conducted a decoupling analysis of energy consumption from GDP from 2000 to 2015, applying the LMDI method to break down the changes in energy consumption into four distinct effects. Bianco et al. (2024) investigated the carbon emissions trend in the European Union from 1995 to 2019, using the LMDI method for decomposition and Tapio’s approach for analyzing the decoupling status. In Italy, Andreoni and Galmarini (2012) used LMDI decomposition analysis to assess the progress of decoupling economic growth from CO2 emissions. In addition, studies by Yan and Chen, (2022), Zhou and Hu (2025), Zha et al. (2021), Dong et al. (2021) and Wang et al. (2019) have examined the decoupling relationship between CO2 emissions and economic growth, along with the driving forces, in China’s construction industry, Logistics sector, tourism sector, industrial sectors, and major economic sectors, respectively. The list goes on, that’s a few to mention.
2.2 Decoupling and decomposing analysis in China’s textile industry
Regarding the decoupling relationship between carbon emissions and economic growth in China’s textile industry, Lu and Ma (2016) analyzed the decoupling relationship between carbon emissions and industrial GDP in China’s textile and garment industry from 2000 to 2012 based on the Tapio decoupling model. They found a weak decoupling relationship between carbon emissions and industrial GDP, while carbon emissions in the textile and garment industry increased year by year. Gong et al. (2021) estimated the carbon emissions and carbon intensity of Xinjiang’s textile and garment industry from 1997 to 2017 and applied the Tapio method for decoupling analysis. They concluded that the carbon emissions and economic growth in Xinjiang’s textile and garment industry had not yet reached a stable or ideal decoupling state. An et al. (2017) used the similar method to analyze the relationship between carbon emissions and economic growth in Hangzhou’s garment industry. The study found that between 1996 and 2015, Hangzhou’s garment industry went through a period of high energy consumption and high emissions, and carbon emissions in the industry did not achieve absolute decoupling from economic development.
About decomposing the factors influencing carbon emissions in China’s textile industry, Ma and Lu (2015) applied the Kaya identity to decompose the factors affecting carbon emissions in China’s textile and garment industry, indicating that industrial GDP is the primary driver, while improving the carbon intensity of the energy structure plays a significant role in emission reduction. Wang et al. (2013) used the LMDI model to assess the impact of factors such as industry size, industry structure, energy structure, and energy intensity on carbon emissions. Lin and Moubarak (2013) performed decomposition analysis based on the LMDI method, concluding that industrial activities and energy intensity are the main drivers of carbon emission changes in textile industry. Huang et al. (2017) analyzed the greenhouse gas (GHG) emissions from China’s textile industry and found that the expansion of production scale is the primary driver of increased GHG emissions, while reducing energy intensity and optimizing energy structure can effectively curb GHG emissions. Shi and Ning (2022) applied the extended STIRPAT model to identify the factors affecting carbon emissions in China’s textile and garment industry from 2000 to 2019. The results indicated that factors such as economic level, population size, urbanization rate, and industry structure had a significant positive impact on carbon emissions.
There are few scholars who have simultaneously studied the decoupling relationship between carbon emissions and economic growth in China’s textile industry, as well as the driving factors behind carbon emission changes. In the research on China’s textile industry, the combination of the decoupling and the LMDI methods has not been fully utilized. At the provincial or regional level, Zhang S. et al. (2024) took the Yangtze River Delta Ecological and Green Integrated Development Demonstration Zone as an example, using the LMDI method and Tapio decoupling method to identify the driving factors of carbon emissions in the textile industry and the decoupling status between carbon emissions and economic development. The results show that from 2014 to 2021, the textile industry in the demonstration zone transitioned from a state of negative decoupling to decoupling, and the level of economic development is a positive driver in carbon emission growth. Qi and Liu (2023) conducted a similar study on Zhejiang Province’s textile industry from 2004 to 2021 and found that the decoupling relationship between carbon emissions and economic growth improved overall. Among the influencing factors, economic development is the primary driver of carbon emissions growth, while energy consumption intensity has a significant inhibitory effect. Energy structure intensity and population size have suppressing and driving effects on carbon emissions, respectively. At the city level, relevant studies are more abundant. With the Tapio decoupling model and LMDI model, Li et al. (2017) proved that from 2001 to 2014, the decoupling status between carbon emissions and economic growth improved over time in the textile industry of Ningbo City. Industrial scale was the key driver of carbon emissions growth, while energy consumption intensity had a significant inhibiting effect on carbon emissions. The effects of industrial structure and energy structure were less noticeable. Chen et al. (2021) found that from 2001 to 2014, the total carbon emissions of Shanghai’s textile and garment industry showed a fluctuating downward trend. In most years during the study period, the economic output and carbon emissions were coupled. Industrial technology was identified as the main driver of carbon reduction, while industrial scale was the main inhibiting factor. Li et al. (2022) indicated that the overall decoupling status between carbon emissions and economic growth in the textile and garment industry of Wenzhou from 2004 to 2018 was positive. Industrial scale was the key driver of carbon emissions growth, while the factors of industrial structure and technological advancement helped to suppress the increase in carbon emissions.
There is other decoupling research on the textile industry, mainly focusing on the relationship between economic growth and energy or water footprints. For instance, Wang et al. (2017) examined the decoupling relationship between the energy footprint and economic growth in China’s textile industry from 1991 to 2015, and explored how changes in key factors influenced the energy footprint of the industry. Li and Wang (2019) analyzed the decoupling of water use, wastewater discharge from economic growth in China’s textile industry and its three sub-sectors from 2001 to 2015.
As a sum, about China’s textile industry, some scholars have focused solely on the decoupling relationship between textile economic development and carbon emissions like (Gong et al., 2021; Lu and Ma, 2016; An et al., 2017), while others have concentrated only on the decomposition of influencing factors, such as Wang et al. (2013), Lin and Moubarak (2013) and Huang et al. (2017). Most of these studies were conducted before 2017, and their conclusions generally suggest that a stable and ideal decoupling state has not yet been achieved (An et al., 2017). The main driving factors behind increased carbon emissions were identified as the improvement in economic levels or the expansion of production scale (Ma and Lu, 2015). After 2017, a majority of scholars began doing decoupling research with the decomposition of driving factors, for example, Zhang S. et al. (2024), Qi and Liu (2023) Li et al. (2022). However, related research in the China’s textile industry remains scarce, with most studies concentrating on the urban level [(Li et al., 2017), (Chen et al., 2021) and (Li et al., 2022)] and fewer studies conducted at the provincial and national levels [(Zhang S. et al., 2024) and (Qi and Liu, 2023)]. The results generally show an improving overall decoupling status, with textile economic development still acting as a positive driving force for carbon emissions. Energy consumption intensity, on the other hand, plays a major role in suppressing carbon emissions. Overall, the existing research in the textile field is limited and outdated. The limited number of recent studies typically take a narrow perspective, focusing only on provincial or urban-level cases, and lack a systematic, comprehensive, and in-depth analysis at the national and provincial levels. Consequently, the conclusions drawn from these studies reflect only the situation in a specific province or city, failing to provide an overall evaluation, present regional differences, or capture the distinct characteristics across different periods.
Compared with existing studies, this research makes the following contributions to fill the relevant research: (1) Enriching and improving relevant research in China’s textile industry. This paper not only examines the decoupling states of carbon emissions from economic growth in China’s textile industry from 2001 to 2020, but also further decomposes the driving factors behind carbon emission changes. (2) Conducting analysis from both national and provincial perspectives. Due to the complexity and limited availability of data, research on the decoupling status between carbon emissions and economic development in the textile industry across provinces in China remains a blank. This paper well fills this gap by conducting relevant research on 30 provinces in China, providing in-depth, comprehensive, and systematic set of the latest conclusions. (3) Spatio-temporal comparison. In terms of the temporal dimension, the 20-year study period is divided into four intervals corresponding to China’s 10th, 11th, 12th, and 13th Five-Year Plan (FYP). Additionally, in the spatial dimension, the study groups the 30 provinces into Central, East, and West China (based on official classifications). This paper conducts a comparative analysis of the carbon emission characteristics, decoupling status, and driving factors in the textile industry across four periods and three regions, uncovering the underlying causes and mechanisms behind the observed differences. (4) Alignment with China’s national conditions. This study covers four of China’s Five-Year Plans, highlighting the effectiveness of carbon reduction efforts in the textile industry across regions and stages, and resulting in practical strategies for emission reduction.
3 Methodology and data source
3.1 Carbon emission calculation
According to the coefficient method proposed by the Intergovernmental Panel on Climate Change (IPCC) for calculating carbon emissions, the total carbon emissions can be estimated by summing the CO2 emissions from various energy consumptions. The specific calculation formula is as follows:
In Equation 1,
3.2 Tapio decoupling model
The Tapio “decoupling” indicator was proposed by Tapio (2005) using the elasticity coefficient method. In this study, it is applied to analyze the decoupling degrees of carbon emissions from economic growth (GDP) in China’s textile industry. The formula is as follows:
In Equation 2,
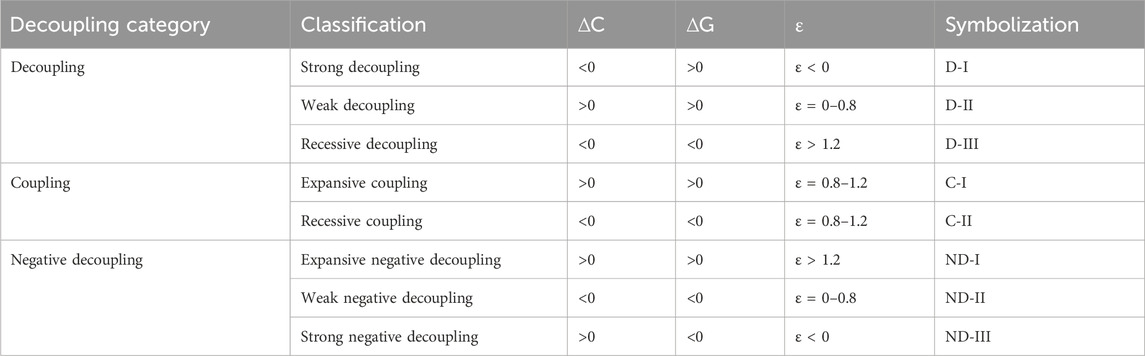
Table 1. Criteria for decoupling states in the Tapio decoupling model.
3.3 LMDI method
The Logarithmic Mean Divisia Index (LMDI) method, proposed by Ang et al. (1998), is an extension of the Kaya identity. It decomposes multiple influencing factors by constructing a chain product form. With LMDI method, this study decomposes the driving factors of carbon emissions in China’s textile industry, as shown in the following formula:
In Equation 3,
In the additive form of LMDI, the changes in carbon emissions can be expressed as:
In Equation 4,
In the above formulas,
3.4 Data source
Base on the classification in GB/T 4754-2002“Industrial Classification for National Economic Activities,” this study covers two categories: category 17 (Textile Industry) and category 18 (Textile, Apparel, and Accessories Industry), collectively referred to as “China’s textile industry”. Due to data availability, this study collected data from 30 provinces of China (excluding Tibet, Taiwan, Hong Kong and Macau) from 2001 to 2020. Data on energy consumption, industrial output value, number of employees, carbon dioxide emissions were sourced from the “China Energy Statistical Yearbook,” “China Statistical Yearbook,” “China Industrial Economic Statistical Yearbook,” “China Industrial Statistical Yearbook,” provincial statistical yearbooks, and the Carbon Emission Accounts and Datasets (CEADs). To eliminate the effect of inflation, the textile industry’s output value (industrial GDP) from 2001 to 2020 was adjusted to constant prices, using 2000 as the base year. Missing values were supplemented using the average interpolation method to ensure data completeness.
4 Empirical results
4.1 Overview of carbon emissions and GDP growth in China’s textile industry
From 2001 to 2020, both carbon emissions and GDP growth in China’s textile industry exhibited a trend of rising first and then declining. As shown in Figure 1, carbon emissions in the textile industry started at 16.13 million tons in 2001, growing at an average annual rate of 12.22%. The emissions peaked at 29.92 million tons in 2008, before slowly decreasing to 26.81 million tons in 2012. From that point onward, emissions continued to decline at an average annual rate of 5.7%, reaching 14.60 million tons by 2020. A similar trend can be observed in GDP, though with some differences. The GDP reached its peak in 2016 at 3,697.2 billion CNY, after experiencing an average annual growth rate of 25.57% for the previous 15 years. Following this peak, GDP sharply declined, dropping by 47.39% to 1,945.21 billion CNY in 2020.
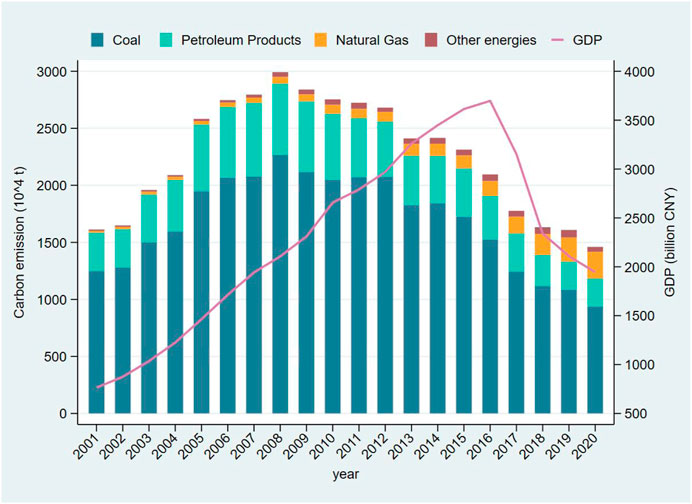
Figure 1. Carbon Emissions and GDP growth in China’s textile industry from 2001 to 2020.
This trend likely stems from several factors. China joining the World Trade Organization (WTO) and the abolition of the quotas specified under the Agreement on Textiles and Clothing (ATC) in the early 2000s spurred the rapid growth of the textile and apparel industry, which led to a significant rise in carbon emissions from 2000 to 2008. However, the global financial crisis of 2008 caused a sharp decline in international trade, leading to a slight reduction in carbon emissions after that year. After 2012, influenced by economic transformation and trade tensions, the textile industry saw a decline in output, while carbon emissions fluctuated and decreased further.
Over the 20-year study period, carbon emissions from coal-related energy consumption have accounted for more than half of the total carbon emissions in the textile industry, though this proportion has been decreasing. It dropped from 77.37% in 2001 to 64.23% in 2020. The share of petroleum products has also decreased, from a peak of 23.11%–16.79% in 2020. In contrast, the share of natural gas has increased significantly, rising from 1.1% at the beginning to 16.02% by 2020. Other energy sources, including coke, coke oven gas, other gases, and other coking products, contribute little to the textile industry’s carbon emissions, currently accounting for just around 3%.
From Figure 2, The textile industry in East China leads by a large margin in both GDP and carbon emissions, with trends largely mirroring the national overall pattern. Over the 2 decades, the average share of GDP and carbon emissions in this region accounted for 80% and 78%, respectively. Central China ranks second, with average shares of 15% for GDP and 13% for carbon emissions. In the last 3 years, its carbon emissions were lower than those in West China, making it the region with the least emissions. West China ranks last, with average shares of 5% for GDP and 9% for carbon emissions.
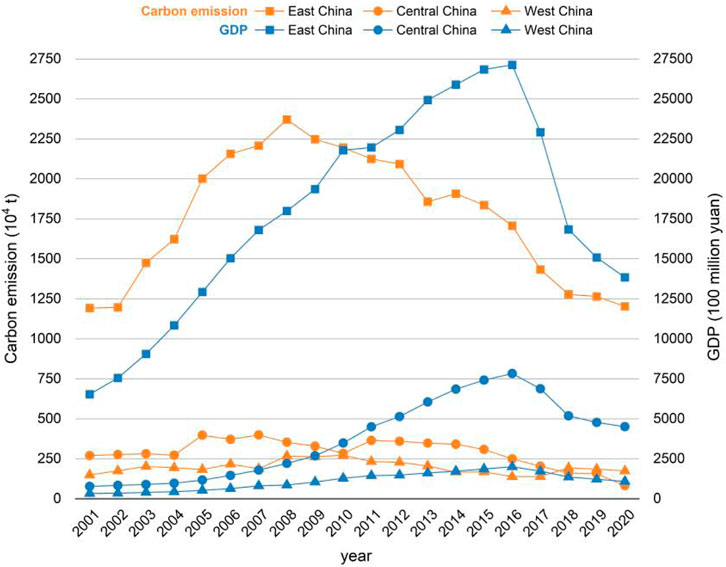
Figure 2. Carbon emissions and GDP growth in the textile industry of East, Central and West China from 2001 to 2020.
4.2 Decoupling analysis
As shown in Table 2, during the 10th Five-Year Plan period (2001–2005), China’s textile industry GDP experienced an explosive growth, increasing by 91%. This was followed by a rapid and dramatic increase in carbon emissions, which rose by 60%. During this period, the decoupling relationship between carbon emissions and GDP growth in the textile industry was unstable. Except for 2001, which experienced strong decoupling, other years fluctuated between different states. Overall, weak decoupling was achieved, with an index of 0.66, indicating a less pronounced decoupling trend. During the 11th Five-Year Plan period (2006–2010), the GDP growth of the textile industry was 55%, while carbon emissions increased by only 1%. The decoupling relationship between the two was improving. Although the overall decoupling status remains weak, the decoupling index has improved to 0.01. Furthermore, the strong decoupling state persisted almost continuously from 2009 to 2016, lasting for a total of 8 years, with the exception of weak decoupling in 2014. As a result, the most ideal decoupling status occurred during the 12th Five-Year Plan period (2011–2015), achieving overall strong decoupling. During this period, the industrial GDP continued to grow at a rate of 29%, while carbon emissions declined by 15%. However, during the 13th Five-Year Plan period (2016–2020), the situation began to change, primarily due to the continued negative growth of the industrial GDP. The main reasons behind this phenomenon are rising domestic labor costs, the U.S.-China trade war, and the outbreak of COVID-19. During this period, although carbon emissions declined at twice the rate of the previous period, the decrease was still much smaller than that of GDP. As a result, the decoupling status between the two was not ideal, overall exhibiting weak negative decoupling.
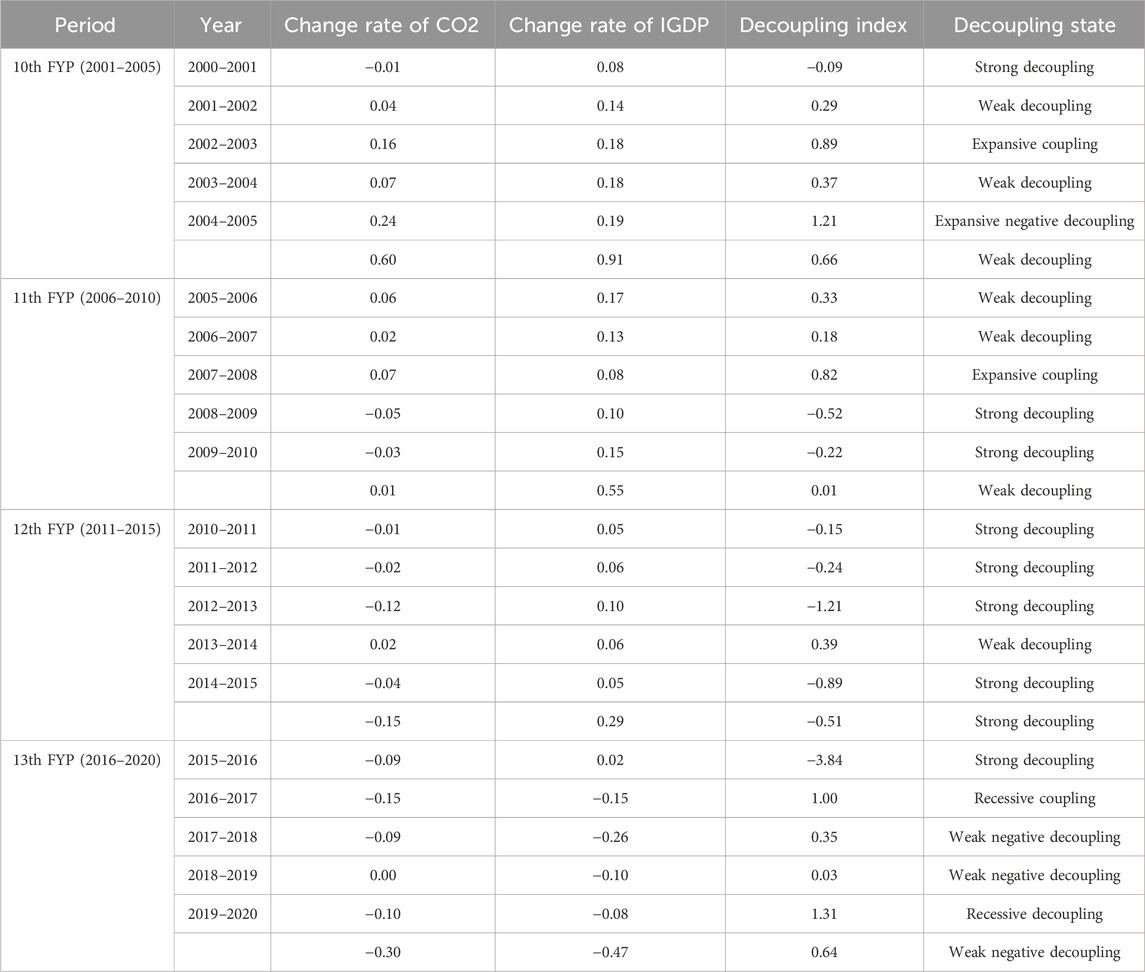
Table 2. Decoupling status between carbon emissions and GDP growth in China’s textile industry from 2001 to 2020.
In summary, apart from the rapid growth phase in the first 5 years of the 10th FYP and the decline phase in the last 5 years of the 13th FYP, the textile industry in China achieved a relatively stable and favorable decoupling state during the middle 10 years (the 11th FYP and 12th FYP).
As shown in Table 3, during the 10th FYP period (2001–2005), the decoupling states of carbon emissions from GDP growth in the textile industry of East and West China were weak decoupling, while Central China experienced expansive coupling. During this period, 97% of the provinces saw rapid economic growth in their textile industries. In 9 provinces including Jiangsu, Zhejiang, and Fujian, textile industrial GDP even doubled. 18 out of 30 provinces were in a strong or weak decoupling state. However, there were also many provinces where both GDP and carbon emissions grew in tandem, or where the growth rate of carbon emissions far exceeded that of GDP. A total of 11 provinces, accounting for 33%, experienced this trend: 7 in expansive negative decoupling and 4 in expansive coupling. Among these provinces, the decoupling index for Shanxi, Hubei, Guizhou, and Yunnan exceeded 5, due to various reasons. For example, Shanxi, a major coal-producing province, relied heavily on coal for energy consumption, and at that time, coal utilization efficiency was low. Lastly, Gansu was the only province in a recessionary state, with both textile industry GDP and carbon emissions declining together, experiencing recessive coupling.
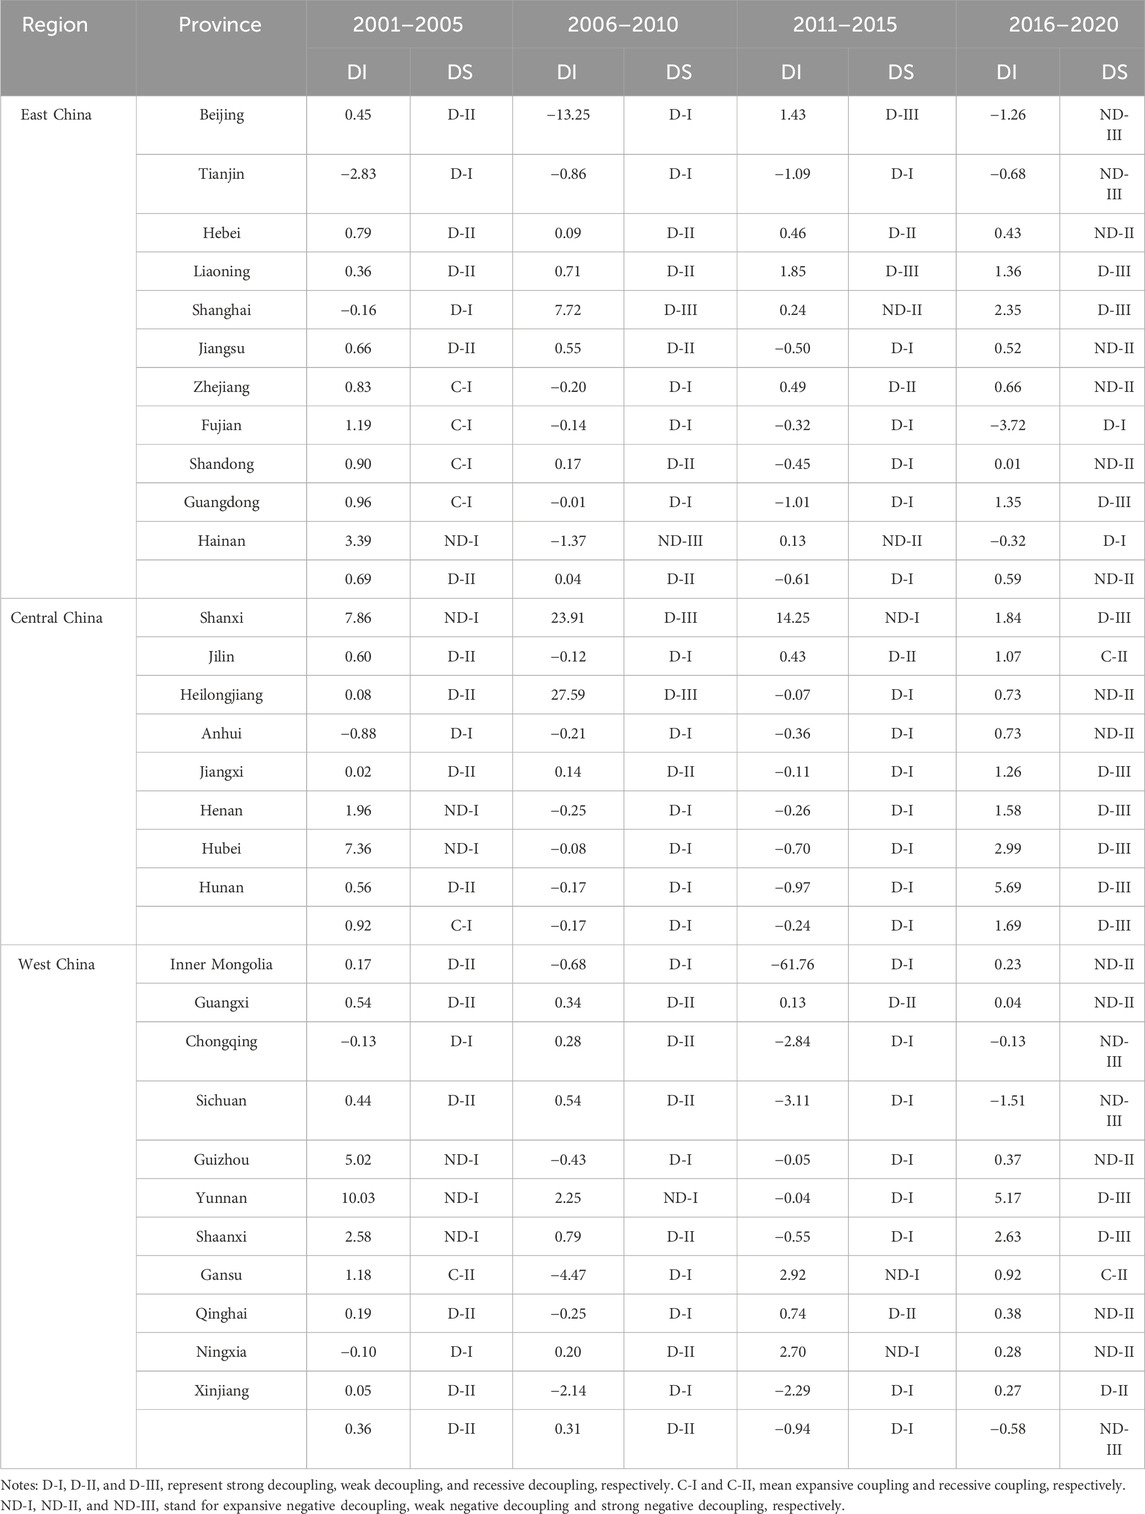
Table 3. Decoupling status between carbon emissions and GDP growth in the textile industry across 30 provinces over four periods in China.
During the 11th FYP period (2006–2010), the decoupling status in East and West China remained weak decoupling, but with improved performance. The biggest progress was seen in Central China, where it shifted from expansive coupling to strong decoupling. Among the 30 provinces, 28 achieved decoupling, with more than half (15 provinces) in strong decoupling, while the remaining provinces were in weak decoupling (10 provinces) and recessive decoupling (3 provinces). During this period, the textile industry GDP continued to grow rapidly, with 11 provinces such as Jilin, Anhui, and Henan seeing growth rates exceeding 100%. Meanwhile, carbon emissions from the textile industry decreased in 60% of the provinces, with more than half of them experiencing reductions of over 30%. 5 Provinces like Tianjin, Shanxi, and Inner Mongolia saw decreases of over 50%. Hainan was the only province where textile industry GDP declined, resulting in strong negative decoupling. Yunnan was the only province in expansive negative decoupling. However, these two provinces had very small shares in the textile industry, collectively accounting for less than 0.1%.
During the 12th FYP period (2011–2015), the decoupling between carbon emissions and economic growth in the textile industry was the most ideal of the past 20 years. Both East, Central, and West China achieved strong decoupling, with the highest decoupling degree in West China, where the decoupling index reached −0.94. Among the 30 provinces, 18 achieved strong decoupling, 5 were in weak decoupling, and 2 in recessive decoupling, with decoupling provinces accounting for 83%. Compared to the previous period, the textile GDP growth rate in 73% of the provinces significantly slowed down. Meanwhile, carbon emissions continued to decline steadily. Additionally, three provinces were in expansive negative decoupling, namely Shanxi, Gansu, and Ningxia, but their combined share in the textile industry was less than 0.6%. In Shanghai and Hainan, carbon emissions slightly declined by 7%–8%, but the textile industry GDP dropped by more than 30%, resulting in weak negative decoupling. The reasons for this may be that Hainan focuses on tourism development, has a better ecological environment, and a very small share of the textile industry. Shanghai, being a highly developed international city, is primarily driven by the tertiary industry, with the textile sector gradually diminishing.
During the 13th FYP period (2016–2020), only Central China maintained a decoupling state, which shifted to recessive decoupling, while East and West China became weak negative decoupling and strong negative decoupling, respectively. Among the 30 provinces, only 13 experienced decoupling, while 15 were in negative decoupling, and 2 provinces were in recessive coupling. Overall, the trend leaned towards negative decoupling. One of the main reasons for this shift was that, except for Fujian, Hainan, and Xinjiang, the textile industry GDP in other provinces entered negative growth. Among the provinces with negative textile GDP growth, 77.8% saw a decline of over 30%. This was largely due to the global economic slowdown, trade tensions, the impact of the COVID-19 pandemic, and the decline of the traditional advantages of the textile industry. Regarding carbon emissions, except for Beijing, Tianjin, Chongqing, Sichuan, and Xinjiang, the textile industry carbon emissions in all other provinces decreased, with a general acceleration in the rate of decline compared to the previous period.
According to Table 4, comparing different regions, the decoupling status of carbon emissions from GDP growth in the textile industry of East China aligns with the national situation, showing four periods: weak decoupling, weak decoupling, strong decoupling, and weak negative decoupling. The overall decoupling status over the 20 years is weak decoupling, with a decoupling index of 0.03. This can be attributed to the fact that the textile industry in East China is highly developed, with its GDP contributing 71%–88% of the national total over years, and its carbon emissions accounting for 73%–83% over years. Therefore, the development of the textile industry in East China plays a significant role in the overall economy, making it more sensitive to macroeconomic factors. In contrast, Central China’ textile industry saw its GDP share increase from 10% in 2001 to 23% in 2020, while the carbon emissions share decreased from 17% to 5%. The decoupling status in different periods is as follows: expansive coupling, strong decoupling, strong decoupling, and recessive decoupling. Despite starting later, the central region’s textile industry has developed steadily, with notable success in controlling carbon emissions. As shown in Table 4, among the three regions, the central region had the best decoupling performance over the 20 years, with an overall strong decoupling status with an index of −0.16. Finally, in West China, the textile industry’s GDP share ranged from 4% to 6% over years, and its carbon emissions accounted for 7%–12% of the national total. The textile industry’s share is small, and its economic development is slow, with a faster growth rate in carbon emissions in later years. The decoupling status in different periods is weak decoupling, weak decoupling, strong decoupling, and strong negative decoupling. The overall decoupling status in the western region is weak decoupling, with a decoupling index of 0.01. In conclusion, over the past 20 years, the overall decoupling performance of the three regions is ranked as follows: Central China outperforms West China, West China outperforms East China. at the national level, China’s textile industry achieved strong decoupling over 2 decades, but with a decoupling index of only −0.06, indicating a relatively weak level of strong decoupling.
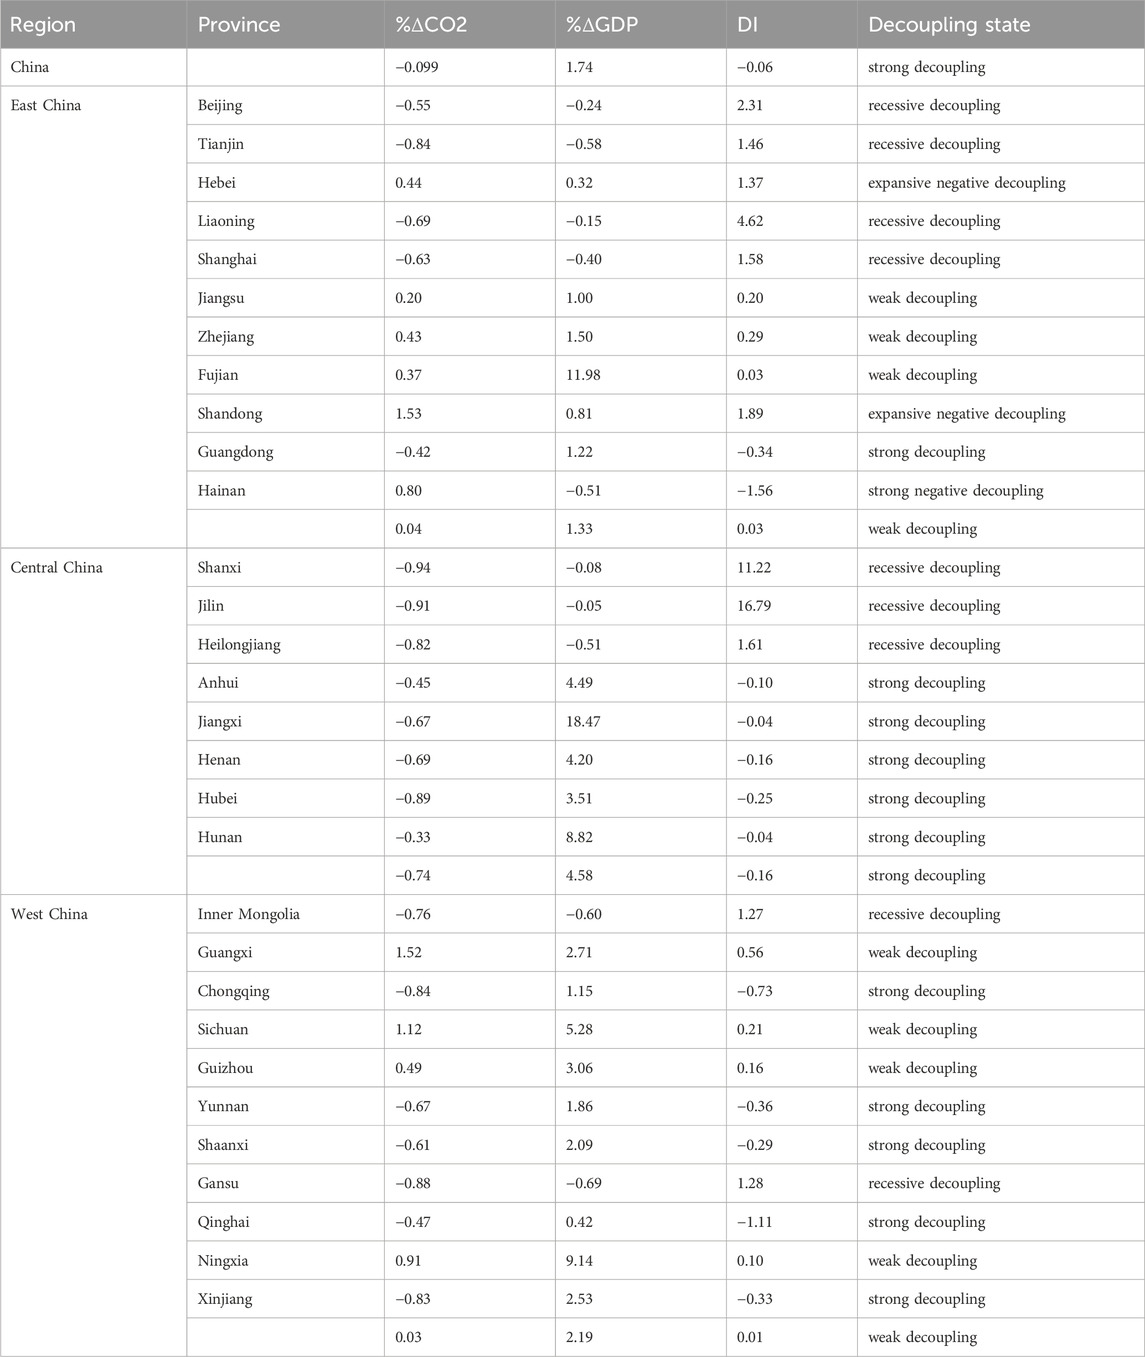
Table 4. The decoupling status of carbon emissions from GDP growth in the textile industry across 30 provinces in China from 2001 to 2020.
4.3 Driving factor decomposition analysis
As shown in Table 5, from 2001 to 2020, carbon emissions in China’s textile industry decreased by a total of 1.65 million tons. The five influencing factors, ranked by impact, are: per capita output effect (∆GP), energy consumption intensity effect (∆EI), employment scale effect (∆POP), energy consumption structure effect (∆ES), and carbon emission intensity effect (∆CI). Per capita output and energy consumption intensity factors have played major roles in promoting and suppressing carbon emissions, respectively. The per capita output factor leads to an increase in carbon emissions of 32.21 million tons, while the energy consumption intensity factor results in a reduction of 28.2 million tons, significantly outweighing the effects of the other three driving factors. The effects of the remaining three factors are as follows: the employment scale factor inhibited carbon emissions by 4.34 million tons; energy structure factor also contributed to carbon emission reduction, decreasing emissions by 1.32 million tons; and the carbon emission intensity effect had a value of 0 throughout the years. This is because the carbon emissions linked to the carbon emission intensity effect are calculated based on energy consumption using IPCC coefficient method, and since the carbon emission factor is fixed, the ratio between carbon emissions and energy consumption remains constant. Additionally, the energy consumption structure in the textile industry has been relatively stable, primarily relying on raw coal with small changes. As a result, the contribution to emission reduction made by the energy consumption structure factor is not obvious.
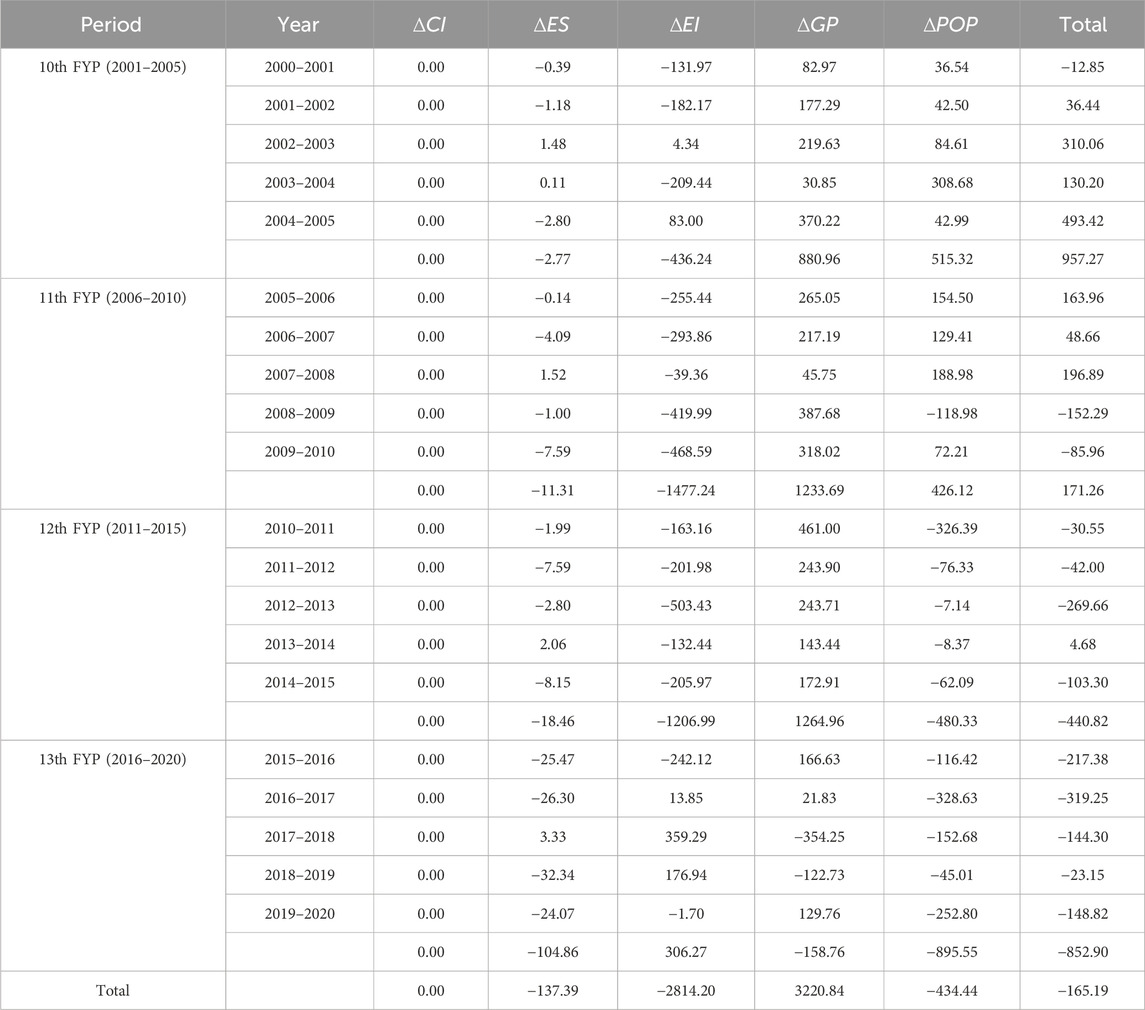
Table 5. Decomposition of driving factors of carbon emissions in China’s textile industry from 2001 to 2020 (Unit: 10,000 tons).
In comparison across different periods, during the 10th FYP (2006–2010), carbon emissions from the textile industry increased by 9.57 million tons, the largest increase among the four periods. During this period, the per capita output and employment scale factors promoted an increase of 8.81 million tons and 5.15 million tons in carbon emissions, respectively. Meanwhile, over 73% of energy consumption was coal, with low energy efficiency, leading to “high energy consumption, high emissions.” The suppression effect of energy consumption intensity factor on carbon emissions was minimal, reducing emissions by only 4.36 million tons. In the 11th FYP (2011–2015), the per capita output and employment scale factors continued to drive significant carbon emissions. However, the suppression effect of energy consumption intensity became much more pronounced, reducing emissions by 14.77 million tons, even surpassing the emission increase from the per capita output effect. As a result, the overall increase in carbon emissions during this period was relatively small, just 1.71 million tons. In the 12th FYP (2016–2020), carbon emissions from the textile industry decreased overall by 4.41 million tons. While the per capita output factor continued to promote emissions, its impact was largely offset by the suppression from energy consumption intensity effect. Both the employment scale and energy structure factors helped reduce emissions. During the 13th Five-Year Plan, the situation reversed. The per capita output effect shifted from a promoting role to a inhibiting one, reducing emissions by 1.59 million tons. On the opposite, the energy consumption intensity effect shifted from suppression to promotion, increasing emissions by 3.06 million tons. Employment scale became the main driving force behind emission reduction, cutting emissions by 8.96 million tons. The energy structure effect became more pronounced, reducing emissions by 1.05 million tons.
Overall, in the first 15 years, economic development in the textile industry was the primary driver of increased carbon emissions, while the lowering energy consumption intensity played the leading role in carbon emission reduction. The employment scale factor continued to drive up carbon emissions in the first 10 years, but its inhibitory effect grew stronger gradually in the next 10 years. The progress in optimizing the energy structure was slow but gradually gained strength. In the last 5 years, its contribution to emission reduction became more evident.
From Figures 3, 4, we can observe that the effects of different factors on carbon emissions in the textile industry vary across regions. The per capita output factor ∆GP promoted carbon emissions in the textile industry during the first three periods in all regions. However, the effect was most significant in East China, where it contributed more to carbon emissions than the combined effects in Central and West China. The energy intensity effect ∆EI had the greatest influence in Central China. The energy intensity factor played a major role in inhibiting carbon emissions in Central China throughout most of the study period. In East and West China, this factor suppressed carbon emissions during the first three stages but promoted emissions in the fourth stage. The employment scale factor ∆POP displayed varying effects across different regions. Relatively speaking, this factor had the most noticeable impact on promoting carbon emissions in Central China. In Central China, it drove carbon emissions during the middle 10 years, while reducing emissions in the first and last 5 years. In East China, the employment scale factor promoted significant carbon emissions in the first two stages, but in the last two stages, it increasingly contributed to emission reduction. In West China, except for the second period where the factor slightly increased carbon emissions, ∆POP contributed to emission reductions in the other three stages. Finally, the energy structure effect ∆ES consistently led to emission reductions across all regions, with its impact gradually strengthening. However, in the first three stages, its reduction effect was minimal, only becoming more pronounced in the final stage. Relatively, the energy structure effect contributed the most to carbon emission reductions in Central China, followed by West China and East China.
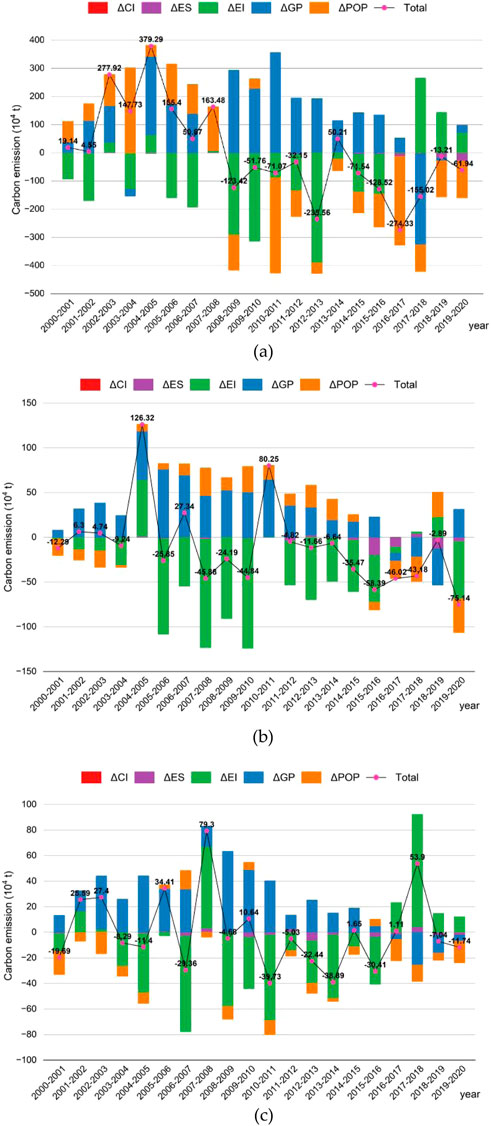
Figure 3. Influencing factor decomposition of carbon emissions in the textile industry of East, Central and West China from 2001 to 2020. (a) East China (b) Central China (c) West China.
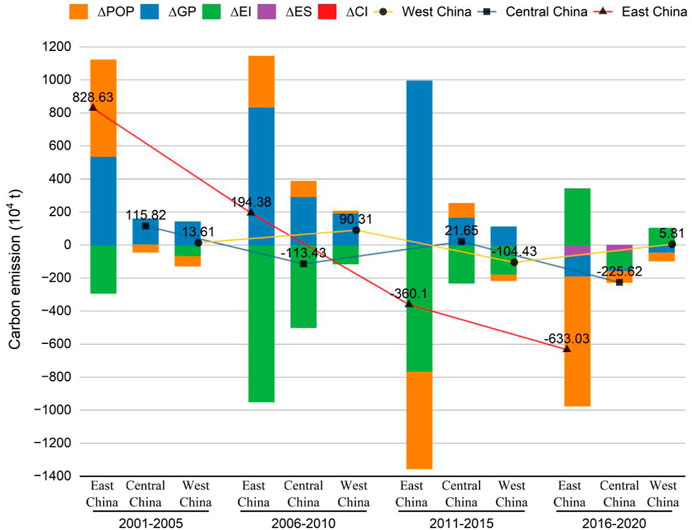
Figure 4. Influencing factor decomposition of carbon emissions in the textile industry in three regions over four periods.
As a sum, comparing different regions, East China stands out due to its most developed textile economy. In East China, aside from economic factors driving an increase of 22.44 million tons in carbon emissions, all other factors contributed to emission reductions. In the first two periods, carbon emissions increased, while in the last two periods, they decreased. Across the four periods, the total increase in carbon emissions from the textile industry in East China was 0.3 million tons. Central China made the largest contribution to reducing carbon emissions in the textile industry, with a total decrease of 2.02 million tons over 2 decades. This was primarily due to the strong suppressive effect of the energy intensity factor, which outweighed the combined effects of the per capita output and employment scale factors. Additionally, Central China was the only region where the employment scale effect generally promoted carbon emissions in the study period. Aside from the first period, which saw a significant increase in carbon emissions, the other three periods were characterized by emission reductions or minimal increases. In West China, the impacts of the various factors were similar to those in East China, but the resulted changes in carbon emissions were much smaller. The greatest reduction occurred in the third period, amounting to 1.04 million tons. Overall, carbon emissions in the textile industry of this region increased by 53,000 tons over the 2 decades. This can be attributed to the relatively slow development of the textile industry in West China, coupled with strong environmental protection measures, which left limited room for further carbon emission reductions.
5 Discussion
Since the beginning of the 21st century, the textile industry in China has continuously promoted the transition from traditional manufacturing to green manufacturing through technological upgrades, structural adjustments, and management optimization, becoming a key pillar of sustainable development in China’s industrial sector. During the 10th FYP period (2001–2005), after China joined the WTO, the textile industry experienced rapid export growth, quickly becoming the world’s largest producer and exporter of textile products. This period was marked by scale expansion, with environmental awareness beginning to emerge. However, green and low-carbon development had not yet become a focal point. The industry’s overall technological foundation was weak, and pollution issues gradually became apparent. During the 11th FYP period (2006–2010), while exports remained the main driver, the industry began to face challenges such as rising labor costs and the impact of the 2008 financial crisis. The “11th FYP” had set energy-saving and emission-reduction goals, prompting the textile industry to pay more attention to environmental issues. Some enterprises beginning to adopt clean production technologies. During the 12th FYP period (2011–2015), domestic demand became a major growth driver for the textile industry. Automation and informatization technologies were progressively adopted. The “12th FYP” clearly outlined the goal of green manufacturing, promoting the wide spread of clean production technologies and the exploration of circular economy models. Environmental regulations became stricter, and high-polluting, high-energy-consuming enterprises were eliminated. At both the national and industry levels, green manufacturing standards were established to drive the standardization and green development of the industry. In the 13th FYP period (2016–2020), under the background of supply-side structural reforms and the China-U.S. trade war, the textile industry accelerated the elimination of outdated capacity, optimized industrial structure, and moved towards high-quality development. Green and low-carbon development gained momentum, with the construction of green factories and the development of green-designed products becoming key priorities. The integration of smart manufacturing and green manufacturing became a mainstream trend in the industry.
China’s textile industry demonstrates regional clustering characteristics, with different regions forming differentiated development paths based on their resource endowments, industrial foundations, and policy support. The eastern regions (Jiangsu, Zhejiang, Fujian, Guangdong, etc.), with their advanced manufacturing, complete industrial chains, and skilled workforce, occupy a central position in the national textile industry and have taken the lead in advancing green and low-carbon transformation. For example, Shaoxing Keqiao in Zhejiang established a Carbon Label Certification Alliance for textile printing and dyeing products, creating a “carbon footprint” certification system, which has become a benchmark for the industry’s green development. In recent years, Central China (Hubei, Hunan, Henan, etc.) has taken on the transfer of industries from the eastern regions, accelerating the integration of smart manufacturing and green upgrades. By building green parks, promoting the recycling of regenerated fibers, and adopting energy-saving and environmental protection equipment, the region has improved the environmental performance of the textile industry, laying a foundation for its sustainable development. For instance, Zhuzhou and Yueyang in Hunan have upgraded their mature printing and dyeing industries toward high-end fabrics, functional textiles, and environmentally friendly dyeing processes. The western regions, however, face limitations due to ecological fragility and weak infrastructure, which hinder the development of the textile industry. Gansu, Qinghai, and Ningxia are constrained by limited resource conditions and an incomplete industrial chain. Xinjiang, with its rich cotton resources, has accelerated the development of a full industrial chain in cotton spinning, weaving, dyeing, and apparel manufacturing, while also promoting low-carbon transformation through new energy, wastewater recycling, and smart manufacturing technologies. However, high logistics costs and lagging industrial support still pose significant bottlenecks to development.
In the future, China’s textile industry is supposed continue to optimize and upgrade under the framework of regional collaborative development. The East China would maintain their leadership in technological innovation, driving green and low-carbon manufacturing; Central China would further strengthen its ability to absorb industries transferred from the eastern regions and promote coordinated development of the industrial chain; West China needs accelerate infrastructure construction, reduce logistics costs, and enhance industrial support capabilities. Under the guidance of the “dual carbon” goals, China’s textile industry keeps moving toward intelligence, greenness, and efficiency, achieving high-quality and sustainable long-term development.
6 Conclusion and policy recommendations
6.1 Conclusion
In conclusion, this study first uses the Tapio decoupling model to analyze the decoupling relationship between carbon emissions and economic growth in the textile industry across 30 provinces in China from 2001 to 2020. It then decomposes the factors influencing carbon emissions with the LMDI method. Finally, a comparative analysis is conducted across four periods and three regions based on the results. The following conclusions are drawn:
(1) Both carbon emissions and GDP growth in China’s textile industry show a trend of rising followed by falling, with peaks occurring in 2008 for carbon emissions and in 2016 for GDP. The combustion of coal-related energy is the primary source of carbon emissions in China’s textile industry, accounting for over 64%. This is followed by gasoline-related energy, with natural gas being the least contributing. The share of carbon emissions from coal and oil consumption has been steadily decreasing, while the proportion of emissions from natural gas has grown significantly, rising from 1.1% in 2001 to 16.02% in 2020.
(2) The decoupling relationship between carbon emissions and GDP growth in China’s textile industry showed a status of strong decoupling over 2 decades, with an index of just −0.06. Comparing different periods, except for the first period (2001–2005), when the textile economy experienced rapid growth, and the last period (2016–2020), marked by a decline in industrial GDP, the middle decade (2006–2015) saw a more stable and favorable decoupling state. In comparison across regions, the decoupling states across four periods in East China mirrored the national pattern, achieving weak decoupling over the 20-year period with an index of 0.03. Central China showed the best decoupling performance, reaching strong decoupling with an index of −0.16. In West China, the overall weak decoupling was achieved, with an index of 0.01.
(3) The main driving factors behind carbon emission changes in China’s textile industry, ranked by impact, are: per capita output value, energy consumption intensity, employment scale, energy structure, and carbon intensity. Over the 20-year study period, per capita output value and energy consumption intensity factors played key roles in promoting and restraining carbon emissions in China’s textile industry, respectively. Meanwhile, employment scale and energy structure factors both contributed to the reduction of carbon emissions. Comparing different periods, during the first three periods (2001–2015), textile economic growth was the main driver of increased carbon emissions, while the energy consumption intensity was the primary inhibiting factor contributing to emission reductions. The employment scale factor kept driving up carbon emissions in the first 10 years, but in the last 10 years, its inhibitory effect grew, eventually becoming the main force of carbon emission reductions. The progress in optimizing the energy structure was slow but gradually became more effective, with noticeable reduction results in the final period.
(4) Comparing different regions, in East China, the influence of each factor on carbon emissions in the textile industry mirrored the national trend. In Central China, energy consumption intensity factor played a suppressive role in carbon emissions across almost all periods, which was much greater than the emissions promoted by textile economic growth and employment scale expansion, making an outstanding contribution to national carbon emission reduction in textile industry. In West China, the carbon emissions increase caused by economic growth was largely offset by the carbon reduction from the other three factors.
6.2 Policy recommendations
(1) Optimize the energy structure and improve energy efficiency. Adjusting the energy consumption structure and actively promoting green energy are key paths for the textile industry to achieve energy conservation and carbon reduction. The government should focus on optimizing the energy structure, reducing dependence on coal, and vigorously promoting renewable energy sources such as wind and hydro power. Encouraging companies to adopt more environmentally friendly electricity supply methods is also crucial. The process of “coal-to-gas” and “coal-to-electricity” in enterprises and industrial parks should be accelerated, increasing the share of secondary energy consumption, promoting the construction of distributed energy centers, and enhancing energy utilization efficiency.
(2) Promote the green transformation of the textile industry to achieve high-quality development. The economic development in the textile industry is a major driver of carbon emissions, so it is essential to improve the quality of economic development, avoid extensive growth, and promote the coordinated advancement of the economy and the environment. At the same time, leveraging the technological and economic advantages of surrounding regions can help foster green industrial clusters and drive the low-carbon transformation of the textile industry. As a leader in technology and economics, the eastern region should strengthen cooperation with central and western regions, driving the nationwide green transformation of the textile industry through technology transfer and industrial collaboration.
(3) Build a green standard system and strengthen international cooperation. The government should strengthen the guiding and regulatory role of standards, promote the implementation of green standards, and encourage enterprises to use green technologies for upgrading and transformation. At the same time, it should develop a roadmap for the research, development, and promotion of key energy-saving and emission reduction technologies, establish an industry green database, enhance the level of clean production audits. Furthermore, the government should collaborate with markets in Europe, the U.S., Japan, and others on green supply chains, sustainability certifications, and other areas, actively participate in the formulation of international environmental textile standards, and enhance the global competitiveness of China’s textile industry.
(4) Promote intelligent low-carbon manufacturing. Develop smart production management systems and utilize new technologies such as the industrial internet and artificial intelligence (AI) to improve production efficiency, reduce energy consumption, and minimize pollutant emissions. At the same time, strengthen carbon emission accounting for enterprises, promote carbon footprint tracking, establish carbon trading mechanisms, and advance the textile carbon labeling system to reinforce corporate responsibility for carbon reduction.
This study has some limitations and potential directions for further research. From a data perspective, the share of textile industry GDP in certain provinces is relatively small, which may lack representativeness. Future research could focus on provinces with a larger proportion of textile industry GDP. These provinces are supposed to have highly developed textile economies, and studies focusing on them may yield more accurate and representative results. From a methodological perspective, the IPCC coefficient method for calculating carbon emissions may result in a zero emission intensity effect when decomposing driving factors using the LMDI approach. Future studies could also explore the decoupling status of each influencing factor from industrial carbon emissions, or incorporate additional driving factors, such as technological innovation, in order to obtain more valuable and insightful conclusions.
Data availability statement
The original contributions presented in the study are included in the article/supplementary material, further inquiries can be directed to the corresponding authors.
Author contributions
YH: Formal Analysis, Methodology, Project administration, Software, Supervision, Writing – original draft, Writing – review and editing. LM: Conceptualization, Formal Analysis, Software, Visualization, Writing – original draft, Writing – review and editing. SK: Conceptualization, Data curation, Investigation, Validation, Writing – original draft, Writing – review and editing. GZ: Data curation, Formal Analysis, Investigation, Resources, Writing – original draft, Writing – review and editing.
Funding
The author(s) declare that no financial support was received for the research and/or publication of this article.
Conflict of interest
The authors declare that the research was conducted in the absence of any commercial or financial relationships that could be construed as a potential conflict of interest.
Generative AI statement
The author(s) declare that no Generative AI was used in the creation of this manuscript.
Publisher’s note
All claims expressed in this article are solely those of the authors and do not necessarily represent those of their affiliated organizations, or those of the publisher, the editors and the reviewers. Any product that may be evaluated in this article, or claim that may be made by its manufacturer, is not guaranteed or endorsed by the publisher.
References
14th five-year Plan for the Development of the textile industry (2021). China national textile and apparel Council.
An, Z. Y., He, W. W., and Li, Y. (2017). Study on the relationship between carbon emissions and economic growth in the apparel industry of Hangzhou. Light Text. Industry Technol. 46, 11–12+18.
Andreoni, V., and Galmarini, S. (2012). Decoupling economic growth from carbon dioxide emissions: a decomposition analysis of Italian energy consumption. Energy 44, 682–691. doi:10.1016/j.energy.2012.05.024
Ang, B. W., Zhang, F. Q., and Choi, K.-H. (1998). Factorizing changes in energy and environmental indicators through decomposition. Energy 23, 489–495. doi:10.1016/S0360-5442(98)00016-4
Bianco, V., Cascetta, F., and Nardini, S. (2024). Analysis of the carbon emissions trend in European Union. A decomposition and decoupling approach. Sci. Total Environ. 909, 168528. doi:10.1016/j.scitotenv.2023.168528
Chen, Y. F., Yang, Y. D., Sun, L. R., Shen, Y. L., Wang, L. L., and Wang, X. (2021). Analysis of carbon emission and its influencing factors of Shanghai's textile and apparel industry. Int. J. Glob. Warming 25, 123–134. doi:10.1504/ijgw.2021.118355
Dong, J., Li, C. B., and Wang, Q. Q. (2021). Decomposition of carbon emission and its decoupling analysis and prediction with economic development: a case study of industrial sectors in Henan Province. J. Clean. Prod. 321, 129019. doi:10.1016/j.jclepro.2021.129019
Gong, X. M., Liu, J. M., Yi, F. X., and Liu, R. (2021). Study on the relationship between carbon emissions and economic growth in Xinjiang's textile and apparel industry. Silk 58, 79–84.
Hu, J., Chi, L., Xing, L., Meng, H., Zhu, M., Zhang, J., et al. (2023). Decomposing the decoupling relationship between energy consumption and economic growth in China's agricultural sector. Sci. Total Environ. 873, 162323. doi:10.1016/j.scitotenv.2023.162323
Huang, B. J., Zhao, J., Geng, Y., Tian, Y. H., and Jiang, P. (2017). Energy-related GHG emissions of the textile industry in China. Resour. Conservation Recycl. 119, 69–77. doi:10.1016/j.resconrec.2016.06.013
Huang, Z., and Zhang, X. (2024). Study on the carbon emission structure calculation and low-carbon pathways in the apparel and textile industry. China Fiber Insp., 94–99. doi:10.14162/j.cnki.11-4772/t.2024.07.023
Leal Filho, W., Perry, P., Heim, H., Dinis, M. A. P., Moda, H., Ebhuoma, E., et al. (2022). An overview of the contribution of the textiles sector to climate change. Front. Environ. Sci. 10. doi:10.3389/fenvs.2022.973102
Li, Y., Shi, R. J., Luo, Y., and Wang, L. L. (2017). Simulation of carbon emission peak and analysis of influencing factors in the textile industry: a case study of Ningbo. Silk 54, 36–42.
Li, Y., and Wang, Y. (2019). Double decoupling effectiveness of water consumption and wastewater discharge in China's textile industry based on water footprint theory. Peerj 7, e6937. doi:10.7717/peerj.6937
Li, Y., Zhou, L. Y., Cheng, Y. M., Qu, P., and Yang, Y. L. (2022). Simulation and influencing factors of carbon emission peak in Wenzhou's textile and clothing industry. Ind. Textila 73, 295–306. doi:10.35530/it.073.03.202122
Lin, B., and Moubarak, M. (2013). Decomposition analysis: change of carbon dioxide emissions in the Chinese textile industry. Renew. Sustain. Energy Rev. 26, 389–396. doi:10.1016/j.rser.2013.05.054
Liu, B. W., Zhang, X., and Yang, L. (2018). Study on the efforts of decoupling regional industrial carbon emissions based on LMDI. China Popul. Resour. Environ. 28, 78–86.
Lu, A., and Ma, Y. H. (2016). Study on the decoupling relationship between carbon emissions and industry GDP in China's textile and apparel industry. Wool. Spinn. Technol. 44, 65–70. doi:10.19333/j.mfkj.2016.04.016
Ma, Y. H., and Lu, A. (2015). Estimation of carbon emissions and analysis of influencing factors in the textile and apparel industry. Wool. Spinn. Technol. 43, 62–65. doi:10.19333/j.mfkj.2015.08.015
Peng, S.-Y., Liu, J.-Y., and Geng, Y. (2022). Assessing strategies for reducing the carbon footprint of textile products in China under the shared socioeconomic pathways framework. Clim. Change Econ. 13. doi:10.1142/s2010007822400048
Qi, X. F., and Liu, L. M. (2023). Analysis of carbon emissions in the production links of the Zhejiang textile supply chain. Logist. Technol. 46, 152–157. doi:10.13714/j.cnki.1002-3100.2023.20.030
Qiao, H. Y., and Wu, S. M. (2025). Decoupling factor analysis for sustainable development in China's four municipalities using the Tapio model. Sustainability 17, 2384. doi:10.3390/su17062384
Rivera-Niquepa, J. D., Rojas-Lozano, D., Jesus, P. M. D., and Yusta, J. M. (2023). Methodology for selecting assessment periods of Logarithmic Mean Divisia Index decomposition techniques. Energy Strategy Rev. 50, 101241. doi:10.1016/j.esr.2023.101241
Román-Collado, R., Cansino, J. M., and Botia, C. (2018). How far is Colombia from decoupling? Two-level decomposition analysis of energy consumption changes. Energy 148, 687–700. doi:10.1016/j.energy.2018.01.141
Shan, Y., Guan, D., Zheng, H., Ou, J., Li, Y., Meng, J., et al. (2018). China CO2 emission accounts 1997–2015. Sci. Data 5, 170201. doi:10.1038/sdata.2017.201
Shi, J., and Ning, J. (2022). Factors influencing carbon emissions and peak forecasting in China's textile and apparel industry. J. Beijing Inst. Fash. Technol. Nat. Sci. Ed. 42, 66–74. doi:10.16454/j.cnki.issn.1001-0564.2022.03.005
Tapio, P. (2005). Towards a theory of decoupling: degrees of decoupling in the EU and the case of road traffic in Finland between 1970 and 2001. Transp. Policy 12, 137–151. doi:10.1016/j.tranpol.2005.01.001
UNFCCC (2025). UN helps fashion industry shift to low carbon. U. N. Framew. Convention Clim. Change. Available online at: https://unfccc.int/news/un-helps-fashion-industry-shift-to-low-carbon (accessed on
Wang, L. L., Li, Y., and He, W. W. (2017). The energy footprint of China's textile industry: perspectives from decoupling and decomposition analysis. Energies 10, 1461. doi:10.3390/en10101461
Wang, L. L., Wu, X. Y., Ding, X. M., and Li, M. (2013). Analysis of energy consumption and carbon emission factors in China's textile and apparel industry. Environ. Sci. Technol. 36, 201–205.
Wang, Q., Zhao, M. M., and Li, R. R. (2019). Decoupling sectoral economic output from carbon emissions on city level: a comparative study of Beijing and Shanghai, China. J. Clean. Prod. 209, 126–133. doi:10.1016/j.jclepro.2018.10.188
Wang, X. P., Chen, X., Cheng, Y. M., Zhou, L. Y., Li, Y., and Yang, Y. L. (2020). Factorial decomposition of the energy footprint of the shaoxing textile industry. Energies 13, 1683. doi:10.3390/en13071683
Wang, Y., and Liu, Q. (2020). Carbon emission analysis of the apparel manufacturing industry based on energy consumption structure. Int. Text. Bull. 48, 54–59.
Wei, Z., Wei, K., and Liu, J. (2023). Decoupling relationship between carbon emissions and economic development and prediction of carbon emissions in Henan Province: based on Tapio method and STIRPAT model. Environ. Sci. Pollut. Res. 30, 52679–52691. doi:10.1007/s11356-023-26051-z
Xie, P. J., Gao, S. S., and Sun, F. H. (2019). An analysis of the decoupling relationship between CO2 emission in power industry and GDP in China based on LMDI method. J. Clean. Prod. 211, 598–606. doi:10.1016/j.jclepro.2018.11.212
Yan, S. H., and Chen, W. G. (2022). Analysis of the decoupling state and driving forces of China's construction industry under the carbon neutrality target. Environ. Sci. Pollut. Res. 29, 78457–78471. doi:10.1007/s11356-022-21266-y
Zha, J. P., Dai, J. Q., Ma, S. Q., Chen, Y. R., and Wang, X. H. (2021). How to decouple tourism growth from carbon emissions? A case study of Chengdu, China. Tour. Manag. Perspect. 39, 100849. doi:10.1016/j.tmp.2021.100849
Zhang, J. L., Weng, S. B., and He, L. (2024a). The role evolution of textile industry in China's economy during 2002-2020: an input-output analysis. Ind. Textila 75, 220–225. doi:10.35530/it.075.02.202324
Zhang, S., Gan, J., Zhang, R., Xu, C., Shen, C., Guo, R., et al. (2024b). Analysis of the driving factors of carbon emissions in the textile industry and its decoupling effect in the Yangtze River Delta ecological and green integration development demonstration zone. Environ. Sci. 45, 6796–6805. doi:10.13227/j.hjkx.202312208
Zhou, P., and Li, H. (2022). Carbon emissions from manufacturing sector in Jiangsu province: regional differences and decomposition of driving factors. Sustainability 14, 9123. doi:10.3390/su14159123
Zhou, Y., and Hu, T. (2025). Decoupling effect and driving factors of carbon emissions in hebei Province's logistics industry. J. Shijiazhuang Tiedao Univ. Soc. Sci. Ed. 19, 9–17. doi:10.13319/j.cnki.sjztddxxbskb.2025.01.02
Keywords: carbon emissions, economic growth, decoupling analysis, influencing factors, comparative study, China’s textile industry, 30 provinces
Citation: Hong Y, Ma L, Kang S and Zhang G (2025) Decoupling carbon emissions from economic growth in China’s textile industry: a decomposition of driving factors. Front. Environ. Sci. 13:1587498. doi: 10.3389/fenvs.2025.1587498
Received: 06 March 2025; Accepted: 28 April 2025;
Published: 20 May 2025.
Edited by:
Qunhai Huo, Chinese Academy of Sciences (CAS), ChinaReviewed by:
Wei Li, Taiyuan University of Technology, ChinaChang Shu, Beijing University of Chemical Technology, China
Chunxu Guan, Xiamen University, China
Copyright © 2025 Hong, Ma, Kang and Zhang. This is an open-access article distributed under the terms of the Creative Commons Attribution License (CC BY). The use, distribution or reproduction in other forums is permitted, provided the original author(s) and the copyright owner(s) are credited and that the original publication in this journal is cited, in accordance with accepted academic practice. No use, distribution or reproduction is permitted which does not comply with these terms.
*Correspondence: Lindong Ma, bWFsaW5kb25nQHpqbnUuZWR1LmNu; Guoqiang Zhang, YXFpYW5nODY4QHpqbnUuY24=