 Mo Li
Mo Li Yuezhang Hong
- School of Humanities and Social Science, The Chinese University of Hong Kong, Shenzhen, Guangdong, China
Effective demand-side mitigation requires a shift from growth-driven to sufficiency-driven consumption. Decent living standards (DLSs) serve as practical indicators for achieving distributive justice in demand-side mitigation policies. The concept has gained momentum due to its advances in addressing carbon inequality and promoting social justice. In China, DLSs remain deprived in hinterland cities and are excessively satisfied in central cities. By translating DLSs into city-level context-specific scenarios, this study assesses the avoided emissions that would have occurred from 2017 to 2050 under two DLS scenarios. We found that leveraging DLSs for all does not lead to an increase in national carbon emissions. A novel indicator of DLS deprivation, the decent living gap (DLG), was proposed to address city-level inequalities and guide redistributions among city clusters. Central cities need to contribute 33% toward closing the national DLG, with some cities needing to contribute as much as 69%. For high-income city clusters, 86% of their DLG is expected to be met through imports from lower-income city clusters. This DLG import will significantly reduce the mitigation burden of less developed regions. Our study provides valuable insights into equitable demand-side mitigation pathways that ensure DLSs for all.
1 Introduction
Demand-side mitigation requires a nuanced understanding of how reducing inequality can improve climate outcomes (Bruckner et al., 2022; D’Alessandro et al., 2020; Hubacek et al., 2017). Progress depends on both a substantial decline in overall final consumption and fair distribution of carbon emissions (Gurney et al., 2022; Hickel and Kallis, 2020; Kallis et al., 2018; O’Neill et al., 2020). Yet, efforts to lift living standards while lowering emissions often create inherent tensions. Recently, a growing body of research has emerged around the concept of “decent living standards” (DLSs)”— an informed resource-sufficiency framework (Keyßer and Lenzen, 2021; Millward-Hopkins and Oswald, 2023). DLS defines the minimum material conditions required for a decent life (Rao and Min, 2018; Rao et al., 2017). It was recognized and heavily cited in the Sixth Assessment Report of the Intergovernmental Panel on Climate Change (IPCC), particularly in chapter 5 on “Demand, Services, and Social Aspects of Mitigation” (IPCC, 2022).
The DLS framework advances the debate on carbon inequality and social justice. It is grounded in the principle of equal human rights and aims to ensure that every person has access to basic material needs. These include nutrition, shelter, sanitation, clothing, healthcare, education, communication, and mobility (Rao and Min, 2018). DLS integrates welfare targets with carbon limits and provides a practical basis for distributive justice in climate policy. It prioritizes fairness in individual wellbeing and establishes a baseline for essential living conditions. It also reframes environmental responsibility through a demand-side lens and allocates emissions based on material needs rather than economic activity. This makes it possible to estimate the minimum emissions required for everyone to achieve DLSs. Although the DLS framework is intended for global application, material and environmental needs vary across regions due to differences in geography, resources, technology, and social preferences.
A growing body of literature supports integrating DLSs into demand-side mitigation scenarios in recent years. One key finding is that elevating DLS scenarios will not necessarily lead to an overall increase in emissions. Bruckner et al. (2022) emphasized that poverty alleviation merely contributes to a 1.6%–2.1% increase in global emissions, which aligns with the findings of Hubacek et al. (2017). Another key finding involves mapping redistribution pathways. Equitable redistribution of income and emission responsibilities is essential and has been framed through concepts such as, “paying for the poor,” “recomposing consumption,” “fair inequality,” addressing “super-affluent,” and managing “fairly large inequality” (Millward-Hopkins and Johnson, 2023; Millward-Hopkins and Oswald, 2023; Oswald et al., 2021). Kikstra et al. (2021) developed decent living energy (DLE)-GDP and SSP scenarios and estimated that by 2040, the energy required for the world’s poorest in developing countries to achieve decent living standards would account for only one-quarter of the estimated additional consumption. The remaining three-quarters would be driven by increased consumption among wealthier populations. Millward-Hopkins (2022) explored a range of alternative income redistribution scenarios with varying levels of fairness. These scenarios have different Gini coefficients ranging from 0.13 (fair inequality scenario) to 0.52 (current). Millward-Hopkins and Johnson (2023) offered a redistributional assessment of low-energy demand pathways in the UK. They compared DLE and less advanced technology (LAT) scenarios, suggesting that 9 million people could fall short on DLSs, but this can be mitigated by considerably reducing income inequality. Millward-Hopkins and Oswald (2023) employed the low energy demand (LED) scenario (Grubler et al., 2018) and further suggested that if the current energy inequality remains constant, globally, 4 billion people will not have access to decent living energy. Pauliuk (2024) proposed a Lorenz curve-based model that reallocates income from the wealthiest to the poorest to leverage the impoverished to DLSs. The third goal of constructing DLS scenarios is to evaluate carbon disparities between the Global North and South. These studies argue that global sustainability can only be achieved if the affluent Global North adopts de-growth pathways while the Global South continues to pursue orderly resource growth. This strategy would enable absolute reductions in resource use in the Global North to offset the necessary increases in the Global South (IRP, 2019). Evidence shows that high-income populations already consume far above the decent living energy thresholds, whereas low-income groups still face severe energy deprivation (Oswald et al., 2020; Oswald et al., 2021; Otto et al., 2019).
The purpose of this paper is to introduce a new DLS deprivation scenario metric that can inform local decision-making. Although the literature has extensively explored the extent of DLS-informed energy inequality, studies focusing specifically on carbon inequality remain relatively limited. DLSs are unmet in deprived regions and excessively met in affluent cities. In cities, 70% of the total environmental impacts can be attributed to consumption elsewhere (Wiedmann and Lenzen, 2018; Wiedmann et al., 2020). Cities cannot be sustain without their hinterlands. Central cities depend on key provisioning systems, which are often located outside the city’s territorial boundary (Ramaswami et al., 2016; Ramaswami et al., 2012; Seto et al., 2021). The overconsumption behavior crisis in affluent cities drives up biophysical resources and ecological overshoots (Merz et al., 2023). Yet, less developed cities are more vulnerable to low-carbon transitions due to higher marginal mitigation costs (Liu et al., 2022). Energy burdens increase sharply in impoverished regions during the rapid transition of residential energy consumption (Wang et al., 2023).
We define decent living gaps (DLGs) as the gaps lying between the essential material requirements necessary for achieving DLSs and the actual levels of consumption or resources accessible to individuals or households (Kikstra et al., 2021). In this research, we apply this new DLS deprivation indicator as a case study to examine city-level consumption-based carbon emissions in China. The introduction of DLG contributes to the knowledge of how coordinated developments can be achieved through synergistic collaborations among cities. A primary goal of the “dual carbon” policy in China is eradicating poverty, which essentially involves elevating DLSs. China’s focus on equitable welfare aligns closely with the emerging global discourse on DLS-informed demand-side emission reductions (Semieniuk and Yakovenko, 2020). Yet, current domestic academic research offers limited quantitative insights into this issue (Yu et al., 2023). Given China’s unique socio-economic context, this framework cannot be directly applied from Western models without adaptation. This raises a critical question: in China, how much carbon do we ‘need’ to emit to provide a decent living for all (Rao et al., 2017; Virág et al., 2022).
To address this question, we propose a DLS-informed framework combining the macro-level multi-regional input–output (MRIO) model with micro-level household expenditure data. This approach simulates policy scenarios that align with DLSs, equity, and sufficiency, offering a case study for redistributive emission pathways. This approach introduces the DLG metric to quantify mitigation responsibility and its implication on coordinated regional strategies. By translating DLSs into the Chinese-specific context, this study estimates future carbon footprints (CFs) required and avoided for achieving DLSs in 2050 among 313 Chinese cities of different income levels under two DLS scenarios.
2 Materials and methods
2.1 Multi-regional input–output model and carbon inventories
The increasing adoption of MRIO models demonstrates its critical role in advancing the DLS framework and informing effective, context-specific climate strategies. Rao et al. (2019) used process-based LCA and the EXIOBASE MRIO model to demonstrate that energy sufficiency for DLSs in India, South Africa, and Brazil is compatible with the Paris Agreement’s 2°C target. They adopted a bottom–up approach by setting energy demand estimates to quantify the energy needed for services in various socio-economic sectors. Huo et al. (2023) used the EMERGING environmentally extended input–output (EEIO) model and estimated that emerging economies in Asia and Africa would generate an additional 8.6 gigatons of CO2 emissions to meet DLSs. They differentiated product-specific services such as housing and mobility (analyzed by LCA) from broader service demands such as food and education (analyzed by MRIO) and compared DLS-related emissions with national mitigation targets. Similarly, Yu et al. (2023) combined life-cycle assessment with the Carbon Emission Accounts and Datasets (CEADs) input–output framework to quantify provincial-level decent living energy thresholds in China, identifying a 33% potential for energy savings. Their bottom–up optimization approach considers technological heterogeneity, regional maturity for carbon mitigation, and nonlinear socio-economic dynamics to propose cost-effective and equitable emission strategies. Our study builds on the DLS concept following Rao et al.’s definition and applies a bottom–up method tailored to regional and service-specific differences under the Chinese-specific context. For example, similar to Huo et al.’s approach (using FAO dietary data to set the food DLS), we set our food DLS based on the dietary data from Springmann et al. (2018) published in The Lancet Planetary Health. Details of the scenario setting are described in the next section.
The EEIO analysis serves as a coherent modeling and analytical framework that illustrates the economic interconnections among various sectors across different regions based on the MRIO. This approach allows for the connection of household consumption to national commodities and services supply chains (Fan et al., 2022). The MRIO table illustrates the capital flows among various sectors both within and between interconnected regions. We adopt the most recent available Zheng et al. (2022) 2017 MRIO model from CEADs. The original final demand matrix was divided into 626 columns, representing the demand of urban and rural areas in all 313 Chinese cities. Cities are grouped into city clusters according to the classification outlined in “The Notice to Promote New Urbanization during the 14th Five-Year Plan Period (2021-25)” (NDRC, 2022).
In this research, city-level carbon inventories are adopted from Shan et al. (2018). The data include 46 socio-economic sectors and were derived following the IPCC administrative territorial approach, which ensures their robustness and consistency. We include 208 major cities provided in Shan et al.’s (2018) work, with the remaining 34% (or 105, totaling 15% of the GDP) of the cities being unavailable. The GDP and population data were gathered from the statistical yearbooks of the cities or their respective provinces. A concordance matrix is implemented to map the original 47 sectors to Shan’s 42 sectors (in the Supplementary Material). The 42 socio-economic sectors were grouped into 8 consumption categories consistent with those defined in the Chinese Statistical Yearbook. The household consumptions are categorized into food, clothing, residence, household facilities, transport, education, healthcare, and others. Among the eight consumption categories, an average of 70% of the total per capita carbon footprint was attributed to food, residence, and transport.
This study models China-specific DLSs by 2050. Most studies define DLS thresholds in physical units (e.g., kcal, m2, and tons). To integrate these findings into our model, we convert the physical quantities into percentage changes, which are then applied directly to the monetary final demand to simulate our DLS scenarios. All 313 Chinese cities are grouped into 19 city clusters based on the 14th Five-Year Plan. Cities that do not fall within any of these clusters are classified as “others.” Based on GDP per capita, cities are further categorized into three income groups. Cities with a GDP per capita above $14,300 are classified as the top 10% income group, those with a GDP per capita between $6,930 and $14,300 fall into the middle 40%, and those with a GDP per capita below $6,930 are classified as the bottom 50% income group. Cities categorized as “others” typically exhibit lower economic levels, with 69% falling within the bottom 50% income group and 28% within the middle 40% income group.
Our method is highly comparable to that of Huo et al. (2023). An ideal DLS threshold setting would involve adjusting activity levels (e.g., kilocalories per day or passenger-kilometers traveled) and then establishing a regression relationship with monetary final demand. However, due to the complexity of constructing such a regression, Huo et al. directly multiplied carbon intensity with the inverse Leontief matrix and his sectoral final demand. Similarly, for city-level carbon emissions, we begin by obtaining carbon intensity
Using 2017 as the reference year, we updated the technical coefficient matrix A for two scenarios. The percentage variation in the final demand of eight consumption sectors is scaled and included in the columns. An adjusted input vector x* and matrix A* emerged. The structure of sales is subsequently modified by applying the percentage change in the new total input x* to the original total input x. This ratio is applied to all the rows, leading to new intermediate demand A** and final demand y**. Consequently, the original table becomes imbalanced, meaning that total inputs no longer equal total outputs after calculating the new transaction matrix. To restore the balance of the table and thereby model endogenous changes across all sectors of the economy, a new total input x** and an updated intermediate demand table Z are derived from the revised final demand y** for each scenario.
2.2 Scenario matrix setting
We adopt Moran et al.’s (2020) method in simulating the final demand. The IPCC recognized his work in using MRIO to conduct DLS analysis (IPCC, 2022). We follow their approach by parametrizing consumers’ behavioral changes under different scenarios as reductions in household expenditure patterns while categorizing cities into three income-levels and distinguishing between urban and rural areas within each city type. For example, under the DLS scenario, expenditures on transport in urban areas of the top 10% income cities are estimated to have a 66.13% reduction in MRIO (Table 1). Estimating the feasible technical potential and likely changes in customer behavior is difficult, particularly given the limited literature of DLSs in the context of China. The reduction percentages applied in this study were based on an extensive review of existing literature and thoroughly discussed by the authors.
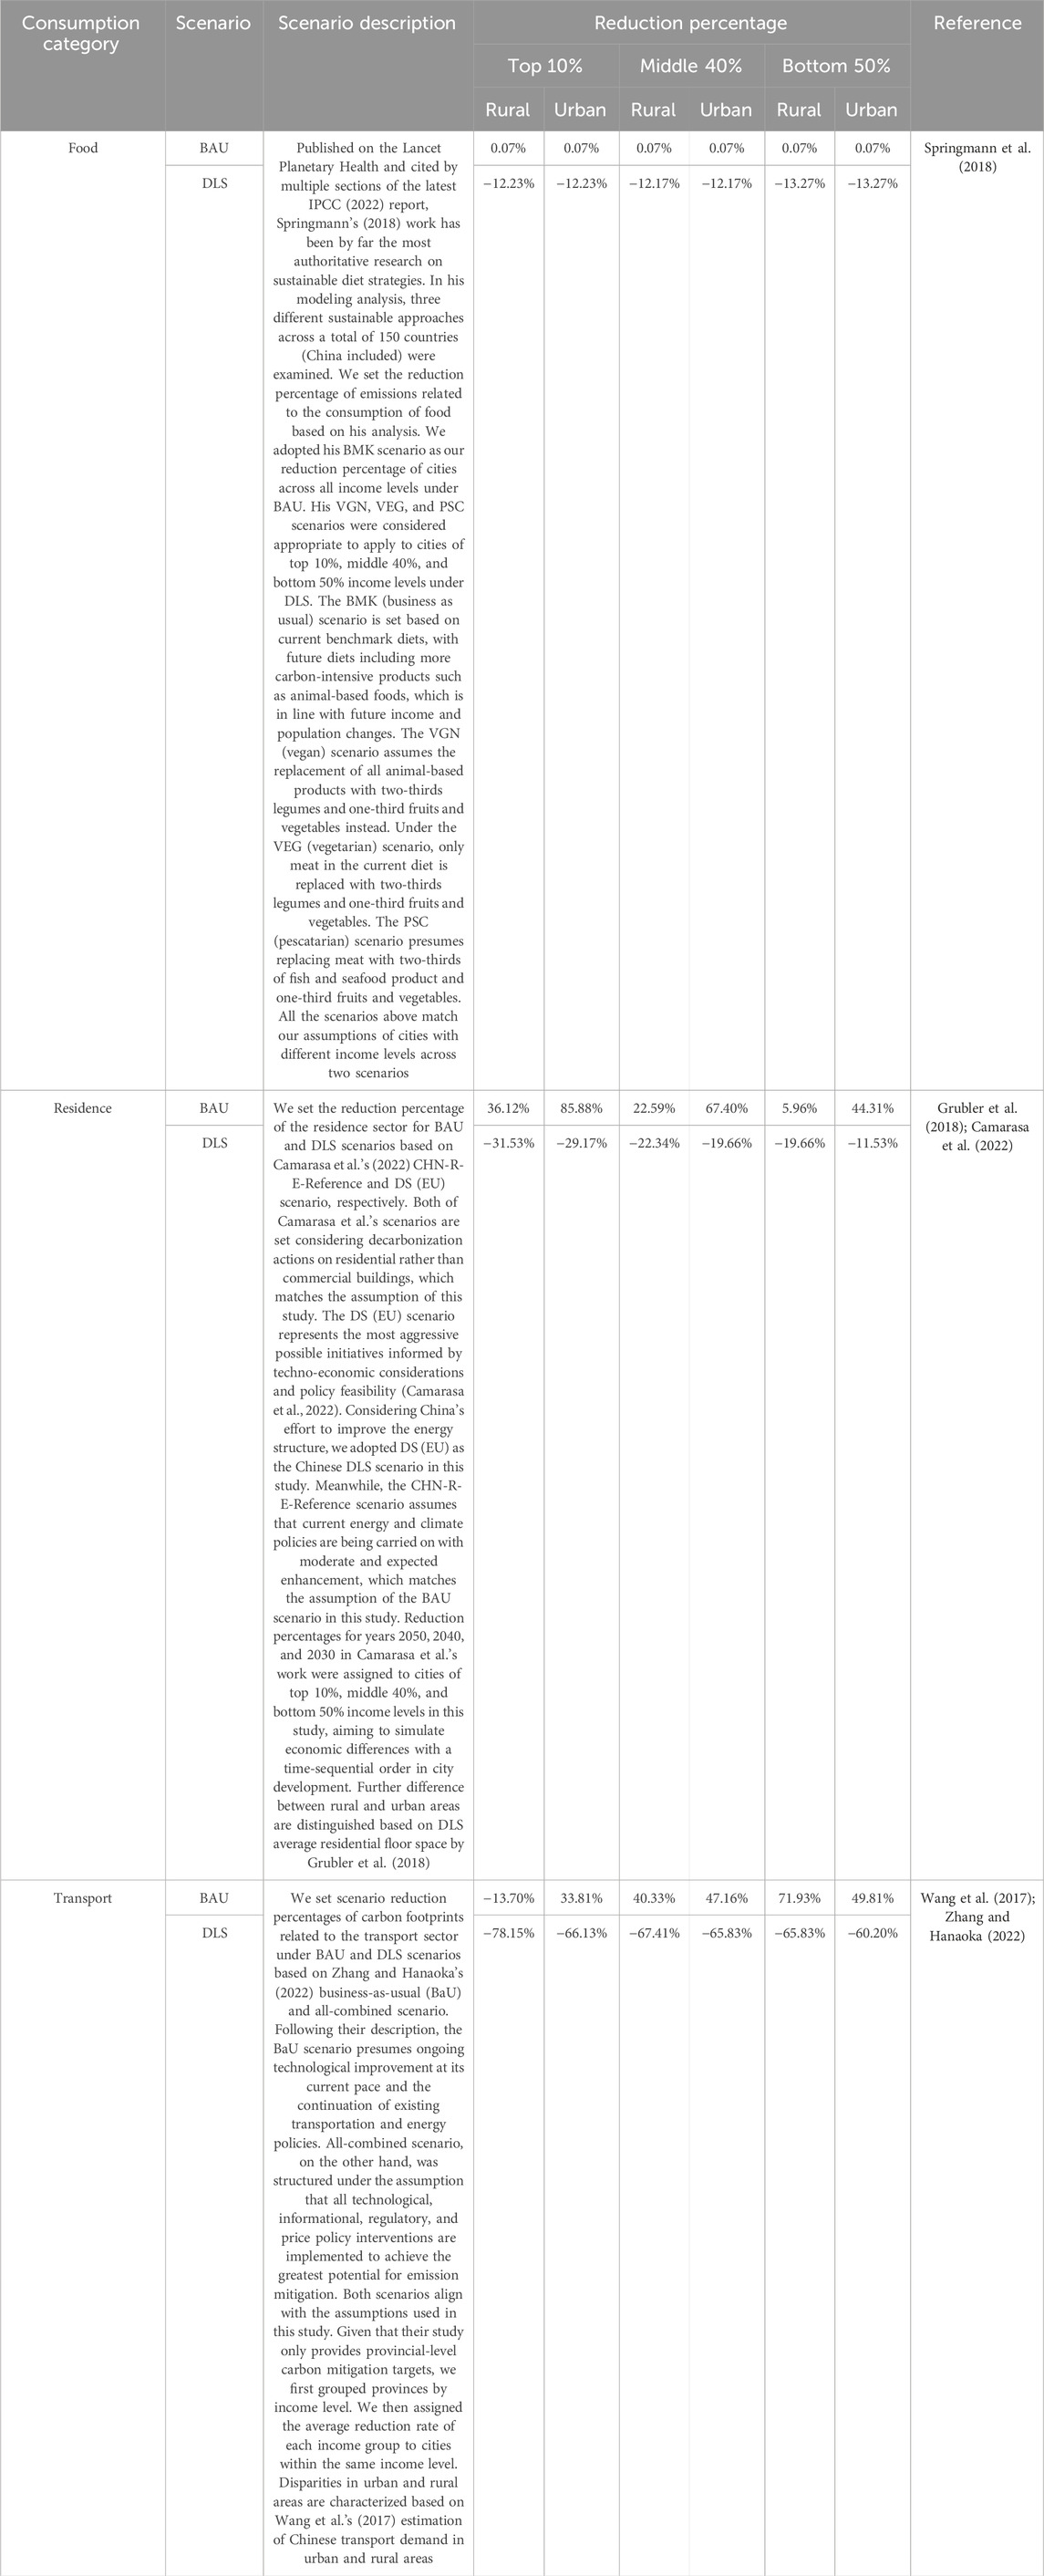
Table 1. Percentage reduction in carbon footprint by consumption category across income-level cities under each scenario (rural and urban area distinguished). Key assumptions and references are also provided.
Based on the outcomes of the literature review, we selected the most aggressive and the most lenient existing scenarios to represent the business as usual (BAU) and DLS scenarios, respectively. The detailed scenario matrix setting approach of these three sectors is described in Table 1. Carbon footprints related to consumption in food constitute the most substantial proportion of all categories, accounting for approximately one-third of all carbon footprints across scenarios (29% under BAU and 41% under DLS). The carbon reduction target in this sector was inspired by Springmann et al.’s (2018) work. In our study, the BMK scenario was assigned to all cities under the BAU scenario. VGN, VEG, and PSC scenarios were designated as benchmarks of cities of the top 10%, middle 40%, and bottom 50% income levels under the DLS scenario. Due to similar dietary patterns and nutritional requirements for urban and rural populations, we set uniform reduction targets for both areas. The carbon reduction target in the transport sector was adopted from the work of Zhang and Hanaoaka (2022). Based on the scenario description, targets under Zhang and Hanaoka’s BAU and ALL (with all available technical, informatic, price, and regulation implementations applied) scenarios are considered appropriate to be the baseline of our BAU and DLS scenarios. Different carbon reduction targets for urban and rural areas were defined based on the estimated transport demand in the year 2050 (Wang et al., 2017). The reduction percentage in the residence sector was adapted from the research of Camarasa et al. (2022). Their original scenarios include the reference scenario (current technology and current policy along with moderate policy enhancement) and the decarbonization scenario (the most ambitious actions within each country). CHN-R-E-Reference (China’s residential building under the reference scenario) and DS(EU) (Europe’s residential building under the decarbonization scenario) scenarios in the study were chosen to match the BAU and DLS scenarios, respectively. Carbon reduction percentages in urban and rural areas were distinguished based on the DLS housing threshold for the years 2020 and 2050 (Grubler et al., 2018). Mitigation actions, including aggressive promotion of net-zero energy buildings, complete retrofitting of existing buildings, and full electrification of heating, water heating, and cooking, were taken into consideration.
Currently, there is limited literature setting scenarios specifically for mitigation in the context of China. Therefore, to the best of our knowledge, the scenario matrices we provide are the most thorough compilation of China-specific, bottom–up, sectoral studies on carbon mitigation related to these sectors.
2.3 Decent living gap
Following the definition of decent living gaps by Kikstra et al. (2021), we define a city-level DLS deprivation indicator, “DLG,” as the difference in carbon footprints in 2050 under the BAU and DLS scenarios. The DLG is made up of two components: domestic decent living gaps (DDLGs) that persist within the city and DLGs embodied in import (DLGEI) from other cities. Certain DLGs from the city are essentially reflected in exports (DLGEE) to fulfill consumption needs in other regions. The DLG reflects the amount of carbon footprint the assessed city must eliminate to achieve the DLS scenario by 2050. A positive DLGEE indicates that the targeted city has exported its share of mitigation responsibilities to other areas, whereas a positive DLGEI implies that the city is assisting other regions in meeting their responsibilities.
3 Results
3.1 Overview of the central city carbon footprint by per capita GDP
By comparing carbon footprints of 18 central cities under BAU and DLS scenarios (Table A1), our study reveals a broad 38% reduction in carbon footprints on average. Beijing records the highest total DLG at 40.0 Mt, followed by Shanghai (34.6 Mt), Shenzhen (34.0 Mt), and Guangzhou (30.4 Mt). Although Shenzhen leads with the highest per capita GDP, its DLG remains disproportionately high relative to Ordos, which has the second-highest per capita GDP ($45,771) but a much lower DLG of 10.1 Mt. This weak correlation between per capita GDP and DLG (0.46) contrasts with the strong correlation observed with aggregate GDP (0.97), indicating that the total economic scale and population are far stronger predictors of decarbonization responsibility. Several cities with the highest per capita carbon footprint are designated as national energy centers or heavy industry centers despite their insignificant aggregated GDP. For instance, Ordos, one of the country’s key resource extraction cities, has an 8.4 tons per capita footprint. In contrast, affluent megacities such as Shenzhen (4.6 ton/cap, with a GDP 7 times that of Ordos) and Shanghai (2.3 ton/cap, with a GDP 9.7 times that of Ordos) exhibit much smaller per capita carbon footprints. In contrast, megacities such as Beijing and Shanghai face large mitigation burdens due to their expansive service economies and consumption-based emissions. This result aligns with the global pattern, illustrating that countries with the highest per capita carbon emissions globally are primarily energy producers, such as Qatar (Zheng et al., 2023).
In general, Chinese central cities are also struggling to outperform the globally recognized economic hubs (Tokyo, London, San Francisco, and New York). Under the BAU scenario, the total annual carbon footprints of Chinese central cities range from 14 million tons (Fuzhou) to 99 million tons (Beijing). Six central cities, collectively contributing to 16% of the national GDP, are estimated to have a higher carbon footprint than that of Tokyo in 2019 (and, therefore, higher than those of all four selected international cities). Only two cities exhibit carbon footprints lower than all four international cities, accounting for merely 1% of the national GDP. Under the DLS scenario, the total annual carbon footprints range from 9 million tons (Fuzhou) to 59 million tons (Beijing). In this scenario, Chinese central cities demonstrate carbon footprints that are more comparable to those of international cities. Specifically, the emission level of Shenzhen is comparable with that of Tokyo in 2019, Guangzhou’s carbon footprint aligns with that of New York’s 2020 level, Zhengzhou’s emissions are on par with those of London in 2019, and Changsha exhibits a carbon footprint similar to that of San Francisco in 2020. However, among all four city pairs mentioned above, Chinese cities have, on average, 66% less economic output. Shenzhen distinguishes itself with the highest per capita GDP among all selected Chinese cities, exceeding that of London in 2019 by 12%, while emitting a significantly greater amount (46% more) of carbon.
3.2 Mapping intra- and inter-city cluster redistribution of decent living gaps
3.2.1 Coordinated development within megacity clusters
Central cities consistently act as net DLG importers (Figure 1). In the PRD cluster, Shenzhen stands out as the largest DLG importer, drawing 3.3 Mt from Guangzhou, 1.6 Mt from Foshan, and 1.3 Mt from Jiangmen. Conversely, cities like Zhaoqing and Jiangmen exhibit strong net DLG export values of 3.2 Mt and 2.8 Mt respectively This suggests significant decarbonization responsibilities are being shifted toward the urban core. In YRD, Jiaxing emerges as a key importer (2.2 Mt), while Nanjing functions as the largest exporter with 3.7 Mt net DLG export. 15 of 26 cities in the cluster have weak DLG exchange activities (net values between 0–0.3 Mt). This indicates limited redistributive interactions within YRD and possibly less integration within the regional mitigation effort. However, YRD remains the most prominent coordinator of national demand-side mitigation due to its leading DLGEI and DLGEE amount.
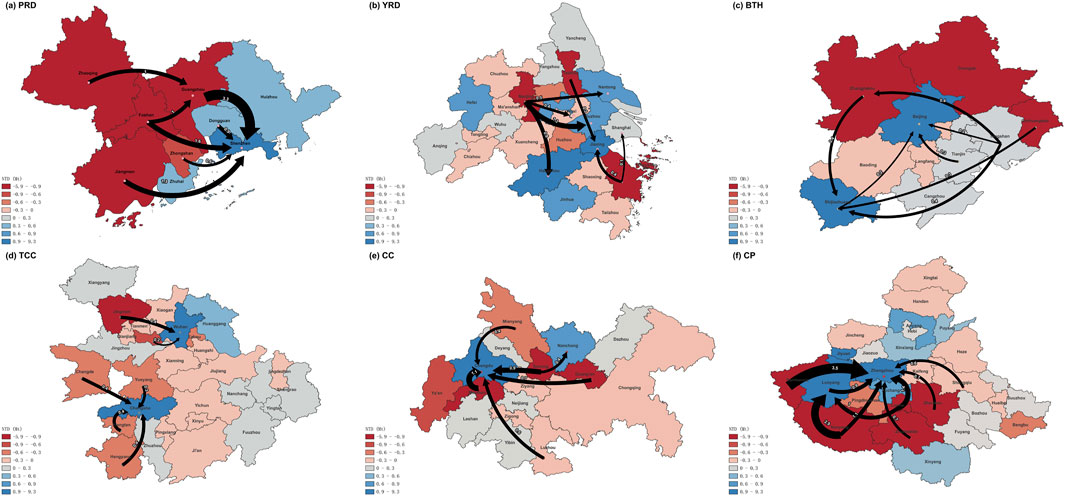
Figure 1. Intra-cluster distribution of net trade deficits (NTD) and intercity DLG flows within six major Chinese city clusters: (a) PRD, (b) YRD, (c) BTH, (d) TCC, (e) CC, and (f) CP.
Beijing (1.7 Mt inflow) and Shijiazhuang (1.9 Mt) are central importers in the BTH cluster sourced by exporters such as Zhangjiakou (1.8 Mt), Qinhuangdao (1.1 Mt), and Shijiazhuang (1.0 Mt). In the TCC cluster, Wuhan and Changsha import 1.8 Mt and 1.5 Mt, respectively. The majority of cities in TCC—21 of the 29—exhibit marginal exchanges under 0.3 Mt, which reinforces the dominant role of central cities in absorbing mitigation responsibilities. In the CC cluster, Chengdu imports a significant 4.5 Mt from nearby cities, including Meishan (1.1 Mt), Suining (0.9 Mt), and Guang’an (0.7 Mt). Finally, the CP cluster features a dual-core pattern with Zhengzhou and Luoyang importing 9.3 Mt and 4.5 Mt, respectively, from major exporters such as Nanyang (5.9 Mt), Sanmenxia (4.9 Mt), and Luohe (4.3 Mt). These findings consistently demonstrate that mitigation efforts are being structurally offloaded from peripheral to central cities, which are better positioned economically and infrastructurally to shoulder decarbonization demands.
When examining the five major city clusters with the highest carbon emissions (PRD, YRD, BTH, TCC, and CP), several shared features can be observed (Figure 2). First, PRD, BTH, and TCC exhibit a higher concentration of central cities, indicating a stronger aggregation of political, economic, and service functions within these clusters. In contrast, YRD and CP display a more distributed urban structure, with a lower concentration of dominant central cities. Second, YRD possesses the highest overall socio-economic level among the five clusters, as reflected in its leading aggregated GDP. Meanwhile, CP is characterized by a higher degree of industrialization compared to the others. Third, all five clusters have achieved an urbanization rate exceeding 50%, with PRD notably surpassing 80%, underscoring their advanced urban transition stages. These underlying socio-economic and structural characteristics contribute to the distinct patterns of carbon emissions and reduction potentials observed across these major city clusters.
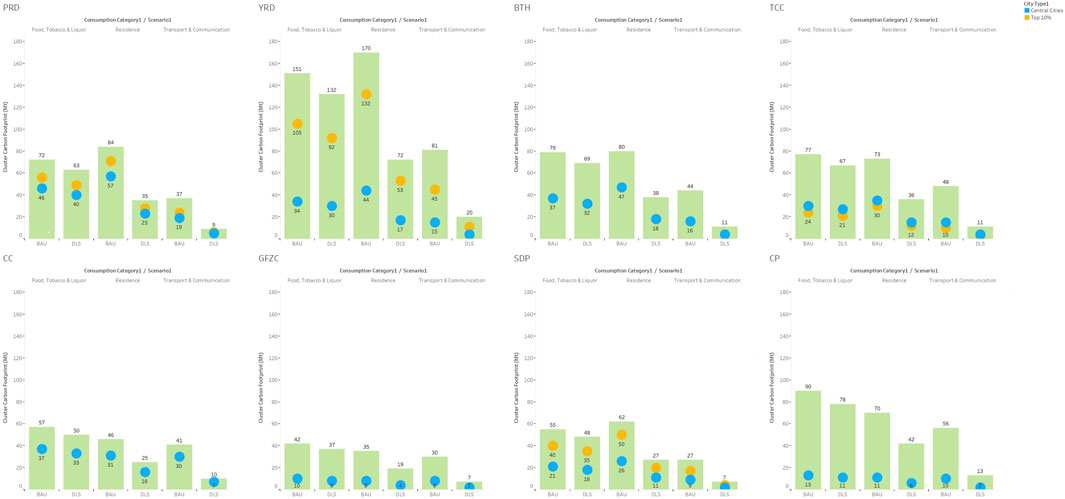
Figure 2. Carbon footprint of city clusters, central cities and top 10% income cities related to consumption in Food, Residence and Transport across three scenarios.
In the food sector, the absolute value of carbon footprint in PRD, YRD, BTH, TCC, and CP city clusters exhibits prominence, identifying these five city clusters as possessing the highest carbon emissions. YRD city cluster emerges as the foremost contributor, yielding an approximate carbon emission of 150 million tons under the BAU scenario and 132 million tons under the DLS scenario. In comparison, the remaining three city clusters demonstrate varying carbon emission levels, ranging from 42 to 56 million tons under BAU and 37 to 50 million tons under DLS. Within this sector, DLG percentage (reduction percentage from the BAU to the DLS scenario) is approximately 12% across scenarios, given marginal disparities in carbon footprint reductions attributed to the production, delivery, and purchase of food, tobacco, and liquor. Tilman and Clark (2014) revealed a strong positive correlation between the total per capita caloric demand and income level (with a correlation coefficient exceeding 0.95). With a common estimation that China’s economy will continue to grow by 2%–3%, on average, until 2050, it implies that the carbon footprint from consumption in the food sector may not undergo significant mitigation in the future. In general, central cities contribute to 39% of the overall carbon footprint within city clusters. This percentage varies from 15% (CP) to 66% (CC), signifying an escalating trend of carbon inequalities between central cities and their hinterlands. Notably, no relevance between carbon inequality and income level was found. This lack of correlation stems from the fact that both the absence of megacities, as evidenced in the low-income level CP city cluster, and the high total carbon emission, as exemplified in the high income-level YRD city cluster, can lead to such a situation. Across all city clusters, the central cities of PRD and CC feature prominently, jointly holding 65% and 63% of DLG within their respective city cluster. This highlights a significant allocation of mitigation responsibilities, primarily attributed to the prevailing and pronounced hinterland effect. The central city of the CP city cluster exhibits a relatively modest DLG share of 14%.
In the residence sector, the city clusters of PRD, YRD, BTH, TCC, and CP persist in showcasing the highest carbon emissions. Similar to the patterns observed in the food sector, the YRD city cluster remains the dominant contributor. Under the BAU scenario, its carbon footprint exceeds that of the other four city clusters by approximately 2.0–2.4 times, and under the DLS scenario, it remains 1.7 to 2.1 times higher. Within the residence sector, the DLG percentage varies from 41% (CP) to 58% (PRD). YRD and SDP city clusters also exhibit high mitigation potential, with DLG percentages of 57% and 56%, respectively. In general, central cities contribute an average of 48% to the overall reduction potential. Compared to the food sector, the percentages of central city carbon footprints in the residence sector are larger, ranging from 18% (CP) to 74% (CC). Central cities in PRD and BTH city clusters also bear a significant mitigation responsibility share of 69% and 67%, respectively. Despite the YRD city cluster contributing nearly 20% of the total domestic GDP, its central cities merely take up 27% of its total mitigation potential. Such a comparatively lower percentage implies that no significant relationship between carbon inequality and income level can be discerned. Notably, central cities in the residence sector bear the largest proportion of mitigation responsibilities among all three major consumption categories. Specifically, central cities in four city clusters (PRD, BTH, TCC, and CC) of all eight have a share exceeding 50%.
Within the transport sector, the YRD city cluster exhibits the largest carbon footprint among eight major city clusters, followed by CP, BTH, TCC, PRD, and CC city clusters. Notably, although falling behind in the residence and food sectors, the carbon footprint of the CC city cluster in the transport sector is approximately equivalent to that of BTH and TCC city clusters. DLG percentages from BAU to DLS scenarios were observed to be similar across city clusters. All city clusters are estimated to undergo a radical 75% reduction in the transport sector.
Although the percentage contributed by central cities within each city cluster shows a similar range (18%–72%) to the two sectors mentioned above, cities corresponding to the extremum differ. The central cities of the YRD city cluster were found to contribute the least to carbon mitigation, while the central cities of the CC city cluster contributed the most. Similar to observations in the food sector, central cities in PRD and CC remain the only ones to account for 50% or higher carbon reduction share.
3.2.2 Responsibility among city clusters
Net trade deficits in decent living gaps of six major city clusters (city clusters with the highest carbon footprint emissions) and the distributions of DLGs embodied in export, import, and domestic consumption are shown in Figure 3.
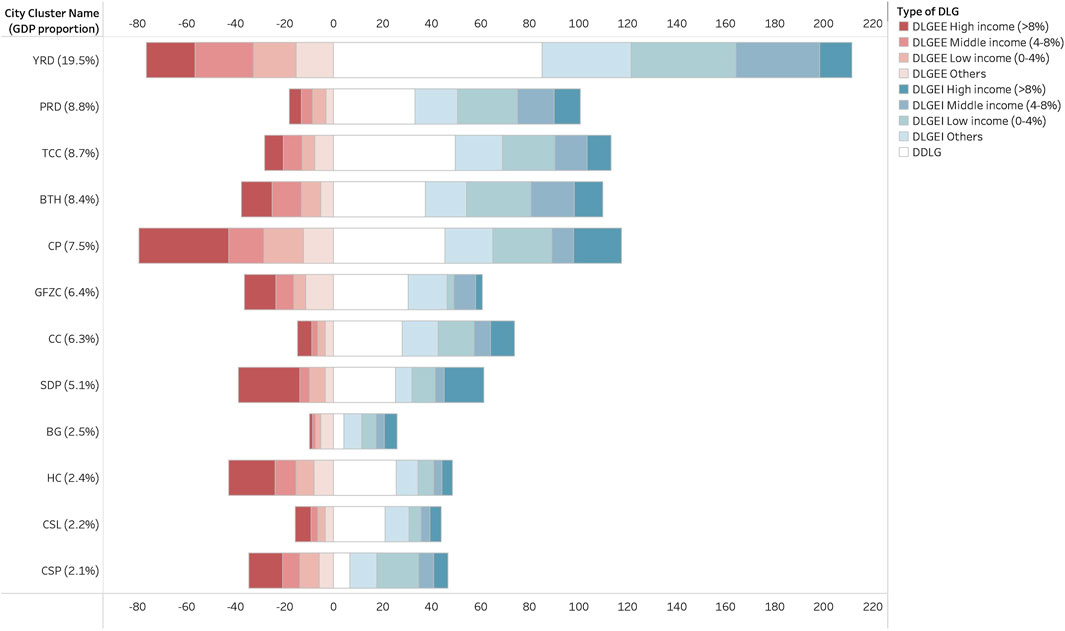
Figure 3. Decent living gaps embodied in export (DLGEE), import (DLGEI) and domestic activities (DDLG) decent living gaps. Proportion of GDP of each city cluster are shown on vertical axis. DLGEI/DLGEE source city clusters are categorized based on their respective GDP proportions.
As for the sum of DLG embodied in import and domestic activities, the YRD cluster emerges as the largest consumer of DLG, accounting for approximately 21% of the national total consumption-based DLG. As a high-income cluster, YRD also contributes approximately 18% of the total DLGEE, indicating its dual role as a major demander and redistributor of mitigation obligations. PRD, BTH, TCC, and CP city clusters each contribute approximately 10% to the consumption-based DLG flow. The remaining city clusters are proven to have an even smaller amount of DLGEI and DDLG, suggesting a minor role in demand-side mitigation efforts. CP stands out as the only major net importer of DLG, absorbing a total of 78 Mt primarily (46%) from high-income city clusters. This is consistent with CP’s role as a national transportation hub and industrial heartland with relatively lower per capita income and technological readiness. CP’s import-dependency reflects a structural reliance on more developed clusters to offset its own mitigation constraints. BTH, GFZC, SDP, CSP, and HC clusters contribute 8% of the total DLGEE. Contributions from the remaining city clusters range from 2% to 4%, indicating a more constructive role in mitigation endeavors.
Within each city cluster, the proportion of DLGEE decreases in tandem with the economic status of the target city clusters. Across all clusters, 40% of DLGEE is directed toward high-income clusters, 22% to middle-income clusters, and 20% to low-income clusters. SDP stands out with 64% of total DLGEE, which is allocated to high-income city clusters. A similar trend can also be observed within the BG city cluster, where 60% of the total DLGEE is directed toward high-income city clusters. This pattern suggests that affluent city clusters are assigned more mitigation responsibilities. Regarding the consumption-based DLG, DDLG constitutes the largest share of total DLG (40% on average), and import DLG accounts for the remaining 60%. Low-income clusters are the source of 38% of total DLGEI, while imports from high- and middle-income clusters make up just 11% each. This trend indicates a substantial transfer of mitigation responsibilities from impoverished to affluent city clusters on a significant scale, while such import–export dynamics appear less pronounced in domestic production activities.
The net trade deficit of virtual DLGs of six major city clusters is shown in Figure 4. Net DLG exporters have an increased share of responsibility compared to DLG importers, indicating their export of carbon reduction responsibility alongside their business activities. It is observable that most Chinese city clusters are DLG importers.

Figure 4. DLG import/export direction and amount are shown. Directions of the arrows represent DLG import/export. The thickness and number on each arrow indicate the amount of DLG import/export of each city cluster. The color of each city cluster represents the DLG net trade deficit (NTD).
The only net CF importer, the CP city cluster with merely 19 million tons of DLG import, is located in the central plain in middle China and has proven to be the national transport hub. If consolidated at the economic zone level, net virtual DLG predominantly flows to the CP city cluster. The YRD city cluster, serving as its largest DLG trading partner, exports and imports a substantial DLG quantity of 7.2 million tons from the CP city cluster. The HBOY city cluster, recognized as one of the national energy centers, exports a comparable amount of 7.1 million tons of DLG to the CP cluster. In 2017, the first and second industries collectively accounted for 57.5% of the GDP in the CP cluster, suggesting a relatively conventional industrial structure reliant on production. This production-oriented framework may contribute to the significant volume of DLG imports.
The net exporting city clusters are YRD (50 million tons), PRD (49 million tons), TCC (35 million tons), and BTH (34 million tons) city clusters. The CC city cluster has the smallest import DLG of 31 million tons. This pattern implies that to achieve decent living for all, affluent city clusters should bear greater mitigation responsibilities by importing DLG from less developed regions. These import activities may potentially alleviate the burden of balancing economic growth and mitigation for less developed regions.
DLG export activities of a small amount can be observed from affluent city clusters to less developed city clusters such as BG or CY. Major provinces in these city clusters have been shown to exhibit significantly higher rates of renewable energy utilization than the national average (National Energy Administration, 2018). Consequently, there is less pressure on these two city clusters during the mitigation process, and hence, it is rational for these two city clusters to import DLG from other regions to alleviate mitigation pressures.
3.3 Per capita city carbon footprint across consumption categories and scenarios
We compare the composition of carbon emissions across eight consumption categories (Figure 5). Based on approaches described in former studies (Hubacek et al., 2017; Mi et al., 2020; Moran et al., 2020), all 313 cities were classified into three categories based on income-level (top 10%, middle 40%, and bottom 50%). We found that among all eight consumption categories, food, residence, and transport account for 70% of the total footprint. Most of the reduction potential to reach the DLS scenario in 2050 is in the transport and residence sectors (approximately 44% and 34% of total reduction potential) and, to a lesser extent, in food (21% of the total reduction). The top 10% income group consistently exhibits the highest emissions.

Figure 5. Per capita carbon footprint across three major consumption categories (food, residence, and transport) across three scenarios.
The residence sector, which exhibits the largest decent living gap (averaging 0.44 tons per capita per year), contributes 44% of the reduction potential among the three major consumption categories. Meeting DLS for all by 2050 would require a radical 43.2% reduction for each individual. Under the BAU scenario, per capita emissions are estimated to reach 1.7, 0.9, and 0.5 tons for the top 10%, middle 40%, and bottom 50% cities, respectively. Transport represents the second-largest DLG, averaging 0.34 tons per capita per year, compromising 34% of the reduction potential within the three major consumption categories. To attain the DLS scenario, a drastic 71% carbon footprint reduction per individual is imperative for this sector despite having the smallest absolute value of carbon footprint among all three categories. DLG for food averages 0.21 tons. The carbon footprint resulting from consumption in this sector remains consistent across scenarios, and it is comparable across the three income-level cities. Carbon reduction in this sector contributes merely 21% of the total reduction of all three major consumption categories. Such limited potential may be attributed to similar diets, food production, trading system, and social norms across China.
4 Discussion
4.1 DLS-informed carbon mitigation targets will not increase emissions
We find that elevating DLS does not necessarily result in higher national emissions. Instead, it leads to a 24% overall reduction. Chinese city clusters are expected to achieve 25% carbon mitigation by 2050 compared to the 2017 baseline. Yet, the absolute value of reduction varies. YRD, which contributes the largest national GDP share, is required to reduce its carbon footprint by 115 million tons by 2050 in order to align with the national DLS target. PRD, BTH, and TCC, sharing similar GDP contributions, are each expected to experience reductions of 56 million tons. Despite being categorized as a middle-income city cluster, the CP city cluster emerges as the second-largest contributor to the overall mitigation effort. This reflects its unique position as the national manufacturing and transportation center. These findings are consistent with prior research findings and resonate with the equity principle emphasized in the Sixth Assessment Report of the IPCC (2022). The equity principle advocates for a ‘just transition,’ which ensures an equitable transition and distribution of costs and benefits across all regions. Based on this principle, wealthier regions should contribute considerably more to the process. Huo et al. (2023) suggested that an additional emission of 8.6 Gt will be necessary in order to achieve DLS in emerging economies. This aligns with our findings, indicating that to achieve decent living for all, higher-income-level city clusters should collectively bear a significantly (62%) larger reduction amount than lower-income-level city clusters.
Evidence has established that eliminating poverty and decreasing inequality constitute integral components of sustainable development (Roy et al., 2018). Therefore, it is crucial to select a suitable pathway within a sustainable framework while reducing inequality. In rural areas, there is generally less pressure on natural resources, and aboveground carbon emissions tend to decrease during the urbanization process (Zhang X, et al., 2022). Hence, China’s rural revitalization movement has been linked to Western de-growth discourse in various aspects such as justice, democracy, and criticizing global capitalism (Alcock, 2019). Climate policies could burden the poor with increasing energy and food prices (Soergel et al., 2021). Therefore, it is important to ensure a process of poverty alleviation without overshooting climate targets (Bruckner et al., 2022). Compared to top–down governing organizations, rural cooperatives, which are run by peasants themselves, underscore the democratic aspect of this movement through voluntary and democratic operations (Day, 2008). This form of democratic participation enables non-elites to participate in rural management, mobilizing rural development through collective actions (Li et al., 2023). Kallis (2011) defined the term “de-growth” as “a socially sustainable and equitable reduction (and eventually stabilization) of society’s throughput” (p.874), criticizing Western models of development and market globalization (Schneider et al., 2010). The rural revitalization movement is labeled with similar ideas, arguing that European modernization theories are unsuitable for China due to high social and environmental costs (Wen, 2007; 2008). In our research, cities’ and city clusters’ environmental responsibilities are attributed based on DLG flows around the nation. This approach ensures that the process of poverty alleviation in less developed regions is facilitated by affluent regions without compromising national mitigation efforts.
4.2 DLS-informed scenarios address city-level inequality within a city cluster
DLS is unmet in deprived cities and excessively met in affluent cities. Emphasis on reducing inequality within city clusters is crucial for establishing feasible mitigation targets due to the substantial inequalities and regional heterogeneities in developing economies (Yu et al., 2023). City clusters consist of economically developed central cities and their surrounding satellite cities, which often exhibit significant interdependence. Central cities rely heavily on essential provisioning systems, which are frequently located beyond their territorial boundaries. On average, central cities produce less than 10% of their food, with extreme cases such as Shenzhen, where only 2% of land is designated as permanent crop land (Shenzhen Municipal Planning and Natural Resource Bureau, 2019). Current urbanization trends have intensified the urban–rural divide, leading to inequalities in energy (Wang et al., 2023) and income levels (Sicular et al., 2007). C40, Arup, Leeds., U.o. (2019) reported that 85% of emissions related to the goods and services consumed in global cities are imported from elsewhere. A much smaller yet still considerable proportion of 38% (Figure 1) was found in this research among all Chinese city clusters under the DLS scenario. This outsourcing reflects broader inequalities in China’s interregional trade, where wealthier regions export environmental burdens to less developed areas while exporting low-value-added products (Yang et al., 2019).
To address inequalities among Chinese cities, we incorporate the DLG to measure the carbon mitigation effort required for each city or cluster to meet DLS thresholds. Following the definition of water exceedance and surplus footprints (Li et al., 2020), DLG is defined as the difference between carbon emission under the BAU and DLS scenarios. It established carbon reduction as part of the ongoing effort to enhance the sustainability of the current business trade framework. The attractiveness of this metric lies in its capacity to enlighten solutions on the demand side, offer an alternative perspective on the allocation of responsibility-based on consumption, and harmonize the trade-offs among sustainability objectives at various scales. Decision-makers gain the ability to visually assess regions that consume goods representing carbon footprint differentials from other regions within the supply chain.
Within-cluster DLG flow patterns highlight a prominent center–periphery structure within all six examined city clusters, reinforcing the spatial asymmetry of mitigation responsibilities. Central cities—particularly Shenzhen, Beijing, Wuhan, Chengdu, and Zhengzhou—consistently act as net DLG importers. These flows align with their economic dominance and high per capita consumption and underscore their reliance on hinterland cities and their assistance in relieving carbon reduction burdens in peripheral regions. Non-central cities consistently exhibit negative NTD values and act as major DLG exporters. These cities are often industrially specialized or resource-dependent and need to outsource their mitigation pressure toward the more affluent urban core. The magnitude and direction of arrows in Figure 4 reveal that urban cores attract a disproportionate share of consumption-based DLG to offload mitigation needs for surrounding areas. This dynamic exposes a significant policy challenge: affluent cores depend on structural inequalities in DLG distribution to maintain consumption patterns without internalizing corresponding mitigation costs. To address this, city-cluster-level carbon budgeting must include intra-cluster DLG flow accounting. Emphasizing hinterland capacity building and investment in local decarbonization strategies is essential for equitable transitions. The results affirm that redistribution logic—previously applied at the national or inter-cluster levels—must now also be enforced within clusters.
Although our study’s DLS scenario sets ambitious reduction targets, it remains aligned with China’s broader demand-side mitigation goals by incorporating differentiated reduction pathways across regions and sectors. Our DLG responsibility-sharing mechanism suggests that central cities (constituting 30 out of 313 cities) should collectively contribute 35% to the national total DLG. This share increases to 46% in the residence sector. Central cities, hence, share far more environmental responsibility in carbon mitigation than other cities. Redistribution within city clusters, characterized by radical carbon reduction in central cities and less radical reduction or mild increase in surrounding cities, is necessary in the Chinese context. Zheng et al. (2023) proposed a city-level carbon quota allocation system through inter-city supply chains. This enables resource-constrained cities to pursue low-carbon development without undergoing a carbon-intensive “development cycle.” This is particularly relevant given that all central cities analyzed in our study are classified as high-tech hubs and exhibit higher emissions: 16 of 20 top city emitters are central cities. Under the DLS scenario, their per capita emissions align closely with global averages. This alignment is consistent with the assumption of the deep mitigation scenario by Zheng et al. (2023) (all high-tech cities aim to reduce emissions to the global level).
4.3 DLS-informed scenarios ensure the redistribution of income and emissions among city clusters
This research applies equitable redistribution among income and emission responsibility to Chinese city clusters. Our redistribution scenario closely aligns with “paying for the poor” and “fair inequality” scenarios (Millward-Hopkins and Johnson, 2023; Millward-Hopkins and Oswald, 2023; Oswald et al., 2021). Assigning environmental responsibilities based on the import and export of DLG helps address environmental equity issues among city clusters of varying levels of affluence. Our research indicates that the directions of DLG flows vary with the socio-economic status of the city clusters. Of all 19 city clusters, 17 exhibit a positive DLG import to cities that are not affiliated with any city cluster (less developed). WL and NY city clusters, which are two city clusters with the lowest GDP contribution (0.4% of the national total each), also exhibit net DLG export behavior. All four city clusters of high income (with aggregated GDP contributions larger than 8% of the national total) exhibit a positive DLG import, indicating their commitment to assisting other regions in meeting mitigation targets. Three out of four middle-income city clusters tend to have a negative DLG import, indicating their adverse effect on mitigation efforts as they export their own mitigation targets to other regions. Among all, the largest DLG exporter is the HBOY city cluster. HBOY distinguishes itself with a significant DLG export volume of 72 million tons, attributed to its national position as a coal-fired power hub. Through its extensive export of DLG, HBOY maintains its position as a pivotal national energy center, while its primary export destination, YRD, undertakes mitigation efforts on behalf of HBOY. This approach resonates with the core moral principles of redistributive justice as it exempts those DLS-deprived individuals from mitigation responsibilities while underlining the imperative that everyone should have access to a basic minimum level of wellbeing from a human rights perspective (Rao and Baer, 2012).
To support this redistribution, policies should be tailored to accommodate less developed regions by exporting their DLGs to more affluent regions. Our findings suggest that to realize both decent living and a sustainable future for all, 86% of the DLG import (which indicates that the importer relieves the origin region from carbon reduction pressure by importing reduction targets) of high-income city clusters should originate from city clusters with lower income levels; 59% of the DLG import of middle-income city clusters should be imported from city clusters of low income-levels or other cities. This approach allows national energy centers, such as HBOY (coal-fired power plants) or NSTM (renewable energy, oil, and gas) city clusters, to sustain economic growth without bearing the burden of climate change mitigation. Conversely, wealthier regions, such as YRD or PRD, should assume a greater share of mitigation responsibility, leveraging their technological advantages to the fullest extent. Our research highlights that synergistic development can be achieved through DLG flow assessment and elevating DLS in less-developed regions. This approach involves redirecting DLG flows toward wealthier city clusters while enabling DLS-impoverished areas to thrive.
Our findings are internationally comparable. Regarding consumption associated with food, DLS targets of 1,966, 1,968, and 1,943 kcal per capita per day were set, comparable to the 2.000–2,150 kcal assumption of Millward-Hopkins et al. (2020). Consumption in food, on average, has an annual per capita DLG of 0.21 tons, with its per capita reduction potential 34% lower than the 60% potential illustrated in the work of C40, Arup, Leeds., U.o. (2019). To achieve the living standard of China, Huo et al. (2023) predicted that emissions generated by consumptions in the food sector would contribute to 10.1% of all. This is comparable with our DLG proportion of 12.5% in the food sector. Given the tradition of plant-based dietary patterns among the Chinese population (Chen et al., 2022), further dietary change may be difficult to achieve, which leads to a limited reduction potential. In our study, a 43% per capita carbon reduction potential related to consumption at residence was found, sharing a similar percentage with the 44% potential in C40, Arup, Leeds., U.o. (2019) work. Cities of middle 40% and bottom 50% income levels contribute to 70% of emissions related to the residence sector under DLS. Carbon emissions related to consumption in the transport sector contribute the second-largest per capita DLG (0.34 tons) and demonstrate the highest reduction potential (71%). Our study found that the per capita carbon footprint to meet DLS in China is 0.14 tons, while Huo et al. (2023) found the number to be 0.4 tons for all Asians to achieve DLS and 0.12 tons for Oceanians.
4.4 Limitations and outlooks
The original MRIO table of 313 Chinese cities used in this study is adopted from Shan’s work in 2018. To approach a more accurate and timelier outcome, it is essential to update the MRIO table to the latest version. Additionally, linking global cities to Chinese cities would also provide a clearer picture of international carbon flow among countries.
Greenhouse-gas accounting should reflect the impact of policies and behaviors on national or global emissions. This study adopts the consumption-based accounting (CBA) method for regional carbon footprint accounting. Despite the numerous advantages associated with CBA, such as illustrating potential carbon leakage and emphasizing shared responsibilities for emissions between producers and consumers (Davis and Caldeira, 2010), it has limitations. CBA does not adequately reflect variations in the carbon efficiency of export industries, thus failing to fully capture the potential of cities’ territorial mitigation efforts (Wiedmann et al., 2020). Furthermore, by attributing carbon emissions to business activities, CBA does not support certain forms of specialization and commerce that could promote a more carbon-efficient future (Kander et al., 2015). Franzen and Mader (2018) also argued for territorial-based (TB) accounting over CBA due to the latter’s higher level of inaccuracy.
This research provides a rather preliminary estimation of the future population and GDP for China. In the consumption category of transport, this study notably neglects assumptions regarding changes and developments in the communication aspect, with the focus primarily directed toward the transport sector.
Planetary boundaries (PBs) define the safe operating space for humanity with respect to the Earth system and are associated with the planet’s bio-physical subsystems or processes (Rockström et al., 2009). Following this framework, safe and just Earth system boundaries (ESBs) are defined at multiple likelihood levels (Rockström et al., 2023). Although having advanced planetary boundary to a sub-global scale, ESBs are still incapable of attributing environmental responsibility at a country- or city-wise scale.
Future research should prioritize updating the MRIO table of 313 Chinese cities to enhance the accuracy of carbon emission assessments. Expanding the analysis to include global cities would also clarify international carbon flows. Studies should focus on quantifying the carbon reduction outcomes of specific policies under various decent living scenarios, offering a clearer picture of their real-world impact. Future studies may also focus on downscaling planetary boundaries to the city- or individual-level within the DLS framework, thereby establishing more granular and actionable mitigation targets. Scholars may also apply the DLS framework to explore its implications for carbon neutrality, particularly in the context of China’s goal to achieve carbon neutrality by 2060.
5 Conclusion
This study calls for adopting DLS as a benchmark for demand-side carbon mitigation, offering a foundation to align decarbonization efforts with social equity, sufficiency, and regional balance. By translating decent living standards into Chinese-specific scenarios, this study assesses the carbon emissions required to close the decent living gaps in 20 Chinese city clusters (totaling 313 cities). We find that elevating DLS for all does not lead to an increase but rather a reduction in total national carbon emissions. The introduction of the DLG as an indicator of the carbon footprint difference between BAU and DLS scenarios provides a nuanced understanding of the emission mitigation potentials. This study highlights the critical role of the DLG indicator in addressing city-level inequalities. The findings emphasize the necessity of a coordinated development approach within Chinese city clusters, where central cities pursue radical reductions, while other cities, with their less developed economies, may take a more gradual path. This strategy acknowledges the varying capacities of different regions to contribute to national mitigation goals, urging wealthier areas to shoulder a greater share of the burden when closing decent living gaps.
This research also advocates for applying DLS-informed metrics to ensure just and equitable redistribution of income and emissions among city clusters. The collaborative management of DLG flows, as proposed in this study, offers a practical path forward, ensuring that all regions, particularly the less developed regions, benefit from a more equitable and sustainable future. This approach not only aligns with global values but also facilitates the broader goal of a green future by addressing both poverty and inequality, which are essential in the face of uneven climate impacts. Despite challenges in dietary shifts and residential emissions, the DLG framework facilitates a clear visualization of regional carbon consumption patterns, offering decision-makers actionable insights for achieving sustainability goals.
Data availability statement
The original contributions presented in the study are included in the article/supplementary material; further inquiries can be directed to the corresponding author.
Author contributions
ML: Conceptualization, Funding acquisition, Formal analysis, Investigation, Methodology, Project administration, Resources, Supervision, Validation, Writing – original draft, Writing – review and editing. YH: Data curation, Formal analysis, Investigation, Methodology, Software, Visualization, Writing – original draft, Writing – review and editing.
Funding
The author(s) declare that financial support was received for the research and/or publication of this article. This research was funded by Guangdong Basic and Applied Basic Research Foundation (2023A1515011815) and Shenzhen Stability Science Program 2022 from Shenzhen Science and Technology Program (Grant No. 20220818105454004).
Conflict of interest
The authors declare that the research was conducted in the absence of any commercial or financial relationships that could be construed as a potential conflict of interest.
Generative AI statement
The author(s) declare that no Generative AI was used in the creation of this manuscript.
Publisher’s note
All claims expressed in this article are solely those of the authors and do not necessarily represent those of their affiliated organizations, or those of the publisher, the editors and the reviewers. Any product that may be evaluated in this article, or claim that may be made by its manufacturer, is not guaranteed or endorsed by the publisher.
References
Alcock, R. (2019). The new rural reconstruction movement: a Chinese degrowth style movement? Ecol. Econ. 161, 261–269. doi:10.1016/j.ecolecon.2019.03.024
Bruckner, B., Hubacek, K., Shan, Y., Zhong, H., and Feng, K. (2022). Impacts of poverty alleviation on national and global carbon emissions. Nat. Sustain. 5, 311–320. doi:10.1038/s41893-021-00842-z
Camarasa, C., Mata, É., Navarro, J. P. J., Reyna, J., Bezerra, P., Angelkorte, G. B., et al. (2022). A global comparison of building decarbonization scenarios by 2050 towards 1.5–2 °C targets. Nat. Commun. 13, 3077. doi:10.1038/s41467-022-29890-5
Chen, H., Shen, J., Xuan, J., Zhu, A., Ji, J. S., Liu, X., et al. (2022). Plant-based dietary patterns in relation to mortality among older adults in China. Nat. Aging 2, 224–230. doi:10.1038/s43587-022-00180-5
D’Alessandro, S., Cieplinski, A., Distefano, T., and Dittmer, K. (2020). Feasible alternatives to green growth. Nat. Sustain. 3, 329–335. doi:10.1038/s41893-020-0484-y
Davis, S. J., and Caldeira, K. (2010). Consumption-based accounting of CO2 emissions. Proc. Natl. Acad. Sci. 107, 5687–5692. doi:10.1073/pnas.0906974107
Day, A. (2008). The end of the peasant? New rural reconstruction in China. Boundary 2 35, 49–73. doi:10.1215/01903659-2008-003
Fan, J.-L., Feng, X., Dong, Y., and Zhang, X. (2022). A global comparison of carbon-water-food nexus based on dietary consumption. Glob. Environ. Change 73, 102489. doi:10.1016/j.gloenvcha.2022.102489
Franzen, A., and Mader, S. (2018). Consumption-based versus production-based accounting of CO2 emissions: is there evidence for carbon leakage? Environ. Sci. and Policy 84, 34–40. doi:10.1016/j.envsci.2018.02.009
Grubler, A., Wilson, C., Bento, N., Boza-Kiss, B., Krey, V., McCollum, D. L., et al. (2018). A low energy demand scenario for meeting the 1.5 °C target and sustainable development goals without negative emission technologies. Nat. Energy 3, 515–527. doi:10.1038/s41560-018-0172-6
Gurney, K. R., Kılkış, Ş., Seto, K. C., Lwasa, S., Moran, D., Riahi, K., et al. (2022). Greenhouse gas emissions from global cities under SSP/RCP scenarios, 1990 to 2100. Glob. Environ. Change 73, 102478. doi:10.1016/j.gloenvcha.2022.102478
Hickel, J., and Kallis, G. (2020). Is green growth possible? New Polit. Econ. 25, 469–486. doi:10.1080/13563467.2019.1598964
Hubacek, K., Baiocchi, G., Feng, K., Muñoz Castillo, R., Sun, L., and Xue, J. (2017). Global carbon inequality. Energy, Ecol. Environ. 2, 361–369. doi:10.1007/s40974-017-0072-9
Huo, J., Meng, J., Zheng, H., Parikh, P., and Guan, D. (2023). Achieving decent living standards in emerging economies challenges national mitigation goals for CO2 emissions. Nat. Commun. 14, 6342. doi:10.1038/s41467-023-42079-8
IPCC (2022). Climate change 2022: mitigation of climate change. Working group III contribution to the IPCC Sixth assessment Report. Cambridge, UK and New York, NY, USA: Cambridge University Press.
IRP (2019). Integrated resource plan (IRP2019). Tshwane, South Africa: IRP, South Africa Department of Energy.
Kallis, G. (2011). In defence of degrowth. Ecol. Econ. 70, 873–880. doi:10.1016/j.ecolecon.2010.12.007
Kallis, G., Kostakis, V., Lange, S., Muraca, B., Paulson, S., and Schmelzer, M. (2018). Research on degrowth. Annu. Rev. Environ. Resour. 43, 291–316. doi:10.1146/annurev-environ-102017-025941
Kander, A., Jiborn, M., Moran, D. D., and Wiedmann, T. O. (2015). National greenhouse-gas accounting for effective climate policy on international trade. Nat. Clim. Change 5, 431–435. doi:10.1038/nclimate2555
Keyßer, L. T., and Lenzen, M. (2021). 1.5 °C degrowth scenarios suggest the need for new mitigation pathways. Nat. Commun. 12, 2676. doi:10.1038/s41467-021-22884-9
Kikstra, J. S., Mastrucci, A., Min, J., Riahi, K., and Rao, N. D. (2021). Decent living gaps and energy needs around the world. Environ. Res. Lett. 16, 095006. doi:10.1088/1748-9326/ac1c27
Li, M., Wiedmann, T., and Hadjikakou, M. (2020). Enabling full supply chain corporate responsibility: scope 3 emissions targets for ambitious climate change mitigation. Environ. Sci. Technol. 54, 400–411. doi:10.1021/acs.est.9b05245
Li, Y., Qin, X., Sullivan, A., Chi, G., Lu, Z., Pan, W., et al. (2023). Collective action improves elite-driven governance in rural development within China. Humanit. Soc. Sci. Commun. 10, 600. doi:10.1057/s41599-023-02089-9
Liu, Y., Du, M., Cui, Q., Lin, J., Liu, Y., Liu, Q., et al. (2022). Contrasting suitability and ambition in regional carbon mitigation. Nat. Commun. 13, 4077. doi:10.1038/s41467-022-31729-y
Merz, J. J., Barnard, P., Rees, W. E., Smith, D., Maroni, M., Rhodes, C. J., et al. (2023). World scientists’ warning: the behavioural crisis driving ecological overshoot. Sci. Prog. 106, 00368504231201372. doi:10.1177/00368504231201372
Mi, Z., Zheng, J., Meng, J., Ou, J., Hubacek, K., Liu, Z., et al. (2020). Economic development and converging household carbon footprints in China. Nat. Sustain. 3, 529–537. doi:10.1038/s41893-020-0504-y
Millward-Hopkins, J. (2022). Inequality can double the energy required to secure universal decent living. Nat. Commun. 13, 5028. doi:10.1038/s41467-022-32729-8
Millward-Hopkins, J., and Johnson, E. (2023). Distributing less, redistributing more: safe and just low-energy futures in the United Kingdom. Energy Res. and Soc. Sci. 95, 102915. doi:10.1016/j.erss.2022.102915
Millward-Hopkins, J., and Oswald, Y. (2023). Reducing global inequality to secure human wellbeing and climate safety: a modelling study. Lancet Planet. Health 7, e147–e154. doi:10.1016/s2542-5196(23)00004-9
Millward-Hopkins, J., Steinberger, J. K., Rao, N. D., and Oswald, Y. (2020). Providing decent living with minimum energy: a global scenario. Glob. Environ. Change 65, 102168. doi:10.1016/j.gloenvcha.2020.102168
Moran, D., Wood, R., Hertwich, E., Mattson, K., Rodriguez, J. F. D., Schanes, K., et al. (2020). Quantifying the potential for consumer-oriented policy to reduce European and foreign carbon emissions. Clim. Policy 20, S28–S38. doi:10.1080/14693062.2018.1551186
National Energy Administration, (2018). National renewable power development monitoring and evaluation report.
O’Neill, B. C., Carter, T. R., Ebi, K., Harrison, P. A., Kemp-Benedict, E., Kok, K., et al. (2020). Achievements and needs for the climate change scenario framework. Nat. Clim. Change 10, 1074–1084. doi:10.1038/s41558-020-00952-0
Oswald, Y., Owen, A., and Steinberger, J. K. (2020). Large inequality in international and intranational energy footprints between income groups and across consumption categories. Nat. Energy 5, 231–239. doi:10.1038/s41560-020-0579-8
Oswald, Y., Steinberger, J. K., Ivanova, D., and Millward-Hopkins, J. (2021). Global redistribution of income and household energy footprints: a computational thought experiment. Glob. Sustain. 4, e4. doi:10.1017/sus.2021.1
Otto, I. M., Kim, K. M., Dubrovsky, N., and Lucht, W. (2019). Shift the focus from the super-poor to the super-rich. Nat. Clim. Change 9, 82–84. doi:10.1038/s41558-019-0402-3
Pauliuk, S. (2024). Decent living standards, prosperity, and excessive consumption in the Lorenz curve. Ecol. Econ. 220, 108161. doi:10.1016/j.ecolecon.2024.108161
Ramaswami, A., Russell, A. G., Culligan, P. J., Sharma, K. R., and Kumar, E. (2016). Meta-principles for developing smart, sustainable, and healthy cities. Science 352, 940–943. doi:10.1126/science.aaf7160
Ramaswami, A., Weible, C., Main, D., Heikkila, T., Siddiki, S., Duvall, A., et al. (2012). A social-ecological-infrastructural systems framework for interdisciplinary study of sustainable city systems: an integrative curriculum across seven major disciplines. J. Industrial Ecol. 16, 801–813. doi:10.1111/j.1530-9290.2012.00566.x
Rao, N. D., and Baer, P. (2012). “Decent living” emissions: a conceptual framework. Sustainability 4, 656–681. doi:10.3390/su4040656
Rao, N. D., and Min, J. (2018). Decent living standards: material prerequisites for human wellbeing. Soc. Indic. Res. 138, 225–244. doi:10.1007/s11205-017-1650-0
Rao, N. D., Min, J., and Mastrucci, A. (2019). Energy requirements for decent living in India, Brazil and South Africa. Nat. Energy 4, 1025–1032. doi:10.1038/s41560-019-0497-9
Rao, N. D., van Ruijven, B. J., Riahi, K., and Bosetti, V. (2017). Improving poverty and inequality modelling in climate research. Nat. Clim. Change 7, 857–862. doi:10.1038/s41558-017-0004-x
Rockström, J., Gupta, J., Qin, D., Lade, S. J., Abrams, J. F., Andersen, L. S., et al. (2023). Safe and just Earth system boundaries. Nature 619, 102–111. doi:10.1038/s41586-023-06083-8
Rockström, J., Steffen, W., Noone, K., Persson, Å., Chapin, F. S., Lambin, E. F., et al. (2009). A safe operating space for humanity. Nature 461, 472–475. doi:10.1038/461472a
Roy, J., Tschakert, P., Waisman, H., Abdul Halim, S., Antwi-Agyei, P., Dasgupta, P., et al. (2018). “Sustainable development, poverty eradication, and reducing inequalities,” in Global warming of 1.5°C: an IPCC special report on the impacts of global warming of 1.5°C above pre-industrial levels and related global greenhouse gas emission pathways, in the context of strengthening the global response to the threat of climate change, sustainable development, and efforts to eradicate poverty. Editors V. Masson-Delmotte, P. Zhai, H.-O. Pörtner, D. Roberts, J. Skea, P. R. Shuklaet al. (Cambridge, UK, and New York, NY, USA), 445–538.
Schneider, F., Kallis, G., and Martinez-Alier, J. (2010). Crisis or opportunity? Economic degrowth for social equity and ecological sustainability. Introduction to this special issue. J. Clean. Prod. 18, 511–518. doi:10.1016/j.jclepro.2010.01.014
Semieniuk, G., and Yakovenko, V. M. (2020). Historical evolution of global inequality in carbon emissions and footprints versus redistributive scenarios. J. Clean. Prod. 264, 121420. doi:10.1016/j.jclepro.2020.121420
Seto, K. C., Churkina, G., Hsu, A., Keller, M., Newman, P. W. G., Qin, B., et al. (2021). From low-to net-zero carbon cities: the next global agenda. Annu. Rev. Environ. Resour. 46, 377–415. doi:10.1146/annurev-environ-050120-113117
Shan, Y., Guan, D., Hubacek, K., Zheng, B., Davis, S. J., Jia, L., et al. (2018). City-level climate change mitigation in China. Sci. Adv. 4, eaaq0390. doi:10.1126/sciadv.aaq0390
Shenzhen Municipal Planning and Natural Resource Bureau, (2019). Shenzhen municipal planning and natural resource Bureau and Bureau of statistics’ communique on the data results of shenzhen’s 2018 land change survey.
Sicular, T., Ximing, Y., Gustafsson, B., and Shi, L. (2007). The urban–rural income gap and inequality in China. Rev. income wealth 53, 93–126. doi:10.1111/j.1475-4991.2007.00219.x
Soergel, B., Kriegler, E., Bodirsky, B. L., Bauer, N., Leimbach, M., and Popp, A. (2021). Combining ambitious climate policies with efforts to eradicate poverty. Nat. Commun. 12, 2342. doi:10.1038/s41467-021-22315-9
Springmann, M., Wiebe, K., Mason-D’Croz, D., Sulser, T. B., Rayner, M., and Scarborough, P. (2018). Health and nutritional aspects of sustainable diet strategies and their association with environmental impacts: a global modelling analysis with country-level detail. Lancet Planet. Health 2, e451–e461. doi:10.1016/s2542-5196(18)30206-7
Tilman, D., and Clark, M. (2014). Global diets link environmental sustainability and human health. Nature 515, 518–522. doi:10.1038/nature13959
Virág, D., Wiedenhofer, D., Baumgart, A., Matej, S., Krausmann, F., Min, J., et al. (2022). How much infrastructure is required to support decent mobility for all? An exploratory assessment. Ecol. Econ. 200, 107511. doi:10.1016/j.ecolecon.2022.107511
Wang, H., Ou, X., and Zhang, X. (2017). Mode, technology, energy consumption, and resulting CO2 emissions in China's transport sector up to 2050. Energy Policy 109, 719–733. doi:10.1016/j.enpol.2017.07.010
Wang, Q., Fan, J., Kwan, M.-P., Zhou, K., Shen, G., Li, N., et al. (2023). Examining energy inequality under the rapid residential energy transition in China through household surveys. Nat. Energy 8, 251–263. doi:10.1038/s41560-023-01193-z
Wen, T. (2007). Deconstructing modernization. Chin. Sociol. Anthropol. 39, 10–25. doi:10.2753/csa0009-4625390401
Wen, T. (2008). Four stories in one: environmental protection and rural reconstruction in China. Positions Asia Crit. 16, 491–505. doi:10.1215/10679847-2008-011
Wiedmann, T., and Lenzen, M. (2018). Environmental and social footprints of international trade. Nat. Geosci. 11, 314–321. doi:10.1038/s41561-018-0113-9
Wiedmann, T., Lenzen, M., Keyßer, L. T., and Steinberger, J. K. (2020). Scientists’ warning on affluence. Nat. Commun. 11, 3107. doi:10.1038/s41467-020-16941-y
Yang, X., Feng, K., Su, B., Zhang, W., and Huang, S. (2019). Environmental efficiency and equality embodied in China's inter-regional trade. Sci. Total Environ. 672, 150–161. doi:10.1016/j.scitotenv.2019.03.450
Yu, B., Zhao, Z., Wei, Y.-M., Liu, L.-C., Zhao, Q., Xu, S., et al. (2023). Approaching national climate targets in China considering the challenge of regional inequality. Nat. Commun. 14, 8342. doi:10.1038/s41467-023-44122-0
Zhang, R., and Hanaoka, T. (2022). Cross-cutting scenarios and strategies for designing decarbonization pathways in the transport sector toward carbon neutrality. Nat. Commun. 13, 3629. doi:10.1038/s41467-022-31354-9
Zhang, X., Brandt, M., Tong, X., Ciais, P., Yue, Y., Xiao, X., et al. (2022). A large but transient carbon sink from urbanization and rural depopulation in China. Nat. Sustain. 5, 321–328. doi:10.1038/s41893-021-00843-y
Zheng, H., Zhang, Z., Dietzenbacher, E., Zhou, Y., Többen, J., Feng, K., et al. (2023). Leveraging opportunity of low carbon transition by super-emitter cities in China. Sci. Bull. 68, 2456–2466. doi:10.1016/j.scib.2023.08.016
Zheng, H., Többen, J., Dietzenbacher, E., Moran, D., Meng, J., Wang, D., et al. (2022). Entropy-based Chinese city-level MRIO table framework. Econ. Syst. Res. 34, 519–544. doi:10.1080/09535314.2021.1932764
Appendix
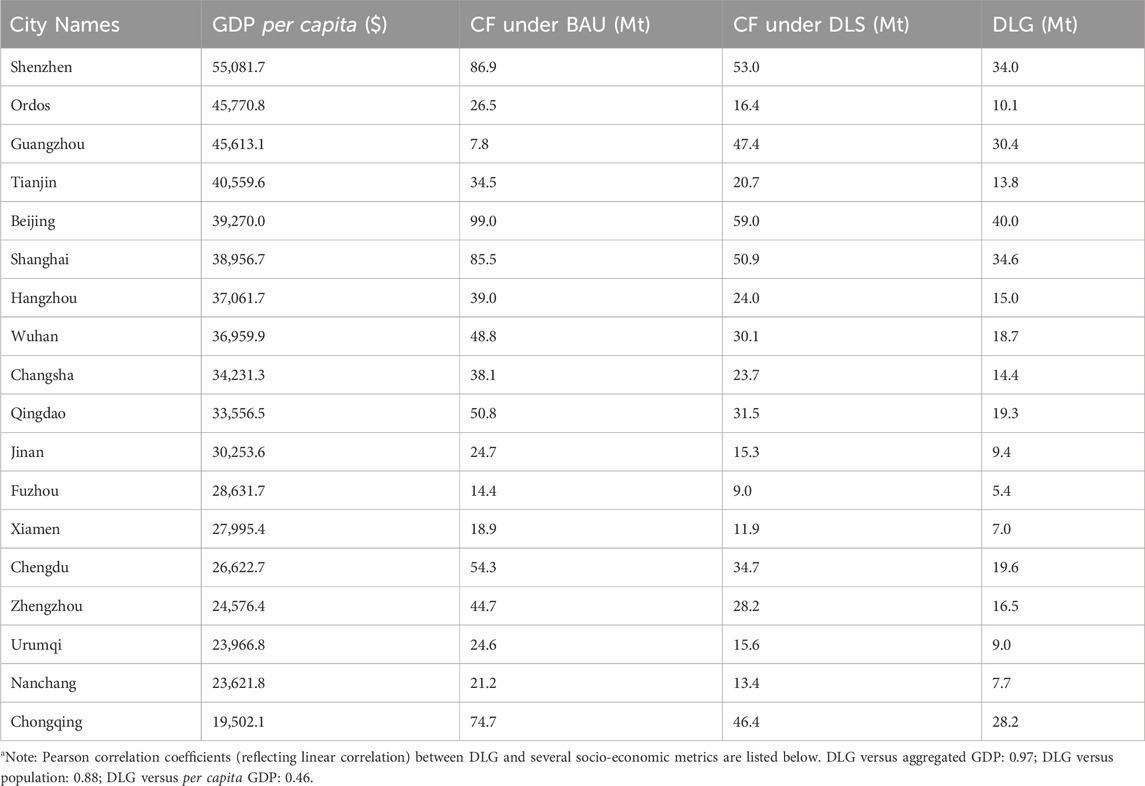
TABLE A1. Carbon footprint of 18 central cities under BAU and DLS scenarios sorted by GDP per capita per year. GDP per capita in 2050 are calculated based on 2017 Q30 data with 2% annual GDP growth and 1.1% annual shrink in population (See SM).
Keywords: decent living standards, decent living gap, carbon inequality, fair redistribution, city cluster carbon footprint
Citation: Li M and Hong Y (2025) Emissions required to close the decent living gaps in Chinese city clusters. Front. Environ. Sci. 13:1588114. doi: 10.3389/fenvs.2025.1588114
Received: 05 March 2025; Accepted: 21 May 2025;
Published: 26 June 2025.
Edited by:
Shulei Cheng, Southwestern University of Finance and Economics, ChinaReviewed by:
Zhihua Zhang, Shandong University, ChinaShengdong Yang, Beijing Normal University, China
Copyright © 2025 Li and Hong. This is an open-access article distributed under the terms of the Creative Commons Attribution License (CC BY). The use, distribution or reproduction in other forums is permitted, provided the original author(s) and the copyright owner(s) are credited and that the original publication in this journal is cited, in accordance with accepted academic practice. No use, distribution or reproduction is permitted which does not comply with these terms.
*Correspondence: Mo Li, bGltb0BjdWhrLmVkdS5jbg==
†These authors have contributed equally to this work and share first authorship