 Maftuna Nuriddinova
 Maaz Ahmad*
- Department World Economy and International Economic Relations, Tashkent State University of Economics, Tashkent, Uzbekistan
Understanding the concept of the Environmental Kuznets Curve (EKC) is crucial for analyzing how environmental degradation evolves with economic growth, particularly as economies transition from low-income to high-income stages. However, Uzbekistan is a developing country undergoing rapid industrialization. Therefore, it is important to investigate whether the EKC hypothesis provides valuable insights into the intricate relationship between carbon emissions and economic growth. This study examines the applicability of the EKC hypothesis in Uzbekistan using the vector autoregression (VAR) model. Key variables selected for the analysis include CO2 emissions, GDP per capita, globalization, foreign direct investment, population density, corruption, and the square of GDP per capita. The study utilizes quarterly data spanning from Q3 1996 to Q4 2022. The results reveal a complex relationship between economic growth and CO2 emissions in Uzbekistan, partially supporting the EKC hypothesis. The results show a positive relationship between GDP per capita and CO2 emissions in Uzbekistan. Furthermore, the statistically significant coefficient of the squared GDP per capita term supports the EKC hypothesis, suggesting that Uzbekistan may have reached the EKC turning point. This indicates short-term environmental challenges associated with the early stages of economic growth and industrialization. In contrast, the findings suggest enhancing the role of government institutions and implementing effective policy measures, such as promoting green legislation and renewable energy sources. Additionally, the study emphasizes the importance of raising public awareness and improving education to foster green initiatives among the population.
1 Introduction
As economies progress from traditional (agriculture) systems to modern (industrialized) systems, they often experience a complex relationship between economic growth and environmental quality. This complex relationship is known as the Environmental Kuznets Curve (EKC). This hypothesis states that the index of pollution increases as the income per capita increases in the early stages of development, reaches a maximum, and begins decreasing with further growth and development (Grossman, 1991). After installing environmentally friendly technologies, a service-based economy replaces an industrialized economy. The primary drivers of this phenomenon include rapid industrialization with high energy demands, accelerated urbanization, inadequate pollution-control measures, and insufficient technological advancement and infrastructure development. Understanding the EKC hypothesis allows the government to study the forecasting and prevention of environmental problems that may arise in the process of economic development.
The EKC hypothesis has been repeatedly studied in various regions of the world. Empirical data confirming its validity have been obtained from several countries at various stages of economic development. Grossman (1991) found a correlation between economic growth and environmental improvement in developed countries. It is found that openness and trade liberalization typically impact the environment through increased economic activity and production, structural transitions, and the introduction of new production technologies (Du et al., 2024; Xu et al., 2024). In this regard, the authors focus attention on the need for a strong regulatory framework to ensure positive environmental outcomes. Stern (2004) found weak statistical validity in the above mentioned results. Analyzing the situation, it can be concluded that most countries are guided by the standards adopted by the states. At the same time, service delivery is often delayed and does not meet the planned schedule, which can significantly hinder progress.
Central Asia (especially Uzbekistan) is a unique region for studying the EKC hypothesis due to several specific factors, including high dependence on natural resource extraction, ongoing industrialization, and a high share of fossil fuels in the energy balance (Caporin et al., 2024). The countries of the region, such as Kazakhstan, Kyrgyzstan, and Turkmenistan, show trends that partially confirm the EKC hypothesis. These economies typically experience rising levels of environmental degradation in the early phases of economic growth, with signs of stabilization or reduction emerging as development progresses. In 1996, CO2 emissions in Uzbekistan were 4.28 metric tons per capita, which decreased to 3.34 metric tons per capita by 2022—an overall reduction of approximately 22%. In contrast, GDP per capita increased from 1,140.3 constant US dollars in 1996 to 3,473.3 in 2022, reflecting an increase of approximately 204% (World Bank, 2024).1
Studies indicate that several factors significantly contribute to environmental pollution in Central Asia, including the region’s reliance on energy-intensive industries, the use of outdated technologies, and the lack of comprehensive environmental legislation. As a result, countries in this region appear to be in the ascending phase of the EKC (Caporin et al., 2024). However, Kazakhstan and Turkmenistan ratified the Paris Agreement during the 21st United Nations Climate Change Conference held in Paris. At this conference, both countries committed to introducing environmentally friendly technologies and investing in renewable energy sources. This marks the potential beginning of a downward trend in the EKC. In particular, the government of Kazakhstan is actively promoting the development of renewable energy to align with the international emission standards set by developed countries (Caporin et al., 2024; Ahmad et al., 2024). The region’s heavy reliance on fossil fuels and the ineffectiveness of environmental policies contribute to environmental degradation. These challenges make Central Asia a critical case for further research on the EKC.
Uzbekistan, as one of the leading economies in Central Asia, represents a significant case for examining the EKC hypothesis. In the process of intensive economic growth, accompanied by the transition from an agrarian to an industrial development model, the country faced increasing pressure on the environment (Trushin, 2017). The recent increase in CO2 emissions, driven by rapid urbanization and infrastructure development, suggests that Uzbekistan may currently be in the ascending phase of the EKC. This means that economic progress in the country is still closely correlated with the deterioration of the environmental situation (Caporin et al., 2024). Uzbekistan’s efforts to transition toward a sustainable economy are evident in its growing investments in renewable energy (Khan and Ullah, 2022). Investments in renewable energy indicate that Uzbekistan’s economy is progressing toward both environmental sustainability and sustainable economic development. However, challenges such as underdeveloped infrastructure, weak environmental policy frameworks, and reliance on fossil fuels continue to hinder significant progress.
Based on the above discussion, this study investigates the validity of the EKC hypothesis in Uzbekistan by analyzing quarterly data on CO2 emissions, GDP per capita, and its square from 1996 Q3 to 2022 Q4. The strength of this study lies in its focus on Uzbekistan, a country that has received very limited attention in the EKC compared to other countries in the region. This study contributes to understanding the EKC hypothesis in Central Asia by assessing whether economic growth in Uzbekistan leads to long-term environmental improvement. This study employs unit root tests to assess the stationarity of the data, and the results of the integration analysis suggest the use of a vector autoregression (VAR) model to explore the relationships among the variables. Moreover, the Granger causality test is employed to examine the directional causality between the variables under consideration. Based on the analysis results, this study will offer practical policy recommendations for policymakers.
The remainder of this study is structured as follows: Section 2 provides a literature review, Section 3 explains the methodology, Section 4 reports the main result, and Section 5 focuses on discussion and conclusion.
2 Literature review
A substantial body of research has examined and tested the EKC hypothesis across various countries and time periods. The EKC hypothesis posits that economic growth follows an inverted-U trajectory in its relationship with environmental degradation: pollution increases in early development, peaks at a certain income level, and then decreases as economies adopt sustainable practices (Grossman, 1991). There are several research studies on the relationship between carbon emissions and economic growth or development (Ahmad et al., 2023; Dogan and Inglesi-Lotz, 2020; Kahia et al., 2019; Adedoyin et al., 2022; Jan et al., 2024).
Stern (2004) provided further empirical support for the EKC, showing that while pollution levels increase during the industrialization period, economies reach a turning point where income growth contributes to environmental improvements. This study revealed that wealthier countries tend to invest in environmentally friendly technologies and stricter regulations, which gradually decouple economic growth from environmental harm. Dogan and Inglesi-Lotz (2020) found that growth in trade volume significantly increases CO2 emissions. In addition, Zhang (2019) examined the relationships among per capita CO2 emissions, per capita real GDP, per capita renewable energy consumption, and urbanization in a panel of five Central Asian countries (Kazakhstan, Kyrgyz Republic, Tajikistan, Turkmenistan, and Uzbekistan) from 1992 to 2013 and showed that renewable energy consumption has a negative influence on CO2 emissions. Caporin et al. (2024) suggested that the EKC is linear in Central Asia and highlighted the existence of non-linear EKCs. Furthermore, this study pointed out that Uzbekistan’s economic growth correlates with increasing CO2 emissions, suggesting that the country may not yet have reached the EKC turning point. This insight emphasizes the relevance of studying the EKC in transition economies where growth drivers and policy structures are different from those of industrialized countries (Dinda, 2004; Balin and Strand, 2020).
Although the EKC hypothesis has been widely investigated, studies specifically focusing on Central Asia (particularly Uzbekistan) remain limited. According to existing research studies that address the EKC phenomenon in developed economies, they often have strong regulatory environment policies and cleaner energy technologies. Dinda (2004) pointed out that existing EKC models largely reflect the experiences of high-income nations and may not apply uniformly to economies with distinct economic and environmental characteristics. Similarly, Leal and Marques (2022) found that Central Asia’s heavy reliance on fossil fuels significantly contributes to rising CO2 emissions in the region. For instance, a high percentage of Uzbekistan’s energy production depends on natural gas and oil, and the possibilities of effective economic growth without support for investment in renewable energy sources are limited. In the long term, adaptation strategies may not be as effective in reducing or absorbing CO2 emissions due to the positive relationship (Caporin et al., 2024). Koilo (2019) found that Kazakhstan exhibits the most sensitive changes in economic growth with respect to CO2 and concluded that total energy consumption has a negative effect on the environment.
Previous studies have employed a variety of econometric methods to examine the relationship between economic growth and CO2 emissions. Research methodologies in EKC studies have evolved from basic regression models to more sophisticated econometric techniques that account for the non-linear relationship between income and environmental emissions. For instance, Grossman (1991) used comparable measures of three air pollutants in a cross-section of urban areas located in 42 countries to study the relationship between air quality and economic growth. Stern (2004) worked with a panel to prove that environmental degradation first increases and then decreases with economic growth. Caporin et al. (2024) utilized the autoregressive distributed lag (ARDL) model to study EKC trends across Central Asian economies, focusing on how economic growth, energy use, and environmental quality interact over time. This approach is particularly effective in studying Uzbekistan, where seasonal factors in industrial activity affect energy demand and emissions. Chien (2022) used the method of moving quantile regression to study the N-11 economies, and Dogan and Inglesi-Lotz. (2020) applied extensive econometric analyses, i.e., FMOLS and DOLS, to evaluate data from RCEP economies.
There is currently a lack of empirical evidence on the application of the EKC to transition countries, especially in Central Asia. Unlike Europe and North America, Central Asian countries have unique socio-economic dynamics. Dinda (2004) noted that EKC studies are often based on economic data, which can lead to biased interpretations in transition countries. The problems associated with a weak environmental framework, dependence on fossil fuels, and secured investments in green technologies necessitate the universality of the EKC model for all regions. Uzbekistan is undergoing significant economic transformation due to its transition into an industrialized economy (Caporin et al., 2024). However, as Leal and Marques (2022) pointed out, fossil fuel consumption in the country remains high, and the legislative framework in the field of environmental protection is still in the process of formation.
Based on the abovementioned literature discussion, it is evident that limited studies have focused on the economy of Uzbekistan within the context of the EKC framework. Therefore, analyzing the economic structure and energy profile of Uzbekistan contributes to filling a significant gap in the empirical literature. This study will assist policymakers and researchers in understanding the extent to which EKC dynamics are applicable to countries undergoing economic transformation. If the EKC hypothesis does not hold in this context, the findings can help identify appropriate measures to adjust the country’s development trajectory toward a more sustainable future. Furthermore, a critical review reveals that most existing studies on Central Asia are outdated, whereas this research utilizes the most recent data and time period available. Finally, unlike previous studies that examined the entire Central Asian region using panel econometric techniques, this study adopts a country-specific approach by applying time-series analysis and a VAR model tailored to Uzbekistan.
3 Methodology
3.1 Theoretical framework
In the literature, the concept of the EKC is primarily examined using two main approaches. The first approach examines the EKC through two distinct phases: the initial stage and the advanced stage of economic development. During the initial stages of economic development, countries tend to rely heavily on natural resources, which leads to increased pollution and environmental degradation (Stern et al., 1996). Moreover, in the initial stages, countries often lack strict environmental regulations and are generally unable to afford or enforce environmental taxes (Wang et al., 2024). However, in the advanced stages of development, countries tend to prioritize environmental quality by promoting green technological innovation, raising public awareness, and strengthening institutional capacity—efforts that are typically associated with higher income levels (Khan et al., 2025; Ahmad et al., 2024). Additionally, these two stages are often characterized by two key effects (the income effect and the policy effect). The income effect refers to the tendency of increasing national income resulting in increased spending on environmental protection measures (Moshiri and Daneshmand, 2020). On the other side, the policy effect captures the role of environmental regulations and governance in shaping those outcomes (Newig and Fritsch, 2009). In the literature, economic development is commonly divided into three stages: pre-industrialization, industrialization, and post-industrialization (Huang, 2022). Pre-industrialization refers to a stage in which a country primarily relies on traditional sectors such as agriculture and handicrafts. The industrialization phase marks a period of rapid industrial growth, where the economy becomes heavily dependent on manufacturing and related industries. In the post-industrialization stage, the country transitions toward a service-based economy, with increased emphasis on information, technology, and knowledge-driven sectors. During the pre-industrialization period, there was often extensive extraction of natural resources despite the limited scale of economic activities because of the reliance on traditional practices and low technological efficiency, which led to environmental degradation (Du et al., 2023). Figure 1 illustrates the concept of Industrial Development Stages and Environmental Degradation.
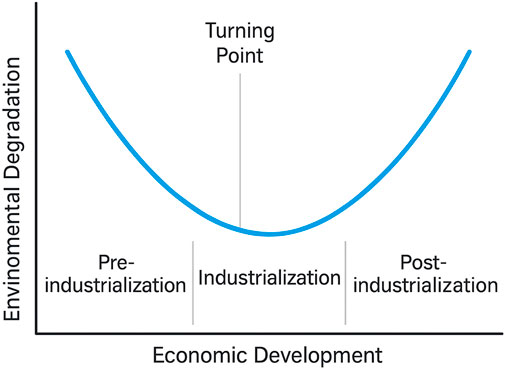
Figure 1. Concept of industrial development stages and environmental degradation
In addition, during the industrialization period, the level of economic activity is significantly high, with industrial production reaching its peak. As a result, environmental degradation intensifies. This stage typically occurs before the turning point on the EKC (Cherniwchan, 2012). The final phase, known as post-industrialization, is considered a stage of structural transformation in which economic activity shifts from the industrial sector to the technology-intensive and service-oriented sectors (Shao et al., 2023). During this stage, governments tend to place greater emphasis on achieving a cleaner environment through sustainable policies and green innovation. This is the stage at which the EKC reaches its turning point, indicating a shift from increasing to decreasing environmental degradation as the income continues to increase.
3.2 Data sources and variable measurement
This research investigates the EKC hypothesis in Uzbekistan using quarterly data spanning from 1996 Q3 to 2022 Q4. The secondary data include CO2 emissions (metric tons per capita), GDP per capita (constant 2015 US$), square of GDP per capita, globalization (KOF index), foreign direct investment (net inflows BoP, current US$), population density (people per sq. km of land area), and control of corruption (estimate) data collected from the World Bank and KOF Swiss Economic Institute. Given Uzbekistan’s economic structure and its limited representation in the existing EKC literature, this research provides new insights into understanding the EKC in transition economies. Table 1 shows the definition of the variables and the sources of the data.
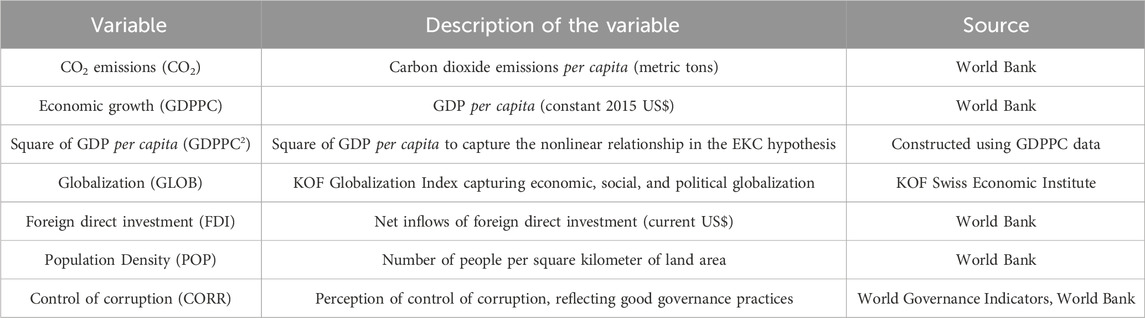
Table 1. Data sources and measurement.
A VAR model was employed to examine the dynamic interactions among the variables under consideration and empirically test the EKC hypothesis in the context of Uzbekistan. The VAR model is a widely used multivariate time-series approach that captures the linear dynamic relationships among several endogenous variables. It allows each variable to be explained by its own lagged values and those of the other variables in the system. A key advantage of the VAR model is that it treats all variables symmetrically, without requiring an a priori distinction between endogenous and exogenous variables. Due to these advantages, the VAR model is particularly well-suited for empirical macroeconomic studies where variables are likely to influence each other both contemporaneously and with time lags. Let
The standard VAR model of order
In Equation 2,
In Equation 3,
For the analysis, we will use descriptive statistics and correlation analysis to understand data structure and relationship between variables. The next step is to check the stationarity of data using unit root tests: the Dickey–Fuller and Phillips–Perron tests. The nature of the variables is guaranteed by lag selection and diagnostics. Finally, the VAR model explores short-term interactions and the persistence effect.
4 Results and discussion
Before examining the applicability of the EKC hypothesis in Uzbekistan, we checked the descriptive statistics of the dataset, correlation matrix, stationarity tests, and lag selection and diagnostics. This section also uses the time-series economic technique, VAR model, for this analysis. Table 2 summarizes the descriptive statistics; the mean values of CO2, GDPPC, GLOB, FDI, POP, CORR, and GDPPC square are 4.163; 2,117.881; 43.694; 8,473.0; 65.495; −1.115; and 5,064,623.7, respectively. Meanwhile, the standard deviations of CO2, GDPPC, GLOB, FDI, POP, CORR, and GDPPC square are 0.663; 775.553; 4.575; 8,105.0; 8.029; 0.148; and 3,481,441.1, respectively. On one hand, the mean and standard deviation values of foreign direct investment and GDP per capita square are significantly higher than the results of other variables. On the other hand, the control of the corruption rate has both the lowest mean and standard deviation value.
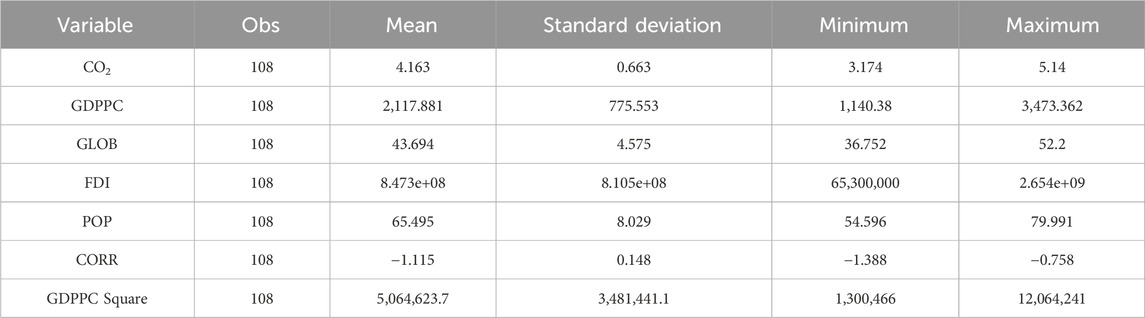
Table 2. Descriptive statistics of key variables.
Table 3 reveals the correlation analysis of the presented variables. According to the results, there are strong negative correlations between CO2 emissions, GDP per capita, square of GDP per capita, population, foreign direct investment, and globalization, and the results are −0.900, −0.896, −0.886, −0.732, and −0.700, respectively. These findings suggest that as the values of these negatively correlated variables rise, CO2 emissions tend to decline. Only the control of the corruption rate has a slightly positive correlation result of 0.095, suggesting that this variable is not significantly associated with CO2 emissions.
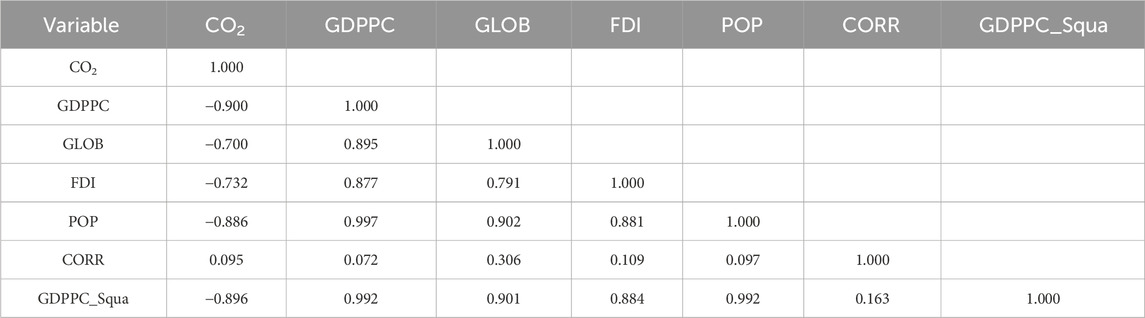
Table 3. Correlation matrix of variables.
Table 4 displays the stationarity level of each variable, assessed using the ADF (Dickey–Fuller) and PP (Phillips–Perron) unit root tests, before examining the VAR model. The results show that all variables are stationary after indicating the first difference. At first, when the stationarity of the variables was checked at their initial levels, they were found to be non-stationary.
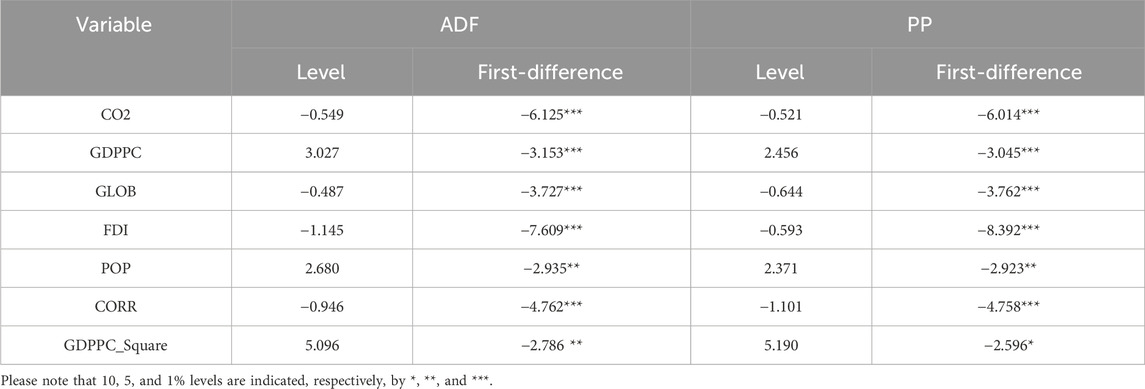
Table 4. Unit root test results.
Table 5 indicates the lag length selection criteria to determine the correct number of lags for the VAR model. Usually, there are four common criteria for the lag length selection process, namely, FPE, AIC, HQIC, and SBIC. We have selected these four criteria to identify the optimal number of lags.
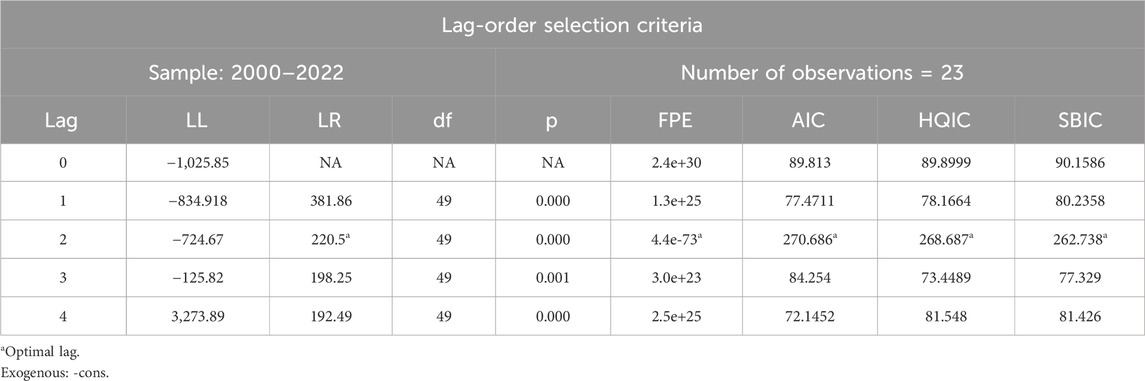
Table 5. Variance–covariance test results.
Table 6 shows the results of the Breusch–Godfrey LM test for serial correlation and the Durbin–Watson test for autocorrelation. The results of the LM test indicate a chi-square statistic of 6.827 with a p-value of 0.178, which is greater than the 5% significant level, and this suggests that there is no evidence of serial correlation. However, the test statistics of the Durbin–Watson autocorrelation range from 0 to 4. The value of this test is 1.606339, indicating a weak positive autocorrelation as the result falls between 0 and 2.
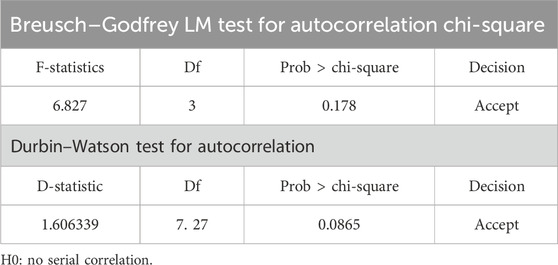
Table 6. Breusch–Godfrey LM test for serial correlation and Durbin–Watson test for autocorrelation.
Table 7 presents VAR results, with CO2 emissions as the dependent variable. This test is important for gaining significant insights and exploring the dynamic interrelationships between time-series variables. The results indicate that GDP per capita and its squared term are statistically significant, with GDP per capita exerting a positive effect and the squared term exerting a negative effect on CO2 emissions. This supports the existence of an inverted U-shaped relationship, providing empirical evidence for the EKC hypothesis in the short run. Additionally, globalization and FDI are both statistically significant and negatively associated with environmental degradation. This suggests that these variables play a stabilizing role, reflecting their persistent influence in shaping economic dynamics and contributing to long-term environmental improvement.
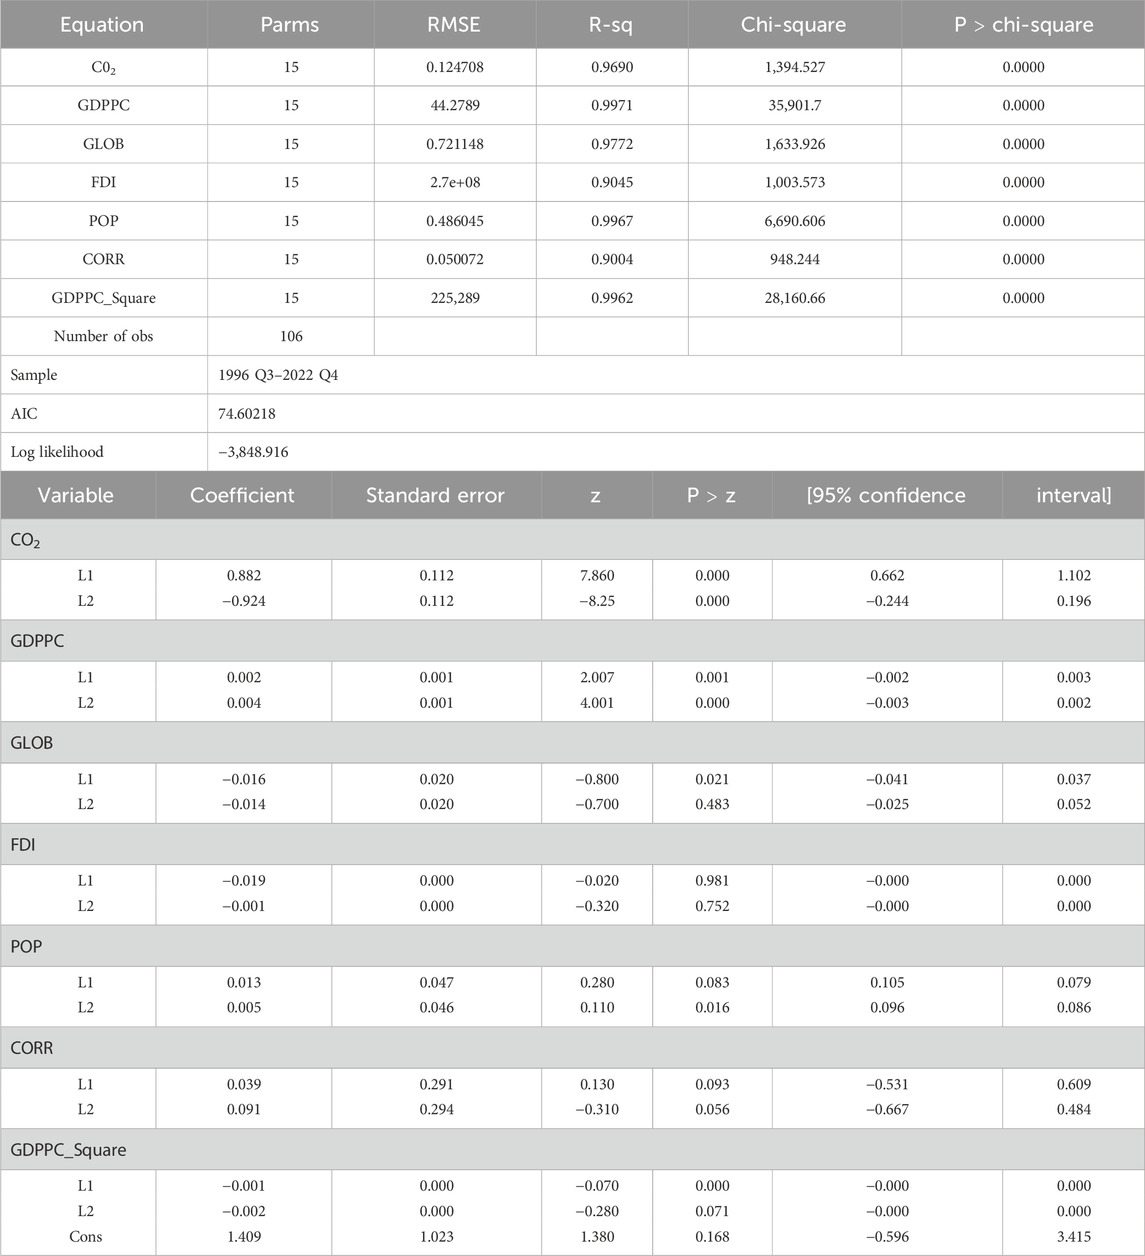
Table 7. Vector Autoregression Model Results.
The results show that the economic growth of Uzbekistan leads to an increase in environmental degradation. The logic behind these results is straightforward, Uzbekistan’s economy has recently shifted from agriculture toward the industrial and manufacturing sectors, which are typically energy-intensive and contribute to increased carbon emissions. Moreover, Uzbekistan’s economy is in the development stages, which often leads to urban expansion, increased construction, and the growth of transportation infrastructure. These activities rely on carbon-intensive inputs (cement, steel, vehicles, etc.).
In addition to this, the results found that globalization and FDI are both statistically significant and negatively associated with environmental degradation. Usually, the foreign firms are more efficient and follow global environmental standards, due to which carbon emissions decrease. This will lead to the reduction of pollution per unit of output, even if the total output increases. However, the global integration exposes domestic industries to international best practices, environmental norms, and sustainability goals. The country’s participation in global value chains (GVCs) often requires compliance with environmental and labor standards. Globalization and FDI may help a country to shift the economy away from pollution-heavy sectors (e.g., mining and heavy industry) toward services and light manufacturing (as the concept of structural transformation). This finding is in line with the results of Ying et al. (2014), which show that economic globalization has a significant positive influence on economic growth and carbon emissions. These findings align with those of Demena and Afesorgbor (2020), who conducted a meta-analysis of the influence of FDI on environmental emissions using 65 primary studies.
This study supports the existence of an inverted U-shaped relationship between the squared term of GDP and CO2 emissions, which provides empirical evidence for the EKC hypothesis. This is because as the income level of the country increases, it leads to greater public demand for environmental quality. Similarly, the government may respond by implementing stricter environmental regulations, increasing investment in green infrastructure, and promoting the adoption of cleaner industrial practices. More specifically, the government of Uzbekistan is becoming increasingly active in environmental policy reforms and in aligning with global sustainability goals. On one hand, this contrasts with the findings of Grossman (1991) , which provided empirical evidence that the concentrations of pollutants (sulfur dioxide and smoke) increase with per capita GDP at low levels of national income but decrease as GDP continues to grow at higher income levels. On the other hand, this result aligns with the results of Caporin et al. (2024), where they linked the fact that Central Asian countries are in the first stage of the EKC, and the observations displayed that gross domestic product, ecological footprint, energy consumption, and climate change positively influence CO2 emissions in the long-term.
Finally, the results indicate that corruption has a positive impact on carbon emissions, suggesting that higher levels of corruption contribute to increased environmental degradation. According to the literature, corruption undermines the effective enforcement of environmental laws and standards, thereby exacerbating environmental degradation. The findings are similar to those of Grossman (1991), which highlighted the significant role of corruption in implementing environmentally friendly technologies and reducing emissions.
Initially, this study used several tests to examine the validity of the EKC hypothesis in Uzbekistan. This analysis indicates a complex relationship between economic growth and carbon dioxide emissions in Uzbekistan and partially supports the EKC hypothesis in this country. The negative correlation between CO2 emissions and GDP per capita suggests progress in sustainability as the economy increases. However, the VAR model results show that GDP per capita and square of GDP per capita do not support this hypothesis, highlighting challenges in the short term. The VAR model values underscore the importance of long-term plans and policy changes to achieve environmental improvements and the need for big investments in renewable energy.
The results of the pairwise Granger causality test, presented in Table 8 and illustrated in Figure 2, reveal several important relationships. A bi-directional causality is observed between CO2 emissions and GDP per capita squared (GDPPC_Square), GDP per capita (GDPPC) and GDPPC_Square, GDPPC and corruption (CORR), and foreign direct investment (FDI) and CORR. Additionally, a unidirectional causality runs from CO2 emissions to globalization (GLOB), GDPPC, CORR, population (POP), and FDI.
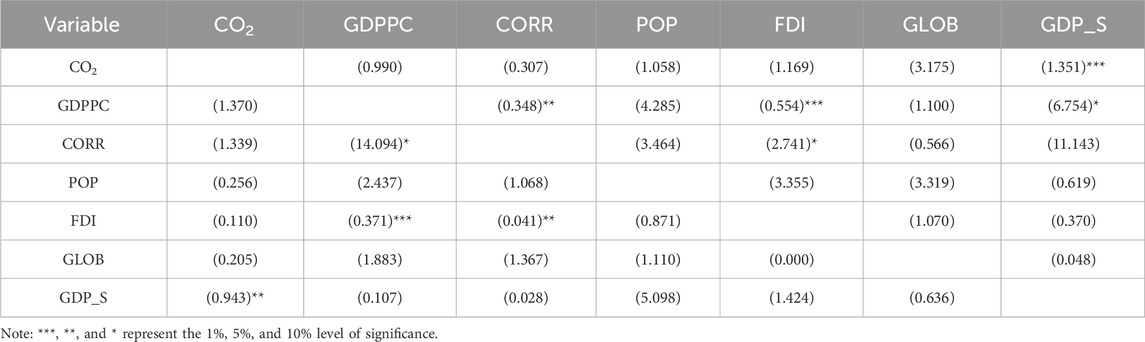
Table 8. Pairwise Granger causality tests result.
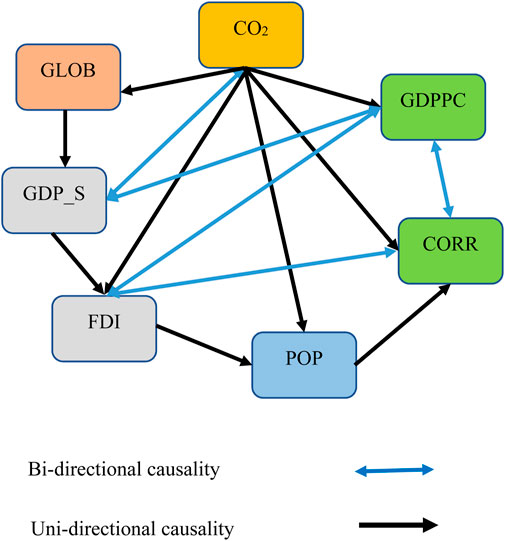
Figure 2. Granger causality relationship schemas.
5 Conclusion
The aim of this study is to examine the applicability of the environmental Kuznets curve hypothesis in Uzbekistan along with other macroeconomic variables. Checking the validity of this hypothesis is important for a country such as Uzbekistan, whose economy is transitioning from traditional sectors (agriculture) to modern sectors (industrial sector), and it helps us understand the dynamic relationship between carbon dioxide emissions, economic growth, globalization, FDI, population, and corruption. The environmental Kuznets curve hypothesis postulates that pollution levels initially increase with income in the early stages of economic development. After reaching a peak, pollution begins to decrease as the economy moves toward cleaner technologies and service-oriented structures.
The study highlights a strong positive correlation between CO2 emissions and GDP per capita, suggesting that current patterns of economic growth are linked with increasing environmental pressure. Globalization and foreign direct investment display strong persistence, and they both manifest a moderate and minimal impact on CO2 pollution. However, there are some limitations to this study. The results reveal a statistically significant relationship between GDP per capita and its squared term in relation to CO2 emissions, supporting the EKC hypothesis for Uzbekistan and indicating the existence of a turning point in the income–emissions trajectory. Corruption in the correlation analysis shows a weak positive correlation; in the short term, it has a minimum impact on CO2 emissions, which means that the government can have issues in implementing green policies and preventing environmental problems during economic growth.
On the basis of the above results, this study suggests policy recommendations for the Government of Uzbekistan to implement reforms aimed at attracting FDI. The policymakers may provide tax incentives, customs duty exemptions, or grants for foreign investment in renewable energy (i.e., solar, wind, and hydro), energy-efficient technologies, and clean transport and logistics. Moreover, the government may create a green investment tax credit for firms meeting eco-efficiency benchmarks. Developing eco-industrial parks and green special economic zones (SEZs) plays a vital role in promoting sustainable economic growth and reducing environmental degradation. Strengthening institutional frameworks also plays an important role. Building strong institutions can positively impact efforts to address pollution, implement green policies, and overcome pollution challenges. Raising public awareness is beneficial for promoting sustainable development. Educating the population can be effective in implementing green initiatives among citizens. Additionally, policymakers may focus on the creation of a “green fast-track” to establish a mechanism for approving environmentally sound FDI. The role of this system will be to ensure that investment procedures are transparent, digital, and free from rent-seeking behavior.
This study has some limitations; the corruption index used may be subjective or broad, which might not capture localized or sector-specific governance failures affecting the environment. Moreover, because the study focused on a specific country, Uzbekistan, the findings may not be generalizable to other countries, especially those at different income or institutional levels. As the literature indicates that energy consumption is a direct cause of CO2 emissions, future research could incorporate disaggregated data on renewable and non-renewable energy consumption, energy efficiency indicators (including both desired and undesired outputs), and eco-innovation variables to more accurately capture the determinants of emissions in Uzbekistan. Moreover, future research could disaggregate the analysis by regions (e.g., Samarkand, Bukhara, and Tashkent) or sectors (such as agriculture, industry, and services) within Uzbekistan to examine how environmental degradation varies spatially and across different economic activities.
Data availability statement
Publicly available datasets were analyzed in this study. These data can be found here: https://databank.worldbank.org/source/world-development-indicators.
Author contributions
MN: data curation, software, and writing – original draft. MA: investigation, supervision, and writing – review and editing.
Funding
The author(s) declare that no financial support was received for the research and/or publication of this article.
Conflict of interest
The authors declare that the research was conducted in the absence of any commercial or financial relationships that could be construed as a potential conflict of interest.
Generative AI statement
The author(s) declare that no Generative AI was used in the creation of this manuscript.
Publisher’s note
All claims expressed in this article are solely those of the authors and do not necessarily represent those of their affiliated organizations, or those of the publisher, the editors and the reviewers. Any product that may be evaluated in this article, or claim that may be made by its manufacturer, is not guaranteed or endorsed by the publisher.
Footnotes
1World Development Indicator (WDI) (2024). Retrieved from https://databank.worldbank.org/source/world-development-indicators
References
Adedoyin, F. F., Alola, U. V., and Bekun, F. V. (2022). On the nexus between globalization, tourism, economic growth, and biocapacity: evidence from top tourism destinations. Environ. Sci. Pollut. Res. 29, 24995–25005. doi:10.1007/s11356-021-17651-8
Ahmad, M., Balbaa, M. E., Zikriyoev, A., Nasriddinov, F., and Kuldasheva, Z. (2024). Energy efficiency, technological innovation, and financial development-based EKC premise: fresh asymmetric insights from developing Asian regions. Environ. Challenges 15, 100947. doi:10.1016/j.envc.2024.100947
Ahmad, M., Kuldasheva, Z., Nasriddinov, F., Balbaa, M. E., and Fahlevi, M. (2023). Is achieving environmental sustainability dependent on information communication technology and globalization? Evidence from selected OECD countries. Environ. Technol. Innovation 31, 103178. doi:10.1016/j.eti.2023.103178
Balin, B., and Strand, J. (2020). Healthy air, healthy mom: experimental evidence from Chinese power plants. Energy Econ. 91, 104899. doi:10.1016/j.eneco.2020.104899
Caporin, M., Cooray, A., Kuziboev, B., and Yusubov, I. (2024). New insights on the environmental kuznets curve (EKC) for central Asia. Empir. Econ. 66 (5), 2335–2354. doi:10.1007/s00181-023-02520-9
Cherniwchan, J. (2012). Economic growth, industrialization, and the environment. Resour. Energy Econ. 34 (4), 442–467. doi:10.1016/j.reseneeco.2012.04.004
Chien, F. (2022). How renewable energy and non-renewable energy affect environmental excellence in N-11 economies?. Renew. Energy 196, 526–534.
Demena, B. A., and Afesorgbor, S. K. (2020). The effect of FDI on environmental emissions: evidence from a meta-analysis. Energy policy 138, 111192. doi:10.1016/j.enpol.2019.111192
Dinda, S. (2004). Environmental kuznets curve hypothesis: a survey. Ecol. Econ. 49 (4), 431–455. doi:10.1016/j.ecolecon.2004.02.011
Dogan, E., and Inglesi-Lotz, R. (2020). The impact of economic structure to the environmental kuznets curve (EKC) hypothesis: evidence from European countries. Environ. Sci. Pollut. Res. 27, 12717–12724. doi:10.1007/s11356-020-07878-2
Du, G., Si, D., Ahmad, M., and Gu, X. (2024). Advancing environmental sustainability: a study on energy and resource efficiency through technological innovation in China. Int. J. Environ. Res. 18 (5), 92. doi:10.1007/s41742-024-00645-y
Du, J., Ahmad, M., Uddin, I., Xu, H., and Gu, X. (2023). From growth to sustainability: investigating N-shaped EKC and the role of energy productivity, technological advancement, and human capital in OECD economies. Environ. Sci. Pollut. Res. 30 (46), 102374–102388. doi:10.1007/s11356-023-29514-5
Grossman, G. M. (1991). Environmental impacts of a North American free trade agreement. Cambridge, MA: National Bureau of Economic Research.
Huang, Q. (2022). Industrialization process of 40 years. In: Understanding China’s manufacturing industry. Singapore: Springer Nature Singapore. p. 13–29.
Jan, D., Ahmad, M., and Gu, X. (2024). Understanding the complex dynamics of climate change in BRICS countries: analyzing the COP26 and COP27 agendas. Energy. Environ., 0958305X241251414. doi:10.1177/0958305x241251414
Johansen, S. (1991). Estimation and hypothesis testing of cointegration vectors in gaussian vector autoregressive models. Econ. J. Econ. Soc. 59, 1551–1580. doi:10.2307/2938278
Kahia, M., Ben Jebli, M., and Belloumi, M. (2019). Analysis of the impact of renewable energy consumption and economic growth on carbon dioxide emissions in 12 MENA countries. Clean Technol. Environ. Policy 21, 871–885. doi:10.1007/s10098-019-01676-2
Khan, A., Khan, T., and Ahmad, M. (2025). The role of technological innovation in sustainable growth: exploring the economic impact of green innovation and renewable energy. Environ. Challenges 18, 101109. doi:10.1016/j.envc.2025.101109
Khan, M., Ullah, M., Jiang, Y., Chen, Y., Liu, J., Zhou, X., et al. (2022). The role of governance in achieving environmental sustainability: evidence from emerging economies. J. Clean. Prod. 331, 129837. doi:10.1016/j.jclepro.2021.129837
Koilo, V. (2019). Evidence of the environmental kuznets curve: unleashing the opportunity of industry 4.0 in emerging economies. J. Risk Financial Manag. 12 (3), 122. doi:10.3390/jrfm12030122
Leal, P. H., and Marques, A. C. (2022). The evolution of the environmental kuznets curve hypothesis assessment: a literature review under a critical analysis perspective. Heliyon 8 (11), e11521. doi:10.1016/j.heliyon.2022.e11521
Moshiri, S., and Daneshmand, A. (2020). How effective is government spending on environmental protection in a developing country? An empirical evidence from Iran. J. Econ. Stud. 47 (4), 789–803. doi:10.1108/jes-12-2018-0458
Newig, J., and Fritsch, O. (2009). Environmental governance: participatory, multi-level–and effective? Environ. Policy Gov. 19 (3), 197–214. doi:10.1002/eet.509
Shao, Y., Yang, Z., and Yang, T. (2023). The road of post-industrialization transformation in developing countries based on weighted markov and grey correlation theory, taking the change of industrial structure in Heilongjiang province of China as a case study. Sustainability 15 (10), 8413. doi:10.3390/su15108413
Stern, D. I. (2004). The rise and fall of the environmental kuznets curve. World Dev. 32 (8), 1419–1439. doi:10.1016/j.worlddev.2004.03.004
Stern, D. I., Common, M. S., and Barbier, E. B. (1996). Economic growth and environmental degradation: the environmental kuznets curve and sustainable development. World Dev. 24 (7), 1151–1160. doi:10.1016/0305-750x(96)00032-0
Trushin, E. (2017). Uzbekistan: problems of development and reform in the Agrarian sector. In: Central Asia. London, UK: Routledge. p. 259–291.
Wang, Q., Sun, X., Xiong, H., Wang, Q., and Zhang, B. (2024). Environmental taxes, environmental outsourcing, and pollution abatement: evidence from Chinese industrial sewage discharge enterprises. Energy. Econ. 133, 107480. doi:10.1016/j.eneco.2024.107480
World Bank. (2024). World Development Indicators. World Bank. https://databank.worldbank.org/source/world-development-indicators.
Xu, H., Ahmad, M., Aziz, A. L., Uddin, I., Aljuaid, M., and Gu, X. (2024). The linkages between energy efficiency, renewable electricity, human capital and inclusive growth: the role of technological development. Energy. Strategy. Rev. 53, 101414. doi:10.1016/j.esr.2024.101414
Ying, Y. H., Chang, K., and Lee, C. H. (2014). The impact of globalization on economic growth. Romanian J. Econ. Forecast. 17 (2), 25–34.
Keywords: Environmental Kuznets Curve Hypothesis, Quarterly Data, Vector Autoregression Model, Variance–covariance Analysis, Uzbekistan
Citation: Nuriddinova M and Ahmad M (2025) Economic growth with environmental hurdles in Uzbekistan: testing the EKC hypothesis. Front. Environ. Sci. 13:1589766. doi: 10.3389/fenvs.2025.1589766
Received: 07 March 2025; Accepted: 24 June 2025;
Published: 30 September 2025.
Edited by:
Alina Cristina Nuta, Danubius International University, RomaniaCopyright © 2025 Nuriddinova and Ahmad. This is an open-access article distributed under the terms of the Creative Commons Attribution License (CC BY). The use, distribution or reproduction in other forums is permitted, provided the original author(s) and the copyright owner(s) are credited and that the original publication in this journal is cited, in accordance with accepted academic practice. No use, distribution or reproduction is permitted which does not comply with these terms.
*Correspondence: Maaz Ahmad, bWFhemFobWFkQHRzdWUudXo=