 Qiuli Yu
 Shengyi Yang*
- Commercial College, Shanxi Datong University, Datong, China
Introduction: In recent years, with the intensification of climate change, reducing greenhouse gas emissions has become a necessary measure to address climate change. The carbon trading policy, as an effective policy to promote carbon reduction, has been accepted and implemented by many countries.
Method: This study employs the twofold difference approach and synthetic control method to evaluate the impact of carbon trading policies on air pollutant emissions.
Result: Results showed that implementing carbon trading could lead to an average reduction of 54.13 million tonnes of CO2 annually, alongside decreases of 176.1 thousand tonnes of SO2 and 112.5 thousand tonnes of NOx. Among the six pilot regions—Hubei, Guangdong, Shanghai, Beijing, Tianjin, and Chongqing—Hubei exhibited the most significant CO2 reduction, approximately 66.25 million tonnes. Hubei and Beijing also showed notable synergistic effects for SO2 reduction. The synergistic emission reduction effect of NOx was more evident in Chongqing, Shanghai, and Hubei.
Discussion: These findings highlighted the effectiveness of carbon trading in mitigating CO2 and related air pollutants. To enhance and optimize the carbon trading market, the study recommends increasing the clean energy share in the energy mix, improving market management systems, enforcing reasonable penalties for defaults, and developing tailored carbon trading mechanisms for different industries.
1 Introduction
Carbon emissions (CEs) from the agricultural, industrial, service, and transportation sectors have become a major global concern (Abbas et al., 2022; Huang et al., 2024; Solaymani, 2019). Since the Industrial Revolution, the intensification of the greenhouse effect has resulted in more frequent extreme weather events, earthquakes, tsunamis, and other natural disasters. These events pose serious challenges to human survival. According to a report published by the World Meteorological Organization, there has been a 1.2°C increase in the worldwide average temperature in 2020 when compared to the period between 1850 and 1900. Therefore, it is essential to minimize greenhouse gas (GHG) emissions, such as CO2, in order to adapt to climate change and slow down global warming (Yang and Yao, 2023). The United Nations Framework Convention on Climate Change was signed by more than 150 countries and the European Economic Community in 1992. At the same time, in order to further limit the GHG emissions of developed countries to curb global warming, the Kyoto Protocol to the United Nations Framework Convention on Climate Change was adopted in 1997. The international emissions trading mechanism (IETM), the joint implementation mechanism (JI), and the clean development mechanism (CDM) are the three adaptable cooperation instruments that the Convention developed to minimize GHG emissions (Qi and Han, 2020). Among them, the core of the IETM is to allow developed countries to trade CE credits with each other, and after the construction of the CE trading mechanism, European and American countries have established carbon trade (CT) markets. Moreover, China approved seven pilot regions to establish CT market in 2011 to promote GHG emission reduction (ER) (Hao et al., 2021). Due to the homology between carbon dioxide and atmospheric pollutants (AP), and the fact that their production processes often interact with each other, it is necessary to coordinate and manage them. Therefore, in order to reduce the difficulty of realizing the expected CE reduction effect and to analyze the ER effect of carbon trading policies, it is necessary to analyze in depth the synergistic ER effect of carbon trading policies. This can optimize the carbon trading policy and enhance its synergistic ER effect. Among various statistical methods, difference in differences (DID) and synthetic control method (SCM) are used for impact analysis in multiple fields due to their simplicity and ease of operation.
DID is a statistical method commonly used in policy evaluation and causal inference. It is used to evaluate the causal effects of policies and interventions and has been widely adopted in many fields. Callaway et al. recognized that differences in the program processing effects of identification, estimation, and inference can occur over multiple time periods, therefore, DID was used to identify the parameters of treatment effect. It was demonstrated experimentally that a family causality can be recognized for parameters in a staggered setting. A number of different aggregation schemes were proposed through regression results and used to deal with the heterogeneity of different dimensional effects. Through asymptotic properties it was finally found that the experimentally proposed method was effective in guiding the program to correct reasoning (Callaway and Sant’ Anna, 2021). Athey et al. suggested a staggered method to estimate and infer the average treatment impact in a setting with panel data by utilizing difference-in-difference settings. The process analyzed the nature of the given values and quantities from a design perspective. The results demonstrated that the estimates of the standard deviation could be obtained by weighting the mean causality when the dates used were randomly assigned, precisely giving the corresponding numerical variations (Athey and Imbens, 2022). Researchers such as Venkataramani identified the closure of automobile assembly plants as a significant cause of local economic decline. The study synthesized data from the beginning of 1999 to the end of 2016 and found that adjusted counties were more economically impacted compared to manufacturing counties that were not affected by plant closures. County workers died in larger numbers during the 5-year period of plant closures. This side effect indicated that the closure of automobile factories and the irrational use of drugs were the main reasons for the decline of the local economy (Venkataramani et al., 2020). Fan et al. analyzed the pollution caused by highways on industrial emissions based on data from 2004 to 2016. Multi-period difference modeling was used throughout to address issues related to endogenous nature. Robustness tests proved that the suggested strategy was well-validated and may successfully minimize emissions produced by industrial pollution. Cities with HSR were found to be more polluted compared to other cities (Fan et al., 2020).
SCM is a ubiquitous method for estimating the impact of treatments on individual units in a panel data setup. Ben-Michael et al. proposed augmented SCM as an extension of SCM for cases where preprocessing was not feasible. Experimental results revealed that augmented SCM limited the estimation error of this method under different data generation processes, including linear factor models, and showed how regularization could help avoid overfitting noise (Ben-Michael et al., 2021). An SCM-based analysis was suggested by Tian et al. for a study on the efficacy and timing of a moderate COVID-19 intervention. The findings indicated that the new Crown pneumonia outbreak might be contained by the early application of modest treatments. In the hardest-hit areas, the epidemic worsened the later the intervention was put into place (Tian et al., 2021). An SCM-based computation technique for the straightforward determination of the synthetic jet exciter’s momentum coefficient was presented by Liu et al. However, this method was empirically proven to be ineffective at large stall angles (Liu et al., 2020). Cole et al. proposed an SCM-based analytical method for the effect of the Wuhan New Crown Pneumonia blockade on the concentration of four air pollutants. According to the experimental findings, there was no discernible impact of the blockade on the sulfur dioxide concentration (Cole et al., 2020).
In summary, the parallel trend hypothesis has not been fully validated by existing studies using the DID method, which results in biased estimates of the policy effects of DID. At the same time, overfitting the data during the preprocessing stage of constructing the synthetic control group poses a problem. This affects the model’s ability to generalize and the robustness of the estimation results. Therefore, in order to analyze the synergistic emission reduction (SER) effect of AP, the study analyzed the ER effect by DID and SCM. Air pollution is taken into consideration when analyzing China’s present CT strategy, which serves as a guide for improving the regional carbon trading (RCT) system. The average treatment effect and path of collaborative ER in pilot carbon markets are analyzed using DID, and the theoretical model of the carbon market collaborative ER mechanism is empirically validated. Then, SCM is used to analyze the SER effects of APs in various pilot carbon markets. When conducting empirical analysis, the study utilizes non pilot areas (PAs) to synthesize PAs and determine the weights of each province and city in the composite control group. The determination of weights aims to minimize the mean square prediction error. A virtual control group, called a “synthetic control,” is constructed by assigning different weights and linearly combining them. To verify the robustness of the results, the study also conducts a placebo test by shuffling the groups.
The study is broken up into four sections. The first section will give a quick overview of the previous research on DID and SCM. The second section will design an empirical study on the SER effect of RCT. The third section will analyze the results of the study. The fourth section is a discussion, which will explain and elaborate on the research results. The fifth section will summarize the full study.
2 Empirical study design of the synergistic emission reduction effect of regional carbon trading
In order to study the synergistic effect of regional CE trading on reducing APs and promoting low-carbon development of enterprises, an empirical model based on DID and SCM is designed and analyzed.
2.1 Design of empirical models
DID is a particularly useful technique for evaluating the effects of policies since it can mostly avoid the endogeneity issue and has a simplified model configuration. In the meantime, DID’s model setup is more scientific. It can estimate the effects of policies more accurately than the usual approach because it establishes a dummy variable that indicates whether or not the policy occurred before performing a regression. DID is used under the following conditions: (1) Parallel Trend Hypothesis: in the absence of a policy intervention, the trends in the outcome variables of the treatment and control groups should be parallel. (2) Ideally, the assignment of treatment and control groups should be randomized to reduce selection bias. (3) Its necessary to have sufficient time points and groups to estimate policy effects. Its robustness is tested by changing the model settings or using different estimation methods to verify the robustness of the results. The principle of DID as follows: Assuming there are two regions, one implementing a certain policy as the experimental group and the other as the control group. Prior to the policy intervention time point, the two districts exhibit parallel patterns; however, following the policy intervention, the experimental group’s path diverges. In a continuous data timeframe, the figure shows the impact of a non-targeted policy on the experimental and control groups at each time point following the policy intervention. The impact is represented in blue. The effect of a focused policy is represented in green. To obtain the effect of the target policy, only two differencing is required. The DID modeling formula is shown in Equation 1.
In Equation 1,
In Equation 2,
In Equation 3,
In Equation 4,
In Equation 5,
In Equation 6,
In Equation 7,
When Equation 8 satisfies certain conditions, there exists a weight vector such that its value tends to zero. Therefore,
In Equation 9,
2.2 Variables and data sources
In conducting the empirical analysis of the SER effect of RCT policies, the study takes China as an example. The data used are obtained from the National Bureau of Statistics, Wind database, China Urban Statistical Yearbook, China Energy Statistical Yearbook, China Environmental Statistical Yearbook, Environmental City Statistical Bulletin, and National Economic Development and Statistical Bulletin. Since the RCT PAs include not only cities but also provinces, the study uses municipal panel data from 2010 to 2017 and provincial panel data from 2007 to 2017. In addition, in order to avoid interference, the study excludes the data related to the second RCT policy pilot regions (Zhang and Umair, 2023; Okafor et al., 2022; Deng and Shangguan, 2021; Shi et al., 2023). The data analysis software used in the experiment is EViews. The explanatory variables of the study contain CO2 emissions, SO2 emissions, and NOx emissions. SO2 and NOx are chosen as the objects of SER because the emission data of SO2 and NOx are more sufficient and homologous to CO2 compared with those of airborne particulate matter, O3, and other pollutants. The control variables selected for the study include per capita GDP, industrial structure, urbanization rate, population density, and energy consumption. These control variables are chosen to ensure that the model’s estimated results accurately reflect the impact of carbon trading policies on SER effects while controlling for other factors that could affect the outcome variables. The selection of the variables controlled above is based on their impact on regional CEs. The National Bureau of Statistics, local statistical yearbooks, environmental statistics bulletins, and other sources provided the SO2 and NOx emissions. Due to the lack of a uniform calculation method for CO2, the study calculates provincial CO2 emissions using the IPCC National GHG Inventory Guidelines and the China Energy Statistics Yearbook. Additionally, Equation 10 displays the calculating formula.
In Equation 10,
In Equation 11,
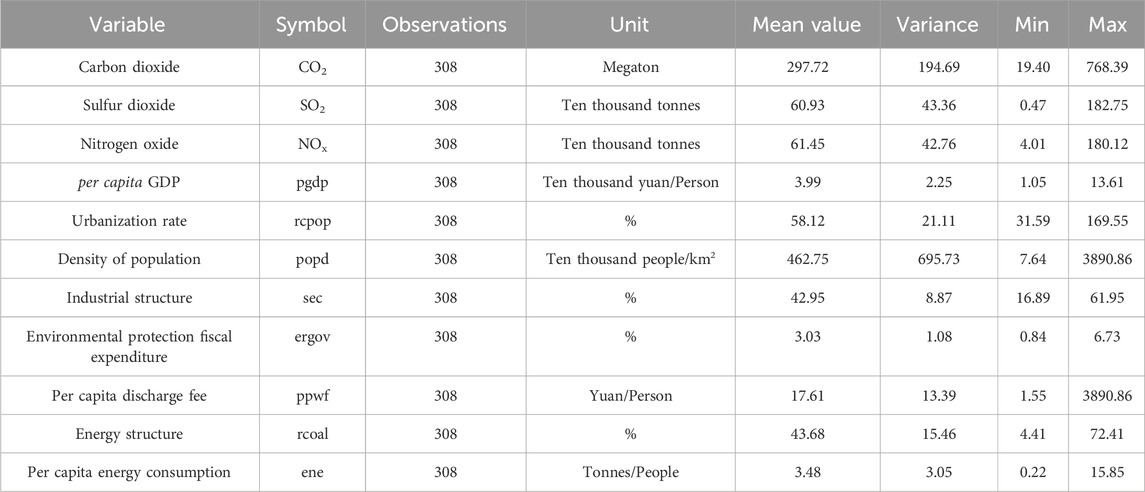
Table 1. Data are descriptive statistics.
According to Table 1, the smallest and maximum percentages of coal in the energy structure are 4.41% and 72.41%, respectively, with a mean value of 43.68%. The average amount of energy consumed per person is 3.48 tonnes, with minimum and greatest values being 0.22 tonnes and 15.85 tonnes, respectively.
3 Empirical analysis and optimization suggestions on the synergistic emission reduction effect of regional carbon trading
3.1 Empirical analysis of the synergistic emission reduction effect of regional carbon trading
The average treatment impact of AP abatement and the abatement effect of individual pilots are examined using DID and SCM, respectively, to examine the SER effect of the RCT policy. Before conducting the analysis, the study uses the trend observation method to perform a parallel trend test. This test is important for verifying that the trends of the experimental and control groups are parallel when using DID. Table 2 displays the DID analysis results.
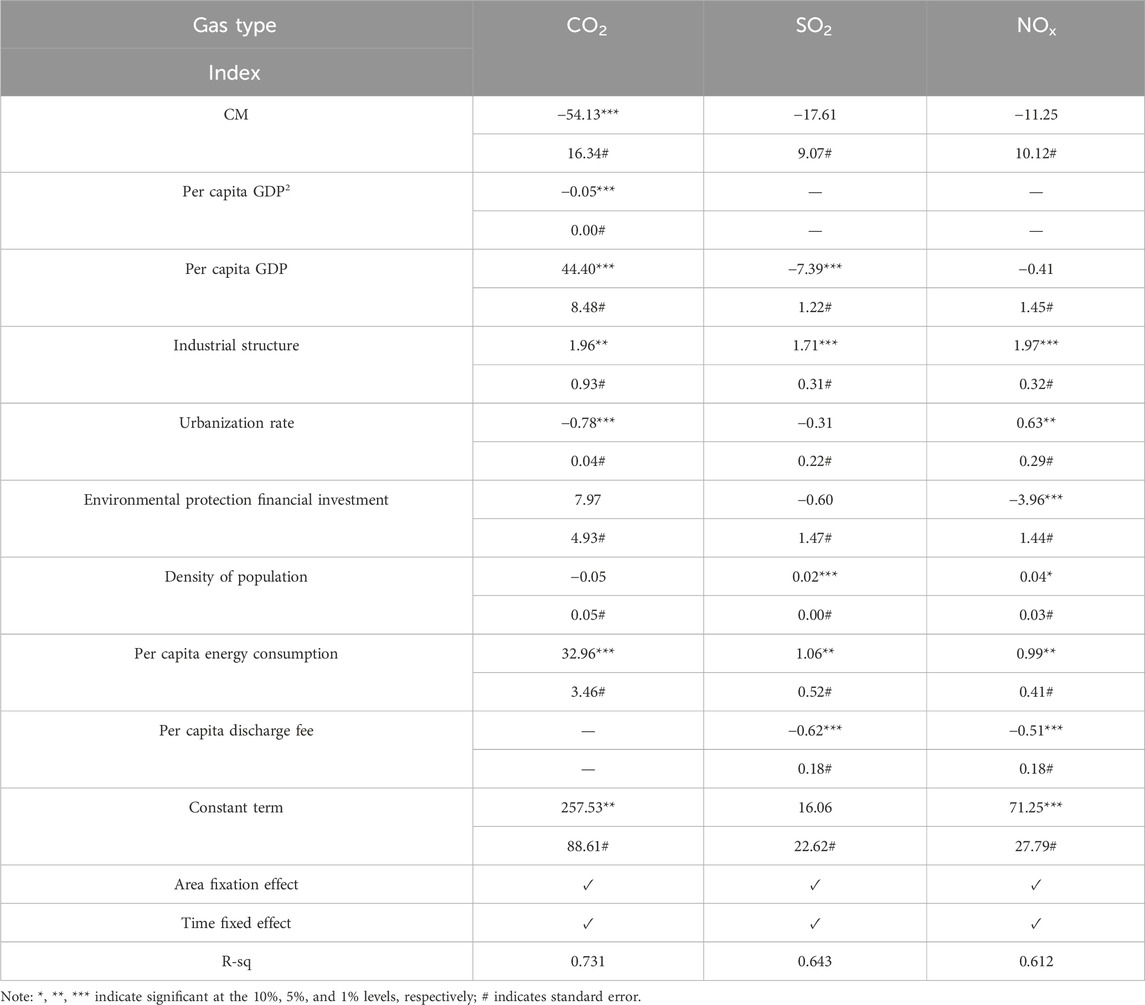
Table 2. The DID analysis results.
As shown in Table 2, the implementation of CT policy can reduce CO2 emissions by 54.13 million tonnes per year on average, and reduce SO2 and NOx by 176, 100 tonnes and 112, 500 tonnes each. Among the control variables of CO2 emissions, the coefficient of GDP per capita is 44.40, indicating that CO2 emissions are positively related to economic growth. The coefficient of industrial structure is 1.96, which indicates that the higher the production ratio of secondary industry, the higher the CO2 emission. The coefficient of urbanization rate is −0.78, meaning that the quantity of CE decreases with increasing urbanization rate. The coefficient of GDP per capita for SO2 emissions is −7.39, indicating a negative correlation between economic growth and SO2 emissions. With a correlation of 0.63 for NOx emission related to urbanization rate, it can be concluded that NOx emissions increase with urbanization rate. This is because urbanization accelerates, leading to a significant increase in the number of vehicles in cities and, consequently, an increase in NOx emissions from transportation. Urbanization often accompanies industrialization. Industrial production processes, especially those involving fossil fuels, can generate large amounts of NOx emissions. Power plants and factories are two examples of industrial facilities that emit large amounts of NOx. The study uses a placebo test to confirm the reliability of the findings. The study uses the non-pilot regions to synthesize the pilot regions, excludes the provinces and municipalities containing the second batch of pilot regions, and establishes the weights of the provinces and municipalities in the synthetic control group. This allows the study to investigate the mitigating effects of CT policies on individual pilots. In determining the weights, the goal is to minimize the mean square prediction error. After the weights are determined, the counterfactual control group can be synthesized according to the weights. The CO2 emissions of each pilot region and its control group are shown in Figure 1.
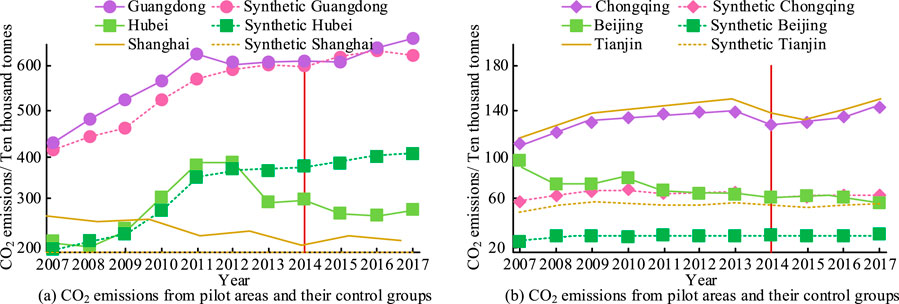
Figure 1. The CO2 emissions of each pilot area and its control group: (a) CO2 emissions from pilot areas and their control groups; (b) CO2 emissions from pilot areas and their control groups.
In Figure 1a, among the three pilot regions of Hubei, Guangdong, and Shanghai, Guangdong has the highest fit with its control group. Among them, Hubei’s CO2 emissions before 2014 are similar to its control group. Moreover, after 2014, CO2 emissions decreases significantly, with a reduction of about 66.25 million tonnes. Moreover, Guangdong’s CO2 emission after 2014 is close to that of the control group. Figure 1b shows that, both before and after 2014, Beijing, Tianjin, and Chongqing has CO2 emissions that are consistently greater than those of their control groups. Additionally, all of the fits are poor, making it impossible to determine the ER effect of the CT policy. According to the aforementioned findings, Hubei Province clearly benefits from the CT policy’s ER effect. Figure 2 displays each pilot region’s SO2 emissions along with those of the control group.
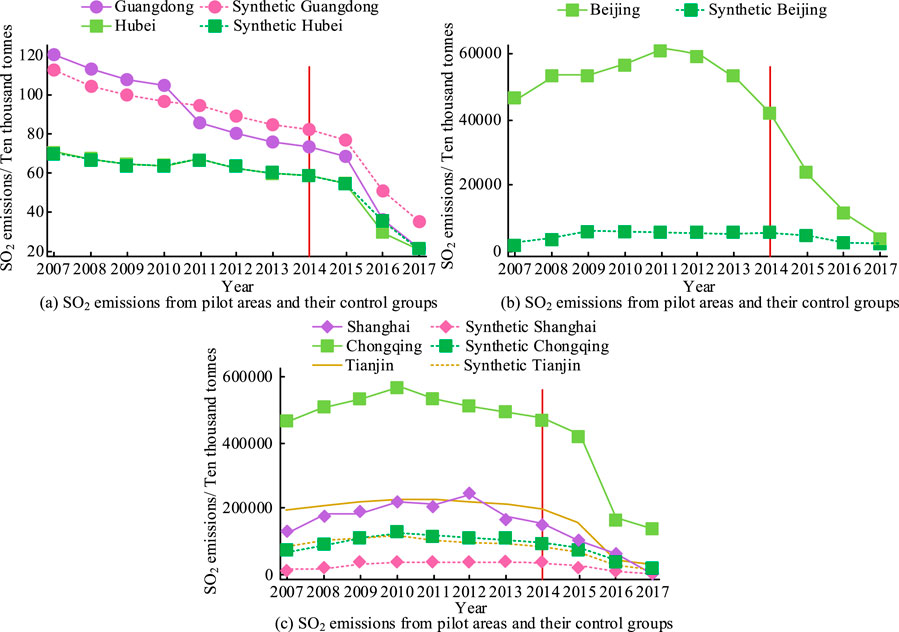
Figure 2. SO2 emissions from each pilot area and its control group: (a) SO2 emissions from pilot areas and their control groups; (b) SO2 emissions from pilot areas and their control groups; (c) SO2 emissions from pilot areas and their control groups.
In Figure 2a, both Guangdong and Hubei have better fits. Among them, Guangdong’s SO2 emissions begin to be lower than the control group after 2010. Hubei’s SO2 emissions begin to decline faster than the control group after 2015. Figure 2b shows that after 2014, Beijing’s SO2 emissions all begin to fall more quickly than those of the control group. Nevertheless, because to the poor fit, it is not able to assess the SER effect of the CT strategy in the relevant region. In Figure 2c, SO2 emissions in Shanghai, Tianjin, and Chongqing all started to decrease faster than the control group after 2014, but the fit is poor. Therefore, the SER effect of the CT policy in the corresponding region can not be judged. The above results indicate that the CT policy realizes the SER of SO2 in Hubei Province with a synergy of about 0.0003. After the implementation of carbon trading policies in 2014, it is worth noting that emissions in various regions did not immediately show significant changes. This is because companies need time to adjust their production processes, invest in new technologies, and change their energy structures. This results in a lag effect in their SER efforts. Meanwhile, CEs in various regions have decreased year by year within 4 years of the implementation of the carbon trading policy, indicating its long-term effectiveness. The NOx emissions in each PA and its control group are shown in Figure 3.
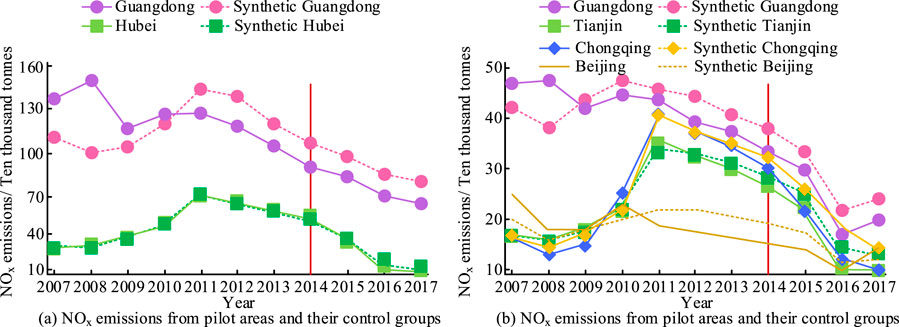
Figure 3. NOx emissions from each pilot area and its control group: (a) NOx emissions from pilot areas and their control groups; (b) NOx emissions from pilot areas and their control groups.
In Figure 3a, Hubei has a better fit and its NOx emissions are basically consistent with the control group. Guangdong, on the other hand, starts to emit less than the control group after 2010, and the fit is poor. Therefore, it is difficult to judge the SER effect of its NOx. In Figure 3b, Tianjin and Chongqing have a better fit, and their NOx emissions basically start to decrease around 2012, which is earlier than the CT time. The fits of Shanghai and Beijing are poor, and it is difficult to judge their SER effects. The above results indicate that the CT policy realized the SER of NOx in Hubei, Tianjin and Chongqing. This is because the industrial structure in Hubei, Chongqing, and other areas is primarily heavy industry. This type of industry often involves large amounts of energy consumption and pollutant emissions during the production process. The implementation of carbon trading policies forces high-energy-consuming enterprises to undergo technological transformation and adjust their energy structures to reduce their CE intensity. This directly promotes the coordinated reduction of CO2 and other APs. Before the implementation of carbon trading policies, the pollution levels in Hubei and Chongqing are relatively high, providing ample opportunity for collaborative ER. Additionally, Hubei and Chongqing have demonstrated exceptional performance in PI, which is another key factor contributing to their substantial SER effect. The local government has demonstrated strong organizational and execution capabilities in promoting and implementing carbon trading policies. To further explore the SER effect of the CT policy, the study extended the SCM. The CO2 emissions of the extended SCM are shown in Figure 4.
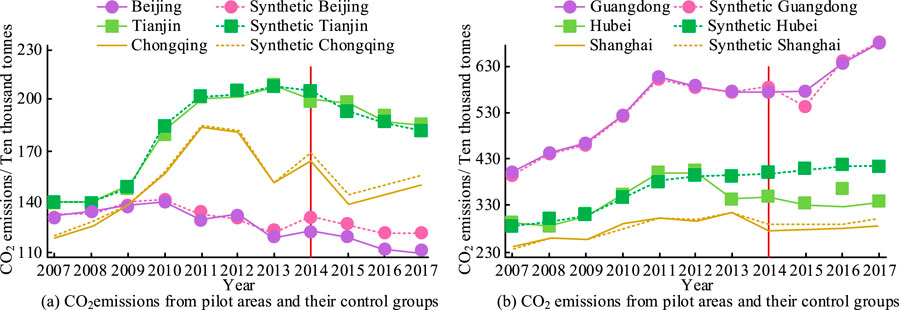
Figure 4. The CO2 emissions of the extended SCM: (a) CO2 emissions from pilot areas and their control groups; (b) CO2 emissions from pilot areas and their control groups.
Figure 4a shows the CO2 emissions of Beijing, Chongqing, and Tianjin. Emissions in Beijing and Chongqing begin to decline after 2014, with respective reductions of 9.65 and 3.3 million tons compared to the control group. Furthermore, Tianjin’s CO2 emissions are essentially in line with those of the control group. Figure 4b shows that there is little difference in Guangdong’s CO2 emissions before and after the CT policy is put into place. After 2014, CO2 emissions in Shanghai and Hubei decreased dramatically, by 7.55 million tonnes and 63.7 million tonnes, respectively. The CT policy has obvious ER effects in Beijing, Chongqing, Shanghai, and Hubei. The implementation of carbon trading policies can achieve SERs such as SO2 and NOx. This is due to the fact that the energy mix has changed significantly after the implementation of carbon trading policies. With the promotion of carbon trading policies, companies and regions may be encouraged to use clean energy or improve energy efficiency. This would reduce their dependence on fossil fuels. The optimization of this energy structure can simultaneously reduce the emissions of CO2, SO2, and NOx. Technological upgrading is another key driving force for achieving collaborative emissions reduction. The implementation of carbon trading policies has increased pressure on enterprises to reduce emissions. This has prompted them to invest in advanced pollution control technologies, such as flue gas desulfurization and denitrification, to reduce SO2 and NOx emissions.
3.2 Suggestions for regional carbon trading market optimization
In recent years, extreme weather and natural disasters have occurred frequently around the world, indicating that it is urgent to address climate change and reduce GHG emissions. According to the above research results, it can be concluded that the energy structure has a significant impact on the SER effect of the carbon trading market. It can be concluded that regions with high coal dependence have significant SER effects after implementing carbon trading policies. It can be concluded that improving the energy structure, increasing the proportion of clean energy in the energy structure, and gradually phasing out traditional coal fuels can effectively enhance the SER effect. The main measures to improve the energy structure are to promote the construction of smart grids and strengthen the production, storage, sales, and use of clean energy such as photovoltaics and wind power. In regions highly dependent on coal, it is necessary to promote natural gas and biomass energy alternatives, reduce coal dependence, and increase investment in clean energy, such as photovoltaics and wind power, to increase clean energy’s proportion in the energy structure. Regions with abundant clean energy resources are encouraged to develop and utilize clean energy, such as small hydropower and geothermal energy. They should also invest in energy storage technologies, such as battery storage and pumped storage, to balance the intermittency of clean energy. In addition, the increase in economic costs caused by carbon trading for enterprises, although temporarily avoided through industrial transfer and output adjustment, cannot guarantee the long-term competitiveness and vitality of enterprises. Therefore, it is necessary to improve the management system of the carbon trading market and formulate reasonable default penalties. This will allow enterprises to operate sustainably, maintain their competitiveness and vitality, and achieve continuous carbon reduction and ER. Finally, the operational mechanism of the carbon trading market itself will determine its SER effect. Therefore, to ensure the SER effect when promoting the carbon trading market, the operating mechanism should be carefully considered. The operating mechanisms of carbon trading markets with a synergy degree greater than o, such as those in Beijing and Shanghai, should be used as a reference. In addition, different industries have different characteristics. When formulating the operating mechanism of the carbon trading market, it is also necessary to fully consider the characteristics of the emission control industry itself. Based on this, a feedback mechanism is constructed to form a carbon trading market environment with active trading, active participation and effective emission control.
4 Discussion
A comprehensive analysis was conducted on the synergistic effect of reducing APs through DID and SCM in RCT policies. The research results indicated that carbon trading policies could not only effectively reduce carbon dioxide emissions, but also synergistically reduced sulfur dioxide and nitrogen oxide emissions. This discovery was consistent with some research results in existing literature. The study by Wei Y et al. showed that the tiered carbon trading policy increased renewable energy consumption by 0.12% and reduced CEs by 0.6% (Wei et al., 2023). The study by Kou P et al. showed that CEs trading had significant synergistic benefits in reducing sulfur dioxide emissions, and this benefit was mainly achieved by reducing fossil energy consumption (Kou et al., 2021). Carbon trading policies achieved coordinated ERs by adjusting the energy structure during implementation. Due to the promotion of carbon trading policies, enterprises and regions tend to increase their use of clean energy and reduce their dependence on high-carbon energy sources, such as coal. The optimization of this energy structure not only reduced CO2 emissions, but also reduced SO2 and NOx emissions. For example, research in Hubei Province and Chongqing City indicated that the implementation of carbon trading policies led to a significant increase in the use of clean energy in these areas, thereby achieving a coordinated reduction in various pollutants. The uniqueness of the study lies in the following aspects: first, the study not only evaluated the carbon dioxide ER effect of carbon trading policies, but also examined their SER effects on sulfur dioxide and nitrogen oxides. This comprehensive evaluation method provides a more comprehensive perspective for fully understanding the environmental benefits of carbon trading policies. Second, this study conducted a detailed analysis of the ER effects in different pilot regions, revealing the heterogeneity of policies in different regions. This discovery helps to understand the applicability and effectiveness of policies in different economic, social, and environmental contexts, providing a scientific basis for regional differentiated policy design. Through the above research, it has been proven that carbon trading policies can effectively reduce GHG and air pollutant emissions, providing empirical support for the effectiveness of carbon trading policies. This will help promote more regions and countries to adopt similar policy tools to address global climate change and air pollution issues. Although the research results of this article have important enlightening significance, there are also some limitations: first, this study incorporates Shenzhen into Guangdong Province for analysis, which may to some extent affect the accuracy of the results. Future research could consider more detailed regional divisions to obtain more accurate evaluations of policy effectiveness. Second, this study only analyzes the SER effect from a theoretical perspective and do not quantitatively evaluate the policy design mechanism. Future research can further quantify key parameters in policy design, such as carbon prices, quota allocation methods, etc., to more comprehensively evaluate the effectiveness and efficiency of policies.
5 Conclusion
To cope with climate warming and reduce the emissions of GHG and AP, all countries in the world have begun to realize CT policies. Since GHG and AP are homologous, the CT policy is bound to have some effects on the emissions of other APs when promoting carbon ER. In order to explore the SER effect of RCT policy, the study analyzed the SER effect of CT using DID and SCM. The main findings were as follows: Implementing carbon trading policies could significantly reduce annual CO2 emissions by about 54.13 million tons. These policies also had a synergistic effect on reducing SO2 and NOx emissions by 176,100 and 112,500 tons, respectively. Among the six PAs, Hubei Province had the most significant CO2 ER effect, with a reduction of approximately 66.25 million tons. In addition, Hubei Province and Beijing performed well in coordinating the reduction of SO2 emissions. Chongqing, Shanghai, and Hubei Province, on the other hand, performed more significantly in coordinating the reduction of NOx emissions. The above results show that the CT policy can effectively promote the reduction of GHG and AP. It can be inferred that carbon trading PAs can adjust their energy consumption structure by reducing total energy consumption and improving enterprise energy utilization efficiency. Although this will increase the production costs of enterprises, it can encourage them to promote economic growth through value enhancement and technological innovation compensation, which is the key path for carbon trading mechanisms to bring economic dividends. However, due to limitations in data acquisition, the study is unable to consider all factors that may affect ER. Additionally, incorporating Shenzhen into the Guangdong Province analysis impacts the accuracy of the results. Therefore, in the future, the effectiveness and efficiency of the carbon trading policy will be evaluated more comprehensively by quantifying and evaluating key parameters such as carbon prices and quota allocation methods. At the same time, the study needs to consider the characteristics of more regions and industries, and explore the applicability and effectiveness of carbon trading policies in different contexts.
Data availability statement
The original contributions presented in the study are included in the article/supplementary material, further inquiries can be directed to the corresponding author.
Author contributions
QY: Conceptualization, Data curation, Formal Analysis, Investigation, Methodology, Writing – original draft. SY: Conceptualization, Resources, Software, Supervision, Validation, Visualization, Writing – review and editing.
Funding
The author(s) declare that financial support was received for the research and/or publication of this article. The research is supported by Datong Soft Science Program Research Project, Research on the Main Problems and Countermeasures of the Construction of Pollutant Emission Trading Market in Datong City (No. 2020176).
Conflict of interest
The authors declare that the research was conducted in the absence of any commercial or financial relationships that could be construed as a potential conflict of interest.
Generative AI statement
The author(s) declare that no Generative AI was used in the creation of this manuscript.
Publisher’s note
All claims expressed in this article are solely those of the authors and do not necessarily represent those of their affiliated organizations, or those of the publisher, the editors and the reviewers. Any product that may be evaluated in this article, or claim that may be made by its manufacturer, is not guaranteed or endorsed by the publisher.
References
Abbas, A., Waseem, M., Ahmad, R., Khan, K. A., Zhao, C., and Zhu, J. (2022). Sensitivity analysis of greenhouse gas emissions at farm level: case study of grain and cash crops. Environ. Sci. Pollut. Res. 29 (54), 82559–82573. doi:10.1007/s11356-022-21560-9
Athey, S., and Imbens, G. W. (2022). Design-based analysis in difference-in-differences settings with staggered adoption. J. Econ. 226, 62–79. doi:10.1016/j.jeconom.2020.10.012
Ben-Michael, E., Feller, A., and Rothstein, J. (2021). The augmented synthetic control method. J. Am. Stat. Assoc. 116, 1789–1803. doi:10.1080/01621459.2021.1929245
Bhaktikul, K., Aroonsrimorakot, S., Laiphrakpam, M., and Paisantanakij, W. (2021). Toward a low-carbon tourism for sustainable development: a study based on a royal project for highland community development in Chiang Rai, Thailand. Environ. Dev. Sustain 23, 10743–10762. doi:10.1007/s10668-020-01083-4
Callaway, B., and Sant’ Anna, P. H. C. (2021). Difference-in-differences with multiple time periods. J. Econ. 225, 200–230. doi:10.1016/j.economy.2020.12.01
Cole, M. A., Elliott, R. J. R., and Liu, B. (2020). The impact of the Wuhan Covid-19 lockdown on air pollution and health: a machine learning and augmented synthetic control approach. Environ. Resour. Econ. 76, 553–580. doi:10.1007/s10640-020-00483-4
Deng, L., and Shangguan, Z. P. (2021). High quality developmental approach for soil and water conservation and ecological protection on the Loess Plateau. Front. Agric. Sci. Eng. 8, 501–511. doi:10.15302/j-fase-2021425
Denton, G., Chi, H., and Gursoy, D. (2022). An examination of critical determinants of carbon offsetting attitudes: the role of gender. J. Sustain Tour. 30, 1539–1561. doi:10.1080/09669582.2021.1920966
Eyuboglu, K., and Uzar, U. (2020). The impact of tourism on CO2 emission in Turkey. Curr. Issues Tour. 23, 1631–1645. doi:10.1080/13683500.2019.1636006
Fan, X., Xu, Y., Nan, Y., Li, B., and Cai, H. (2020). Impacts of high-speed railway on the industrial pollution emissions in China: evidence from multi-period difference-in-differences models. Kybernetes 49, 2713–2735. doi:10.1108/k-07-2019-0499
Hao, X., Wang, J., Sun, P., Shen, D., and Tian, L. (2021). Low-carbon economic operation for integrated energy system considering carbon trading mechanism. Energy Sci. Eng. 9, 2064–2078. doi:10.1002/ese3.967
Huang, Y., Elahi, E., You, J., Sheng, Y., Li, J., and Meng, A. (2024). Land use policy implications of demographic shifts: analyzing the impact of aging rural populations on agricultural carbon emissions in China. Land Use Policy 147, 107340. doi:10.1016/j.landusepol.2024.107340
Kou, P., Han, Y., Qi, X., and Li, Y. (2021). Does China's policy of carbon emission trading deliver sulfur dioxide reduction co-benefits? Environ. Dev. Sustain. 24 (5), 6224–6245. doi:10.1007/s10668-021-01699-0
Kreibich, N., and Hermwille, L. (2021). Caught in between: credibility and feasibility of the voluntary carbon market post-2020. Clim. Policy 21, 939–957. doi:10.1080/14693062.2021.1948384
Li, Y., Dai, J. M., and Zhao, H. (2023). Analysis of collaborative emission reduction of air pollutants and greenhouse gases under carbon neutrality target: a case study of Beijing, China. Clean Technol. Environ. Policy 26 (11), 3995–4008. doi:10.1007/s10098-023-02524-0
Liu, Z., Luo, Z., Zhou, Y., Li, S., and Cheng, P. (2020). Estimation of the momentum coefficient of synthetic jet in flow separation control over an airfoil. P I Mech. Eng. G-J Aer. 234, 2050–2061. doi:10.1177/0954410020926656
Mordue, T., Moss, O., and Johnston, L. (2020). The impacts of onshore-windfarms on a UK rural tourism landscape: objective evidence, local opposition, and national politics. J. Sustain Tour. 28, 1882–1904. doi:10.1080/09669582.2020.1769110
Nokhrina, O. I., Gizatulin, R. A., Golodova, M. A., Proshunin, I. E., Valuev, D. V., Martyushev, N. V., et al. (2022). Alloying and modification of iron-carbon melts with natural and man-made materials. Metallurgist 65, 1429–1448. doi:10.1007/s11015-022-01289-z
Okafor, C. C., Ibekwe, J. C., Nzekwe, C. A., and Ikeotuonye, C. M. (2022). Estimating emissions from open-burning of uncollected municipal solid waste in Nigeria. AIMS Environ. Sci. 9, 140–160. doi:10.3934/environsci.2022011
Pan, Y., Weng, G., Li, C., and Li, J. (2021). Coupling coordination and influencing factors among tourism carbon emission, tourism economic and tourism innovation. Int. J. Environ. Res. Public Health 18, 1601. doi:10.3390/ijerph18041601
Qi, X., and Han, Y. (2020). How carbon trading reduces China's pilot emissions: an exploration combining LMDI decomposition and synthetic control methods. Pol. J. Environ. Stud. 29, 3273–3284. doi:10.15244/pjoes/115212
Shi, X., Xu, Y., and Sun, W. (2023). Correction to: evaluating China's pilot carbon Emission Trading Scheme: collaborative reduction of carbon and air pollutants. Environ. Sci. Pollut. Res. Int. 30 (5), 11357–11358. doi:10.1007/s11356-022-25009-x
Solaymani, S. (2019). CO2 emissions patterns in 7 top carbon emitter economies: the case of transport sector. Energy 168, 989–1001. doi:10.1016/j.energy.2018.11.145
Tian, T., Luo, W., Tan, J., Jiang, Y., Zhang, H., Pan, W., et al. (2021). The timing and effectiveness of implementing mild interventions of COVID-19 in large industrial regions via a synthetic control method. Stat. Interface 14, 3–12. doi:10.4310/20-sii634
Venkataramani, A. S., Bair, E. F., O’Brien, R. L., and Tsai, A. C. (2020). Association between automotive assembly plant closures and opioid overdose mortality in the United States: a difference-in-differences analysis. Jama Intern Med. 180, 254–262. doi:10.1001/jamainternmed.2019.5686
Wei, Y., Wang, X., Zheng, J. H. J., Ding, Y., and Han, J. (2023). The carbon reduction effects of stepped carbon emissions trading and carbon capture and storage on hybrid wind-PV-thermal- storage generation operating systems. Environ. Sci. Pollut. Res. 30 (38), 88664–88684. doi:10.1007/s11356-023-28644-0
Wu, X., Tian, Z., and Guo, J. (2022). A review of the theoretical research and practical progress of carbon neutrality. Sustain. Oper. Comput. 3, 54–66. doi:10.1016/j.susoc.2021.10.001
Xia, S., and Yang, Y. (2022). Examining spatio-temporal variations in carbon budget and carbon compensation zoning in Beijing-Tianjin-Hebei urban agglomeration based on major functional zones. J. Geogr. Sci. 32, 1911–1934. doi:10.1007/s11442-022-2029-y
Yang, J., Yang, R., Chen, M. H., Xi, J., and Zhi, Y. (2021). Effects of rural revitalization on rural tourism. J. Hosp. Tour. Manag. 47, 35–45. doi:10.1016/j.jhtm.2021.02.008
Yang, Y., and Yao, G. (2023). Fresh agricultural products supply chain coordination considering consumers’ dual preferences under carbon cap-and-trade mechanism. J. Ind. Manag. Optim. 19, 2071–2090. doi:10.3934/jimo.2022032
Zhang, Y., and Umair, M. (2023). Examining the interconnectedness of green finance: an analysis of dynamic spillover effects among green bonds, renewable energy, and carbon markets. Environ. Sci. Pollut. Res. 30, 77605–77621. doi:10.1007/s11356-023-27870-w
Keywords: regional carbon trading, carbon emission reduction, synergistic emission reduction, synthetic control method, double difference method
Citation: Yu Q and Yang S (2025) Synergistic effect of carbon emission reduction from regional carbon trading on air pollutant emission reduction. Front. Environ. Sci. 13:1590813. doi: 10.3389/fenvs.2025.1590813
Received: 10 March 2025; Accepted: 09 June 2025;
Published: 27 June 2025.
Edited by:
Honglei Wang, Nanjing University of Information Science and Technology, ChinaReviewed by:
Adnan Abbas, Nanjing University of Information Science and Technology, ChinaZhe Cui, Nantong University, China
Copyright © 2025 Yu and Yang. This is an open-access article distributed under the terms of the Creative Commons Attribution License (CC BY). The use, distribution or reproduction in other forums is permitted, provided the original author(s) and the copyright owner(s) are credited and that the original publication in this journal is cited, in accordance with accepted academic practice. No use, distribution or reproduction is permitted which does not comply with these terms.
*Correspondence: Shengyi Yang, c2hlbmd5aV95YW5nQDEyNi5jb20=