 Zhenlin Li1,2
 Xiang Qin
 Yushuo Liu
 Zizhen Jin
- 1Key Laboratory of Western China’s Environmental Systems (Ministry of Education), College of Earth and Environmental Sciences, Lanzhou University, Lanzhou, Gansu, China
- 2Gansu Natural Resources Information Center, Lanzhou, Gansu, China
- 3Qilian Shan Station of Cryosphere and Ecologic Environment, Key Laboratory of Cryospheric Science and Frozen Soil Engineering, Northwest Institute of Eco-Environment and Resources, Chinese Academy of Sciences, Lanzhou, China
- 4Key Laboratory of Cryospheric Science and Frozen Soil Engineering, Northwest Institute of Eco-Environment and Resources, Chinese Academy of Sciences, Lanzhou, China
- 5Department of Geography, Xinzhou Normal University, Xinzhou, China
Based on the lack of understanding of the attribution of land use change and the resulting ecological effects in the Datong River Basin (DTRB), we analyzed the spatial-temporal characteristics of the land use change and explored the drivers of the changes, and calculated the effect of the land use change on the net primary productivity (NPP) from 1990 to 2020. The main conclusions are as follows: The predominant land use types comprised grassland, forest, cropland, bare land, ice/snow and other categories. The cropland, grassland and shrubs showed a decreased trend. However, forest, bare land and impervious surface were increased. The comprehensive index of the land use degree showed a significant downward trend, indicating that land use intensity will likely remain at a low level. Additionally, these conversions occurred among different land use types. Cropland and Grassland were dominated by transfer-out; Forest, bare land and impervious surface were dominated by transfer-in. Regarding the analysis of the driving factors of land use changes. The low elevation area was affected by human activities, and under the impact of “green gain” protection policy, the area of grassland increased; coupled with the impact of “returning farmland to forests,” the area of cropland decreased. Bare land was significantly and negatively correlated with GDP and population, while impervious surface was positively correlated. However, high-altitude areas were affected by natural factors, with grassland partial negatively correlated with precipitation. For bare land, it partial positively correlated with temperature. Snow/ice partial positively correlated with precipitation. Regarding the ecological effect of land use change, the multi-year average NPP was about 167.0 gC·m−2·a−1 and showed a decreased trend during the period of 1990–2020, and the NPP decreased in the northwest and increased in the southeast. This study provides scientific suggestions for the management of land resources and ecological environmental protection.
1 Introduction
Land is a fundamental natural resource and material basis for human society’s survival and development. Land use/cover change (LUCC) is a critical driver of global climate and environmental change (Xu et al., 2019). Research on global LUCC began in the 1990s with the International Geosphere-Biosphere Programme (IGBP) and the International Human Dimensions Programme on Global Environmental Change (IHDP) (Uhrqvist and Lövbrand, 2014). These programs underscored the role of LUCC in global research, highlighting its significant influence on climate change and human development (Wang et al., 2019). The interventions of human and natural have led to global warming, biodiversity loss, groundwater depletion, and these changes in terrestrial ecosystem net primary productivity (Williams et al., 2015; Januchowski-Hartley et al., 2016; El-Beltagy and Madkour, 2012; Scanlon et al., 2005). Sustainable land use is a pivotal issue in industrialization and urbanization processes, impacting economic strength, food security, land conservation, and regional development (Wang et al., 2018). For instance, the conversion of cultivated land to urban generated some potential risks to food security (Li et al., 2009). Consequently, LUCC holds a critical position in global sustainable development (He et al., 2013). A deeper understanding of the spatial and temporal patterns of LUCC, its driving mechanisms, and the ecological effects (NPP) of land use changes is of scientific importance for balancing natural and human systems and enhancing regional ecological environments (Hu et al., 2020).
The use of satellite products has enabled access to global and regional land cover databases with varying spatial resolutions (Grekousis et al., 2015). Combined with remote sensing data, these resources allow for analysis of land use changes across different spatial and temporal scales, as well as for attribution analysis of these changes. The driving factors behind LUCC changes mainly include natural conditions, climate change, economic development, social environment, and population dynamics (Liu et al., 2010). Broadly, these drivers can be categorized into two types (natural and human-induced factors). For human-driven factors (such as economics, technology, population, and policy), population pressure and intensive agricultural land use have led to habitat fragmentation (Ferranto et al., 2011; Sleeter, 2008), significantly impacting regional groundwater and surface water quality (Lee, 2009). For instance, land use changes are closely linked to shifts in government land policies and socioeconomic development in China (Wang et al., 2018). Among natural factors, hydrothermal conditions have the important impact on land use changes, along with soil types (Han et al., 2019; Yang et al., 2022). Rainfall is the most critical factor affecting vegetation growth in arid and semi-arid regions, while temperature is inversely related to vegetation growth. Annual variations in temperature and precipitation align with changes in land use; as temperatures rise and precipitation decreases, water body areas shrink, and grassland and forest areas decline. Conversely, the increases in both temperature and precipitation shift unused land toward grasslands and water bodies, indicating that improved hydrothermal conditions benefit ecological restoration (Yang et al., 2022). Therefore, it is essential to comprehensively consider the influences of both natural and socioeconomic factors when analyzing the driving forces of land use change (Xue et al., 2016; Han et al., 2019).
Driven by natural and human factors, land use changes inevitably impact the environment, affecting water resources and ecological processes (Guédé et al., 2024; Zhou et al., 2015). Changes in different land use types significantly influence hydrological processes. For evapotranspiration, these changes in high and medium-coverage grasslands and bare land are positively correlated with evapotranspiration, while low-coverage grassland and cold desert areas changes show a negative correlation. Regarding surface and subsurface runoff, these changes in low-coverage grasslands and cold deserts are positively correlate, whereas changes in high and medium-coverage grasslands and bare land are negatively correlated, often exacerbating groundwater shortages in arid regions (Stonestrom et al., 2009; Perrone and Jasechko, 2017; Jin et al., 2021). Land use changes also substantially affect the net primary productivity (NPP) of vegetation, with land use changes playing a dominant role in the variation of NPP. For example, the conversion of forests and farmland to construction land reduces NPP, weakening the carbon sequestration capacity of the vegetation. Conversely, ecological projects aimed at reforestation and grassland restoration boost NPP significantly by promoting beneficial land use changes (Jiang et al., 2016; Cheng et al., 2017).
However, most studies examine the environmental effects of land use changes over longer intervals (5 or 10 years) and only focus primarily on urban areas. Few studies utilize annual land use change data, which may obscure the driving mechanisms and environmental impacts. Additionally, most research emphasizes the hydrological effects of land use changes, while studies on the ecological impacts of year-by-year land use changes are scarce. Therefore, this study focuses on the DTRB, located in the eastern section of the Qilian Mountains. Using the annual land use data and meteorological data (we aim to monitor land use changes and climate changes over an extended time series to effectively capture shifts in long-term driving factors and their environmental impacts), we analyze the spatial and temporal characteristics of land use changes and their drivers and simulate NPP changes resulting from land use change using the CASA (Carnegie-Ames-Stanford approach) model.
2 Data and methods
2.1 Study area
The DTRB is located between 36°30′–38°25′N and 98°30′–103°15′E, along the northeastern edge of the Tibetan Plateau. It originates in Tianjun County, Qinghai Province, and is a secondary tributary of the Yellow River. Flowing southeast through the counties of Gangcha, Qilian, Haiyan, Menyuan, and Huzhu, it joins the Huangshui River at Xiangtang Town in Minhe County (Figure 1) before eventually entering the Yellow River. The basin has an elongated, narrow shape, with a main channel length of 560.7 km, an average gradient of 4.65%, and a basin area of 15,130 km2. Over 80% of the catchment area lies above 3,000 m, with ridge peaks around 4,500 m. The basin covers 11 counties across Gansu and Qinghai provinces, with the population primarily concentrated in Menyuan County, Honggu District, and Yongdeng County. The area is predominantly agricultural with an integrated farming and grazing economy. Vegetation mainly consists of mountain forests, grasslands, and alpine shrublands.
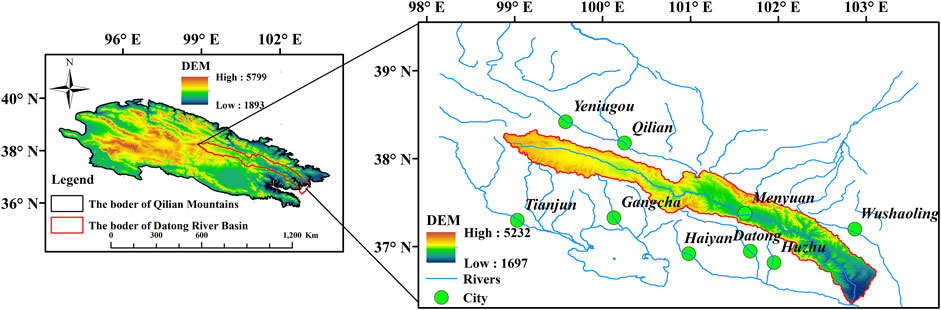
Figure 1. A sketch of study area in DTRB.
The basin experiences a cold, semi-humid continental mountain climate. The upper reaches have a semi-arid grassland climate, while the middle and lower reaches experience a semi-humid forest-steppe climate. The long-term average temperature ranges from −0.3°C to 8.0°C, with an average annual precipitation of approximately 467 mm, 70% of which falls between June and September. The climate is characterized by long cold seasons, short warm seasons, coinciding rain and warmth, abundant sunshine, and strong solar radiation (Liu et al., 2015). The runoff is primarily fed by rainfall and melting snow and ice. The main flood season occurs from June to September, with floods mainly driven by heavy rainfall, influenced by the southeastern ocean monsoon.
2.2 Land use data
The land use data are based on the annual China Cover Dataset (CLCD) produced by Yang and Huang (2021) based on 335,709 Landsat images on Google Earth Engine. This dataset contains year-by-year land cover information of China from 1985 to 2020. Based on all available Landsat data on GEE, spatio-temporal features are constructed, and the classification results of each land type are obtained by combining with the random forest classifier, and a post-processing method including spatio-temporal filtering and logical inference is proposed to further improve the spatio-temporal consistency of CLCD. In terms of accuracy validation, the overall classification accuracy of CLCD is 79.30% ± 1.99% based on 5,463 visually decoded samples. For each land use type, water had the highest average accuracy score (87.06% ± 7.07%), followed by forests (85.49% ± 1.30%), snow and ice (83.51% ± 7.99%), and unused (81.85% ± 4.15%). Grasslands and impervious areas were more accurate, with average accuracy scores exceeding 72%. In addition, CLCD outperformed MCD12Q1 and ESACCI_LC in terms of overall accuracy. For land use types with a larger percentage of area, such as farmland, forests, and grasslands, CLCD also showed better and more consistent accuracy relative to MCD12Q1 and ESACCI_LC.
2.3 Meteorological data
Regarding the meteorological data such as temperature and precipitation, according to Li et al. (2009), CMFD (China Meteorological Forcing Dataset) and ERA5-Land can well reproduce the spatial distribution of the monthly average temperature and precipitation in Qilian Mountains. Compared with the measured temperature and precipitation, both products underestimate the temperature and ERA5-Land overestimate the precipitation, and the error of CMFD on precipitation is significantly smaller than that of ERA5-Land. Overall, ERA5-Land is more applicable than CMFD in Qilian Mountains. For precipitation, CMFD performs better in the central and eastern part of Qilian Mountains, while ERA5-Land performs better in the western part of Qilian Mountains. Therefore, ERA5-Land was used for temperature and CMFD was used for precipitation data in this study (the upper reaches of the DTRB is located in the middle part of the Qilian Mountains, while the middle and lower reaches are located in the eastern part of the Qilian Mountains). The topographic data were obtained from the geospatial data cloud GDEMV2 30 m (https://www.gscloud.cn/), which was used to calculate the elevation distribution and area of the basin.
2.4 Population and GDP data
The population and GDP data are from National Information Center of China (https://ceidata.cei.cn/). We collected population and economic data for Menyuan County from 2000 to 2020, with the exception of missing economic data for the years 2000 and 2003.
2.5 Methodology
2.5.1 Calculation of the degree of land use
This study quantifies the degree of land use by means of the comprehensive index method of the degree of land use. The degree of land use is divided into four levels, and an index is assigned to it in a hierarchical manner. The quantitative basis of the degree of land use is established on the limit of the degree of land use, whose upper limit is that the utilization of land resources has reached the apex and human beings are unable to further develop and utilize them, and the lower limit is the starting point of human beings’ development of land resources, which is considered that the degree of land use can be expressed in the form of a discontinuous function. Based on the above characteristics, the four ideal states of land use are designated as four land-use classes, to which they are assigned their own category values, and four graded indices of the degree of land use are obtained, as shown in Table 1.
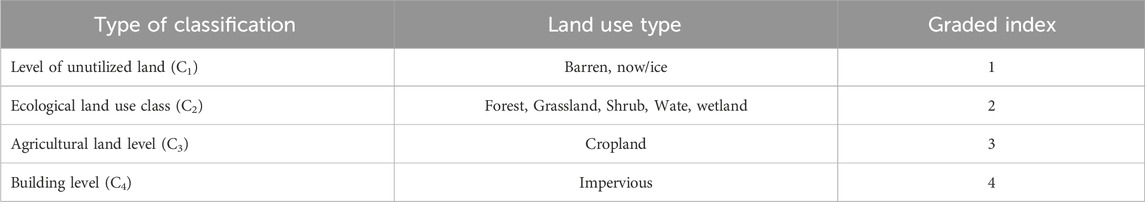
Table 1. The classification values of land use degree.
The four types of land use in the table are only four ideal types, and in the actual state, these four types are mixed in the same area, each occupying a different area proportion, and make their own contribution to the degree of local land use, according to their own weights. Accordingly, the comprehensive quantitative index of the degree of land use must be mathematically synthesized on this basis to form a composite index with a continuous distribution between 1 and 4, the size of which reflects the degree of land use in a certain area. The quantitative comprehensive index of the degree of land use is a Weaver index (Formulas 1, 2). Its calculation method is as follows:
Where LI is the comprehensive index of land use degree, which ranges from 100 to 400, and its size reflects the degree of land use. Ai is the index of land use degree grading of level i, and Ci is the percentage of area of land use degree grading of level i. Cib and Cia represent the percentage of area of land use degree of level i at time b and time a, respectively. ΔL is the amount of change of land use degree, when it is greater than 0, the regional land use is in the development period, and vice versa, it is in the adjustment or decay period.
2.5.2 Land-use change transfer matrix calculations
Information on changes in the number of land-use types can be analyzed and calculated using the land-use change transfer matrix, which comprehensively and systematically portrays the structural characteristics of regional land-use change and the direction of change of various land-use types (Formula 3). The transfer matrix can reflect the structure of land use types at the beginning and the end of the study period, and reflect the changes in the transfer of various land use types during the study period, which makes it easy to understand the direction of the transfer of various land use types at the beginning of the study period and the sources and composition of various land use types at the end of the study period.
Where Pij is the area (km2) of land use type i converted to type j during the study period; n is the total number of land use types.
2.5.3 Partial correlation analysis
A partial correlation analysis explores the correlation between landscape area and temperature or precipitation by excluding the effect of another variable. The partial correlation coefficient reflects the effect of a single factor on landscape area when the other variable is controlled. When the absolute value of the partial correlation coefficient is greater than the absolute value of the other meteorological factor, the variable that matches the landscape area is considered to have a greater influence on the landscape area than the other factor, making the former the dominant influence. The partial correlation coefficient (rxy,z) can be calculated by the following Formula 4.
where x, y, z are temperature, precipitation, and area of each landscape, respectively, rxy is the correlation coefficient between the two variables x and y, rxz is the correlation coefficient between the two variables x and z, ryz is the correlation coefficient between the two variables y and z, and rxy,z are the partial correlation coefficients of the variables x and y, which were obtained by excluding the effect of variable z.
2.5.4 CASA model
The CASA (Carnegie-Ames-Stanford approach) model is a process-based model used to estimate vegetation net primary productivity (NPP) by simulating vegetation physiological processes, it integrates meteorological, environmental and soil factors to simulate the physiological process of absorption of photosynthetically active radiation by vegetation and its conversion into organic carbon. The model is shown below (Formula 5):
where NPP is net primary productivity (g Cm−2/month), 0.5 represents the proportion of radiation that can be absorbed by the plant (0.4–0.7 µm), SOL (x, t) is the total solar radiation incident on grid cell x for a given month (MJm-2/month), FPAR (x, t) is the fraction of photosynthetically active radiation absorbed on grid x, Tε1 and Tε2 are temperature stress factors representing the effects of high and low temperatures on light use efficiency, respectively, WSC (x, t) is the water stress coefficient on grid cell x in a given month, and εmax is the maximum possible efficiency (g CMJ-1) under ideal conditions (unstressed temperature and unstressed water).
3 Results
3.1 Spatial distribution patterns of land use
The main land use types in DTRB included grassland, forest, cropland, bare land, shrubland, ice and snow, water bodies, impervious surfaces, and wetlands. Their areas were 11454.3 km2, 1801.8 km2, 730.3 km2, 665.4 km2, 224.8 km2, 120.2 km2, 31.9 km2, 5.8 km2, and 3.9 km2 during the period of 1990–2020, respectively. Grassland and forest covered the largest proportions, at 76.23% and 11.96%, respectively, followed by cropland and bare land, with comparable areas of 4.88% and 4.36%. Impervious surfaces and wetlands account for the smallest areas, at only 0.04% and 0.03%. The proportion of each land use changed continuously at the annual scale (Table 2). This study used the latest land use data in 2020 to illustrate the spatial distribution of various land-use types. Figure 2 showed that grasslands were the most widespread, with the largest areas in the northwest and fewer in the southeast; forest was mainly concentrated in the southeastern; cropland was centralized in the middle region; bare land was more dispersed, with greater presence along the edges of western areas; shrubland occupied smaller; ice/snow was concentrated along the northern edge of the central region, and it interspersed with bare land; impervious surfaces (urban areas) are clustered in the downstream area. Analysis of land use intensity in the basin revealed that comprehensive index of land use degree was about 199.7 from 1990 to 2020, indicating a relatively low level of land utilization. This is primarily due to high-altitude mountainous areas covering 80.0% of the basin, with elevations between 3,000 and 4,000 m accounting for 61.6% of the total area. In contrast, low mountainous areas (1,500–3,000 m) cover only 3016.7 km2, comprising just 20.0% of the basin, where cropland and urban areas are mainly concentrated (Table 3). The topography limits the potential for further land use intensification.
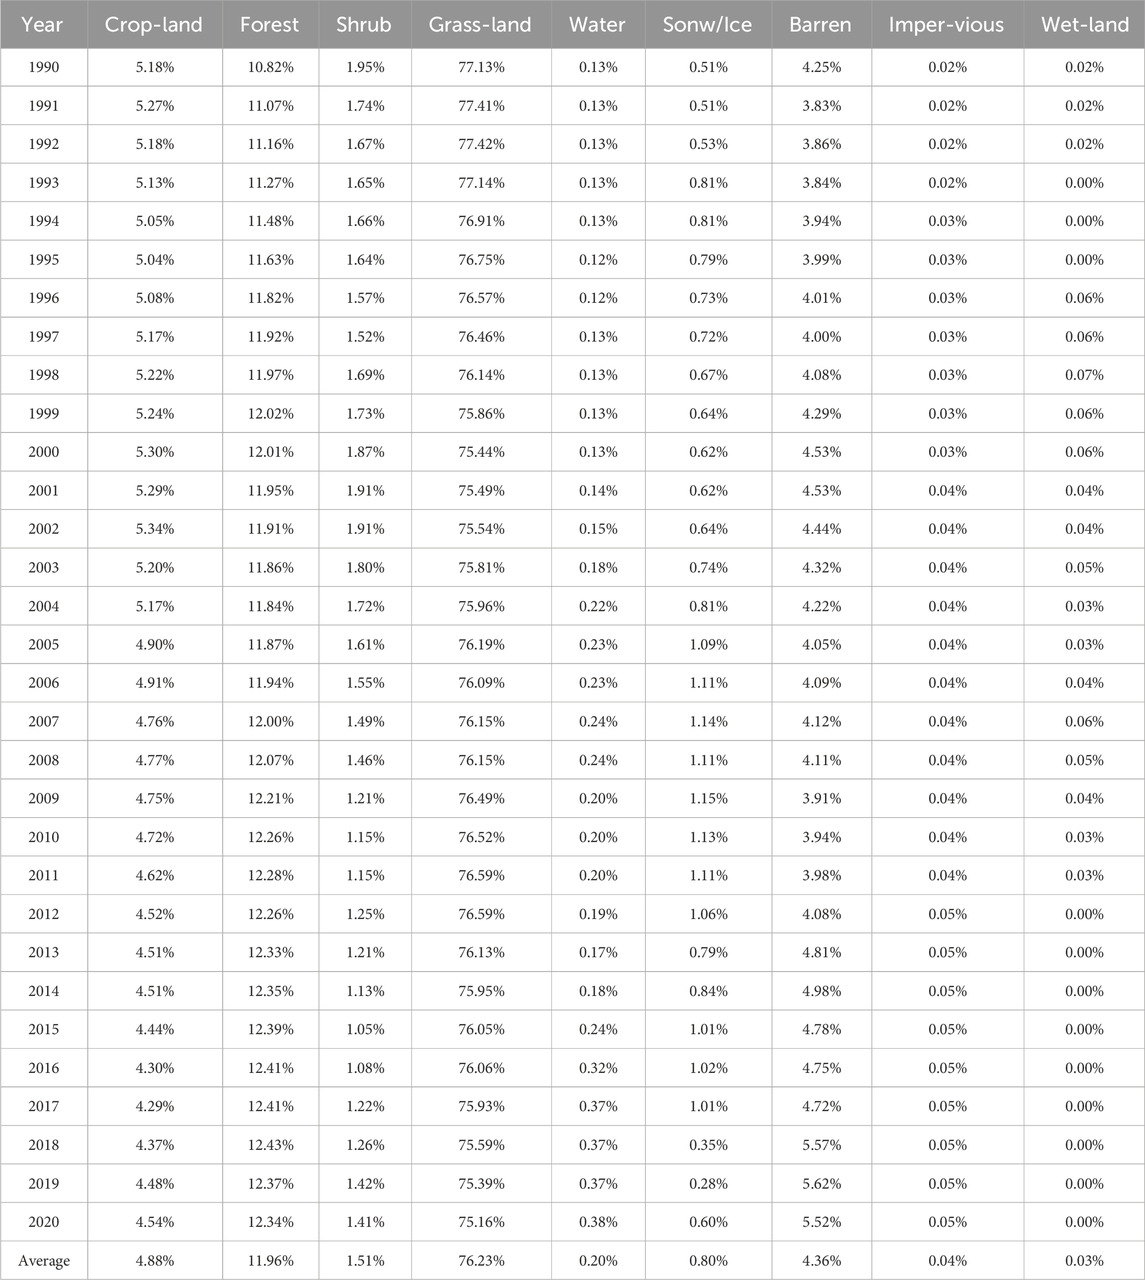
Table 2. The proportion of each land-use type in DTRB from 1990 to 2020 (%).
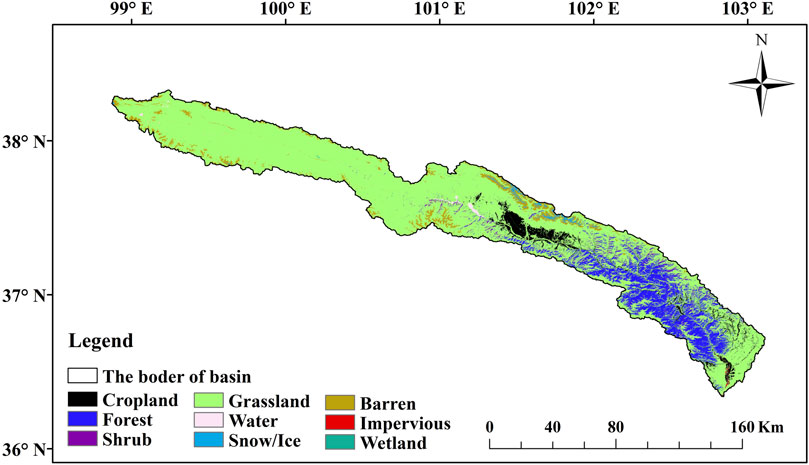
Figure 2. The spatial distribution of land use in the DTRB in 2020.
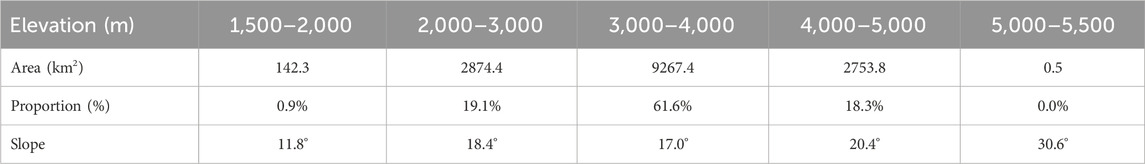
Table 3. Area of each elevation interval in the DTRB.
3.2 Spatiotemporal changes of land use types
3.2.1 Temporal changes of land use types
Driven by both natural factors and human activities, significant changes have occurred in the various land use types in DTRB (Figure 3). Cropland area showed a marked decline, with minimal variation before 2002, but a sharp decrease was observed after that. For ecological land, shrubland and grassland exhibited a notable reduction. Grassland declined rapidly between 1990 and 2000, followed by a gradual decline with fluctuations. In contrast, forest experienced rapid growth before 2000, with a slower but steady increase thereafter. Water bodies demonstrated an increasing trend, especially rapid after 2015. Wetlands showed an overall decline, with large fluctuations before 2013 and a sharp decrease thereafter. As for unused land, both bare land and ice/snow displayed an increasing trend. Impervious surfaces, largely representing urban development, have significantly increased since 1990 (Figures 3a–d).
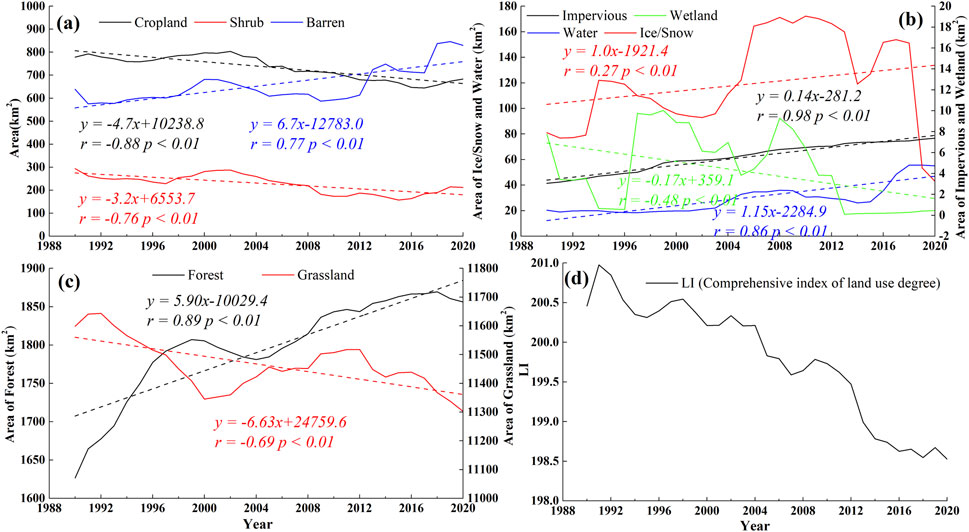
Figure 3. The change of each land use type and comprehensive index of land use degree (a) represents the changes of cropland, shrub, and baren; (b) represents the changes of impervious, wetland, water, and ice/snow; (c) represents the changes of forest and grassland during the period of 1990–2020; (d) represents the comprehensive index of land use degree during the period of 1990–2020.
Analyzing changes in the land use intensity in relation to shifts in various land use types. Figure 3d showed a significant downward trend in the comprehensive index of land use degree (p < 0.01), indicating that land use intensity will likely remain at a low level in the future. The value of ΔL is −2.03, reflecting land use intensity showed a declined trend. Although urban areas have expanded, the absolute increase was minimal due to topographical constraints, and cropland has notably decreased since 2002. Grassland area has also significantly declined. Given the substantial weight of cropland and impervious surfaces in the land use intensity index, this decline contributed to an overall downward trend in land use intensity. The calculated comprehensive dynamic degree of land use was 0.10%, indicating minimal land use transformation over the past 31 years.
Figure 3 showed that all land use types have experienced varying degrees of change. This study employed a transition matrix to illustrate how each land use type has shifted over time (Table 4). The area of cropland that remained unchanged was 575.4 km2 from 1990 to 2020, while 97.2 km2 transitioned into cropland from other types, with 98.1% of this coming from grassland. Meanwhile, 189.4 km2 shifted out from cropland, 93.3% of which converted back to grassland, with smaller portions transitioning to water bodies and impervious surfaces; the conversion rate between cropland and grassland was the highest. Grassland, the largest land use type in DTRB, had an inflow area of 357.4 km2, primarily from cropland (49.5%), followed by shrubland (28.7%) and bare land (15.5%). Outflow from grassland amounted to 649.3 km2, with most converting to bare land (39.2%) and forest (33.3%), and smaller portions shifting to cropland, shrubland, and water bodies (14.5%, 6.4%, and 5.9%, respectively). For shrubland, 104.8 km2 transitioned in, mostly from forest (60.1%) and grassland (39.9%), while 185.1 km2 moved out, largely to grassland (55.5%) and forest (44.4%). Forest experienced an inflow of 304.3 km2, predominantly from grassland (71.0%) and shrubland (27.0%). The outflow from forest was 79.5 km2, with most shifting to shrubland (79.3%) and grassland (19.8%). Bare land also experienced a significant turnover, with 280.3 km2 transitioning in, primarily from grassland (90.7%), and 91.6 km2 shifting out, mainly to grassland (60.3%) and ice/snow cover (35.6%). Analyzing the net transitions, cropland, shrubland, and grassland showed a decreasing trend, except for forest and bare land. Other land use types, including water bodies, ice/snow, impervious surfaces, and wetlands, collectively accounted for about 1% of the total area and had minimal transitions. Notably, impervious surfaces (urban) showed a steady increase, with most conversions coming from cropland (56.1%) and grassland (25.3%).
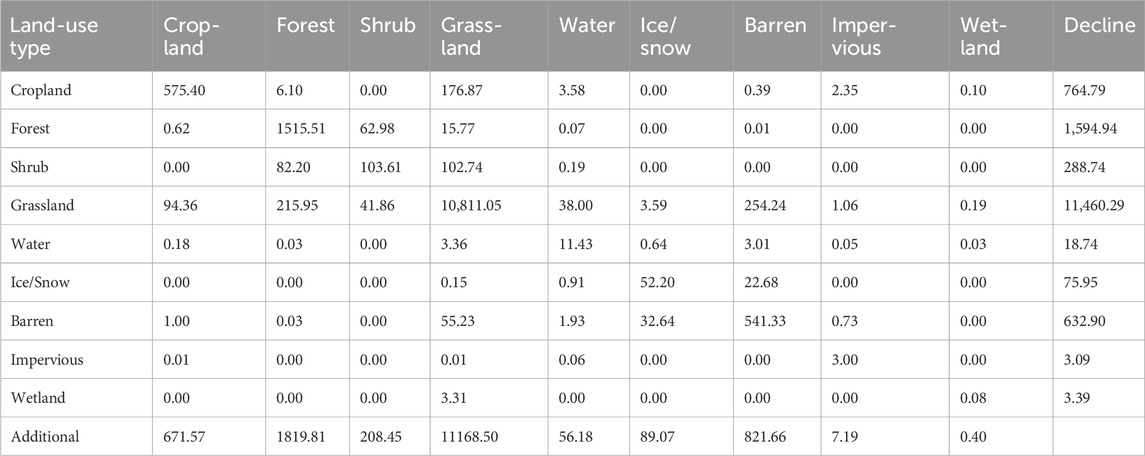
Table 4. The land use conversion matrix during the period of 1990–2020.
In summary, forest and bare land areas exhibited an increasing trend, primarily due to conversions from grassland. Cropland, grassland, and shrubland showed a decreasing trend, with cropland mainly converting to grassland, grassland primarily shifting to bare land and forest, and shrubland largely transitioning to grassland and forest. The expansion of urban areas was predominantly driven by conversions from cropland.
3.2.2 Spatial changes of land use types
For land use across different elevation ranges (Table 5), impervious surfaces were concentrated at the lowest elevations, primarily below 2,000 m. Cropland was mainly distributed between 2,000 m and 3,000 m (67.0%) with limited presence below 2,000 m. Forest is evenly distributed between 2,000 m and 4,000 m, while shrubland increased with elevation, primarily occurring between 3,000 m and 4,000 m (95.4%). Grassland similarly increased with elevation, with the largest proportion (68.8%) between 3,000 m and 4,000 m. Water bodies and wetlands were also mainly found in this range. Bare land and ice/snow were concentrated at the highest elevations, primarily between 4,000 m and 5,000 m (91.8% and 98.2%, respectively). Across all elevation zones, grassland occupied the largest area, especially above 3,000 m.
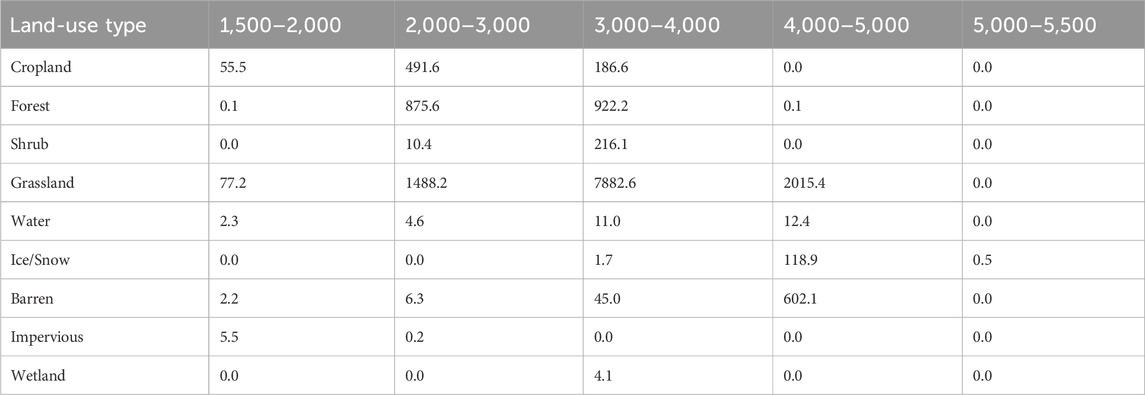
Table 5. The distribution of land use at different altitudes during the period of 1990–2020.
Figure 4 showed the changes in land use types across different elevation ranges. Between 1,500 m and 2,000 m, cropland demonstrated a notable increase after 2010, while the fastest decline occurred between 2,000 m and 3,000 m (−4.2 km2/year) (Figures 4a,b), contributing to the overall reduction of cropland (Figure 3a). Forest was distributed between 2,000 m and 4,000 m, showing an upward trend, with the 3,000–4,000 m range increasing more rapidly (4.3 km2/year) (Figure 4c), resulting in an overall increase in forest (Figure 3c). The elevation range of shrubland was consistent with forest, but with an opposite trend, showing declines in the elevation zones, particularly between 3,000 m and 4,000 m (−3.1 km2/year) (Figure 4c), leading to a reduction in shrubland. Impervious surfaces were concentrated below 2,000 m and exhibited a significant increasing trend (Figure 4a). Although water bodies covered a small area, they were present at all elevations below 5,000 m (not shown in Figures 4c,d, due to their minimal area compared to other types), with the highest concentrations above 3,000 m and an increasing trend across all zones. Ice/snow occupied the highest elevations, primarily above 4,000 m, with a slight upward trend (Figure 4d).
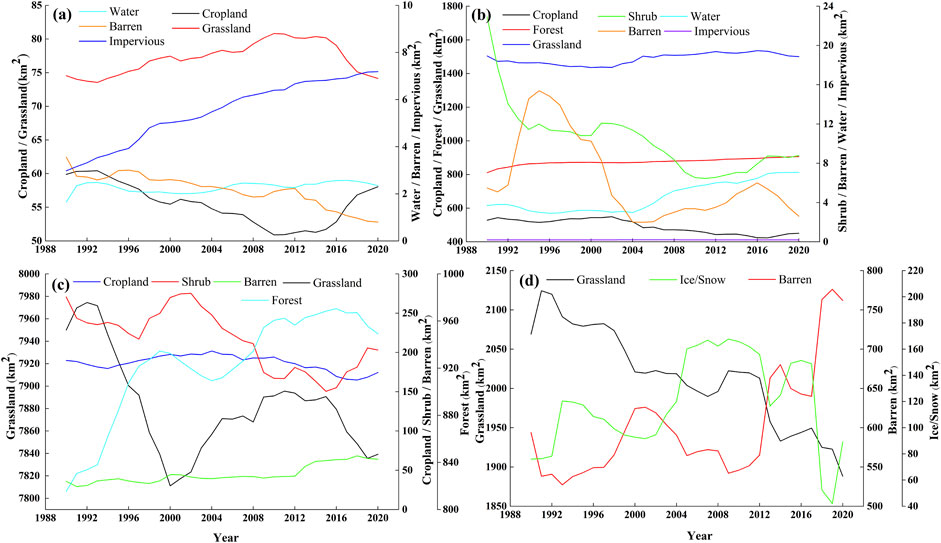
Figure 4. Inter-annual variability of each land-use type across altitude zones (a–d) represent the elevations of 1,500–2,000 m, 2,000–3,000 m, 3,000–4,000 m, 4,000–5,000 m, respectively.
Compared to other land use types, grassland and bare land have the broadest distribution across all elevation ranges. Grassland showed an increasing trend between 1,500–2,000 m and 2,000–3,000 m (0.1 and 2.6 km2/year), but a decreasing trend in the higher elevations of 3,000–4,000 m and 4,000–5,000 m (−2.5 and −6.4 km2/year) (Figures 4c,d), contributing to an overall reduction in grassland area (Figure 3c). Bare land had a smaller area and a decreasing trend between 1,500 m and 3,000 m, but it was more extensive and showed a significant increasing trend at 3,000–4,000 m and 4,000–5,000 m (1.1 and 5.3 km2/year) (Figures 4c,d), resulting in an increase in the basin (Figure 3a).
3.3 Attribution analysis of land use changes and their impact on NPP
3.3.1 Attribution analysis of land use change
Human activities are primarily concentrated in the lower mountainous areas (between 1,500 m and 3,000 m) in the basin. Grassland showed an increasing trend in low elevation areas (after 2000), particularly between 2,000 m and 3,000 m, largely influenced by conservation policies such as the “Green Gain” program (Yang and Huang, 2021). Cropland has been on a decreasing trend in the 2,000–3,000 m since 2005, due to policies like reforestation initiatives and the development of urbanization. Conversely, forest have increased in the 3,000–4,000 m since 2005, driven by reforestation efforts and the Green Gain initiative launched after 2000, contributing to the growth of forest. At the same time, shrubland in this elevation range showed the most significant decrease, influenced by these policies. In addition, this study takes population and GDP (Gross Domestic Product) as examples to analyze the influence of socioeconomic factors on land use types. As shown in Figure 4, impervious surfaces are mainly distributed in areas below 2000 m in elevation. Menyuan County is primarily located in the low-elevation region of the middle and eastern Daotong River Basin (Figure 1). Therefore, population and GDP data from Menyuan County were used to investigate the influence of socioeconomic factors on land use changes in low-altitude areas. From 2000 to 2020, the population of Menyuan County increased from 1.47 × 10² thousand in 2000 to 1.63 × 10² thousand in 2015, followed by a slight decline. Meanwhile, GDP rose from 3.76 × 10² million in 2000 to 37.2 × 10² million in 2016, and then slightly decreased (Figure 5). Correlation analysis (Table 6) revealed that bare land in low-altitude areas was significantly negatively correlated with both GDP and population. With population growth, bare land in these areas has been increasingly converted for urban and rural construction, leading to a decline in bare land. In contrast, impervious surfaces showed a significant positive correlation with population, as urban expansion driven by population growth increased built-up areas, along with associated economic benefits from the service and industrial sectors.
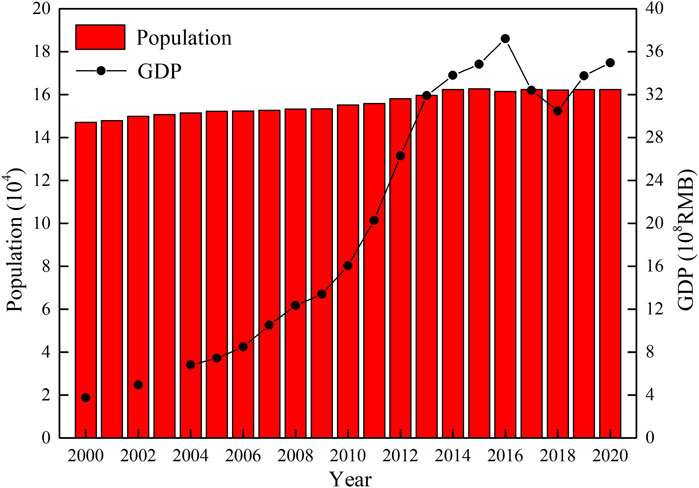
Figure 5. The distribution of GDP and population in Menyuan County from 2000 to 2020 (lack of economic data for 2001 and 2003).

Table 6. Correlations between GDP, population, and various land use types at elevations ranging during the period of 1990–2020.
Additionally, a partial correlation analysis between temperature, precipitation, and forest and shrubland areas at 3,000–4,000 m suggested that the rising temperatures correlated significantly with increased forest area at this elevation, showing a strong partial positive correlation, while shrubland showed a significant partial negative correlation, due to its preference for cooler conditions. The expansion of impervious surfaces was primarily attributed to economic growth and population increase.
In high-elevation areas (>3,000 m), where human influence was minimal, natural factors predominantly affect land use changes (Table 7). Grassland in the 3,000–4,000 m range decreased mainly due to the rising temperatures, showing a strong partial negative correlation. Between 4,000 m and 5,000 m, precipitation was the primary influencing factor, it showed the partial negative correlation. For bare land, temperature was the main controlling factor in high-elevation zones, with a significant partial positive correlation. Regarding water bodies, both temperature and precipitation exerted positive influences. This was primarily reflected in how variations in temperature and precipitation have altered permafrost and snowmelt processes, thereby influencing the changes in water body area. Ice and snow, primarily distributed above 4,000 m, were mainly influenced by precipitation. Increased precipitation, particularly snowfall, has led to the expanded ice/snow cover.
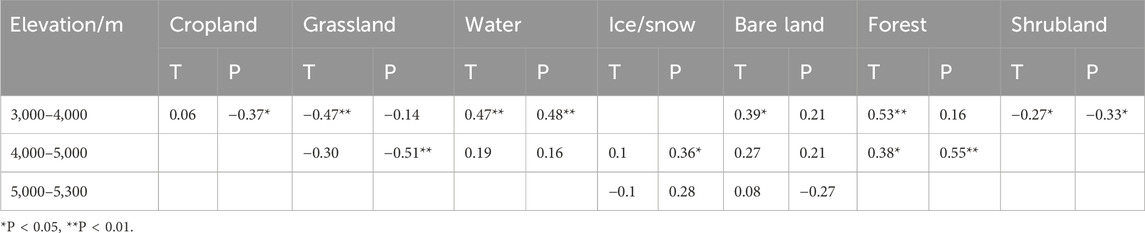
Table 7. Partial correlation of individual land-use types with temperature and precipitation in high-altitude zones.
3.3.2 The impact of land use changes on NPP
In time scale, the annual total value of NPP in DTRB showed a decreasing trend in fluctuation from 1990 to 2020 (r = −0.35), with the largest NPP value of 2.8 Tg C in 1990, the smallest of 2.2 Tg C in 2018, and a multi-year average of 2.5 Tg C. Overall, the NPP was at a low level in the basin, and the carbon sequestration capacity of the vegetation was gradually decreasing (Figure 6).
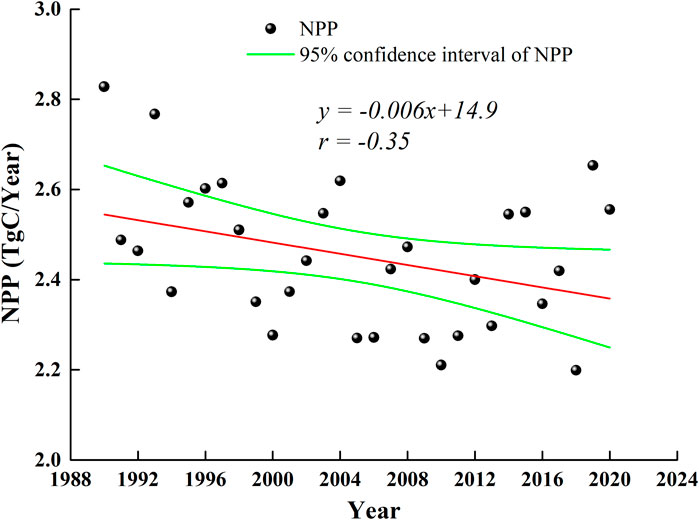
Figure 6. The inter-annual change of NPP in DTRB.
Spatially, the NPP of each raster in DTRB was mainly distributed from 45.7 to 324.0 g C·m-2·a−1, and the multi-year average NPP was about 167.0 g C·m-2·a−1 from 1990 to 2020. The multi-year average NPP gradually increased from northwest to southeast, with the southeast being the largest, mainly since forest was distributed in the southeast, which had a higher NPP than the other land use types. NPP was also larger in the center, mainly due to the distribution of cropland and forest. The northwest edge had the smallest NPP, mainly due to the distribution of bare land. The spatial change of NPP was analyzed using the MK method in the basin (the black-dotted part passed the significance test of 0.05), and the NPP decreased in the northwest and increased in the southeast, with a significant decrease in the northwest, which, combined with the transfer matrix analysis, revealed that the grassland distribution was the largest in the northwest and most of it was shifted to bare land (Table 4). NPP increased in the southeast, and forest was mainly distributed in the southeast. For forest, the area transferred to forest was 304. 3 km2, of which grassland accounted for 71.0%, and at the same time, forest was the second largest area transferred out of grassland (33.3%), and grassland was mainly transferred to forest in the southeast region, so the NPP showed an increasing trend (Figures 7a,b).
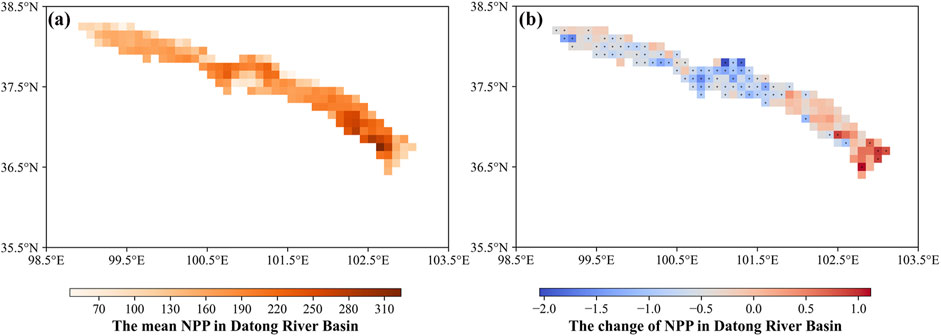
Figure 7. The Spatial distribution and changes in NPP in DTRB (a) represents the mean NPP in DTRB; (b) represents the change of NPP in DTRB.
Based on a controlled experiment, we used land use data from 1990 as input and held land use constant while allowing climate variables to vary normally. By subtracting the NPP simulated under constant land use (with varying climate factors) from the NPP simulated under both changing land use and climate conditions, we found that the former accumulated 0.34 TgC less NPP than the latter over the period from 1990 to 2020. This result indirectly indicated that land use change has contributed to a reduction in watershed NPP.
4 Discussion
4.1 Contrasting human and natural drivers of land use change in different areas
Driven by climate change and human activities, land use types in various regions have changed to varying extents. However, the drivers of land use changes differ across areas. Yang et al. (2022) found that forest and built-up land areas increased while water bodies and unused land areas decreased in Mu Us Sandland. Land use changes influenced by natural and human factors accounted for 27.92% and 10.63% of the total area, respectively. Human factors predominantly drove changes in cropland, forest, and built-up areas, while natural factors mainly led to the reduction of water bodies and unused land. In urban areas, land use changes were primarily driven by human factors. Since the 20th century, the urban areas have seen a decrease in cropland and an increase in built-up areas, with suburban lands increasingly converted to construction sites, resulting in higher landscape fragmentation due to rapid urbanization. However, green spaces within urban developments have expanded, with ecological land types (such as forests, grasslands, and wetlands) also increasing in proportion (Feng et al., 2018; Wang et al., 2018). This expansion has been supported by urbanization initiatives aimed at enhancing urban habitat quality, including projects like sponge cities, green patches, and post-demolition greening. In this study, land use changes were primarily directed by natural factors, especially in high-altitude watersheds.
Figure 8 showed the changes in temperature and precipitation at each altitude zones. The precipitation increased with altitude. However, temperature was opposite. Both them increased at a faster rate from 1990 to 2020, especially in high altitude. Low-altitude mountainous regions primarily referred to areas below 3,000 m, with impermeable surfaces predominantly located below this elevation, particularly between 1,500 and 2,000 m (97.3%). The DTRB spans eight counties and cities. Agricultural and pastoral activities were prevalent. For instance, Menyuan county located in the middle reaches of the Datong River, 155,900 residents are engaged in farming and herding (82.2% of the total population), primarily cultivating barley and raising grazing livestock such as cattle and sheep. Therefore, in low-altitude areas, extensive grasslands and croplands were significantly influenced by human activities, with minimal constraints from natural factors. Consequently, land use changes in low-altitude regions were predominantly driven by human activities.
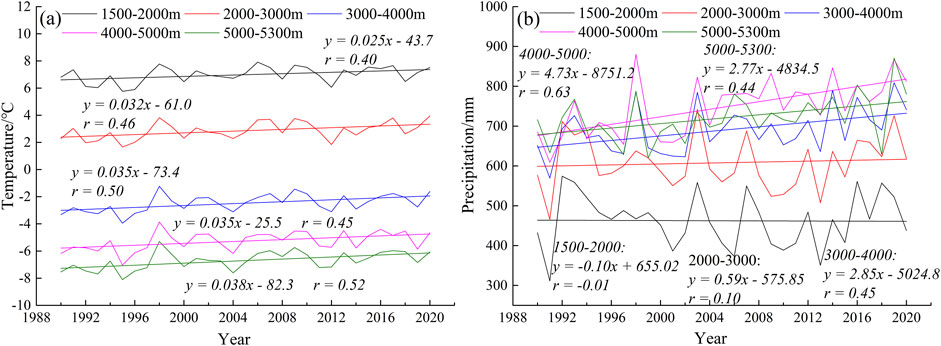
Figure 8. The changes in temperature and precipitation at each altitude in DTRB (a,b) represent the interannual variation of temperature and precipitation at different elevations.
However, human activities were sparse above 3,000 m. Grassland exhibited a partial negative correlation with temperature between 3,000 and 4,000 m. This is primarily because temperature raised faster in this elevation range compared to lower altitudes (Figure 8a), leading to increased evapotranspiration and reduced water availability for vegetation. Consequently, grassland has decreased in this zone. Between 4,000 and 5,000 m, the rate of temperature increase was similar to that between 3,000 and 4,000 m, but precipitation is higher and exhibits the fastest increase across all altitudes (4.7 mm/year). Additionally, slope steepness intensifies with elevation, and this zone has a high average slope (20.4°) (Table 3). These conditions exacerbated soil erosion, resulting in a significant reduction in grassland area within this elevation range, thus the precipitation showed a partial negative. Shen et al. (2017) reported that in DTRB, areas with slopes exceeding 20° experienced moderate and severe erosion rates of 19.7% and 50.2%, respectively, underscoring the severity of soil erosion in this elevation range. Bare land showed a partial positive correlation with temperature. The rising temperature between 3,000 and 4,000 m increased soil moisture dissipation, leading to an expansion of bare land. Water bodies were partial positively correlated with both temperature and precipitation. In high-altitude regions, precipitation showed a consistent increasing trend (Figure 8b), leading to an expansion in water body area. Furthermore, widespread permafrost in high-altitude zones was experiencing significant warming (Figure 8a), resulting in permafrost degradation, increased active layer thickness, enhanced soil water retention, and improved connectivity. These factors collectively contributed to the increased water supply to lakes and other water bodies, expanding their area. Snow and ice showed a partial positive correlation with precipitation. Above 4,000 m, the high precipitation levels and the fastest rate of increase derived a trend of expanding snow and ice cover in this elevation zone, with snow/ice change rates reaching 1.0 km2/year. Therefore, land use changes were predominantly governed by natural factors such as temperature, precipitation, slope, and permafrost dynamics in high-altitude regions.
In this study, the correlations between the area of land use and temperature and precipitation were relatively low, but all passed significance tests. The low correlations are mainly attributed to data accuracy and the complexity of land use change. The study employed monthly temperature and precipitation data from the ERA5-Land reanalysis product. However, due to the limited availability of ground-based observations, inaccuracies in satellite-derived data, and the interpolation methods used, the precision of the meteorological data may have been affected. Similarly, the accuracy of land use data is also influenced by the inversion algorithms and the quality of training samples, which can introduce uncertainty in the area estimates for different land use types. Moreover, land use changes were driven by multiple factors beyond temperature and precipitation in the high-altitude regions of the Qilian Mountains, including soil physicochemical properties and topographic conditions (Al-Sababhah, 2024), which further weakens the observed correlations.
4.2 Comparing the ecological effect of land use changes with prior studies
Land use changes can lead to varying hydrological and ecological effects. In terms of hydrological processes, these impacts are evident in some aspects such as evapotranspiration and surface runoff (Jin et al., 2021; Guédé et al., 2024). The ecological effects of land use changes were reflected in some aspects such as carbon storage and net primary productivity (NPP) of vegetation. Land use changes, such as increased cropland and water areas coupled with reductions in grassland and unused land, have led to an upward trend in NPP in the Hexi region of the Qilian Mountains. In the Shule River Basin, the total annual NPP showed an overall increase from 2001 to 2015, though land use changes between 2010 and 2015 resulted in a 6.9 Tg C decrease in NPP. Similarly, land use changes in the Ordos region contributed to an increase in NPP over the same period (Liu et al., 2024). In contrast, this study found a decreasing trend in NPP in DTRB from 1990 to 2020. This decrease was mainly due to grassland, which constitutes approximately 76.2% of the basin, showing a downward trend, alongside an increase in bare land, leading to a reduction in NPP. Additionally, the extended study period, beginning in 1990, revealed that grassland area was at its peak and the NPP was large in the late 20th century. Uncertainties in the structure and input parameters of the CASA model may also contribute to these findings that differed from other regions. Future research could further investigate the impact of both natural and anthropogenic factors on land use change under different climate scenarios. By integrating the CASA model, it could analyze the changes in NPP under various emission scenarios, offering recommendations for the high-quality development of human society and promoting harmonious development between humans and nature.
5 Conclusion
This study analyzed the spatial and temporal characteristics of land use changes using the annual land use data, attributed these changes to human activities and natural factors, and employed the CASA model to clarify the impact of land use changes on vegetation net primary productivity (NPP). The main conclusions are as follows:
(1) The grassland was largest, followed by forest, cropland, bare land, shrubland, ice/snow, and water bodies in DTRB. Grasslands were predominantly found in the northwest, while the southeast had the less coverage. Forest areas were mainly concentrated in the southeast, with cropland in the central region. Bare land was more dispersed, particularly along the central and western edges. Ice/snow areas were adjacent to bare land, primarily on the northern edge and the impervious surface areas were located downstream. Overall, the comprehensive degree of land use was relatively low. Between 1990 and 2020, cropland was decreased, largely due to reductions in areas at altitudes between 2,000 m and 3,000 m. Grassland and shrubland also were decreased, primarily in areas between 4,000 m and 5,000 m for grasslands and 3,000 m and 4,000 m for shrubland. In contrast, forest and bare land expanded, attributed to the increase in forest between 3,000 m and 4,000 m and bare land between 4,000 m and 5,000 m. The overall land use intensity showed a marked decreasing trend, with a change rate of −2.03, indicating a period of decline. The comprehensive dynamic degree of land use was minimal, at 0.10%, suggesting limited land use type conversion during the study period.
(2) Based on the land use transfer matrix analysis, the conversion occurred among the different land use types in DTRB from 1990 to 2020. Cropland primarily transferred out, with grasslands accounting for 93.3%. Grasslands also experienced significant conversion, with 39.2% turning into bare land and 33.3% into forest. Shrubland primarily transferred out as well, with 55.5% turning into grassland. Forest mainly gained area, with 71% of its increase coming from grassland, while bare land similarly saw a net gain, with 90.7% derived from grassland. Impervious surfaces, heavily influenced by human activities, largely expanded through the conversion of cropland and grassland. At lower altitudes (1,500–3,000 m), human activities played a significant role. Under the “Green Gain” conservation policy, grassland areas increased. Additionally, policies such as the reforestation initiatives led to a decrease in cropland, while forest expanded. The correlation analysis indicated that bare land exhibited a significant negative correlation with GDP and population, while impervious surfaces were positively correlated in low elevation regions. In higher altitudes (above 3,000 m), natural factors were more influential. Grassland showed a significant partial negative correlation with precipitation at 4,000–5,000 m. Bare land exhibited a positive correlation with temperature, while water bodies were positively correlated with both temperature and precipitation. Ice/snow areas, on the other hand, had a partial positive correlation with precipitation.
(3) The ecological effects of land use changes. The multi-year average NPP was approximately 167.0 gC·m−2·a−1 from 1990 to 2020, showing a gradual increase from the northwest to the southeast. The lowest NPP values were found along the northwest edge, largely due to the extensive distribution of bae land. In contrast, the highest NPP values were in the southeastern region, attributed to the prevalence of forest. Spatially, NPP showed a decline in the northwest, where grasslands dominated and were increasingly converted to bare land. Conversely, the southeastern region showed an upward trend in NPP as grasslands were converted to forest, resulting in an increase in NPP. Overall, the total NPP for the basin exhibited a decreasing trend.
Data availability statement
The original contributions presented in the study are included in the article/supplementary material, further inquiries can be directed to the corresponding author.
Author contributions
ZL: Conceptualization, Funding acquisition, Writing – original draft, Writing – review and editing. XQ: Funding acquisition, Investigation, Resources, Writing – review and editing. YL: Data curation, Software, Writing – review and editing. ZJ: Conceptualization, Funding acquisition, Methodology, Visualization, Writing – review and editing.
Funding
The author(s) declare that financial support was received for the research and/or publication of this article. Science and Technology Innovation Project of Gansu Provincial Department of Natural Resources (No. 202212); Shanxi Province Basic Research Program (Free Exploration Category) Youth Project (202403021212316); Science and Technology Innovation Program for Universities in Shanxi Province (2024L327).
Conflict of interest
The authors declare that the research was conducted in the absence of any commercial or financial relationships that could be construed as a potential conflict of interest.
Generative AI statement
The author(s) declare that no Generative AI was used in the creation of this manuscript.
Publisher’s note
All claims expressed in this article are solely those of the authors and do not necessarily represent those of their affiliated organizations, or those of the publisher, the editors and the reviewers. Any product that may be evaluated in this article, or claim that may be made by its manufacturer, is not guaranteed or endorsed by the publisher.
References
Al-Sababhah, N. (2024). Land suitability and capability analysis for sustainable allocation of agricultural crops and natural plants, northwest Jordan. J. Geovisualization Spatial Analysis 8 (1), 1. doi:10.1007/s41651-023-00150-4
Cheng, F., Liu, S., Zhang, Y. Q., Yin, Y. J., and Hou, X. Y. (2017). Effects of land-use change on net primary productivity in Beijing based on the MODIS series. Acta Ecol. Sin. 37 (18), 5924–5934. doi:10.5846/stxb201606301342
El-Beltagy, A., and Madkour, M. (2012). Impact of climate change on arid lands agriculture. Agric. Food Secur. 1, 3–12. doi:10.1186/2048-7010-1-3
Feng, S., Sun, R., and Chen, L. (2018). Spatio-temporal variability of habitat quality based on land use pattern change in Beijing. Acta Ecol. Sin. 38 (12), 4167–4179. doi:10.5846/stxb201801310258
Ferranto, S. P., Huntsinger, L., Getz, C., Nakamura, G., Stewart, W., Drill, S., et al. (2011). Forest and rangeland owners value land for natural amenities and as financial investment. Calif. Agric. 65 (4), 184–191. doi:10.3733/ca.v065n04p184
Grekousis, G., Mountrakis, G., and Kavouras, M. (2015). An overview of 21 global and 43 regional land-cover mapping products. Int. J. Remote Sens. 36 (21), 5309–5335. doi:10.1080/01431161.2015.1093195
Guédé, K. G., Yu, Z., Gu, H., Badji, O., Ahmed, N., Sika, B., et al. (2024). Sensitivities of hydrological processes under climate warming and Landuse/landcover change in the Lhasa basin, Tibetan plateau. J. Hydrology Regional Stud. 52, 101731. doi:10.1016/j.ejrh.2024.101731
Han, X., Yang, G., Qin, F. C., Jia, G. P., Ling, X., and Gao, G. (2019). Spatial and temporal dynamic patterns of sandy land in Mu Us in the last 30 years. Res. Soil Water Conserv. 26 (5), 144–150. doi:10.1038/s41598-020-78665-9
He, Y., Yao, Y., Tang, H., Chen, Y., Chen, Z., Yang, P., et al. (2013). An overview on progress of land use and land cover change dynamics. Chin. Agric. Sci. Bull. 29, 190–195. doi:10.1007/s11434-013-5902-3
Hu, C., Zhang, L., Wu, Q., Soomro, S. E. H., and Jian, S. (2020). Response of LUCC on runoff generation process in middle Yellow River Basin: the Gushanchuan basin. Water 12 (5), 1237. doi:10.3390/w12051237
Januchowski-Hartley, S. R., Holtz, L. A., Martinuzzi, S., McIntyre, P. B., Radeloff, V. C., and Pracheil, B. M. (2016). Future land use threats to range-restricted fish species in the United States. Divers. Distributions 22 (6), 663–671. doi:10.1111/ddi.12431
Jiang, C., Wu, Z. F., Cheng, J., and Qian, L. X. (2016). Analyzing the effects of land cover change on vegetation net primary productivity in Guangdong Province. J. Nat. Resour. 31 (6), 961–972. doi:10.11849/zrzyxb.20150499
Jin, Z., Zhao, Q., Qin, X., Zhang, J., Zhang, H., Qin, J., et al. (2021). Quantifying the impact of landscape changes on hydrological variables in the alpine and cold region using hydrological model and remote sensing data. Hydrol. Process. 35 (10), e14392. doi:10.1002/hyp.14392
Lee, G. F. (2009). Issues in regulating water quality impacts from irrigated agricultural runoff and discharges in the central valley of California.
Li, W., Feng, T., and Hao, J. (2009). The evolving concepts of land administration in China: cultivated land protection perspective. Land Use Policy 26 (2), 262–272. doi:10.1016/j.landusepol.2008.02.008
Liu, J., Zhang, Z., Xu, X., Kuang, W., Zhou, W., Zhang, S., et al. (2010). Spatial patterns and driving forces of land use change in China during the early 21st century. J. Geogr. Sci. 20, 483–494. doi:10.1007/s11442-010-0483-4
Liu, S., Wang, Y., Liu, D., and Xie, Y. (2015). Research on temporal and spatial distribution of climate dry-wet status in Datong River basin. J. Water Resour. Water Eng., 26(04), 108–114. doi:10.11705/j.issn.1672-643X
Liu, Y., Yao, X., Li, Z., and Hu, J. (2024). Impacts of climate change and land use/cover change on the net primary productivity of vegetation in Hexi Region, Northwest China. Arid Zone Res. 41 (1), 169–180. doi:10.13866/j.azr.2024.01.16
Perrone, D., and Jasechko, S. (2017). Dry groundwater wells in the western United States. Environ. Res. Lett. 12 (10), 104002. doi:10.1088/1748-9326/aa8ac0
Scanlon, B. R., Reedy, R. C., Stonestrom, D. A., Prudic, D. E., and Dennehy, K. F. (2005). Impact of land use and land cover change on groundwater recharge and quality in the southwestern US. Glob. Change Biol. 11 (10), 1577–1593. doi:10.1111/j.1365-2486.2005.01026.x
Shen, C., Wan, D., Yin, H., Yang, L., and Zhou, H. (2017). Study on estimating soil erosion in Datong River Basin based on RUSLE. Hubei Agric. Sci., 56(8):1453–1457. doi:10.14088/j.cnki.issn0439-8114
Sleeter, B. M. (2008). Late 20th century land change in the central California valley ecoregion. Calif. Geogr. 48, 27–60. doi:10.3133/pp1794a17
Stonestrom, D. A., Scanlon, B. R., and Zhang, L. (2009). Introduction to special section on impacts of land use change on water resources. Water Resour. Res. 45 (7). doi:10.1029/2009wr007937
Uhrqvist, O., and Lövbrand, E. (2014). Rendering global change problematic: the constitutive effects of Earth System research in the IGBP and the IHDP. Environ. Polit. 23 (2), 339–356. doi:10.1080/09644016.2013.835964
Wang, J., Lin, Y., Zhai, T., He, T., Qi, Y., Jin, Z., et al. (2018). The role of human activity in decreasing ecologically sound land use in C hina. Land Degrad. Dev. 29 (3), 446–460. doi:10.1002/ldr.2874
Wang, J. H., Liang, L., Huang, T., Luo, X., and Lin, H. (2018). Land use change and ecological effects in downtown Xuzhou city. Bull. Soil Water Conserv. 38, 113–120. doi:10.13961/j.cnki.stbctb
Wang, Y. H., Xia, P., Liu, Z. F., Lu, W. L., and He, C. Y. (2019). Research progress of urban land use/cover change in the oasis cities of China. Arid Land. Geogr. 42, 341–353. doi:10.12118/j.issn.1000-6060
Williams, A. P., Seager, R., Abatzoglou, J. T., Cook, B. I., Smerdon, J. E., and Cook, E. R. (2015). Contribution of anthropogenic warming to California drought during 2012–2014. Geophys. Res. Lett. 42 (16), 6819–6828. doi:10.1002/2015gl064924
Xu, N. Y., Guo, L., Xue, D. Y., and Sun, S. Q. (2019). Land use structure and the dynamic evolution of ecosystem service value in Gannan region, China. Acta Ecol. Sin. 39, 1969–1978. doi:10.5846/stxb201801150117
Xue, C. Y., Jiao, F., Zhang, H. D., and Ru, H. L. (2016). The characteristics of plant species and soil quality in the restoration process of the Loess Hilly Region. Pratacult. Sci. 33, 368–376. doi:10.11829/j.issn.1001-0629.2015-0428
Yang, J., and Huang, X. (2021). 30 m annual land cover and its dynamics in China from 1990 to 2019. Earth Syst. Sci. Data Discuss. 2021, 1–29. doi:10.5194/essd-13-3907-2021
Yang, L., Sun, Z., Li, J., Shi, L., Kong, H., Yang, Y., et al. (2022). Spatiotemporal patterns and driving forces of land-use and land-cover change in the Mu Us Sandy Land, China from 1980 to 2018. Arid Land Res. Manag. 36 (1), 109–124. doi:10.1080/15324982.2021.1933648
Keywords: Datong River basin, climate change, human activity, land use change, net primary productivity of vegetation
Citation: Li Z, Qin X, Liu Y and Jin Z (2025) Analysis of characteristics of land use change and its ecological effects in the Datong River Basin. Front. Environ. Sci. 13:1590880. doi: 10.3389/fenvs.2025.1590880
Received: 10 March 2025; Accepted: 03 June 2025;
Published: 18 June 2025.
Edited by:
Shailesh Kumar Singh, National Institute of Water and Atmospheric Research (NIWA), New ZealandReviewed by:
Chunhui Li, Beijing Normal University, ChinaLeichao Bai, China West Normal University, China
Copyright © 2025 Li, Qin, Liu and Jin. This is an open-access article distributed under the terms of the Creative Commons Attribution License (CC BY). The use, distribution or reproduction in other forums is permitted, provided the original author(s) and the copyright owner(s) are credited and that the original publication in this journal is cited, in accordance with accepted academic practice. No use, distribution or reproduction is permitted which does not comply with these terms.
*Correspondence: Zizhen Jin, amlueml6aGVuQGx6Yi5hYy5jbg==