 Guanqiu Liu1
 Hao Zhang
 Xinhua Qi
- 1College of Urban and Environmental Sciences, Peking University, Beijing, China
- 2Power China Guiyang Engineering Corporation Limited, Guiyang, China
- 3State Key Laboratory for Subtropical Mountain Ecology of the Ministry of Science and Technology and Fujian Province, Fujian Normal University, Fuzhou, Fujian, China
- 4Institute of Geography, Fujian Normal University, Fuzhou, Fujian, China
Introduction: Dockless bike-sharing systems have become popular in urban China. However, how dockless bike-sharing influence users’ daily travel choices has rarely been investigated.
Methods: Drawing upon travel-related data collected by the day reconstruction method in Fuzhou, this study explores whether and how the mode shift caused by dockless bike-sharing reduces the carbon emission effect in different scenarios.
Results: The results show that the mode proportion varied before and after the introduction of dockless bike-sharing and affected by travel distance. The carbon emission reduction effect of shared bikes shows an inverted U-shape with the increase of distance, with the carbon emission reduction gain from the medium-distance travel group of 3-5 km being the largest. The unit carbon emission reduction coefficient presents an inverted U-shape rather than a linear rise with distance. The annual personal carbon emission reduction of dockless bike-sharing users is 4,312.42 g and the total in Fuzhou is 33.03 Mt per year.
Discussion: These findings indicate that a improve of the city’s fast cycling lane system can promote the travel mobility and efficiency in the central downtown area.
1 Introduction
As defined by the SAE International standard J3163, shared bikes are categorized into two primary systems: dock-based bike-sharing (DBBS) and dockless bike-sharing (DLBS), also known as station-based and free-floating bike-sharing, respectively (SAE International, 2018). The key distinction between these two systems lies in the presence or absence of fixed docking stations. DLBS enables users to rent and return bicycles flexibly at any location through the integration of smartphone applications (Pal and Zhang, 2017). Representing an emerging mode of urban mobility, DLBS has experienced significant growth in adoption and has rapidly expanded across major metropolitan areas in countries such as France, Germany, Singapore, the United States, and China (Reiss and Bogenberger, 2015; Zamir et al., 2019).
DLBS was first introduced in China in 2016 and rapidly gained traction with the infusion of social capital, reaching peak utilization by late 2017. It has since become the dominant mode within the public bicycle service sector, effectively replacing traditional DBBS. According to statistics from the Ministry of Transport of China (2020), approximately 20 million shared bikes have been deployed across more than 360 cities, covering 60% of the country’s area, with an average of 45.7 million daily orders. Despite its rapid proliferation, the exponential growth and oversaturation of DLBS have presented new challenges for urban traffic management and spatial resource allocation, including issues such as low utilization rates and the over-occupation of public spaces. Nevertheless, bike-sharing has emerged as a critical mode of transportation for urban residents, fostering intermodal connectivity and advancing sustainable urban mobility (Link et al., 2020).
Additionally, carbon emissions have become a global crisis because they are a driver of climate change. Recognizing its role as a significant global power, China demonstrated its commitment to addressing this challenge by pledging in a joint climate statement with the United States in November 2014 to peak carbon emissions around 2030 and achieve carbon neutrality by 2060. The transportation sector, particularly in urban areas, is the fastest-growing contributor to energy consumption and CO2 emissions worldwide (Yan and Crookes, 2009). In this context, the emergence of bike-sharing systems has the potential to bolster international confidence in China’s capacity to mitigate carbon emissions. This is attributed to the environmentally friendly nature of bike-sharing (Carrus et al., 2008) and the modal shift it promotes, which generates substantial environmental benefits (Tao and Zhou, 2021).
DLBS facilitates the evolution of urban transportation systems and contributes to the restructuring of urban carbon emission profiles. While prior research has offered initial evaluations of the environmental impacts associated with the development of bike-sharing from various perspectives, significant knowledge gaps persist. Numerous studies have explored the potential environmental benefits of bike-sharing, particularly in the domains of energy efficiency and resource utilization (Jie et al., 2020; Tao and Zhou, 2021). However, research examining the relationship between carbon reduction outcomes and transportation mode shifts remains relatively sparse, especially with regard to empirical investigations focused on mode shifts induced by DLBS. Although certain studies have employed big data algorithms to infer alternative transportation modes potentially replaced by DLBS in specific scenarios (Li et al., 2021), or have used the existing traffic structure as a proxy for substitution ratios, these approaches do not rely on the actual travel behavior data of DLBS users. Furthermore, most analyses of the carbon reduction effects of DLBS adopt a lifecycle perspective for individual shared bikes or a regional bike-sharing system (Ding et al., 2021), thereby limiting the ability to perform quantitative comparisons across cities or countries.
To fill this gap in the literature, in our study, we aim to gain insights into the riding characteristics and travel pattern transforming of DLBS users based on the questionnaire survey data of users, and try to propose a new approach from user perspective to calculate the carbon emission reduction effect caused by DLBS, whose result is more accurate but comparable to those from the bicycle system in the literature.
The remainder of this paper is organized as follows. In Section 2, we review the literature related to riders’ behavioral patterns and the carbon reduction effect. Section 3 introduces the research data and methodology used in the empirical analysis. Section 4 provides a detailed analysis of the behavioral characteristics and trip chain of bike-sharing users. In addition, the potential environmental effects of DLBS under various scenarios are calculated. Section 5 and 6 present the discussion, conclusions, and limitations.
2 Literature review
2.1 Behavior and travel pattern of shared bike users
Behavior patterns of bike-sharing users have raised considerable concerns worldwide. Studies have mainly focused on users’ personal characteristics (Chen et al., 2020a; Zamir et al., 2019) and usage patterns (Link et al., 2020; Wei et al., 2021), including the travel speed and time, usage types, and spatial structure of bike-sharing trips (Link et al., 2020; Zhang et al., 2017). In addition, some studies have discussed factors affecting users’ behaviors (Shen et al., 2018), as well as the benefits of and problems caused by bike-sharing (Tao and Zhou, 2021).
Regarding user characteristics, studies have found that younger individuals or those with a high education level and high income usually show an inclination for shared bikes (Hirsch et al., 2019; Li et al., 2018). Evidence suggested that individuals who used to travel by private bicycles, buses, and rail transit have a higher probability of traveling by a dockless shared bike than those who used to travel by electric bikes (Tang et al., 2017).
As for usage pattern, studies have also investigated usage features from the perspective of different levels (Zhang et al., 2017): at the individual level, the average riding frequency was between 15 and 75 times per month, and 70% of users rode dockless shared bikes at least once per day; at the system level, each bike was used 4.5 times per day; and the average overall utilization of DLBS was approximately 50% (Chen et al., 2020b; Xing et al., 2020). Most studies have shown that shared bikes are consistently used for short-distance travel of less than 3 km (Ai et al., 2019; Link et al., 2020; Zhang and Mi, 2018), and a few studies have posited that shared bikes are more attractive for long-distance travel than private bicycles (Li et al., 2019). For travel time, the travel peak was higher in the morning than in the evening on weekdays; however, the situation was the opposite on weekends (Wei et al., 2021). As for riding purposes, the routes were more varied for leisure activities (e.g., shopping) (Wergin and Buehler, 2017), with a longer average distance and duration, than for trips for specific necessary purposes (Xing et al., 2020).
Recent studies have attempted to explore the travel behavior and patterns of users of bike-sharing systems and the main influence factors using data mining and visualization with big data support from bike-sharing companies (Xing et al., 2020). However, a serious limitation in these studies is that riding purposes are always speculations rather than the real intentions of participants, which are inferred from nearby POIs. Introducing the trip chain is a good way to understand the travel behavior of a bike-sharing user because of the combination of user information and trip information. The trip chain pertains to the daily travel in 1 day composing of several travel activities. Due to different type of transportation utilized in each journey, the trip chain should encompass all the transportation modes commonly used in daily life. At present, studies that have provided insights into the usage and role of DLBS within different urban backgrounds can be classified into two categories: user survey-based studies and trip-based studies. The former can obtain more information about individual attributes and habits, but it lacks space-time information for trips and the sample capacity is limited. The latter has a large amount of data, but the information is fragmented, which ignores a large amount of useful details, such as travel purpose, and the sequence of consecutive trips within a trip chain. Besides, there is evidence that the effect of travel purpose on other factors is critical in the trip chain (Tang et al., 2017).
However, as most studies have been conducted on DBBS, less attention has been paid to DLBS. Although the two types of bike-sharing systems have many similar features, such as cycling peak, duration, and distance (Fishman et al., 2014; Zamir et al., 2019), they differ in some aspects. For example, DBBS is consistently used in inflexible travel activities, such as commuting trips, and DLBS is mainly used for flexible purposes, such as leisure (Li et al., 2019; Zamir et al., 2019). Additionally, studies that have provided insights into the usage and role of DLBS within different urban backgrounds can be classified into two categories: user survey-based studies and trip-based studies. The former can obtain more information about individual attributes and habits, but it lacks space-time information for trips and the sample capacity is limited. The latter has a large amount of data, but the information is fragmented, which ignores a large amount of useful details, such as travel purpose, and the sequence of consecutive trips within a trip chain. Notably, the trip chain is essential for understanding the travel behavior of a bike-sharing user because of the combination of user information and trip information. For example, Zhang et al. investigated a sequence of DBBS trips made by the same user on the same day in Zhongshan, China (Zhang et al., 2018), and Raux et al. found that DBBS users are multimodal in their day-to-day travel behavior and that shared bikes are used by them in different travel patterns (Raux et al., 2017). However, as few studies have been conducted on DLBS, this study on DLBS is necessary.
2.2 Carbon emission reduction effect of shared bikes
From the perspective of carbon emission reduction, previous studies have provided evidence that the total environmental benefits of DLBS are positive in both low- and high-utilization cases (Tao and Zhou, 2021). There are different methods to measure the carbon reduction emission effects of DLBS. Chen et al. calculated the whole life cycle carbon footprint of one bike as 34.56 kg CO2 according to the Life Cycle Analysis (LCA) theory (Chen et al., 2020a); Li et al. calculated that one bike-sharing trip could reduce approximately 80.77 g CO2-eq per distance travelled in greenhouse gas emissions (Li et al., 2021), and Sun et al. compared the quantity of reduced carbon emissions due to DLBS between railway stations in Beijing (Sun et al., 2020). However, the conclusions of the studies on environmental benefits produced by DLBS differ substantially and are difficult to compare. Aggregated greenhouse gas emission reductions caused by DLBS mainly depend on the following aspects: average trip distances, transportation mode shifts, DLBS ridership, and the built environment, which can influence the first three aspects (Li et al., 2021; Tao and Zhou, 2021).
However, several controversies remain in this area of study. The first disputed point is the transportation modes substituted by a bike-sharing trip, because this aspect strongly depends on travel contexts (e.g., population density, land use entropy, metro station density, and transit networks) (Abdulrazzaq et al., 2020; Gao et al., 2021; Kou et al., 2020) and individual characteristics (Fukushige et al., 2021), and has substantial spatial–temporal variances (Li et al., 2021). Empirical evidence has revealed that mode shifts after the appearance of the bike-sharing are also uncertain. Some studies have found that bike-sharing mainly replaces public transportation and walking or are substitutes for private bicycles, not for private motorized means of transportation (Link et al., 2020; Tang et al., 2017; Zhang et al., 2017). Other studies have found that nearly half the trips by shared bikes were originally intended to be by car, and the remainder were planned to be by bus, using a bike, or walking (Barbour et al., 2019). Moreover, the proportion of each mode of transportation varied with distance. For example, the proportion of walking a short distance is higher than that for a long distance, and the proportion of private cars over a long distance is higher than that over a short distance. Substitution rates of bicycles for different transportation modes change as the travel distance increases, and the functional unit of the carbon reduction coefficient for transporting one passenger for 1 km probably fluctuates.
In summary, the usage patterns of bike-sharing users depend on the city scale, the city layout, individuals’ lifestyles, and the bike-sharing system scale (Du et al., 2019; Kou and Cai, 2019), and the carbon reduction emission effect of bike-sharing programs is based on riders’ behavioral characteristics, which vary by city (Kou et al., 2020). The second disputed point is whether a carbon reduction effect occurs when shared bikes replace other types of transportation modes. For example, Chen et al., indicated that bus and rail carbon emissions will not decrease with reduced passenger flow because of the fixed public transportation schedule (Chen et al., 2020b). Other debates are related to whether shared bikes could be regard as a zero carbon emission mode when they replace walking or private bicycles. The third disputed point is how to get the accurate mode shift data. Existing literature only considered effect on mode substitution of DLBS, actually connection effect of DLBS in the whole traffic network can also promote the mode shifts. Most studies have mainly emphasized the alternative choice of shared bike users if a shared bike was not available for this trip, which is an individual-level hypothetical situation and tends to result in structured errors. Although some scholars have used the calibrated mixed logit model to construct a reference preference scenario to predict the probabilities of choosing certain types of transportation modes if there were no DLBS (Li et al., 2021), this result is still assumed and estimated by machine learning rather than the reality. These disputes concerning the carbon reduction emission effect require further case studies.
2.3 Research design and framework
A reasonable estimation of the impact of DLBS on the structure of the entire transportation system is an important part of the estimation of its emission reduction effect. DLBS bridges the gaps in existing transportation networks and encourages residents to use multiple transportation modes (Ai et al., 2019; Link et al., 2020), although no evidence has been presented on how DLBS increases mobility and substitute travel modes. On the one hand, in the literature, all the substituted effects are usually attributed to the introduction of shared bikes (Ding et al., 2021). Notably, DLBS can promote some transportation modes that directly shift into other types through connecting and transferring roles. On the other hand, most studies have used the estimated data of the substitution rates of DLBS for other transportation modes (Li et al., 2021; Luo et al., 2019), and no reliable, accurate data based on individuals’ choices in real situations are available. Previous studies found that the average substitution rates of different transportation modes to DLBS are not homogeneous in both spatial and temporal dimensions; thus, collecting real daily trip chain data is essential.
Therefore, to fill this gap, our study aims to summarize the real data of each type of transportation mode usage from the microscopic level. First, we provide statistics on the percentage change in the number of users for each type of transportation mode after the emergence of DLBS. The data on the users-based mode shifts are based on this question: “What types of transportation do you commonly take in daily life before/after the emergence of dockless shared bikes?“. Next, combined with the proportion of trips by each kind of transportation mode based on the data of trip chain, we speculate on the change in the transportation structure after the emergence of trip-based shared bikes under different distance scenarios.
Notably, the trip chain in this study is not continuous, unlike that in DBBS research, but a summary of individuals’ transportation-related behavior during a certain time period on 1 day or 1 week. In our study, the trips involving two or more steps were classified into the dominant transportation mode and respondents were asked to judge the dominant transportation mode by assessing the specular distance of this step. Additionally, travel time contains the sum of travel times in different stages of the same trip. For example, the time of a bus trip comprises the time taken to walk to the bus stop from the origin, wait for the bus, and arrive at the destination. Finally, by collecting and summarizing the travel behavior characteristics of weekday and non-weekday trips during the week, we measured the carbon emission reduction effect contributed by one DLBS cyclist in 1 week, and the carbon emission reduction effect produced by DLBS in this region in 1 year.
Following Li et al. on the personal carbon reduction of public bicycles (Li et al., 2016), we introduced the carbon reduction coefficient to compare the real environmental effects due to DLBS at different distances. Under perfect assumptions, the proportion of mode use on trip level can be thought of as the average share of distance travelled by each mode of transport for the trip with certain distance. As shown in Figure 1, after the appearance of dockless shared-bike, changes were observed in the proportion of each transportation mode. To calculate the average carbon emission coefficient per kilometer for a given distance scenario, the proportion of each transportation mode was multiplied by its corresponding carbon emission factor, and using the values before subtract the values after the introduction of shared bike. Finally, combined with the population, average riding times, and average riding length of the area, the carbon emission reduction effect can be calculated.
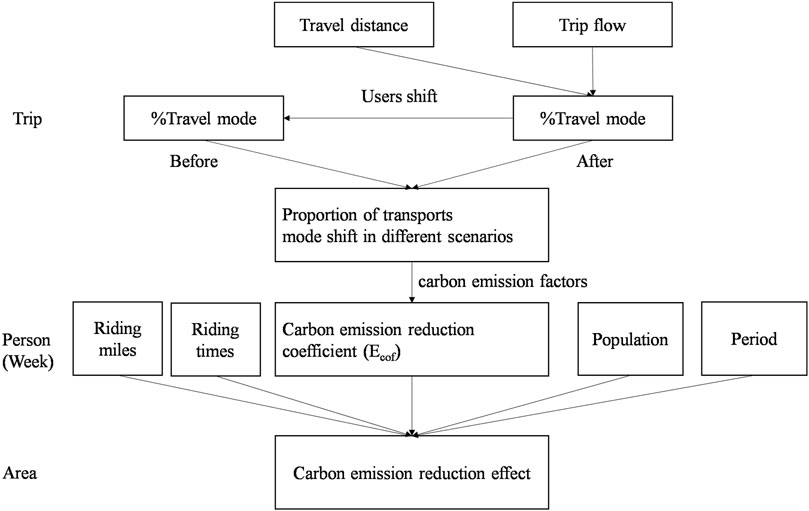
Figure 1. Framework of the calculation design.
3 Study area and survey
3.1 Study area
Fuzhou, a fast-growing coastal city located in the southeast of China, is the provincial capital of Fujian Province (Figure 2). It has become one of the central cities of China, regardless of its industrial, transportation, or commercial fields. The city has six districts, six counties, and one county-level city, with a permanent resident population of approximately 7.66 million within its administrative area (11,968 km2). Fuzhou has 1.19 million private cars, 90 bus lines, and two subway lines, and a GDP of 939.23 billion CNY (14.47 billion USD) (Fuzhou Statistics Bureau, 2020).
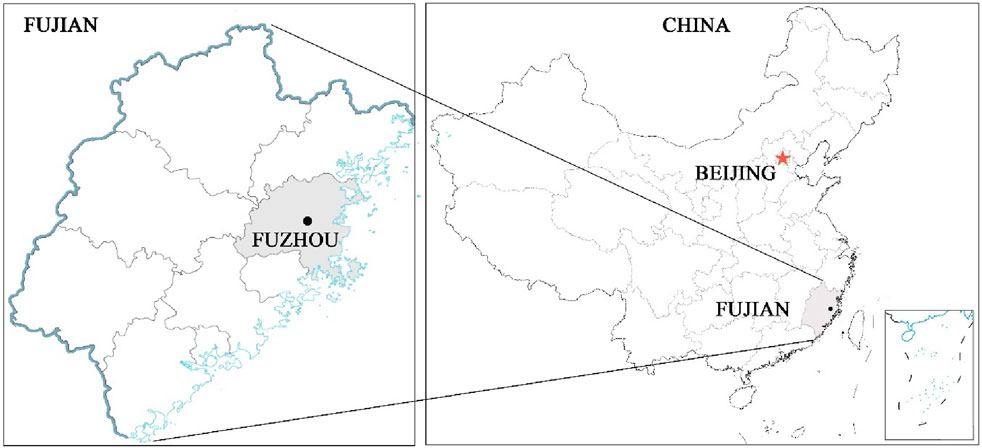
Figure 2. Location of the study area.
The public bicycle system was introduced in Fuzhou as early as 2011: more than 200 bike stations have been built by local governments, and more than 7,900 bikes have been launched in the market, which started the evolution of new travel modes. With the development of DLBS, DBBS has completed its historical mission and gradually exited the public bicycle market. As the first city in China to completely stop using the DBBS, Fuzhou began to promote DLBS at the end of 2016. At least six bike-sharing operators, such as, ofo, Hellobike, and DiDi, have operated in Fuzhou in succession, and gradually evolved to become prosperous and reached a peak in 2018, with approximately 500 thousand bikes. Additionally, Fuzhou ranks first in the average personal cycling time of dockless shared bikes, according to the report on bike-sharing in Southeast China published by Guangzhou Transport Planning Research Institute and Mobike. Therefore, we used Fuzhou as the empirical study area.
3.2 Survey and data
This study builds on surveys that have aimed to explore individuals’ bike-sharing usage rates and mode substitution and estimate the carbon emission effect. Therefore, the targeted group comprises all individuals who have used a dockless shared bike at least once. We conducted a cross-sectional questionnaire survey in five municipal districts of Fuzhou during July to August in 2017, using a random sampling method based on the population proportion of each district. To ensure the accuracy and reliability of the data, we only selected participants near places where individuals returned shared bikes, usually in five types of locations: a university, residential area, bus or subway station, park or sports center, and shopping mall. Additionally, the survey was anonymous to decrease the possibility of socially derivative responses. After removing samples with missing and unclear information, 690 valid samples were collected, and the valid response rate was 93.97%.
The questionnaire comprised three sections. In addition to the standard sociodemographic and riding behavior characteristics of the respondents, the users’ attitudes and opinions toward bike-sharing were included in this survey. The first part of this questionnaire was designed to understand the basic information of the respondents, for example, gender, age, educational attainment, annual income, place of residence, and occupation. The second part focuses on the travel behavior patterns of the respondents, mainly to obtain detailed data on riding habits. The third part is a table of the daily trip chain in which the day reconstruction method (DRM) is used, with special attention to identifying differences in riding characteristics on weekdays and weekends. Participants were also asked basic questions, such as the frequency and duration of daily use and their regular choice of transportation before and after the emergence of DLBS. Next, they filled out a 2-day travel dairy of a continuous weekday and a weekend day (e.g., Friday and Saturday). However, some participants only filled this diary for one weekday or one weekend day, rather than both. Finally, we obtained data on 2,249 trips made by approximately 50% of the participants who provided valid data on their daily trip chain, because the travel chain includes several trips in a day. The third part of this questionnaire mainly explored the respondents’ attitudes toward shared bikes, such as the attractions of bike-sharing, the problems encountered, and how they perceived the prospect of bike-sharing.
Information on basic attributes is shown in Table 1. For shared bike usage, the proportions of men and women are relatively balanced, and the youth group aged under 30 years accounts for more than 75%. Approximately 60% of users have an educational attainment of university or above, and more than 50% of the respondents own cars in their families. Notably, we found that bike-sharing participants’ families tended to be relatively wealthier, with a higher average monthly household income of USD 3305.69, which is similar to the findings in the literature (Fishman, 2016; Woodcock et al., 2014). This phenomenon may be attributed to the longer commuting distance for the lower-income group due to a job–housing imbalance; thus, they are less likely to use shared bikes in their daily lives. The sample with urban and rural household registration was 60.25% and 39.75, respectively, and the proportion of local residents was 56.10%. All these attributes are similar to those of other cities, such as Vienna (Austria) and Seattle (the United States), suggesting that shared bike users are predominantly young, educated, and have a relatively high household income (Hirsch et al., 2019; Link et al., 2020).
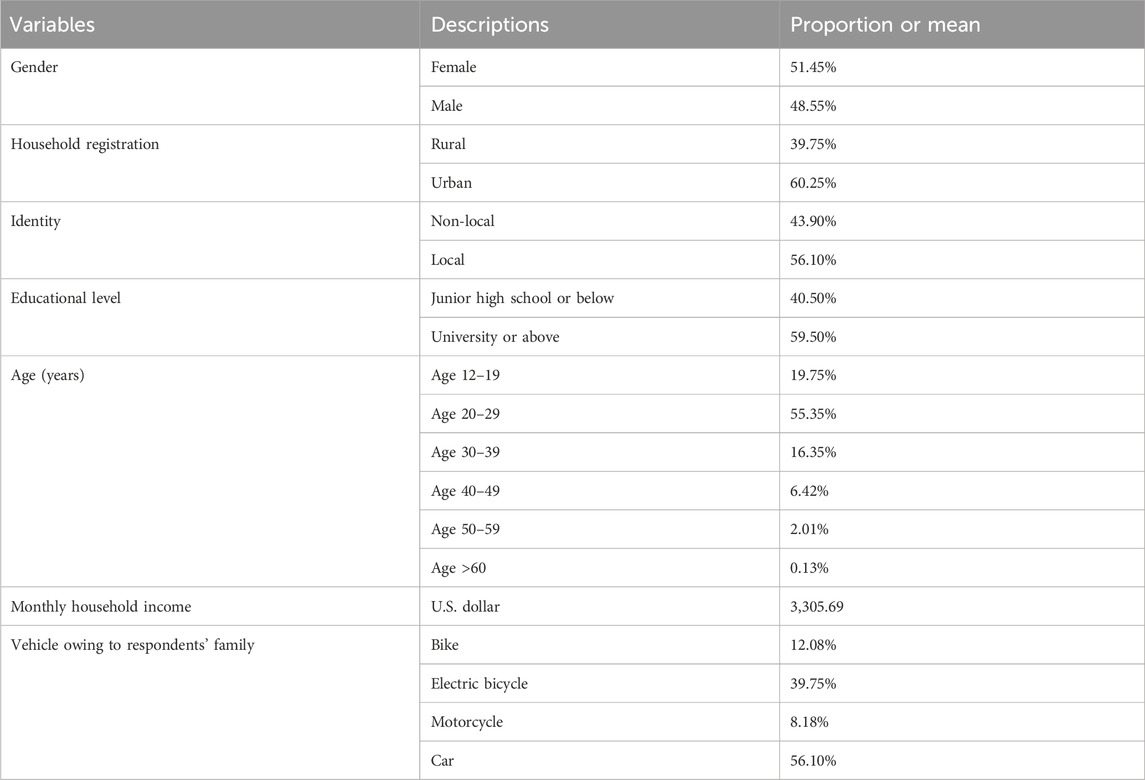
Table 1. Descriptive statistics of users of dockless shared bikes.
4 Results
4.1 Behavioral characteristics
4.1.1 Basic behavioral characteristics
By analyzing the trip chain data and other related questions, we have drawn the following conclusions on the travel characteristics of dockless shared bike users. In a basic 1-week unit, the average personal riding frequency is 4.07 times per week, and the group that uses shared bikes less than five times a week accounts for over 70% of the respondents (Figure 3a). Specifically, the percentage of DLBS trips on weekends in all-day trips was higher than that on weekdays (23.84% and 17.72%, respectively). Figures 3c, 4d reveal two peaks (6:00–9:00 and 18:00–21:00) of the number of departures and arrivals during a day, and the second peaks are the most pronounced: twice as high as those in the morning.
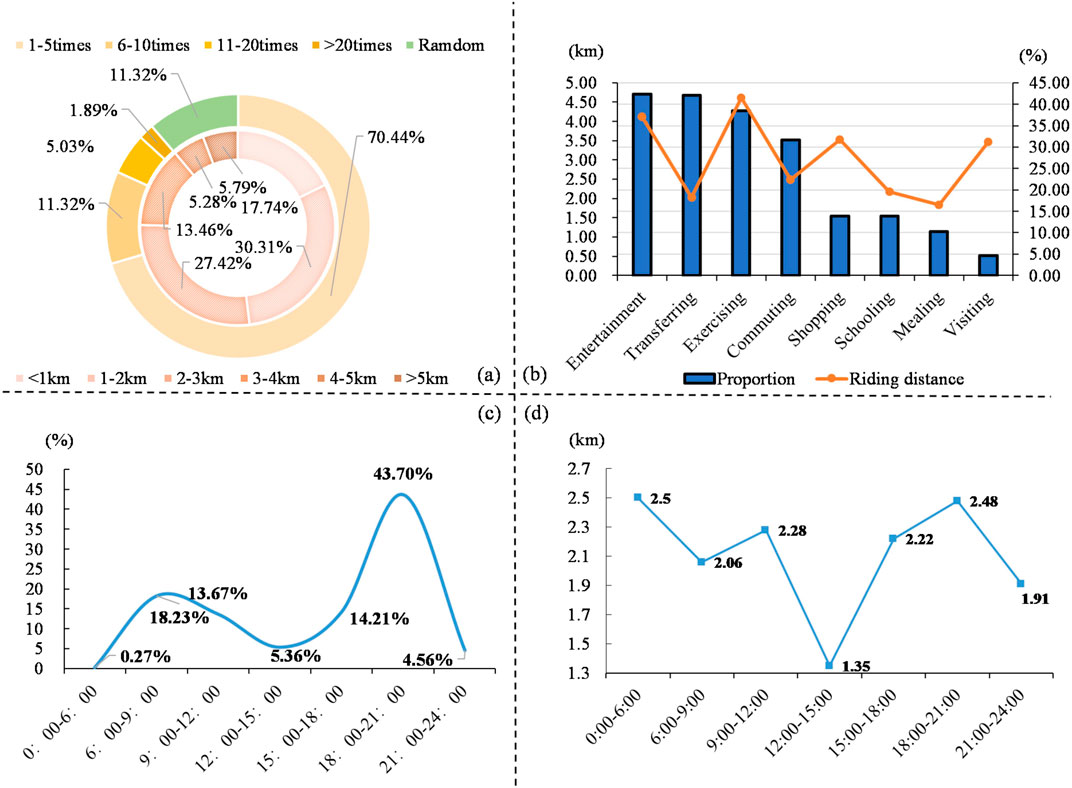
Figure 3. Statistics of total behavioral characteristics. (a) Riding frequency and distance in a week. (b) Proportion of riding purpose and responding distance. (c) Distribution of riding volume in a day. (d) Average riding distance in a day.
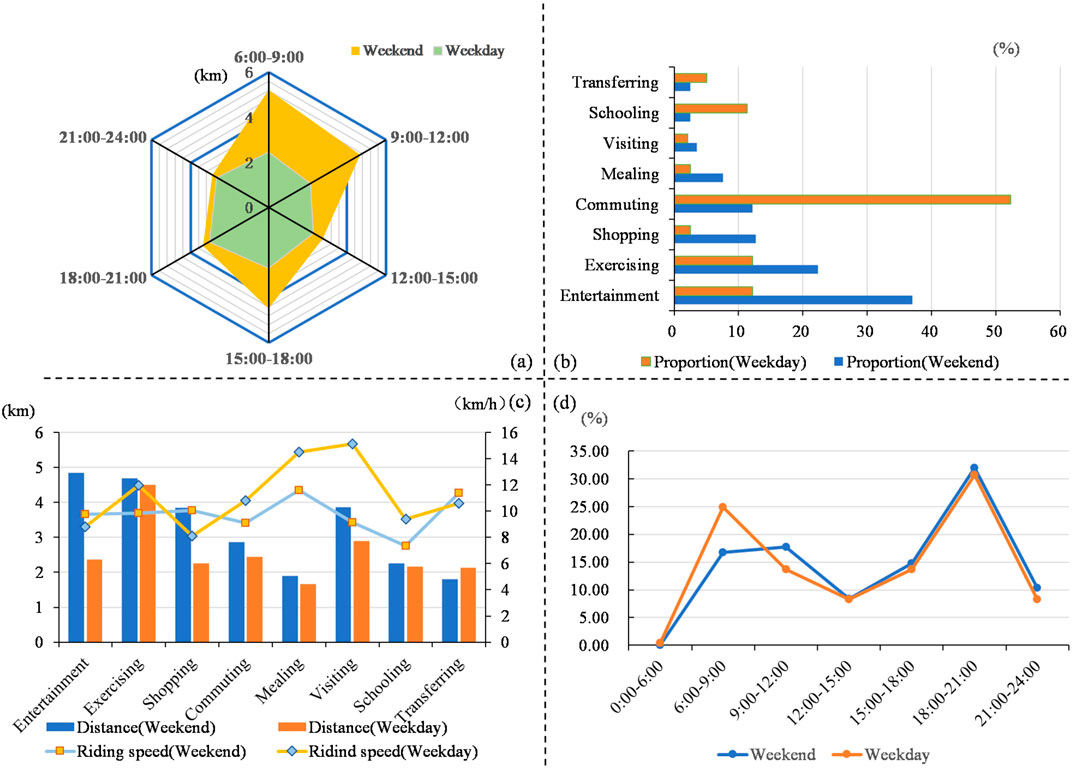
Figure 4. Behavioral characteristic differentiation of shared bike users between weekdays and weekends. (a) Average riding distance in a day. (b) Population ratio for different purposes. (c) Distance and speed for different riding purposes. (d) Distribution of riding volume in a day.
The morning peak period is later and smoother on weekends than on weekdays due to lifestyle differentiation. Notably, the second utilization peak of DLBS in Fuzhou is later than that in the literature for Shanghai (Yan et al., 2020); the reason for this difference might be that people in medium-sized cities like Fuzhou are used to riding DLBS as an exercise at night whereas in megacities like Shanghai this activity is likely to be seen as unsafe and impracticable. The average riding distance is almost the same in different time periods on workdays and fluctuates on weekends. The average distance on weekdays was shorter than that on weekends (2.67 km vs 3.98 km), but the average speed was faster than that on weekends (10.47 km/h vs 9.90 km/h). The longest average trip distance (2.5 km and 2.48 km) was observed from 00:00 to 06:00 and 18:00 to 21:00; the rides between 12:00 and 15:00 tend to be shorter than those during other periods of the day.
4.1.2 Difference between weekday and weekend
Travel purpose influences travel characteristics to some extent. Even for the same travel purpose, there are apparent disparities in riding speed and riding distance between weekdays and weekends. For the riding purpose (Figures 3b, 4b), transferring is a crucial function of bike-sharing and ranks first along with entertaining. The main purpose of riding on weekends is entertainment and exercising, and on weekdays, commuting is the main riding purpose, which covers 52.30% of weekday trips. When riding for exercise or entertainment purposes, the distance tends to be longer than that for other riding purposes, namely, 4.61 km and 4.12 km, respectively. From Figures 3d, 4a,c, it is evident that the average trip distance on weekends is larger than that on weekdays, regardless of the purpose, except for transferring. Riding distances for recreational purposes on weekdays are twice as long as those on weekends, and the gap ranks first, followed by the purpose of shopping and visiting.
When individuals ride for entertainment and shopping on weekdays, they are willing to ride more slowly than on weekends, despite the distances for these two purposes being shorter than those on weekends. This finding indicates that riding is regarded as a relaxing means of transportation for these two purposes on workdays, and individuals can enjoy it. On weekends, the riding speed for eating and visiting was the fastest. However, on weekdays, the riding speed for dining and transfer was the fastest. Additionally, the riding distance for diet is usually the shortest, and the speed is the fastest.
4.2 Carbon emission analysis
4.2.1 Carbon emission factor
The carbon emission factor is the average resource demand and carbon emission per function unit during the entire life cycle (ISO, 2006), and the transportation life cycle includes the vehicle cycle and fuel cycle. Considering the many empirical references about carbon emission factors based on the LCA theory, we directly used the average value provided by other scholars and institutions, such as the Energy Foundation of the USA and Beijing Transport Institution (Schipper et al., 2011; Loo and Li, 2012). Because there are no data available on the carbon equivalent per kilometer of DLBS, we referred to other literature and standards (Zhang and Mi, 2018) and set the life of each bike as 3 years, with a turnover rate of 4.55 times a day and a 2.2 km average riding distance (Chen et al., 2020b; Zhang and Mi, 2018). The total kilometers a shared bike can be utilized throughout its lifecycle can be derived by multiplying its total using period (in days) by the average daily usage frequency and the distance traveled per ride. Subsequently, dividing the cumulative carbon emissions generated over the lifecycle by the total kilometers traveled yields the carbon emission factor of DLBS. Based on lifecycle analysis, the carbon footprint of a single shared bike is estimated at 34.56 kg CO2 (Chen et al., 2020b), resulting in a functional unit carbon emission value of 3.15. Notably, this value is approximately half that of a private bicycle. This discrepancy can likely be attributed to the higher daily usage frequency of shared bicycles, which extends their total travel distances across their lifecycle, from production to eventual disposal (Wang and Lindsey, 2019).
Besides, most studies have assumed that decreased trips by bus or subway would not lead to carbon emission reduction, because of the fixed schedule of buses or subways, which does not change with fluctuations in passenger flow (Chen et al., 2020b; Tao and Zhou, 2021). In this study, transferring from public transportation and riding a shared bike are considered effective behaviours in reducing carbon emissions, because our focus is on the overall change in the transportation structure. In contrast with the literature (Ding et al., 2021), in this study, walking was assumed to be a zero carbon emission travel method. Figure 5 showed the carbon emission factors of different travel mode.
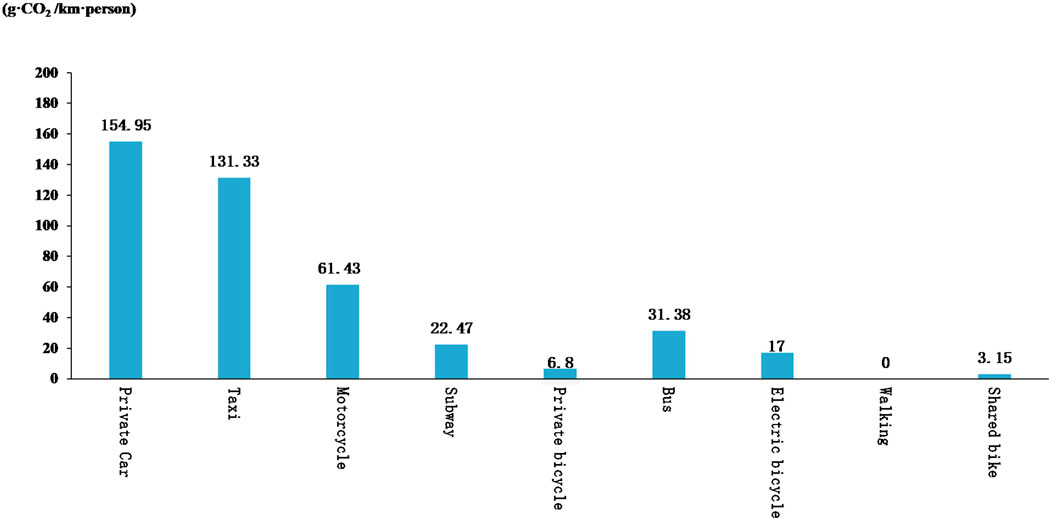
Figure 5. The carbon emission factors of different travel mode.
4.2.2 The proportion of travel mode under different scenarios
As the preference of travel mode choice depends on the travel distance, the proportion of shared bike use is seemed as an important factor in determining carbon emission reduction effect in different scenarios in this study. The findings of our study indicate the role played by shared bikes in urban transportation networks (Table 2).
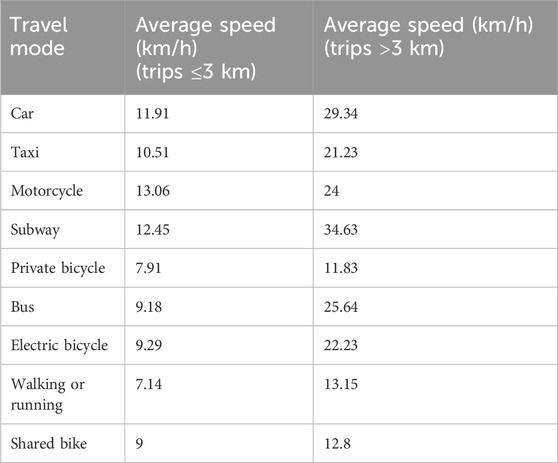
Table 2. Comparison of travel speeds in different travel situations.
For short-distance trips, dockless shared bike is used as a main mode directly replacing other modes. Trips using dockless shared bikes account for over one-fourth of short-distance trips, and short trips (≤3 km) account for nearly half of the daily travels. Additionally, approximately 75% of riders reported that their regular riding distance is less than 3 km, which indicates that dockless shared bike is an useful and accessible tool in short-distance trips. Surprisingly, there is only a small gap between the speed of a shared bike and that of any other mode of transportation for short trips below 3 km. Based on the comparison of travel speeds of different transportation modes, motorcycles rank first with a speed of 13.06 km/h, and the speeds of other transportation modes fluctuate at around 10 km/h, which is inconsistent with the fact that private cars are usually the fastest mode of transportation, possibly due to bad traffic conditions. Research results from Lyon, France, also proved that public bicycles can compete with cars in speed in downtown areas (Jensen et al., 2010). And our survey showed that more than 75% of short trips occur during rush hours in the morning and evening on weekdays. All of these has demonstrated that shared bikes have substantial advantages in short-distance trips, such as more convenience and energy efficiency than other transportation modes, and require less time and cost.
For long-distance trips, considering that transferring to other transportation modes is one of the most mentioned trip purposes for bike-sharing in the literature (Xing et al., 2020), we need to carefully evaluate whether its impact on carbon emission reduction in this context is as effective as directly replacing other transportation modes. Figure 6 shows that shared bikes are used quite frequently in long-distance travels by public transport, including both metro and bus trips. However, when combined with the results from Table 4, it becomes clear that shared bikes primarily serve as a connecting mode for long distance commuting, replacing walking rather than other modes. Therefore, their impact on carbon reduction in this context is not as significant as it is for short-distance travels. From Figure 5, it is evident that shared bikes substantially contribute to improving the sustainability and efficiency of the urban traffic network, and the combinations of “Shared bike + Subway” and “Shared bike + Bus” are the most popular combinations in the transferring mode, with 49.25% and 66.70%, respectively. Notably, this result does not mean that the DLBS expands the quantity of public transportation user groups. In fact, the usage of nearly all transportation modes decreases to a certain degree, except for the subway (Table 3), and this finding is similar to that of a survey conducted in the United States. All of these illustrates that the percentage structure of travel mode based on users base is entirely different from that based on trips, that is, a transportation mode with a larger user base uncertainly has a higher travel flow.
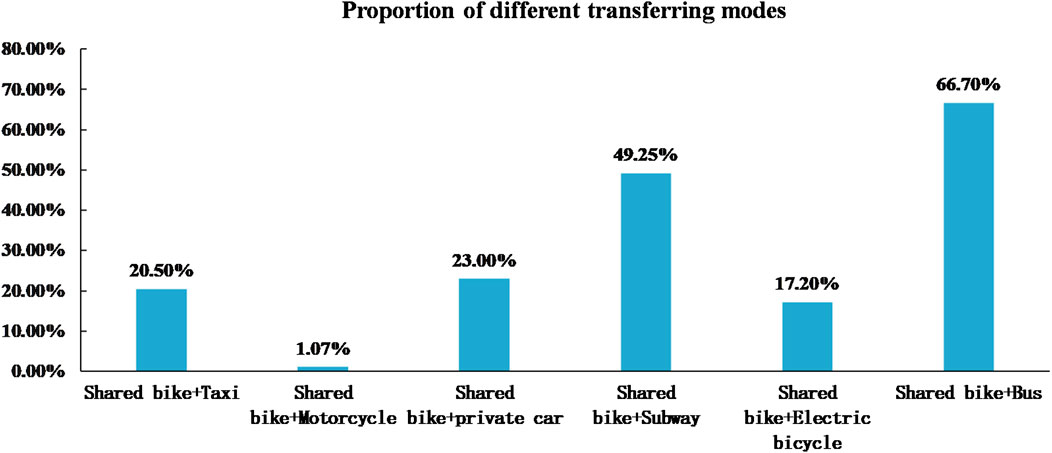
Figure 6. Proportion of transferring modes.
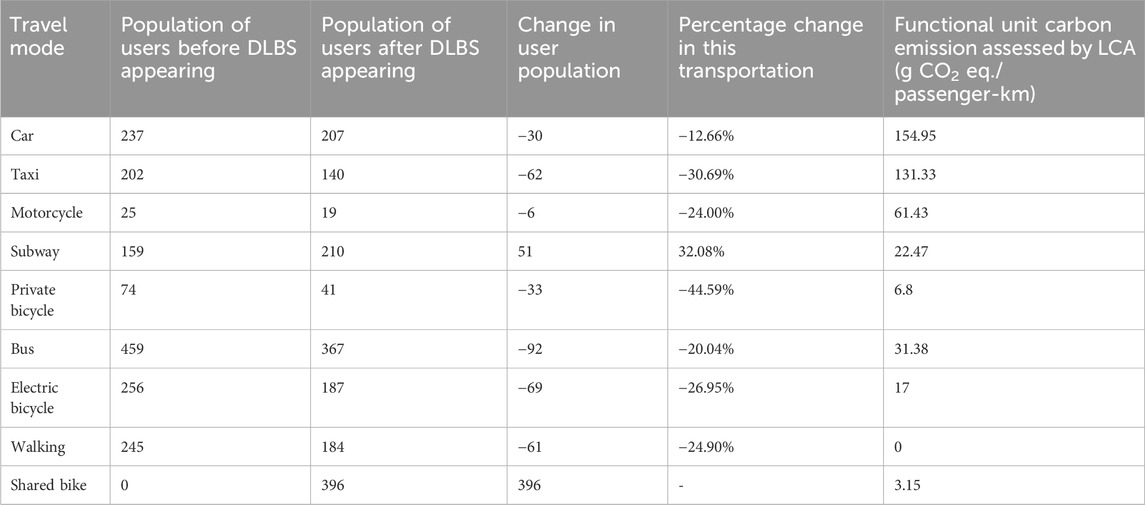
Table 3. Transportation mode shifts and the carbon emission factor.
Based on these findings, we obtained accurate substitution rates for each type of transportation. First, we totalled all trips as cases from the trip chain to calculate the proportion of each transportation mode in the total traffic field after the emergence of DLBS (Table 4). Next, we combined that number with the fluctuating percentage of the user base for each mode (Table 3). We speculated on the proportion of each transportation mode before the emergence of DLBS by assuming that all DLBS users have similar travel habits.
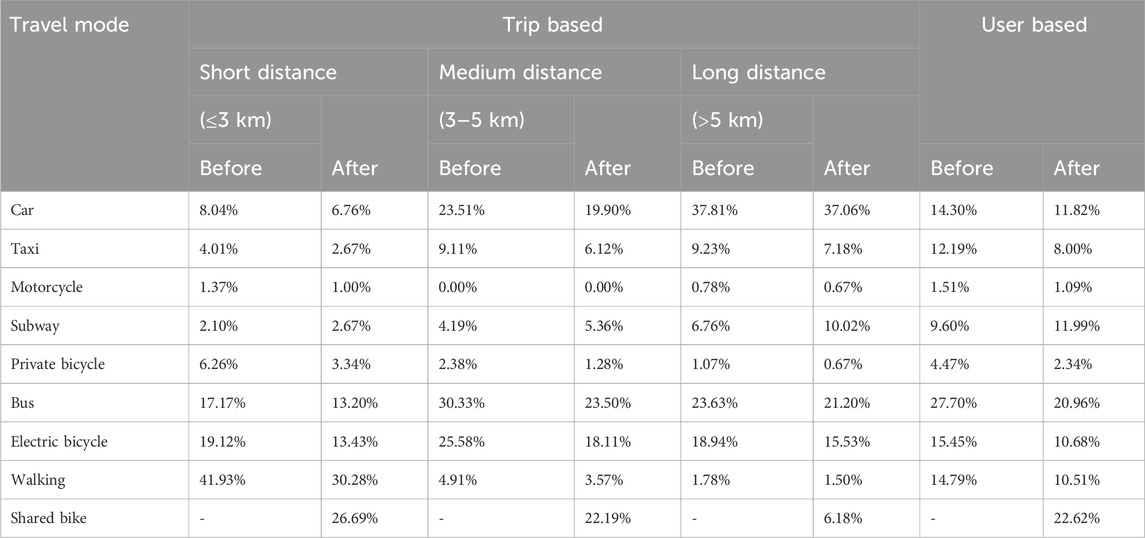
Table 4. Proportion of each travel mode under different scenarios.
4.2.3 Carbon emission reduction effect
When calculating the carbon emission reduction effect of the whole area, we assume that individuals’ daily traveling behavior is regular for a week, and the average riding distance for a single trip and the average riding times are the same for each DLBS user. Referring to Li et al. (2016) research on personal carbon emission reduction (Li et al., 2016), we made some innovation to the calculation of the Ecof formula. In Li et al.'s study, the mode share calculation only accounted for the proportion of users for each transportation mode of different distance trips prior to the introduction of DLBS, which is inaccurate. In this study, taking one trip as a basic research unit, the percentage of trip flow for each type of transportation mode can be converted to the mode proportion in the unit distance; thus, we obtained the unit carbon emission reduction coefficient (
Taking 1 week as the basic time unit, we calculated the annual total carbon emission reduction due to DLBS in Fuzhou by considering the average personal riding times and miles per week and the total population in this region. The transportation efficiency enhancement effects of the DLBS are assessed as follows (Equations 2–4):
T: Average personal riding times in 1 week;
N: The total population of users of DLBS in this area;
Finally, we calculated the personal average riding distance on weekdays and weekends separately and found them to be 2.67 km and 3.98 km, respectively. With an average of 4.07 times per week and an average of 7.66 billion for the population in central urban areas, the annual personal carbon emission reduction of users of DLBS was calculated. The result is 4,312.42 g, and the total carbon emission reduction due to DLBS in Fuzhou is approximately 33.03 Mt CO2-eq per year. Regarding the order of magnitude of carbon emission reduction, the results for Fuzhou and Beijing are similar, although they used the annual emission reduction of one dockless shared bike in 1 year as the basic research unit (Ding et al., 2021).
Furthermore, the carbon emission reduction coefficients (
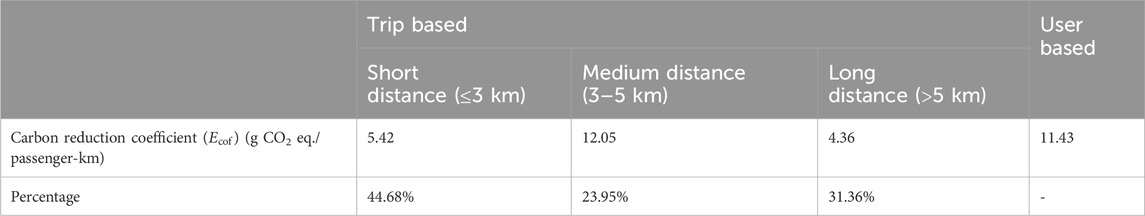
Table 5. Carbon emission reduction benefits due to DLBS under different scenarios.
5 Discussion
There is much evidence on the relationship between carbon emissions and transportation, therefore, it is of substantial significance to explore the carbon emission reduction effect caused by dockless shared bikes. However, knowledge gaps remain, especially regarding the personal space–time behavior of users of DLBS at a very fine resolution. Therefore, we attempted to fill these gaps by conducting this study by tracked the trip chain of DLBS users in Fuzhou, China. This study contributes to the literature in several dimensions. First, combination of asking questions and the DRM has been used in this study to record real personal traveling data of DLBS users in various situations at a very fine resolution, which is an improvement on traditional methods (Li et al., 2021). Second, our study develops a more accurate and comprehensive method to estimate the environmental benefits of DLBS than is found in the literature. Under the premise distance, we introduce the concept of the carbon reduction coefficient and perfected it, which effectively avoids errors caused by differences in population, average riding times, and average riding length. In addition, we consider the proportion by every transportation mode based on trips before and after the emergence of DLBS, which effectively sidesteps the problem caused by calculating mode shift only based on users number.
Our study shows that the key to quantifying the environmental influences of DLBS is the shift in the use of all transportation modes caused by DLBS. Most studies have only considered the substitution of DLBS with other modes (Li et al., 2021). Notably, DLBS can also indirectly promote the transfer of users from some transportation modes to other transportation modes (i.e., from private car to public transportation), which is supported by the results in this study on the increase in subway usage. Meanwhile, our study also proved that the preference for the pattern of “shared bike + public transportation” does not mean an increase in public transportation use, because some bus trips are directly replaced by cycling trips. The same results are showed in the study in Edinburgh, UK (D'Almeida et al., 2021). When a shared bike plays a connecting role, it can save more time compared to walking and promote sustainable daily mobility by integrating with other transportation modes; when a shared bike serves as a direct alternative to traditional transportation modes, it can decrease a trip’s duration, especially for short trips less than 3 km.
Furthermore, combined with other studies in Shanghai, Beijing, and Washington, we can find the structural proportion of mode shifts in different cities may be divergent (Chen et al., 2020b; Li et al., 2021; Shaheen and Martin, 2015), depending on road density, land use, and accessibility of public transit systems (Sun et al., 2018; Tao and Zhou, 2021). Additionally, because the basic proportion of different transportation modes varies based on distances, the carbon reduction coefficient also changes with distance. As aforementioned, our results show that the carbon reduction coefficient is nonlinear and does not continuously increase, which is inconsistent with results in the literature (Li et al., 2016). This probably occurs because we use the shifts in all transportation modes facilitated by DLBS in the calculation, rather than using the initial transportation composition as the proportion of what was directly replaced by DLBS.
A recent study in Shenzhen, China (Lv et al., 2024), found that the carbon reduction per person for a 1-km trip using a shared bike is 96g, if everyone switches from their original modes of transport to shared bikes. This is much higher than the findings of this study, which suggests that the actual substitution rate of shared bikes for different transport modes is a key factor to consider. Otherwise, the environmental benefits of shared bikes might be overestimated, because a very small fraction private car users change their travel choices because of the availability of shared bikes. Although private cars are usually used more frequently in long-distance trips (>5 km) than in medium-distance trips (3–5 km), the decline in private car use caused by DLBS is greater in medium-distance trips than in long-distance trips, which is why the carbon reduction coefficient in middle-distance trips is larger than that in long-distance trips. The reduction in carbon emissions per kilometer caused by DLBS depends primarily on the decrease in electric bicycle and the increase in public transportation. In addition, we found that the percentage of DLBS use gradually decreases with increases in distance, but other studies have often not considered this in their calculations, which could lead to biased results. However, regardless of the distance, the overall trend of carbon emissions per kilometer decreases after the emergence of DLBS, verifying the positive impact of DLBS on environmental protection.
This empirical study shows that the government should target middle-distance commuters when it formulating some preferential and incentive policies to reduce energy consumption (such as issuing ticket coupons for bus or subway riders). For urban planning designer, the density of multifunction super malls and other public service facilities, which are less than 5 km around residential areas, should be increased to improve travel willingness by public transport. At the same time, improving the connection of bike lanes and the landscape quality around subway stations and bus stations is helpful for the prosperity of green transportation. Besides, it is proposed to improve the city’s fast cycling lane system so that people can reach destinations within 5 km radius more rapidly by bicycles during the morning and evening rush hours, which is a more recommended and appropriate choice to promote the travel mobility and efficiency in the central downtown area. And when considering other travel benefits, shared bikes should be encouraged to use in entertainment oriented long-distance travel in weekends or other leisure time, which is a good way to not only enhance people’s physical quality but also reduce region traffic carbon emissions.
6 Conclusion
By analyzing dockless shared bike users’ riding habits and trip chain data, we find that riding speed and riding distance vary substantially across riding purposes and different regularity is observed between weekdays and weekends. We further compared the carbon benefits resulting from the use of dockless shared bike at different distances according to the total traffic structure transforming caused by DLBS rather than DLBS usage as a substitute for other transportation modes. We also illustrate that using 1 week as the time unit is better than using 1 day to calculate the potential environmental benefits. In addition, through this empirical analysis, we combine travel purpose with other travel characteristics, which is useful in deeply understanding DLBS users’ behaviors and exploring various regular cycling patterns. This research makes a timely contribution to advance the understanding of DLBS riders’ behaviors and travel patterns and the relationship between the carbon emission reduction effect and the introduction of DLBS in medium-sized Chinese cities.
This study has limitations regarding the data and approach. First, data were collected in 2017. Notably, a glut of shared bikes and the double riding cost caused a decrease in the bike-sharing usage ratio after 2018, which may have affected the change in trip purpose and travel patterns of bike-sharing users to a certain extent. In addition, because our study used self-reported data constructed by individuals’ memories, the accuracy of the data is a concern. Third, although we collected the proportions of each transportation mode under different distances, the change ratio of the same transportation mode used was the same for the three distances. Additionally, the substitution rates of DLBS for different transportation modes have substantial spatial–temporal variances and depend strongly on travel contexts (Li et al., 2021). In further research, we plan to further analyze the environmental impacts of DLBS at the group level with different travel characteristics.
Considering the variability in carbon emission reduction across different travel distances, policy interventions should be tailored to maximize the environmental benefits of DLBS. Short-distance trips, though moderate in per-trip carbon reduction efficiency, dominate in trip frequency and often occur during multimodal transit transfers. Incentive measures, such as ride discounts based on trip frequency, alongside financial subsidies for public transportation like metro systems, can encourage sustainable short-distance travel. Medium-distance trips exhibit the highest carbon reduction efficiency per kilometer, making distance-based financial subsidies an effective strategy to reduce reliance on motorized modes for trips within this range. For long-distance trips, which constitute a smaller proportion of overall travel yet remain vital for leisure and continuous cycling, constructing dedicated bicycle highways would ensure uninterrupted and efficient long-distance mobility. These targeted measures collectively aim to optimize the carbon reduction potential of DLBS and support the development of a sustainable urban transportation network.
Data availability statement
The raw data supporting the conclusions of this article will be made available by the authors, without undue reservation.
Ethics statement
Ethical review and approval was not required for the study on human participants in accordance with the local legislation and institutional requirements. Written informed consent from the (patients/participants OR patients/participants legal guardian/next of kin) was not required to participate in this study in accordance with the national legislation and the institutional requirements.
Author contributions
GL: Conceptualization, Writing – review and editing, Formal Analysis, Software, Methodology, Writing – original draft. HZ: Data curation, Supervision, Funding acquisition, Writing – review and editing, Formal Analysis. YC: Writing – review and editing, Resources, Project administration, Visualization. XQ: Visualization, Project administration, Investigation, Writing – review and editing.
Funding
The author(s) declare that financial support was received for the research and/or publication of this article. This work was supported by the National College Students Innovation and Entrepreneurship Training Program, Grant No. 201710394019 and the Project of Power China Guiyang Engineering Corporation Limited, Grant No. YJ 2023-11.
Conflict of interest
Author HZ was employed by Power China Guiyang Engineering Corporation Limited.
The remaining authors declare that the research was conducted in the absence of any commercial or financial relationships that could be construed as a potential conflict of interest.
Generative AI statement
The author(s) declare that no Generative AI was used in the creation of this manuscript.
Publisher’s note
All claims expressed in this article are solely those of the authors and do not necessarily represent those of their affiliated organizations, or those of the publisher, the editors and the reviewers. Any product that may be evaluated in this article, or claim that may be made by its manufacturer, is not guaranteed or endorsed by the publisher.
References
Abdulrazzaq, L. R., Abdulkareem, M. N., Yazid, M. R. M., Borhan, M. N., and Mahdi, M. S. (2020). Traffic congestion: shift from private car to public transportation. Civ. Eng. J-Tehran. 6 (8), 1547–1554. doi:10.28991/cej-2020-03091566
Ai, Y., Li, Z., and Gan, M. (2019). A solution to measure traveler's transfer tolerance for walking mode and dockless bike-sharing mode. J. Supercomput 75 (6SI), 3140–3157. doi:10.1007/s11227-017-2211-7
Barbour, N., Zhang, Y., and Mannering, F. (2019). A statistical analysis of bike sharing usage and its potential as an auto-trip substitute. J. Transp. Health. 12, 253–262. doi:10.1016/j.jth.2019.02.004
Carrus, G., Passafaro, P., and Bonnes, M. (2008). Emotions, habits and rational choices in ecological behaviours: the case of recycling and use of public transportation. J. Environ. Psychol. 28 (1), 51–62. doi:10.1016/j.jenvp.2007.09.003
Chen, J., Zhou, D., Zhao, Y., Wu, B., and Wu, T. (2020a). Life cycle carbon dioxide emissions of bike sharing in China: production, operation, and recycling. Resour. Conserv. Recy. 162, 105011. doi:10.1016/j.resconrec.2020.105011
Chen, M., Wang, D., Sun, Y., Waygood, E. O. D., and Yang, W. (2020b). A comparison of users' characteristics between station-based bikesharing system and free-floating bikesharing system: case study in Hangzhou, China. Transportation 47 (2), 689–704. doi:10.1007/s11116-018-9910-7
D'Almeida, L., Rye, T., and Pomponi, F. (2021). Emissions assessment of bike sharing schemes: the case of Just Eat Cycles in Edinburgh, UK. Sustain. Cities Soc. 71, 103012. doi:10.1016/j.scs.2021.103012
Ding, Q., Li, J., Wang, Q., Li, C., and Yue, W. (2021). Carbon emission effect of the dock-less bike-sharing system in Beijing from the perspective of life cycle assessment. J. Environ. Acc. Ma. 9 (1), 31–41. doi:10.5890/JEAM.2021.03.004
Du, Y., Deng, F., and Liao, F. (2019). A model framework for discovering the spatio-temporal usage patterns of public free-floating bike-sharing system. Transp. Res. C-Emer. 103, 39–55. doi:10.1016/j.trc.2019.04.006
Fishman, E. (2016). Bikeshare: a review of recent literature. Transp. Rev. 36 (1SI), 92–113. doi:10.1080/01441647.2015.1033036
Fishman, E., Washington, S., and Haworth, N. (2014). Bike share's impact on car use: evidence from the United States, Great Britain, and Australia. Transp. Res. D-Tr E. 31, 13–20. doi:10.1016/j.trd.2014.05.013
Fukushige, T., Fitch, D. T., and Handy, S. (2021). Factors influencing dock-less E-bike-share mode substitution: evidence from Sacramento, California. Calif. Transp. Res. D-Tr E. 99, 102990. doi:10.1016/j.trd.2021.102990
Gao, K., Yang, Y., Li, A., and Qu, X. (2021). Spatial heterogeneity in distance decay of using bike sharing: an empirical large-scale analysis in Shanghai. Transp. Res. D-Tr E. 94, 102814. doi:10.1016/j.trd.2021.102814
Hirsch, J. A., Stewart, I., Ziegler, S., Richter, B., and Mooney, S. J. (2019). Residents in Seattle, WA report differential use of free-floating bikeshare by age, gender, race, and location. Front. Built Environ. 5, 17. doi:10.3389/fbuil.2019.00017
Jensen, P., Rouquier, J., Ovtracht, N., and Robardet, C. (2010). Characterizing the speed and paths of shared bicycle use in Lyon. Transp. Res. D-Tr E. 15 (8), 522–524. doi:10.1016/j.trd.2010.07.002
Jie, T., Wei, W., and Jiang, L. (2020). A sustainability-oriented optimal allocation strategy of sharing bicycles: evidence from ofo usage in Shanghai. Resour. Conserv. Recy. 153, 104510. doi:10.1016/j.resconrec.2019.104510
Kou, Z., and Cai, H. (2019). Understanding bike sharing travel patterns: an analysis of trip data from eight cities. Phys. a 515, 785–797. doi:10.1016/j.physa.2018.09.123
Kou, Z., Wang, X., Chiu, S. F. A., and Cai, H. (2020). Quantifying greenhouse gas emissions reduction from bike share systems: a model considering real-world trips and transportation mode choice patterns. Resour. Conserv. Recy. 153, 104534. doi:10.1016/j.resconrec.2019.104534
Li, A., Aemail, K. G. C. C., Zhao, P., Qu, X., and Axhausen, K. W. (2021). High-resolution assessment of environmental benefits of dockless bike-sharing systems based on transaction data. J. Clean. Prod. 296 (5), 126423. doi:10.1016/j.jclepro.2021.126423
Li, C., Zeng, X., Liang, X., Bian, Y., Xu, W., and Yang, L. (2016). Research on carbon emission reduction calculation of urban public bicycle system base upon generalised carbon trading. Chin. Popul. Resour. Environ. (12), 103–107. (in Chinese). doi:10.3969/j.issn.1002-2104.2016.12.014
Li, X., Zhang, Y., Du, M., and Yang, J. (2019). Social factors influencing the choice of bicycle: difference analysis among private bike, public bike sharing and free-floating bike sharing in kunming, China. Ksce J. Civ. Eng. 23 (5), 2339–2348. doi:10.1007/s12205-019-2078-7
Li, X., Zhang, Y., Sun, L., and Liu, Q. (2018). Free-floating bike sharing in jiangsu: users' behaviors and influencing factors. Energies 11 (7), 1664. doi:10.3390/en11071664
Link, C., Strasser, C., and Hinterreiter, M. (2020). Free-floating bikesharing in Vienna - A user behaviour analysis. Transp. Res. A-Pol 135, 168–182. doi:10.1016/j.tra.2020.02.020
Loo, B. P. Y., and Li, L. (2012). Carbon dioxide emissions from passenger transport in China since 1949: implications for developing sustainable transport. Energy Policy 50, 464–476. doi:10.1016/j.enpol.2012.07.044
Luo, H., Kou, Z., Zhao, F., and Cai, H. (2019). Comparative life cycle assessment of station-based and dock-less bike sharing systems. Resour. Conserv. Recy. 146, 180–189. doi:10.1016/j.resconrec.2019.03.003
Lv, G., Zheng, S., and Chen, H. (2024). Spatiotemporal assessment of carbon emission reduction by shared bikes in Shenzhen, China. Sustain. Cities Soc. 100, 105011. doi:10.1016/j.scs.2023.105011
Pal, A., and Zhang, Y. (2017). Free-floating bike sharing: solving real-life large-scale static rebalancing problems. Transp. Res. C-Emer. 80, 92–116. doi:10.1016/j.trc.2017.03.016
Raux, C., Zoubir, A., and Geyik, M. (2017). Who are bike sharing schemes members and do they travel differently? The case of Lyon's “Velo'v” scheme. Transp. Res. A-Pol. 106, 350–363. doi:10.1016/j.tra.2017.10.010
Reiss, S., and Bogenberger, K. (2015). “GPS-data analysis of munich's free-floating bike sharing system and application of an operator-based relocation strategy,” in IEEE international conference on intelligent transportation systems-ITSC, 584–589.
Schipper, L., Saenger, C., and Sudardshan, A. (2011). Transport and carbon emissions in the United States: the long view. Energies 4 (4), 563–581. doi:10.3390/en4040563
Shaheen, S., and Martin, E. (2015). Unraveling the modal impacts of bikesharing. UC Berkerly ACCESS Mag. 1 (47), 8–14. Available online at: https://www.accessmagazine.org/wp-content/uploads/sites/7/2015/12/access47.shaheen.pdf.
Shen, Y., Zhang, X., and Zhao, J. (2018). Understanding the usage of dockless bike sharing in Singapore. J. Sustain. Transp. 12 (9), 686–700. doi:10.1080/15568318.2018.1429696
Sun, F., Chen, P., and Jiao, J. (2018). Promoting public bike-sharing: a lesson from the unsuccessful Pronto system. Transp. Res. D-Tr E 63, 533–547. doi:10.1016/j.trd.2018.06.021
Sun, S., Wang, B., and Li, A. R. (2020). Shared bicycle study to help reduce carbon emissions in Beijing. Energy Rep. 61 (Suppl. 1), 837–849. doi:10.1016/j.egyr.2019.11.017
Tang, Y., Pan, H., and Fei, Y. (2017). Research on users' frequency of ride in Shanghai minhang bike-sharing system. Transp. Res. Procedia 25, 4979–4987. doi:10.1016/j.trpro.2017.05.376
Tao, J., and Zhou, Z. (2021). Evaluation of potential contribution of dockless bike-sharing service to sustainable and efficient urban mobility in China. Sustain. Prod. Consum. 27, 921–932. doi:10.1016/j.spc.2021.02.008
Wang, J. Y., and Lindsey, G. (2019). Do new bike share stations increase member use: a quasi-experimental study. Transp. Res. A-Pol. 121, 1–11. doi:10.1016/j.tra.2019.01.004
Wei, Z., Zhen, F., Mo, H., Wei, S., Peng, D., and Zhang, Y. (2021). Travel behaviours of sharing bicycles in the central urban area based on geographically weighted regression: the case of Guangzhou, China. Chin. Geogr. Sci. 31 (1), 54–69. doi:10.1007/s11769-020-1159-3
Wergin, J., and Buehler, R. (2017). Where do bikeshare bikes actually go? Analysis of capital bikeshare trips with GPS data. Transp. Res. Rec. 2662, 12–21. doi:10.3141/2662-02
Woodcock, J., Tainio, M., Cheshire, J., O'Brien, O., and Goodman, A. (2014). Health effects of the London bicycle sharing system: health impact modelling study. Bmj-Brit. Med. J. 348 (7946), 425. doi:10.1136/bmj.g425
Xing, Y., Wang, K., and Lu, J. J. (2020). Exploring travel patterns and trip purposes of dockless bike-sharing by analyzing massive bike-sharing data in Shanghai, China. China. J. Transp. Geogr. 87, 102787. doi:10.1016/j.jtrangeo.2020.102787
Yan, Q., Gao, K., Sun, L., and Shao, M. (2020). Spatio-temporal usage patterns of dockless bike-sharing service linking to a metro station: a case study in Shanghai, China. Sustainability 12 (3), 851–914. doi:10.3390/su12030851
Yan, X., and Crookes, R. J. (2009). Reduction potentials of energy demand and GHG emissions in China's road transport sector. Energ. Policy. 37 (2), 658–668. doi:10.1016/j.enpol.2008.10.008
Zamir, K. R., Bondarenko, I., Nasri, A., Brodie, S., and Lucas, K. (2019). Comparative analysis of user behavior of dock-based vs. Dockless bikeshare and scootershare in Washington, D.C. Statistics- applications. (7).
Zhang, Y., Brussel, M. J. G., Thomas, T., and van Maarseveen, M. F. A. M. (2018). Mining bike-sharing travel behavior data: an investigation into trip chains and transition activities. Comput. Environ. Urban. 69, 39–50. doi:10.1016/j.compenvurbsys.2017.12.004
Zhang, Y., and Mi, Z. (2018). Environmental benefits of bike sharing: a big data-based analysis. Appl. Energ. 220, 296–301. doi:10.1016/j.apenergy.2018.03.101
Keywords: dockless bike-sharing, behavioral characteristics, carbon emission reduction, day reconstruction method, Fuzhou
Citation: Liu G, Zhang H, Cheng Y and Qi X (2025) Refinement of carbon emission reduction of dockless bike-sharing users’ behavior under different scenarios. Front. Environ. Sci. 13:1594262. doi: 10.3389/fenvs.2025.1594262
Received: 17 March 2025; Accepted: 09 May 2025;
Published: 19 May 2025.
Edited by:
Arti Choudhary, Banaras Hindu University, IndiaReviewed by:
Suresh Pandian Elumalai, Indian Institute of Technology Dhanbad, IndiaMahdi Aghaabbasi, University of Central Florida, United States
Copyright © 2025 Liu, Zhang, Cheng and Qi. This is an open-access article distributed under the terms of the Creative Commons Attribution License (CC BY). The use, distribution or reproduction in other forums is permitted, provided the original author(s) and the copyright owner(s) are credited and that the original publication in this journal is cited, in accordance with accepted academic practice. No use, distribution or reproduction is permitted which does not comply with these terms.
*Correspondence: Hao Zhang, emgudXJiYW5AcGt1LmVkdS5jbg==