 Ang Yue1,2
 Xueer Guo
 Haiying Gong
- 1School of Environmental Science and Engineering, Tianjin University, Tianjin, China
- 2Tianjin Eco-Environmental Monitoring Center, Tianjin, China
- 3Academy of Ecological Civilization Development for JING-JIN-JI Megalopolis, Tianjin Normal University, Tianjin, China
- 4Tianjin Natural Resources Ecological Restoration and Remediation Center, Tianjin, China
This study used remote sensing images from 2000 to 2020 to explore changes in the ecological value of the four wetland nature reserves in Binhai, Tianjin. By integrating the PLUS model and ecosystem service value (ESV) assessment methods, this study explored the spatiotemporal evolution of the Binhai wetland ecosystem from 2000 to 2020 and systematically simulated land use changes and their impacts on ESVs under three scenarios: natural development, economic development, and ecological conservation. The results showed that (1) from 2000 to 2020, the overall ecological value of the four reserves showed a growth trend, with the added value of aquatic ecosystems making the most significant contribution. Among ecosystem services, hydrological regulation played a crucial role in supporting the total ESV and significantly surpassed the other service categories. (2) The spatial aggregation and total ESV exhibited distinct variations under different development scenarios. Changes in cultivated land, water bodies, and impervious surfaces were particularly significant. While human interventions under different development objectives strongly influenced land use structures, the dominant roles of cultivated land and water bodies remained largely unchanged. (3) The various ESV components and individual ESV values in the four reserves showed notable differences under the different development scenarios. Under the ecological conservation scenario, both the overall and individual ESVs increased, whereas under the economic development scenario, they declined.
1 Introduction
Coastal wetlands are vital ecosystems connecting the land and sea that play a crucial role in maintaining biodiversity, regulating regional climate, and providing water purification services. However, in recent years, global climate change, pollution diffusion, and intensified human activities have led to habitat loss, hydrological process alterations, and ecosystem service function degradation in coastal wetlands (Sun et al., 2015; Schuerch et al., 2018; Barbier, 2019). Rapid urbanization, land reclamation, and infrastructure development (Xu and Gong, 2018; Jiang et al., 2021) have significantly reduced wetland areas, particularly in China’s coastal regions, and severely impacted their ecosystem services (Jiang et al., 2015; Cui et al., 2016). Finding a balance between economic development and ecological protection while rationally planning coastal wetland land use to enhance ecosystem service value (ESV) has become a core issue in current coastal ecosystem management (Barbier, 2013; Barbier, 2019).
Studying ESVs based on land use change serves as a crucial starting point for coastal wetland management. Scholars have integrated ESV assessments with land use change using methods such as benefit transfer, the InVEST model, and ecological footprint analysis. Among them, the equivalent factor method is the most widely used. Building on Costanza’s approach, Gaodi et al. (Costanza et al., 1997; Xie et al., 2003). Proposed a unit area value equivalent tailored to China’s national conditions, thus laying an important foundation for ESV research in China. In 2015, the ESV classification system was further refined and the equivalent factor table was revised to provide a basis for ESV assessments in China (Xie et al., 2015). Recent advances in remote sensing technology have provided essential tools for the long-term monitoring and ecosystem assessment of coastal wetlands. With the development of remote sensing and GIS technologies, researchers have conducted various land use prediction and simulation model studies tailored to different national and regional characteristics, thereby revealing the respective advantages and limitations of each model (Hu et al., 2020). The CLUE-S model, which integrates statistical models with spatial analysis capabilities, predicts land use change based on driving factors such as population, economy, and policy; thus, the model is more suitable for regional-scale studies (Sang et al., 2011; Wu et al., 2012). For instance, Wang et al. (2024) and Luo et al. (2010) simulated land use changes at the watershed scale using the CLUE-S model. The CA-Markov model, which combines the spatial autocorrelation of cellular automata (CA) with the time-series forecasting ability of the Markov process, effectively simulates land use evolution trends and spatial patterns; however, it relies heavily on historical data for predictions and cannot automatically adjust model parameters to adapt to different spatial environments (Sang et al., 2011; Hamad et al., 2018). In contrast, the PLUS model, which integrates the advantages of the Transformation Analysis Strategy (TAS) and Pattern Analysis Strategy (PAS), can simulate the non-linear relationships of multiple land use types more accurately and demonstrates significant advantages in prediction accuracy. For example, Liang et al. (2021) used the PLUS model to predict patch dynamics of land use in Wuhan, whereas Li et al. (2023) applied the PLUS model to simulate land use changes under different spatial policies at the provincial level.
Although progress has been made in ESV assessment and land use prediction, in-depth research on the evolution of land use patches within coastal wetland nature reserves and the corresponding changes in ESVs is lacking. To address these gaps, this study focused on the four wetland nature reserves in Binhai, Tianjin, and used the equivalent factor method to assess the spatiotemporal characteristics of ESVs from 2000 to 2020. On this basis, the PLUS model was employed to simulate land use changes under multiple scenarios and analyze their impacts on ESVs. The findings of this study can provide decision-making support for ecological conservation and management.
2 Materials and methods
2.1 Study area
The wetland system of Tianjin is located along the northeast of the North China Plain and west coast of Bohai Bay. It is the largest estuarine-coastal composite wetland distribution area in northern China. It presents a gradient distribution pattern with the Jizhou Piedmont wetland in the north, the Haihe Plain wetland in the middle, and the coastal wetland in the south. It includes 12 internationally important wetlands, national wetland nature reserves, and municipal wetland parks. Among them, the Beidagang Wetland, ancient coastal wetland, Dahuangbao Wetland, and Tuanbo Bird Nature Reserve represent core ecological nodes. The wetland system in Tianjin has important ecological functions and value. As a key node of the East Asian-Australasian migratory bird flyway, Tianjin wetlands have recorded 416 bird species (24 of which are national first-class protected species), with the Oriental White Stork (Ciconia boyciana) presenting the largest wintering population, accounting for 45% of the global total. The ancient oyster reefs in the Qilihai Wetland preserves date back to 7,000 years, making it a rare geological heritage site worldwide. Moreover, the soil organic carbon density of Tianjin coastal wetlands is 12.3 kg/m2, which is higher than the national average of coastal wetlands (8.6 kg/m2). In addition, the annual carbon fixation is approximately 1.2 TgC, which is of strategic significance for regional carbon neutrality (Chen et al., 2015). Finally, the wetland system can reduce storm surge energy by 30%–40%. During the “Fireworks” typhoon in 2021, the Beidagang wetland retained 120 million m3 of flood water, effectively alleviating urban waterlogging (Zhang et al., 2023).
Figure 1 Study area overview (a) Location of Tianjin urban area (b) Layout of Tianjin Binhai Wetlands.
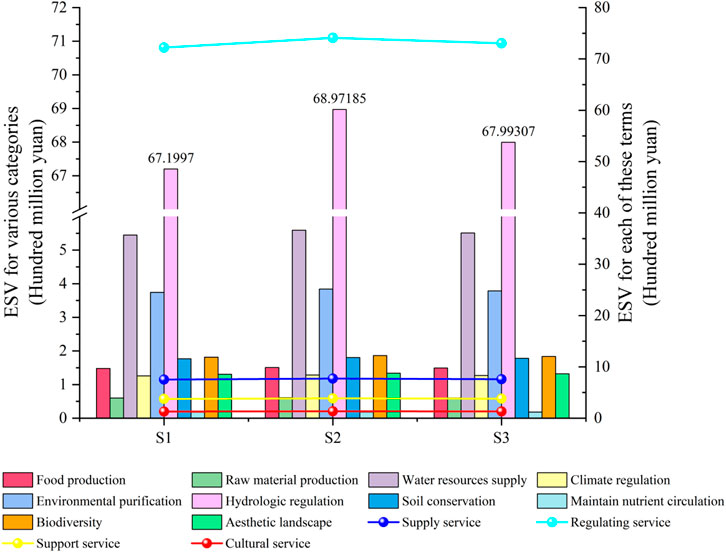
Figure 1. Overview of the study area.
2.2 Data sources
This study uses the PLUS model block to extract land use change information stage by stage to determine the development probability of the study area under various scenarios, simulates the spatiotemporal changes of ESV in the study area under various development scenarios based on the equivalent factor method, and then obtains the land use type, ESV simulation results, and evaluation analysis results of Tianjin’s typical wetland reserves under natural development scenarios, ecological protection scenarios, and economic development scenarios. The data sources are listed in Table 1.
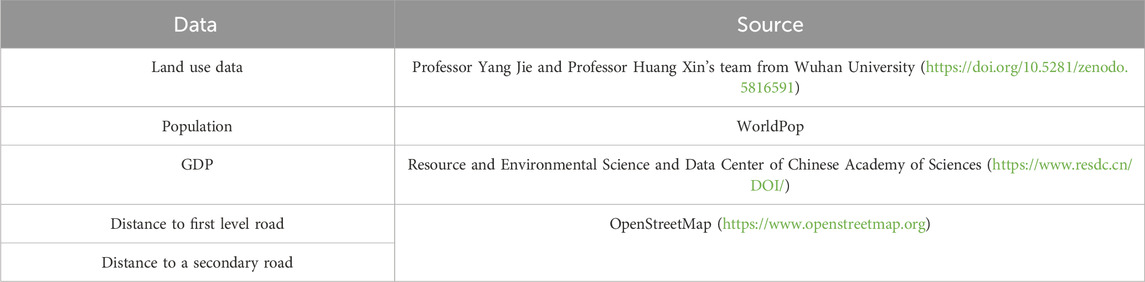
Table 1. Research data sources.
2.3 Methodology
2.3.1 Equivalent factor method
The equivalent factor method was used as a quantitative method of analyzing the ESV of the study area to clarify the resources and environmental welfare of the four wetland nature reserves. Based on the improved ESV method proposed by Xie et al. (2015) in 2015 and the reclassification of land use types in the study area, the unit area ESV equivalent was revised, as shown in Table 2. The ESV of the study area was calculated using the revised unit area equivalent factor. The specific calculation formula is as follows Equations 1 and 2:
where ESVY is the ecosystem service value in period Y (yuan); Vef is the ecosystem service value of the standard equivalent factor (yuan/ha); efij is the ecosystem service equivalent per unit area of the i-th land use type and the j-th ecological service function; Ai is the i-th land use area in the study area (ha); Sl is the planting area of the l-th crop (ha); Pl is the net profit per unit area of the l-th crop (yuan/kg); Ql is the unit area yield of the l-th crop (kg/ha); and ST is the total sown area of \grain crops (ha). Regarding the actual grain planting situation in the study area, the main grain crops in the four protected areas were wheat, corn, and rice.
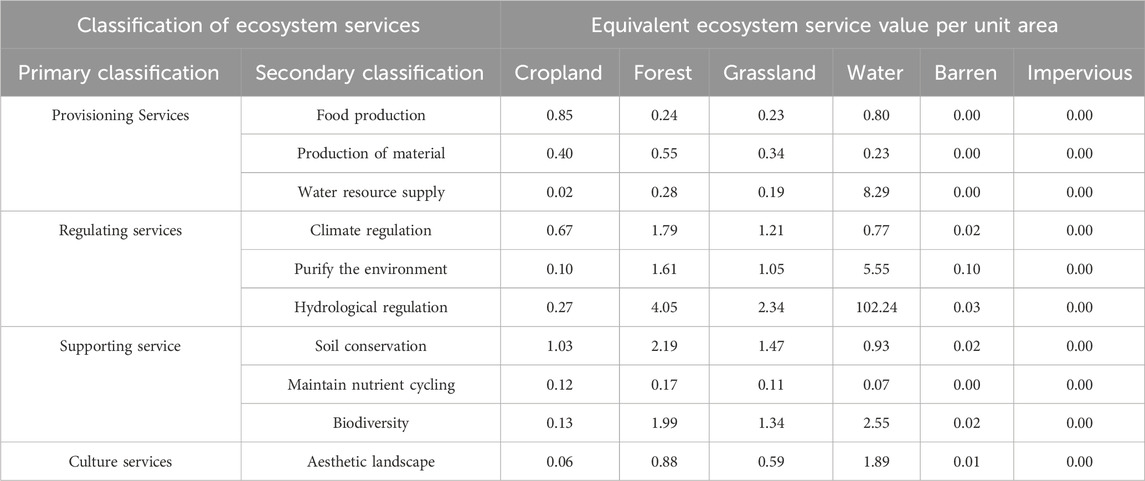
Table 2. Equivalent value of ecosystem services per unit area in the study area (yuan/ha).
Because the equivalent factors of the same land use type in Table 2 have the same value and the study areas in this paper present spatial differences that will affect the ecological service functions of the same plots, the basic equivalent factors must be corrected. Based on the main food crop prices of the four nature reserves in 2020 and the average data of the main food crop yields in the study area from 2018 to 2022, this study determined the ESV of the standard equivalent factor, which was 2,245 yuan/ha, and calculated the ESV of the four reserves, as shown in Table 3.
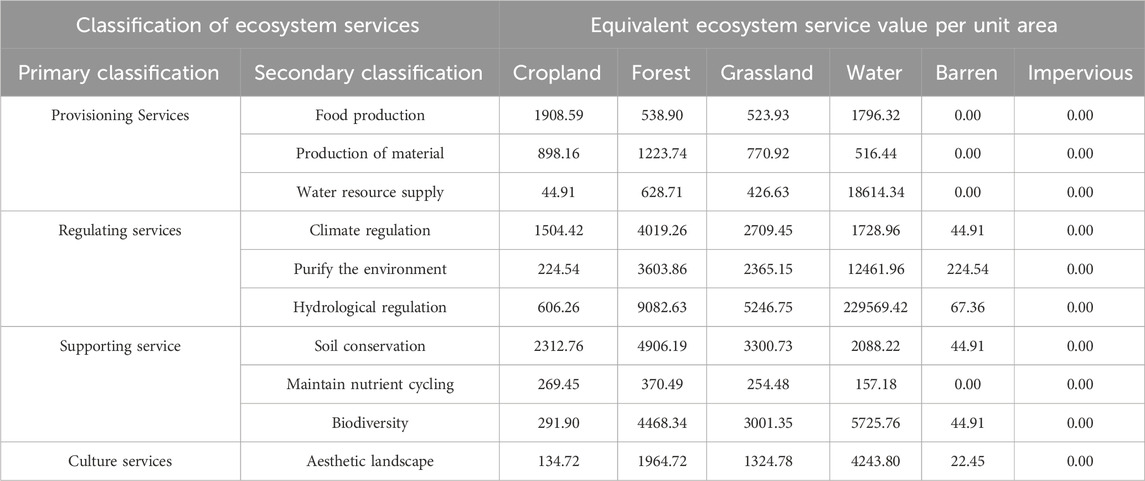
Table 3. Ecosystem service values in the study area (yuan/ha).
2.3.2 PLUS land use simulation model
In recent years, models such as CLUE-S, CA-Markov, FLUS, and PLUS have been widely used to simulate land use changes. Among them, the PLUS model is particularly suitable for large-scale studies because of its high accuracy, fast processing speed, and ease of use. This study employs the PLUS model to simulate future land use changes in the study area and its sub-regions while analyzing its impact on ecosystem services. The PLUS model involves extracting land use expansion areas, utilizing a random forest algorithm to explore driving factors, calculating development probabilities, and simulating future land use patterns through a cellular automata (CA) model. The specific working principles are as follows.
2.3.2.1 Land expansion analysis strategy
The land expansion analysis strategy (LEAS) method identifies land use change areas between two periods, randomly samples training data for land use types, change areas, and driving factors, and applies the random forest algorithm to reveal land use expansion patterns and rank the contribution of driving factors. The core random forest algorithm* is an ensemble classifier based on decision trees that effectively handles high-dimensional data and mitigates multicollinearity issues between variables. The formula is as follows Equation 3:
where represents the growth probability of land use type k output for spatial unit i; I is the decision tree geometric indicator function; and ℎn(x) is the simulation type corresponding to the nth decision tree of the driving factor vector x.
2.3.2.2 CA model based on multitype random patch seed mechanism
The CA model based on multitype random patch seed mechanism module simulates the evolution trends of various land use patches in the study area using the decreasing threshold rule. Based on the land use development probability map generated by the LEAS module, the spatiotemporal evolution process of the patch was dynamically simulated in combination with the initial data, thereby allowing new patches to grow spontaneously under the constraint of development probability. When the adjacent influence of land use type k is 0, the growth probability change of each type will generate “seeds” that form new land types and patches. The calculation formula is as follows Equation 4:
where r is a random value between 0 and 1 and µk is the threshold for generating new land use patches of type k.
3 Results
3.1 Analysis of spatiotemporal changes in ecosystem service value
3.1.1 Analysis of temporal changes in ecosystem service value
From 2000 to 2020, the ESVs of the four nature reserves showed a fluctuation pattern of initially increasing, decreasing, and then increasing again. This evolution law is consistent with the conclusions of Ma et al. (2024). Moreover, the data show that although there were periodic fluctuations during this period, the total ESV presented a significant increase from 3.681 billion yuan to 6.799 billion yuan, representing a cumulative increase of 88% (Figure 2). In particular, the ESV value reached a periodic peak of 6.432 billion yuan in 2005, which was mainly attributed to the expansion of the aquatic ecosystems of the reserves.
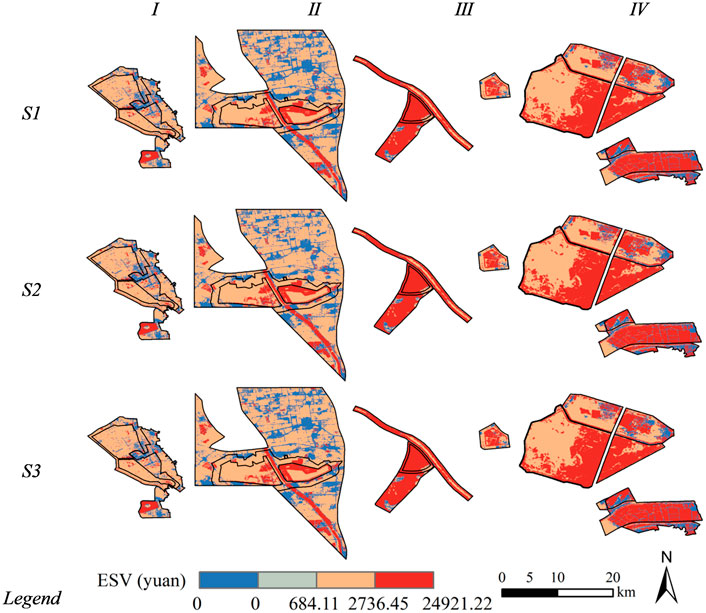
Figure 2. Total ecosystem service value (ESV) and all ESV types in four protected areas from 1990 to 2020.
The analysis of the spatial distribution evolution of various types of land surfaces, using [specific methods or models], revealed that adjusting the land cover patterns in the four nature reserves from 2000 to 2020 triggered significant differentiation in ecosystem service values (ESVs) (Figure 2). The ESV of aquatic ecosystems doubled during the research period, with the most rapid growth, a cumulative increase of 102%, occurring from 2000 to 2005. This finding aligns with Wen et al. (2022), who reported that aquatic ESVs continued to dominate. Conversely, the ESVs of cultivated land, forest land, meadows, and bare soil displayed continuous downward trends, decreasing by 24.26%, 66.70%, 98.01%, and 62.05%, respectively, by the end of the study period. Although the ESV of forest land briefly rebounded in 2010, it maintained an overall downward trend. Additionally, the ESV of bare soil exhibited a periodic upward trend between 2005 and 2015. The meadow ecosystem showed the most dramatic dynamic changes and significant volatility, with a cliff-like decline exhibited between 2000–2005 and 2010–2015 and a rapid rebound between 2005 and 2010. However, after 2015, this decline flattened. This nonlinear change reflects the dynamic relationship between grassland management policies and ecological protection measures. The artificially hardened ground did not generate quantifiable ESVs throughout the study period. Overall, the expansion of the water area contributed 87.6% to the growth of regional ESV, whereas the reduction of natural elements such as cultivated land and forest land produced a significant depreciation effect on ESV.
From 2000 to 2020, the ESV of the four nature reserves exhibited different evolutionary characteristics (Figure 3). The values of the four major types of ecological services showed an upward trend, among which the regulating service has always been dominant. This service reached a peak of 5.758 billion yuan in 2020, highlighting its core supporting role. Supply services ranked second, with a value of 618 million yuan in 2020 and a staged high of 322 million yuan in 2005. Although cultural services increased significantly, the overall base was small, with the highest value of 105 million yuan achieved in 2020.
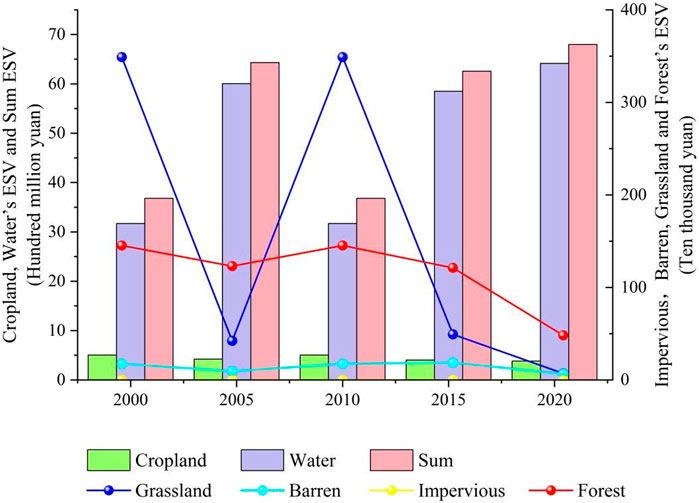
Figure 3. All ESV types and single ESVs in the four protected areas from 1990 to 2020.
In terms of the evolution of single functions, all types of ESV indicators showed fluctuating change characteristics and maintained an overall growth trend in the two periods 2000–2005 and 2010–2020. Specifically, the growth rate was significant from 2000 to 2005 and 2010 to 2015 and gradually increased from 2015 to 2020. From the analysis of the service-type structure, hydrological regulation value accounted for as much as 75.3% of the total ESV (2020), followed by the water resource supply value, which accounted for 12.8%. This distribution is consistent with the results of Baiting and Cao (Shen, 2024; Zhang et al., 2024). Moreover, it highlights the hydrological regulation efficiency of wetlands in the protected area and their strong association with a high ecological value coefficient of these ecosystems. Together, these services constitute the core value of the regional ecosystem.
In comparison, the contribution of functions such as raw material supply, biodiversity conservation, nutrient cycle maintenance, and landscape aesthetics was relatively limited. Specifically, the nutrient cycle service value presented the lowest proportion (<0.5%), which was directly related to the widespread distribution of regional salinized land and its corresponding low ecological value coefficient. Other functions, such as food production, climate regulation, environmental purification, and soil conservation, contributed to the total ESV at a moderate level (3.5%–8.2%), highlighting the auxiliary support role of these services in wetland ecosystems.
3.1.2 Analysis of spatial variation of ecosystem service value
The evolutionary characteristics of the spatial pattern of ESVs in the four study areas from 2000 to 2020 are shown in Figure 4. From the analysis of spatial heterogeneity, low-value areas usually showed a fragmented distribution, medium-value areas were dominant, and high-value areas showed spatial agglomeration characteristics. From the analysis of temporal changes, Dahuangbao Wetland and Tuanbo Bird Reserve ranked first among the high-value areas in different years. The former ranked first in terms of the proportion of high-value areas in 2000 and 2010, whereas the latter reached a peak of high-value coverage in 2005, 2015, and 2020, basically covering the entire reserve. In comparison, the spatial patterns of the ancient coastal wetland and Beidagang Reserve exhibited fewer interannual fluctuations.
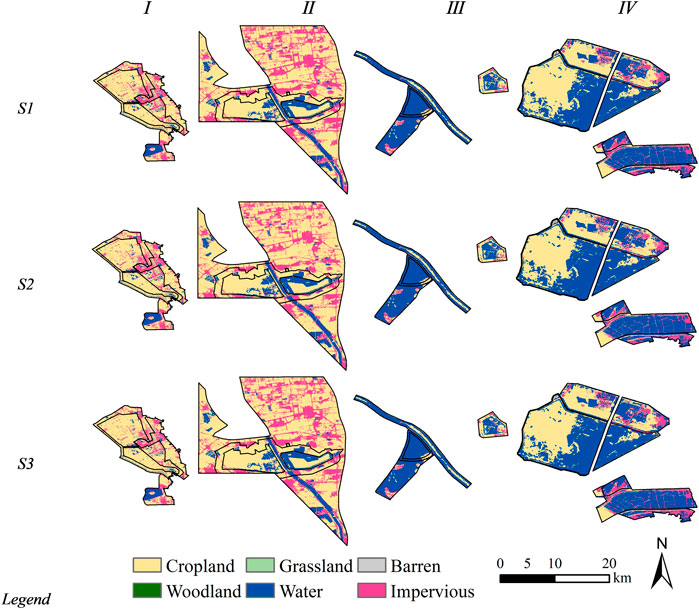
Figure 4. Spatial distribution of ESVs in the four protected areas from 2000 to 2020.
Specifically, the ESV of Dahuangbao Wetland showed a gradient characteristic of high values in the southwest and low values in the northeast. From 2000 to 2015, the high-value area continued to extend northwestward, reaching its largest coverage area in 2015, although it significantly decreased to the southern core area in 2020. The high-value area of the ancient coastal wetland has long been dominated by discrete patches in the middle, and the medium-value area has always occupied the main position. It is worth noting that the scope of its high-value and low-value areas has continued to expand, especially the high-value water area in the middle, which has widened annually with the evolution of land use. Tuanbo Bird Reserve shows value level transition characteristics, with the medium-value area continuing to transform into a high-value area and the low-value area, which is the smallest, presenting an obvious expansion trend. Beidagang Wetland is composed of three main bodies, and the overall distribution pattern is high in the southeast and low in the northwest. Both the high- and low-value areas are expanding, although the increase in the high-value area is significantly greater, especially in the independent area in the southeast, which has maintained the highest value density for a long time.
The geographical distribution characteristics of ESVs revealed in this study have significant similarities with existing results; that is, water, forest, and grassland ecosystems show significant high-value attributes. For example, the mountainous area of northwestern Beijing, which has high vegetation coverage, has been confirmed as the core area of ecological services (Zhang et al., 2025). In addition, the Sanjiangyuan area contributes 98% of the total ecological service value through its hydrological ecosystem and grassland complex system (Xu et al., 2024). This spatial heterogeneity stems from the key functions of the above ecosystems in multiple dimensions, including carbon storage, biological gene pool maintenance, watershed hydrological regulation, microclimate optimization, surface cover protection, and the derived ecological, economic, and cultural value system.
3.2 Land use multi-scenario simulation
According to the simulation prediction results of the PLUS model, the land cover patterns of the protected area under the four development scenarios will be significantly different by 2030 (see Table 4, Figure 5). The data table systematically presents the spatial scale and proportional relationship of each land type in the multi-scenario simulation. In the natural development scenario, the scale sequence of land types in 2030 is as follows: cultivated land (504.37 km2, 52.06%) > water area (294.84 km2, 30.43%) > bare land (0.99 km2, 0.10%) > forest land (0.16 km2, 0.02%) > grassland (0.03 km2, 0.0003%). Under the two control scenarios of economic development and ecological protection, human development significantly alters the proportion of each land type area compared to the natural development model. However, owing to the apparent difference in the basic scale gradient, the distribution sequence of land cover types in the Qilihai area remains unchanged: cultivated land > water area > artificially hardened surface > bare land > forest land > grassland. Thus, although policy interventions oriented toward differentiated development can effectively adjust the land resource allocation structure, the core dominance of cultivated land and water system ecological space remains stable.
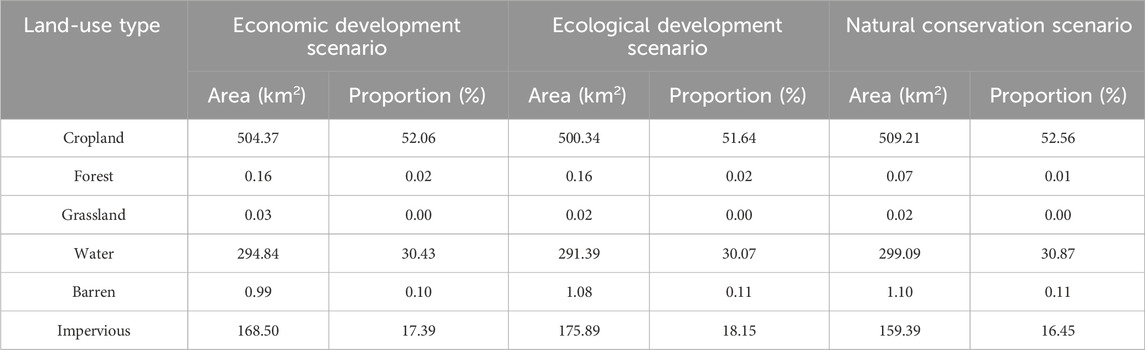
Table 4. Area and proportion of each category in 2030 under different scenarios.
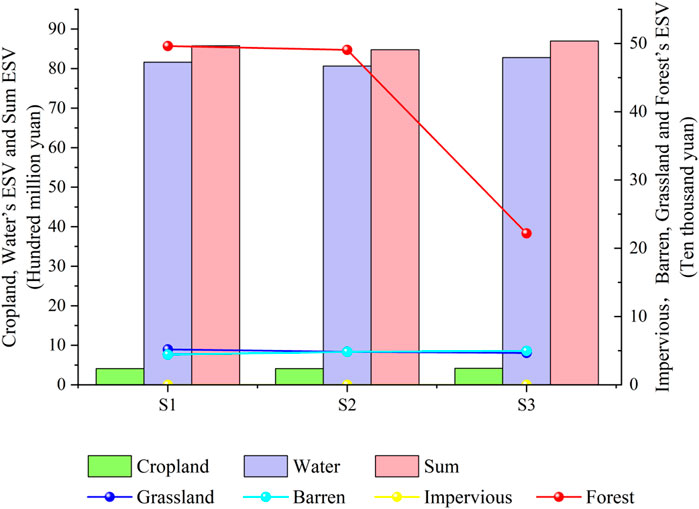
Figure 5. Land Use simulation results of each subzone in Qilihai under the multiple scenarios in 2030.
This study analyzes the dynamic evolution characteristics of different land use types through a multi-scenario simulation and explores the effect of optimizing the development strategy orientation and spatial control measures on the regional land use structure and its ecological and environmental effects. Cultivated land resources presented a peak of 509.21 km2 (accounting for 52.56%) in ecological priority mode but was reduced to 500.34 km2 (51.64%) in the economic orientation mode. The water system also showed a rising and falling trend. Under the ecological protection mode, this system maintained a maximum scale of 299.09 km2 (30.87%), whereas under the economic priority development mode, it was reduced to 291.39 km2 (30.07%). This spatial differentiation law shows that ecological control policies can effectively maintain the system integrity of cultivated land and water areas, whereas economically driven development may spatially compress these areas, which is closely related to the dual attributes of the two types of land use. That is, the economic benefit output efficiency is relatively low but the ecological service value is very high.
Forest cover significantly decreased to 0.07 km2 (0.01%) in the ecological protection scenario but remained basically consistent with the natural evolution state in the economic-oriented model (0.16 km2, 0.02%). Grassland resources showed a shrinking trend under different development paths, with only approximately 0.02 km2 remaining in both scenarios, accounting for nearly 0%. This abnormal phenomenon may be related to the characteristics of this typical wetland ecosystem, whose core ecological function is mainly associated with the water area, with forest and grassland vegetation having a relatively limited role in the regional economy. In contrast, unused land showed a slight expansion in both development models, reaching 1.08 and 1.10 km2 (approximately 0.11% for both). Impervious surface area showed different trends due to the different development scenarios, with a decrease to 159.39 km2 in the ecological protection scenario (16.45%) and an increase to 175.89 km2 in the economic development scenario (18.15%). This type of artificial interface, which is composed of roads and paved surfaces, is often given priority for development because of its high-intensity economic activity carrying capacity. However, its closed surface seriously hinders the material circulation process of the natural system. This negative ecological effect was verified in a watershed study by Shuster et al. (2005). This spatial reconstruction feature directly reflects the profound impact of the urbanization process on land use patterns and the resulting risk of the degradation of ecosystem service functions. The empirical research of Li et al. (2020) demonstrated that implementing an ecological space control strategy effectively increases the amount of cultivated land and water reserves. In contrast, an economic priority strategy can be used to meet construction needs by allowing for the occupation of ecological space (Yu et al., 2023). This is highly consistent with the evolution law of the Tianjin wetlands.
3.3 Ecosystem service value under different scenarios
Under the land use simulation results of the three different scenarios, the total ESVs of the four protected areas in 2030 will be 8.578 billion yuan (natural development scenario S3), 8.700 billion yuan (ecological protection scenario S2), and 8.479 billion yuan (economic development scenario S1). The ESV of the ecological protection scenario S2 was the highest, indicating that ecological protection played a positive role in improving the ESV values of the four protected areas. As shown in Figure 6, under the ecological protection scenario S2, the ESV of farmland and water areas reached the maximum value at 417 million yuan and 8.282 billion yuan, respectively, which represented an increase of 0.96% and 1.44% over the natural development scenario S3, respectively. Under the economic development scenario S1, the ESV of farmlands, forests, water areas, and grasslands decreased while the ESV of bare land increased slightly to 48,400 yuan (9.11%). This indicates that economic development played a positive role in promoting the ESV of bare land. As shown in Figure 7, in terms of the ESV of each ecosystem service under the ecological protection scenario S2, all ESV types and individual ESVs increased in the four protected areas. The ESV of supply services reached 771 million yuan, an increase of 1.35% over the natural development scenario S3, with the ESV of water resource supply increasing most significantly to 559 million yuan (1.44%). The total ESV of regulation services was 7.41 billion yuan, representing an increase of 1.43% compared to the natural development scenario S3. The ESV of hydrological regulation and environmental purification reached 6.897 billion yuan (1.44%) and 384 million yuan (1.42%), respectively. Under the economic development scenario S1, all ESV types and individual ESVs decreased in the four protected areas, indicating that the total ESV showed a downward trend under the economic development scenario S1. The ESV of supply services decreased to 753 million yuan (1.10%), with the ESV of water resource supply presenting the greatest decrease to 545 million yuan (1.17%). This phenomenon shows that under the economic development scenario S1, neglecting supply services has led to the obstruction of ESV growth and a significant loss of water supply services.
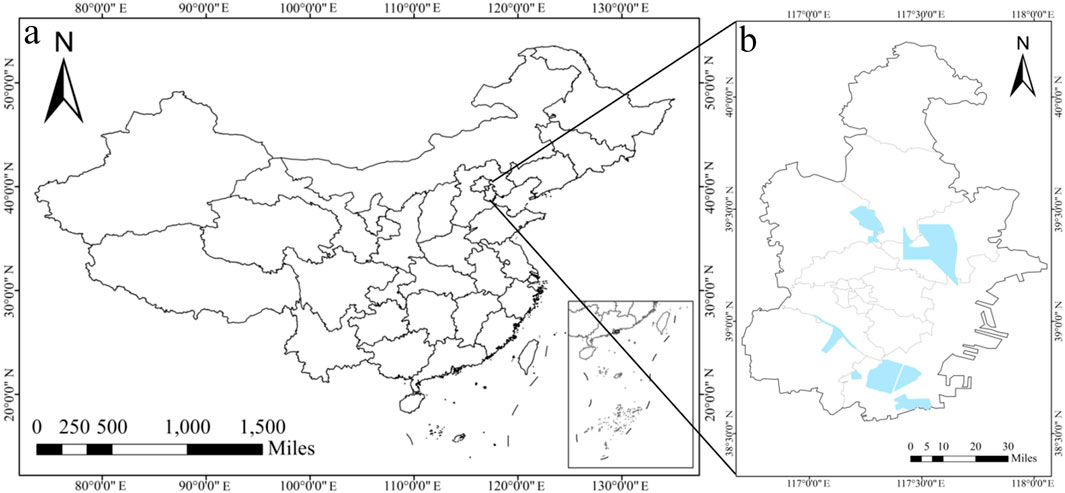
Figure 6. Total ESV and ESVs of each land type in the study area under the multiple scenarios in 2030.

Figure 7. Various ESV categories and individual ESVs in the study area under the multiple scenarios in 2030.
The spatial distribution of ESVs in the four protected areas under the three scenarios was roughly equivalent but still showed certain differences, as shown in Figure 8. Based on the total regional ESV value alone, the ESV under the ecological protection scenario S2 was the highest. In this regard, the four protected areas showed a high degree of consistency; except for the Dahuangbao Wetland Nature Reserve, the ESV values of the other three wetland reserves were greater in the natural development scenario S3 than in the economic development scenario S1. Relatively, the 0-value area and high-value areas had the largest spatial differences among the three scenarios. The main change was that the spatial distribution expanded or shrunk during the current year. The 0-value area of the ESV of the four wetland reserves was largest in the economic development scenario S1 and smallest in the ecological protection scenario S2, and the spatial location gap was small. The 0 value area of the Dahuangbao Wetland Nature Reserve was mainly distributed in the middle of the reserve, and the Ancient Coast and Wetland Nature Reserve had a large area and were distributed in a linear and surface shape. The patches are large and dense under the economic development scenario S1 and sparsely distributed under the other two scenarios: the high-value areas of the Tuanbo Bird Nature Reserve are absolutely dominant, and the changes are small under the three scenarios; the high-value area of the Beidagang Wetland Nature Reserve is the largest, and the 0 value area is the smallest. The spatial differences between the three scenarios were mainly reflected in the transition zone from the western middle-value area to the high-value area. Among them, the high-value area was the largest under the ecological protection scenario S2.
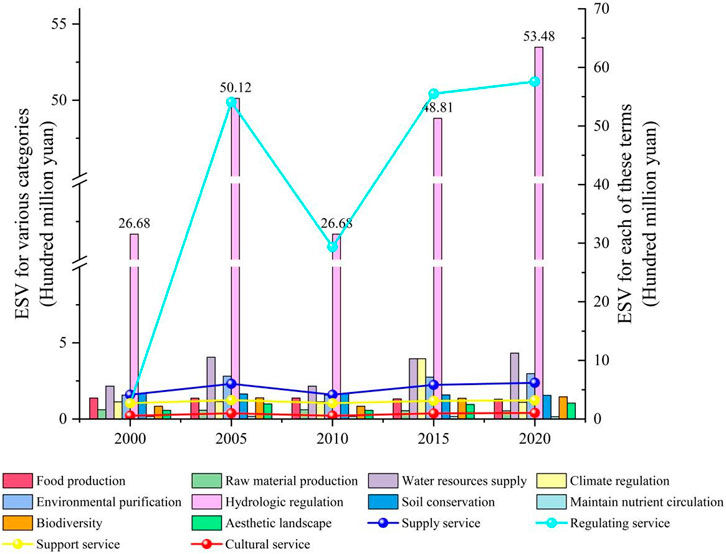
Figure 8. Various ESV categories and individual ESVs in the study area under multiple scenarios in 2030.
Figure 8 various ESV Categories and Individual ESV in the Study Area under Multiple Scenarios in 2030.
4 Discussion
4.1 Discussion based on 3.3 scenario
Coastal wetlands, as sensitive zones of sea-land interaction, have ecosystem service values (ESVs) that are easily affected by external disturbances. Driven by land use changes, coastal wetland ecosystems may face different developmental paths. This study establishes three scenarios: natural development, economic development, and ecological protection. The natural development scenario maintains the inertia of land use from 2000 to 2020. The economic development scenario increases the demand for impervious surfaces, raising the probability of land use shifts from other types (excluding water areas) to impervious surfaces by 40%, and decreasing the probability of shifts from impervious surfaces to other types (excluding water areas) by 40%. The ecological protection scenario decreases the probability of shifts from forest land, grassland, and water areas to impervious surfaces by 80%, and from bare land and farmland to impervious surfaces by 40%. It also increases the probability of shifts from farmland to forest land and grassland by 20%, and from grassland to forest land by 10%.
The study shows that under the ecological protection scenario, the ESV of farmland reaches its maximum, indicating that cultivated ecological land has significant economic and ecological value potential, thus significantly enhancing the ESV of protected areas. At the same time, the ESV of forests significantly decreases, and the ESV of grasslands slightly decreases. This demonstrates that ecological protection has a certain negative impact on the ESV of forests and grasslands, especially on forests, and less so on grasslands. Under the economic development scenario, although there is a positive effect on individual land types like bare land, the overall ESV shows a downward trend, with support services ESV experiencing the largest decline. This indicates that the economic development scenario is not conducive to the overall growth of regional ESVs. Thus, human activities have a noticeable effect on land use, total ESV changes, the value produced by various ecosystem services, and the relationships among them in the study area. When enhancing the ESV in the study area, setting regional development goals and using human interventions is an effective means. Therefore, future coastal wetland management should seek a balance between protection and development, establish ecological compensation mechanisms, and plan land use reasonably through long-term monitoring and assessment of the impacts of land use changes on ecosystem services, to achieve sustainable regional development and promote the improvement of ecological environment quality and efficiency, which will aid in sustainable economic development.
4.2 Uncertainties and limitations of the study
This study focused on spatiotemporal changes and examined wetland ESVs according to spatiotemporal changes. Therefore, the study has the following limitations. In terms of research methods, the equivalent factor method used to calculate the ESVs relies on the economic value coefficient of the ecosystem service equivalent per unit area. Although this method is widely used in regional ESV assessments, its coefficient is mainly based on the average value of national or large-scale ecosystems; thus, it may not accurately reflect the spatial heterogeneity and particularities of the study area. The PLUS model is highly dependent on the selection and weight allocation of driving factors in land use change simulations. Although this study determined the driving factors, such as socioeconomic and ecological constraints, through literature analysis and expert experience, the spatially explicit relationships among drivers are still subjective and regionally universal. Finally, as a sensitive zone of sea-land interactions, coastal wetlands present in ESVs are susceptible to the sudden impact of external disturbances. Therefore, land use simulation models cannot easily capture the impact of such nonlinear and random events, resulting in the over-smoothing of trend characteristics in the simulation results. Therefore, although the use of the PLUS model in combination with satellite remote-sensing data is a powerful strategy, the limitations must be considered when applying it. Moreover it should be combined with other data sources and methods to improve the accuracy and applicability of the research results.
5 Conclusion
(1) From 2000 to 2020, the total amount and composition ratio of the ESVs in the study area showed dynamic fluctuations. During this period, the overall ESVs of the four major protected areas showed an upward trend, with the value-added contribution of aquatic ecosystems presenting the most prominent trend. Moreover, the supporting role of hydrological regulation on the total value was significantly greater than that of the other service categories. The ESVs of the four major wetland reserves in Tianjin exhibited different distribution trends. The low value areas mostly consisted of scattered patches, median-value areas had the largest size, and high-value areas were the most concentrated.
(2) The spatial aggregation and total ESV varied under the different development models. Under the natural development scenario, the proportion of main land types was as follows: cultivated land (504.37 km2/52.06%) > water area (294.84 km2/30.43%) > bare land (0.99 km2/0.10%) > forest land (0.16 km2/0.02%) > grassland (0.03 km2/0.003%). Human intervention under different development goals will significantly affect the land use structure, although such interventions will have a limited effect on the dominant position of cultivated land and water.
(3) The various ESVs and individual ESVs of the four protected areas showed significant differences under the different development scenarios. Under the ecological protection scenario, the various ESVs and individual ESVs of the four protected areas increased, whereas under the economic development scenario, they decreased. The main reason for this is that the loss of the wetland water supply is more significant under the economic development scenario.
Data availability statement
Publicly available datasets were analyzed in this study. This data can be found here: http://doi.org/10.5281/zenodo.4417809.
Author contributions
AY: Data curation, Investigation, Writing – original draft. XG: Software, Writing – original draft, Methodology. HG: Methodology, Writing – review and editing, Formal Analysis. LM: Project administration, Validation, Writing – review and editing. WW: Methodology, Writing – review and editing, Validation.
Funding
The author(s) declare that no financial support was received for the research and/or publication of this article.
Conflict of interest
The authors declare that the research was conducted in the absence of any commercial or financial relationships that could be construed as a potential conflict of interest.
Generative AI statement
The author(s) declare that no Generative AI was used in the creation of this manuscript.
Publisher’s note
All claims expressed in this article are solely those of the authors and do not necessarily represent those of their affiliated organizations, or those of the publisher, the editors and the reviewers. Any product that may be evaluated in this article, or claim that may be made by its manufacturer, is not guaranteed or endorsed by the publisher.
References
Barbier, E. B. (2013). Valuing ecosystem services for coastal wetland protection and restoration: progress and challenges. Resources 2, 213–230. doi:10.3390/resources2030213
Barbier, E. B. (2019). “The value of coastal wetland ecosystem services,” in Coastal wetlands (Elsevier), 947–964.
Chen, G. P., Cheng, S. S., Liu, J., Cong, M. Y., Gao, X., Wang, H., et al. (2015). Physical-chemical properties of soil, C and N of three typical communities in Tianjin coastal wetland. Bull. Bot. Res. 35, 406–411. doi:10.7525/j.issn.1673-5102.2015.03.013
Costanza, R., d’Arge, R., De Groot, R., Farber, S., Grasso, M., Hannon, B., et al. (1997). The value of the world’s ecosystem services and natural capital. nature 387, 253–15. doi:10.1016/s0921-8009(98)00020-2
Cui, B., He, Q., Gu, B., Bai, J., and Liu, X. (2016). China’s coastal wetlands: understanding environmental changes and human impacts for management and conservation. Wetlands 36, 1–9. doi:10.1007/s13157-016-0737-8
Hamad, R., Balzter, H., and Kolo, K. (2018). Predicting land use/land cover changes using a CA-Markov model under two different scenarios. Sustainability 10, 3421. doi:10.3390/su10103421
Hu, L., Xu, N., Liang, J., Li, Z., Chen, L., and Zhao, F. (2020). Advancing the mapping of mangrove forests at national-scale using Sentinel-1 and Sentinel-2 time-series data with Google Earth Engine: a case study in China. Remote Sens. 12, 3120. doi:10.3390/rs12193120
Jiang, S., Xu, N., Li, Z., and Huang, C. (2021). Satellite derived coastal reclamation expansion in China since the 21st century. Glob. Ecol. Conservation 30, e01797. doi:10.1016/j.gecco.2021.e01797
Jiang, T., Pan, J., Pu, X.-M., Wang, B., and Pan, J.-J. (2015). Current status of coastal wetlands in China: degradation, restoration, and future management. Estuar. Coast. Shelf Sci. 164, 265–275. doi:10.1016/j.ecss.2015.07.046
Li, P., Chen, J., Li, Y., and Wu, W. (2023). Using the InVEST-PLUS model to predict and analyze the pattern of ecosystem carbon storage in Liaoning Province, China. Remote Sens. 15, 4050. doi:10.3390/rs15164050
Li, X., Hu, Q., Wang, Y., and Li, L. (2020). Preliminary analysis of land use change and its impact on flood in Taihu Basin from 2000 to 2020. 中国水利学会2020学术年会论文集第四分册, (Beijing,China) 5, 411–415. doi:10.26914/c.cnkihy.2020.069531
Liang, X., Guan, Q., Clarke, K. C., Liu, S., Wang, B., and Yao, Y. (2021). Understanding the drivers of sustainable land expansion using a patch-generating land use simulation (PLUS) model: a case study in Wuhan, China. Comput. Environ. Urban Syst. 85, 101569. doi:10.1016/j.compenvurbsys.2020.101569
Luo, G., Yin, C., Chen, X., Xu, W., and Lu, L. (2010). Combining system dynamic model and CLUE-S model to improve land use scenario analyses at regional scale: a case study of Sangong watershed in Xinjiang, China. Ecol. Complex. 7, 198–207. doi:10.1016/j.ecocom.2010.02.001
Ma, S., Huang, X., and Huang, J. (2024). Temporal and spatial variation of ecosystem service value and its trade-offs and synergies in the urban agglomeration around poyang lake. Res. Soil Water Conservation 31, 391–400. doi:10.13869/j.cnki.rswc.2024.03.028
Sang, L., Zhang, C., Yang, J., Zhu, D., and Yun, W. (2011). Simulation of land use spatial pattern of towns and villages based on CA–Markov model. Math. Comput. Model. 54, 938–943. doi:10.1016/j.mcm.2010.11.019
Schuerch, M., Spencer, T., Temmerman, S., Kirwan, M. L., Wolff, C., Lincke, D., et al. (2018). Future response of global coastal wetlands to sea-level rise. Nature 561, 231–234. doi:10.1038/s41586-018-0476-5
Shen, C. (2024). Study on the evolution of ecosystem service value and ecological compensation standard in Ningxia. Xi’an University of Technology. doi:10.27398/d.cnki.gxalu.2024.000892
Shuster, W., Bonta, J., Thurston, H., Warnemuende, E., and Smith, D. (2005). Impacts of impervious surface on watershed hydrology: a review. Urban Water J. - URBAN WATER J 2, 263–275. doi:10.1080/15730620500386529
Sun, Z., Sun, W., Tong, C., Zeng, C., Yu, X., and Mou, X. (2015). China’s coastal wetlands: conservation history, implementation efforts, existing issues and strategies for future improvement. Environ. Int. 79, 25–41. doi:10.1016/j.envint.2015.02.017
Wang, P., Lin, L., Peng, Y., Huang, Z., Song, C., Zhang, T., et al. (2024). The trend analysis of land-use structure change in Zhejiang Province based on CLUE-S Model. 生态科学 43, 196.
Wen, Y., Zhang, X., Wei, J., Wang, X., and Cai, Y. (2022). Temporal and spatial variation of ecosystem service value and its trade-offs and synergies in the peripheral region of the Poyang Lake. Scientia Geographica Sinica 42 (7), 1229–1238. doi:10.13249/j.cnki.sgs.2022.07.010
Wu, J., Feng, Z., Gao, Y., Huang, X., Liu, H., and Huang, L. (2012). Recent progresses on the application and improvement of the CLUE-S model. 地理科学进展 31, 3–10. doi:10.11820/dlkxjz.2012.01.001
Xie, G., Lu, C., Leng, Y., Zheng, D., and Li, S. (2003). Ecological assets valuation of the Tibetan Plateau. 自然资源学报 18, 189–196. doi:10.3321/j.issn:1000-3037.2003.02.010
Xie, G., Zhang, C., Zhang, L., Chen, W., and Li, S. (2015). Improvement of the evaluation method for ecosystem service value based on per unit area. 自然资源学报 30, 1243–1254. doi:10.11849/zrzyxb.2015.08.001
Xu, N., and Gong, P. (2018). Significant coastline changes in China during 1991–2015 tracked by Landsat data. Sci. Bull. 63, 883–886. doi:10.1016/j.scib.2018.05.032
Xu, H., Yang, C., and Li, Q. (2024). Spatial-temporal variations of ecosystem service value in Sanjiangyuan National Park. Chin. J. Ecol. 43, 1881. doi:10.13292/j.1000-4890.202406.008
Yu, W., Wu, T., Luo, Y., and Li, X. (2023). Spatiotemporal pattern evolution and driving mechanism of cultivated land in urbanization proces. J. Southwest Univ. Sci. Ed. 45, 147–159. doi:10.13718/j.cnki.xdzk.2023.07.013
Zhang, B. T., Li, Z., Feng, Q., Lu, Z. X., Zhang, B. J., and Cheng, W. (2024). Evolution of ecosystem service values in Qilian Mountains based on land-use change from 1990 to 2020. Acta Ecol. Sin. 44, 4187–4202. doi:10.20103/j.stxb.202211023130
Zhang, J., Yang, W., Li, J., Shen, S., Ma, L., and Chen, L. (2025). Spatio-temporal variation and driving factors of ecosystem services value in Beijing. Acta Ecol. Sin. 45, 306–318. doi:10.20103/j.stxb.202312312885
Keywords: coastal wetlands, satellite remote sensing, ecosystem service value, land use change, scenario simulation
Citation: Yue A, Guo X, Gong H, Ma L and Wang W (2025) Multi-scenario simulations of future land use and ecosystem services in wetland ecosystems of Binhai, Tianjin. Front. Environ. Sci. 13:1594401. doi: 10.3389/fenvs.2025.1594401
Received: 17 March 2025; Accepted: 27 May 2025;
Published: 23 June 2025.
Edited by:
Zhen Wang, Northwestern Polytechnical University, ChinaReviewed by:
Yu Li, Dalian University of Technology, ChinaHongyan Li, Jilin University, China
Jiapeng Huang, Liaoning Technical University, China
Copyright © 2025 Yue, Guo, Gong, Ma and Wang. This is an open-access article distributed under the terms of the Creative Commons Attribution License (CC BY). The use, distribution or reproduction in other forums is permitted, provided the original author(s) and the copyright owner(s) are credited and that the original publication in this journal is cited, in accordance with accepted academic practice. No use, distribution or reproduction is permitted which does not comply with these terms.
*Correspondence: Xueer Guo, Z3hlcjcxMTVAMTYzLmNvbQ==; Li Ma, bWFpbG1hbGlAMTYzLmNvbQ==; Wanfeng Wang, d2FuZ3dhbmZlbmdAdGouZ292LmNu