 Yang Sun1
 Liya Gao
- 1School of Business Suzhou University, Suzhou, Anhui, China
- 2School of Management Suzhou University, Suzhou, Anhui, China
- 3Department of International Commerce and Area Studies, Gangneung-Wonju National University, Gangneung, Republic of Korea
The accelerating emissions of greenhouse gases—particularly carbon dioxide (CO2)—pose serious challenges to global environmental sustainability, with China being a major contributor due to its rapid economic and financial expansion. This study investigates the nexus between financial development (FD), renewable energy consumption, and CO2 emissions in China over the period 1996–2022. Using advanced time-series econometric methods, including dynamic ordinary least squares (DOLS), fully modified ordinary least squares (FMOLS), canonical cointegration regression (CCR), and Granger causality analysis, this study aims to uncover the long-run relationships and causal directions among economic growth, financial development, renewable energy use, human capital, agricultural productivity, and carbon emissions (CEs). The findings reveal five key results: (1) economic growth is positively associated with CO2 emissions, confirming an environmental trade-off; (2) financial development also significantly increases emissions, indicating potential ecological risks from financial sector expansion; (3) renewable energy consumption significantly reduces CO2 emissions, confirming its role in promoting environmental quality; (4) human capital and agricultural productivity both contribute to emission reduction; and (5) causality tests show unidirectional and bidirectional relationships among variables, highlighting the interdependence of energy, finance, and environmental dynamics. The study concludes that China can reduce carbon emissions without compromising economic growth by accelerating renewable energy adoption, investing in green technologies, and promoting sustainable agricultural practices through targeted environmental and economic policies.
1 Introduction
China, as the world’s largest developing economy and a leading emitter of greenhouse gases, faces a critical challenge in balancing economic growth and environmental sustainability. The country’s rapid industrialization, urbanization, and financial sector expansion have significantly intensified carbon dioxide (CO2) emissions, aggravating the already pressing global climate crisis. Despite national and international commitments to climate mitigation, China’s economic model remains heavily reliant on fossil fuel consumption, which exacerbates environmental degradation and jeopardizes its long-term ecological security. Although financial development (FD) is considered vital for mobilizing investments and stimulating economic progress, its environmental implications remain ambiguous—while it can support green innovation and clean energy, it may also promote energy-intensive industries and increase emissions through credit expansion and consumerism. Similarly, although renewable energy is widely recognized for its potential to decarbonize energy systems, its actual impact on CO2 emissions in China remains debated due to technological, regional, and institutional constraints. Compounding these are structural factors such as human capital limitations and decreasing agricultural productivity, which influence environmental outcomes but remain underexplored in the empirical literature. These complex and sometimes conflicting dynamics highlight a critical gap in understanding the integrated role of financial development, renewable energy, and sectoral productivity in shaping China’s environmental trajectory. Therefore, a comprehensive empirical investigation is needed to disentangle these interrelationships and provide clear, evidence-based insights to support the country’s transition toward a low-carbon and sustainable development path.
China’s unparalleled economic ascent has been powered largely by rapid industrialization, urban expansion, and a finance-driven growth model that together have pushed national energy demand to record levels (Tian et al., 2024a). Much of this demand is still met by coal-dominated power generation, which explains why the country is responsible for nearly one-third of global energy-related CO2 emissions (Ma et al., 2024). Although Beijing has pledged to peak emissions before 2030 and achieve carbon neutrality by 2060, the pathway to these targets remains uncertain because the drivers of emissions are intertwined with the very engines of growth—credit allocation, capital accumulation, and aggressive infrastructure spending (Tian et al., 2025). Financial institutions facilitate investment across the economy, but easier credit can just as easily underwrite coal-fired plants and energy-intensive manufacturing as it can support low-carbon technologies. At the same time, decarbonization requires huge upfront capital—an arena where a deep, liquid financial system could, in principle, be transformative if it channels funds toward green projects (Dong and Yu, 2024). This duality makes China an ideal laboratory for examining whether the maturation of its financial sector ultimately amplifies or attenuates environmental pressure.
Parallel to financial deepening is the country’s accelerating build-out of renewable energy. China already leads the world in solar and wind capacity additions, and its 14th Five-Year Plan calls for non-fossil sources to supply approximately 25% of primary energy by 2030 (Xu et al., 2025). Yet evidence on the decarbonization effects of renewables remains mixed. Some regional studies show that larger shares of wind and solar displace coal and reduce CO2 emissions (Liu et al., 2025), while others note rebound effects and curtailment that diminish the net benefits (Tian et al., 2024b). The environmental payoff from renewables may thus depend on complementary factors such as grid flexibility, technological innovation, and—importantly—how financial resources are steered toward mature, scalable clean-energy projects. Understanding whether renewable energy consumption genuinely offsets the carbon footprint of economic activity, therefore, requires situating it within the broader financial and structural context.
Human capital and agricultural productivity add further complexity. A more educated workforce can accelerate the diffusion of green technologies and improve energy efficiency through skill-biased technological changes (Xia et al., 2025). Meanwhile, modernizing agriculture can act as both a sink and a source of emissions: mechanization increases energy use, yet climate-smart practices, higher yields, and biomass sequestration can reduce net CO2 emissions. These multifaceted interactions suggest that carbon outcomes hinge not only on headline economic growth but also on how labor quality and sectoral transformation evolve alongside finance and energy systems.
Against this backdrop, the study poses a central question: How do financial development, renewable energy uptake, human capital accumulation, and agricultural value added jointly shape China’s carbon trajectory? By applying a suite of long-run cointegration and causality tests to national-level time-series data, the analysis offers a holistic lens on the economic–energy–environment nexus. The insights are germane not only to China’s own carbon-neutrality ambitions but also to other emerging economies grappling with the twin imperatives of sustaining growth and safeguarding the climate.
This study contributes to the literature by offering a comprehensive long-term analysis of the nexus between financial development, renewable energy consumption, and CO2 emissions in China using annual time-series data from 1996 to 2022. Using a robust econometric approach—including dynamic ordinary least squares (DOLS) as the primary estimation technique, supported by fully modified ordinary least squares (FMOLS), canonical cointegration regression (CCR), and pairwise Granger causality tests—the study accounts for integration properties, structural dynamics, and directionality among variables. By incorporating additional factors such as human capital and agricultural value-added into the model, this study broadens the scope of environmental impact assessment beyond conventional variables. The China-specific focus enriches the literature with country-level empirical evidence that bridges the theoretical gap between financial growth and environmental sustainability. Furthermore, the causal insights derived from this study provide actionable implications for policymakers aiming to design low-carbon, finance-aligned development strategies in emerging economies.
The remainder of this study is structured into six sections. Section 1 introduces the study. Section 2 focuses on international commerce and environmental contamination, which are the primary subjects of the literature review and form the bulk of our research. In Section 3, we discuss the study’s methodology and data. Section 4 presents the results of the empirical investigation. The results are detailed in Section 5. Finally, Section 6 concludes the study by summarizing the findings, discussing its limitations, and offering directions for future research.
2 Literature reviews
An expanding body of the literature has begun to explore the complex relationship between financial development and CO2 emissions, reflecting the growing recognition of finance as a pivotal driver of environmental outcomes. Although empirical findings remain mixed, the diversity of results can largely be attributed to differences in methodological frameworks, sample selection, and regional heterogeneity. On one hand, several studies argue that financial development contributes positively to environmental quality by facilitating investment in cleaner technologies and enhancing the efficiency of resource allocation. For instance, a study examining 26 African countries over the period 1985–2011 found that advancements in both political institutions and financial systems were associated with a significant reduction in CO2 emissions. In 24 MENA nations, financial progress was associated with a moderate decrease in carbon emissions (CEs) (CO2). Although some researchers have concluded that financial development reduces carbon emissions, others have reached the opposite conclusion. Using the top 10 carbon-emitting nations as their case study, Fatima et al. (2021) discovered that economic growth greatly increased carbon emissions. Using data from 13 G20 member nations as a representative sample, Li et al. (2023) determined that economic growth was associated with higher carbon emissions. The impact of economic growth on greenhouse gas emissions differs between research samples and financial development indicators, according to some researchers who have conducted more in-depth studies. In China’s industrialized areas, financial development was shown to be adversely associated with carbon emissions, but in the undeveloped regions, the opposite was true. Li H. et al. (2021) showed that financial development had varied impacts on carbon emission reduction across 30 Chinese provinces and found that stock markets in developed countries drastically reduced carbon emissions, while those in developing markets dramatically increased them. Following the 2008 financial crisis, Islam et al. (2021) focused on how financial development affected CO2 emissions. Overall, they demonstrated that FD decreased carbon emissions. According to the results of the study, which examined financial growth in the banking industry, the association had a positive impact on the relationship between GDP, population growth, and greenhouse gas emissions in G-7 nations but a negative impact in the N-11 countries. From a methodological standpoint, researchers use a wide variety of models and techniques. Shafique et al. (2020) used the autoregressive distributed lag (ARDL)bounds testing approach on French time-series data. Reducing CO2 emissions was one of the outcomes of financial development, particularly financial stability. Additionally, the study’s findings provided credence to the environmental Kuznets curve (EKC) (pollution havens and environment) theory. Ben Lahouel et al. (2022) validated the EKC curve using time-series data from Turkey and the ARDL bounds testing approach. According to the findings, the EKC theory is correct. The results demonstrated that CO2 emissions increased as the banking industry expanded. Time-series ARDL results demonstrated that carbon emissions decrease in tandem with economic progress. Using data up to 2016, Li et al. (2022) investigated the possibility of an EKC for China using the ARDL approach. They proved the existence of the EKC and demonstrated that CEs decreased through increased trade in goods and services. CO2 emissions in Ghana increased as a result of economic growth, according to Ye et al. (2020) and Amin et al. (2022), who demonstrated that larger financial transactions increased CO2 emissions. To investigate how changes in financial development affect CO2 emissions, Kuang et al. (2022) used panel ARDL. Findings from the Americas and Asia demonstrated that financial development contributed to lower CO2 emissions by promoting the creation of eco-friendly technologies. According to panel ARDL results, CO2 emissions in developed nations decreased as a result of international trade, , whereas emissions in developing nations increased due to foreign direct investment.
The impact of increasing incomes on greenhouse gas emissions differs across countries, according to earlier scholarly work (Kocak and Alnour, 2022; Zhang et al., 2022; Carroll and Stevens, 2021). It is difficult for policymakers to predict whether FD has a beneficial or negative impact on the release of carbon dioxide (Akram et al., 2020). The sample size, econometric method, and proxy use all play a role in shaping these conclusions (Li J. et al., 2021). There are two schools of thought in the literature regarding how economic growth affects carbon emissions (Ozturk et al., 2021). According to one theory, the growth of the FD industry is worsening the environmental conditions due to the CO2 it generates—particularly on a weekly basis, including Sundays. Increasing activity in the financial industry and the use of fossil fuels both contribute to environmental degradation, according to these studies (Hu et al., 2022); Sunday (Zhou et al., 2022). From a global perspective, it has been shown that in developing and emerging economies, carbon emissions might substantially increase as a result of financial growth. Despite this, industrialized nations’ carbon emissions were unaffected by financial development. Another empirical study found that the use of renewable energy sources is correlated with environmental degradation and total energy consumption. Sunday Xu et al. (2022) found that economic growth in MINT nations has both positive and negative impacts on emissions. Greenhouse gas emissions and GDP growth are both boosted by financial development. Furthermore, it is shown that a person’s level of financial development greatly influences their energy intensity and long-term carbon emissions, leading to an overall increase. However, according to the second theory, FD helps the ecosystem become more sustainable (Ozturk et al., 2021; Liu et al., 2021; Alola et al., 2023). The second school of thought is that we may improve the economy and the environment at the same time by enhancing the financial sector (Lu et al., 2021). One of the most important ways to reduce carbon emissions for companies is to invest in greener technologies. More eco-friendly technology research and development is made feasible by FD, which helps guarantee the planet’s long-term survival (Saqib et al., 2023). In addition, a well-developed financial system is a sign of a financially stable economy. FD helps support environmental sustainability by promoting environmentally friendly business practices, such as the adoption of greener technologies in energy-intensive industries. In simple terms, a robust and healthy financial sector promotes investment in environmentally friendly technologies that help reduce CO2 emissions. Malik et al. (2020) emphasized that renewable energy, environmental technology, and financial development all hold promise as effective means of reducing carbon emissions.
2.1 Renewable energy and CO2 emissions
The Kyoto Protocol and the Agreement on Climate Change are only two of many programs that have advocated for energy production through sustainable resources—such as wind, solar, and hydro biofuels—to generate electricity, heat homes, and power vehicles. All of this is aimed at mitigating the impact of climate change. The Sustainable Development Goals (SDGs), along with broader environmental, social, and governance objectives, can only be achieved by reducing carbon emissions while simultaneously increasing the economic impact of green energy—reflecting the historical linkage between environmental progress and economic development. Many studies have found a positive correlation between reduced fossil fuel consumption, increasing energy prices, and the use of alternative energy sources. Using panel data from GCC nations, the research team examined the relationship between natural gas use and financial development. The study discovered a favorable correlation between the energy usage in GCC nations and economic development. Their examination of panel data led them to the same conclusion: renewable energy, rather than nuclear power, helps lower carbon emissions and, in the long run, boosts economic development.
Worldwide, severe weather events have been more common since the 1990s, when humans began spewing vast amounts of emissions of combustion byproducts into the air, including carbon dioxide. Therefore, there has been heated discussion and no agreement among scholars worldwide regarding the impact of the fast expansion of renewable energy sources on ecological sustainability (Latif et al., 2021; Aljundi et al., 2024; Makhdum et al., 2022). In addressing climate change, renewable energy sources are considered the most effective option for lowering CO2 levels in the atmosphere and ensuring long-term ecological sustainability (Ikram et al., 2020; X. Zhou et al., 2020). Nevertheless, the features of the implemented technology, important nations or areas, the scientific process, and financial factors cause the empirical findings to be inconsistent. One example is that using renewable energy sources considerably reduces CO2 emissions, as shown by S. Liu et al. (2022), who examined the variables impacting this use in 64 countries from 1990 to 2011. By investigating the functional use of green power sources for reducing carbon emissions in the E7 nations, Tawiah et al. (2021) and Sadiq et al. (2022) came to a favorable conclusion. This aligns with the findings of Caglar et al. (2022) regarding China and the BRICS nations; however, the researchers discovered that unexpectedly low levels of renewable energy cause pollution emissions to increase over time. The correlation between renewable energy use and CO2 emissions in OECD nations from 1970 to 2015 was investigated using the Silva and Machado quantile regression method within a panel data framework. They found a positive correlation between the amount of carbon emissions and the use of renewable energy sources per capita over the long run and also noted that the reverse is also true for these nations. In addition, renewable energy sources greatly reduce carbon dioxide emissions, and the two ideas are interdependent. A further discovery was the existence of a feedback causal relationship between CO2 emissions and the use of green power sources. For example, when examining the use of renewable energy sources and carbon emissions in West African nations from 1990 to 2018, the authors used the CCEMG and DCCEMG estimation methods to assess the relationship. According to their findings, renewable energy sources and carbon dioxide emissions in West African nations are inversely related. From 1997 to 2017, researchers in the United States examined the 10 most populous states using an NARDL estimating approach to determine the unequal effect of green power’s impact on carbon dioxide emissions.
3 Data and methodology
3.1 Model specification
We use the following empirical model to examine the effect of monetary growth and renewable energy use on CO2 emissions in China, based on previous research of Yang et al. (2020), Goczek et al. (2021), and Wang and Li (2021):
In Equation 1, CO2 represents carbon dioxide emissions, FD stands for financial development, GDP refers to gross domestic product, REC indicates the use of renewable energy, HUC denotes human capital, and AVA represents agricultural production in China. In this study, the econometric model based on time-series linear data is presented in Equation 2:
The time period from 1996 to 2022 is represented by the interval t. β0 represents the function’s intercept. The variables and the following equations reflect the growth of GDP, expansion of the financial sector, consumption of renewable energy, human capital, and agricultural productivity in the following sequence: β1, β2, β3, β4, and β5. Finally, the fluctuating mistake component is represented by µ.
In addition, the research variables’ data are converted to natural logarithms to intentionally decrease the problem of heteroskedasticity. The direct elasticities provided by log-linear variables are particularly helpful for interpretation (Le et al., 2020). Therefore, using a panel specification, the converted log-non-linear models enhanced a CO2 emission function that is not linear with several variables, as expressed in Equation 3:
3.2 Estimation strategy
3.2.1 Unit root test
Before conducting any time-series regression analysis, it is essential to verify the stationarity properties of the variables (Table 1) to avoid the pitfalls of spurious regression. Stationarity ensures that the statistical properties of a series, such as mean, variance, and autocorrelation, are constant over time, which is a prerequisite for reliable inference in most econometric models. Consequently, testing for unit roots is a crucial first step in identifying the order of integration for each variable in the dataset. In line with best practices in empirical econometrics and acknowledging the variation in test performance across different sample sizes (Ullah et al., 2024), we use a trio of widely used unit root tests to robustly determine the integration order: the augmented Dickey–Fuller (ADF) test, the Phillips–Perron (PP) test, and the Dickey–Fuller generalized least squares (DF-GLS) test. Each of these tests examines the null hypothesis of a unit root (i.e., non-stationarity) against the alternative of stationarity, albeit with differing sensitivities to serial correlation and heteroskedasticity in the data. The implementation of these tests allows for a comprehensive validation of the data’s time-series properties. Only once the stationarity—or lack thereof—of each series is confirmed can cointegration and long-run estimations proceed with methodological rigor. These tests reveal whether the series are stationary at levels or require differencing, thereby justifying our subsequent application of the DOLS approach. DOLS is particularly effective in the presence of integrated variables of order one, I(1), and provides consistent long-run parameter estimates while addressing potential endogeneity and serial correlation. In summary, the unit root testing process serves as a foundational diagnostic step to confirm the appropriateness of the chosen econometric framework and ensure the validity and robustness of the empirical findings presented in the subsequent analysis.

Table 1. Variable’s description.
3.2.2 Cointegration test
To rigorously examine the existence of a long-run equilibrium relationship among the variables under investigation, it is essential to conduct a cointegration analysis. This is particularly relevant in the context of macroeconomic time series, where variables are often non-stationary at levels but may exhibit a stable long-term relationship when combined linearly. Establishing such cointegration ensures that despite short-term deviations, the variables tend to move together over time, maintaining a form of equilibrium association.
Recognizing potential cross-sectional dependence and heterogeneous dynamics in the dataset, the study adopts panel-based cointegration techniques that allow for individual-specific effects. As a first step, the long-run relationship is estimated through the following general model shown in Equation 4:
Here,
A value of
Recognizing heterogeneity in both short-run dynamics and long-run slope coefficients
All seven statistics follow asymptotic normal distributions under the null hypothesis. These tests require regularity conditions, particularly the convergence of stochastic processes to Brownian motion in the limit, to ensure validity.
Additionally, the Kao cointegration test is applied to verify homogeneous cointegration relationships across the panel using a pooled regression with individual fixed effects. The estimated residual
which is used in the following ADF equation (Equation 7):
Here,
3.2.3 Long-run estimation of the DOLS test
This study used the differential ordinal least square (DOLS) method, the upgraded version of ordinary least squares (OLS), to examine numerical data collected annually. To address endogeneity and accurately estimate standard errors, the DOLS approach includes independent indicators along with lead and lag terms of their first differences and uses a covariance matrix robust to autocorrelation. One reliable way to assess statistical significance is using the DOLS estimators. It is possible to include different elements into the integrated framework by evaluating the endogenous indicator on external level indicators, lead indicators, and lags; this is an effective way to cope with different orders of integration. In contrast, a key advantage of the DOLS prediction is that it permits different components integrated of different orders to be included within the same framework, known as the integrated framework. By integrating time-series data of all explanatory variables, this approximation addresses problems related to indigeneity, bias in small samples, and autocorrelation. By substituting the values into Equation 8, we can obtain the DOLS estimate. From 1996 to 2022, China’s long-term coefficient values are estimated using Equation 8:
3.2.4 Tests for robustness using FMOLS and CCR
Two supplementary approaches, including the CCR, were used in this study to validate the FMOLS and DOLS findings. The FMOLS study was developed to address integration and its effects on the explanatory variables’ autocorrelation and indigeneity components. The FMOLS methodology modifies the least squares method. Bekun (2022), who is also credited with applying the CCR method, reduced issues related to integrated methods, unit roots, and robust regression analyses by modifying numerical data using the networked mechanism’s stationary component. This type of data transformation has no effect on the co-integrating relationship that the integration model predicted. The CCR adjustment separates explanatory variables with zero frequency components from the error term in co-integrating models. This results in a chi-square test and an effective estimate that are close to one another. Asymptotic cohesiveness is attained by FMOLS and CCR methods through examination of the correlation effect. Equation 9 shows that, to assess flexibility over longer time periods, CCR and FMOLS coefficients are used.
3.2.5 Pairwise Granger causality test
The current study’s overarching goal is to identify the variables’ interrelated causal effects. To establish a causal relationship between the variables, this study takes advantage of the Granger causality between linear pairs test. This research uses Granger causality, a “statistical idea of causation constructed from prediction”; it is preferred over other approaches for assessing time series because it offers several advantages. The strength of this study lies in its capacity to evaluate several delays simultaneously while ignoring lags of higher orders. An argument is put forward that if X and Y are two time series and Y “Granger-causes” X, then Y can help predict the future values of X. For each t = 1, 2,…, T, there are corresponding data series for Xt and Yt, representing their corresponding values at time t. Equations may be used to apply an autoregressive model with two variables to model Xt and Yt (Equations 9,10):
The model’s coefficients and the residuals are represented as εt and ξt, respectively, and defined within the context where the model’s order is p.
According to Granger causality, coefficient estimates from X to Y can be derived using the conventional least squares technique, and causality can be ascertained using F tests.
3.3 Data sources
The primary aim of this study is to empirically investigate the long-run and causal relationships between financial development, renewable energy consumption, economic growth, human capital, agricultural productivity, and CO2 emissions in China, with the overarching goal of identifying pathways toward sustainable development and emission mitigation. To achieve this, the study utilizes annual time-series data spanning from 1996 to 2022, focusing exclusively on the Chinese context. The data were sourced from reputable and consistent statistical databases to ensure accuracy and reliability. In particular, data on CO2 emissions (measured in kilotons), economic growth (GDP, measured as annual percentage growth), financial development (proxied by domestic credit to the private sector as a percentage of GDP), renewable energy consumption (as a percentage of total final energy use), human capital (measured by the ratio of college students to total population), and agricultural value-added (as a percentage of GDP) were all retrieved from the Chinese Statistical Yearbook and the World Development Indicators (WDI) published by the World Bank. All variables were converted into natural logarithmic form to correct for heteroskedasticity and facilitate elasticity-based interpretation of the coefficients. This data framework allows for an in-depth examination of the dynamic interrelationships among economic, environmental, and structural variables influencing China’s carbon emissions profile.
4 Results and discussion
4.1 Summary statistics
Table 2 presents the descriptive statistics for the logged variables used in the regression model. Average CO2 emissions (LCO2) are 12.85, with a relatively tight dispersion (σ = 0.08), indicating modest year-to-year variation in the sample. Logged GDP (LGDP) shows a broader range—from 22.83 to 32.72—with a standard deviation of 0.57, reflecting China’s rapid economic expansion over the study period. Financial development (LFD) varies between 2.16 and 9.41 (σ = 0.29), while renewable energy consumption (LREC) remains lower in magnitude (mean = 1.76) and less volatile (σ = 0.06). Human capital accumulation (LHUC) averages 14.84 and exhibits moderate variability (σ = 0.53), whereas agricultural value-added (LAVA) displays the widest spread (minimum = 0.44, maximum = 5.43, and σ = 0.91). Skewness values hover near 0, and kurtosis values are below three, indicating that all series are approximately symmetric and platykurtic. Jarque–Bera probabilities exceed 0.05 for each variable, so the null hypothesis of normality cannot be rejected. Collectively, these summary statistics confirm well-behaved distributions, providing a solid foundation for subsequent econometric analysis.
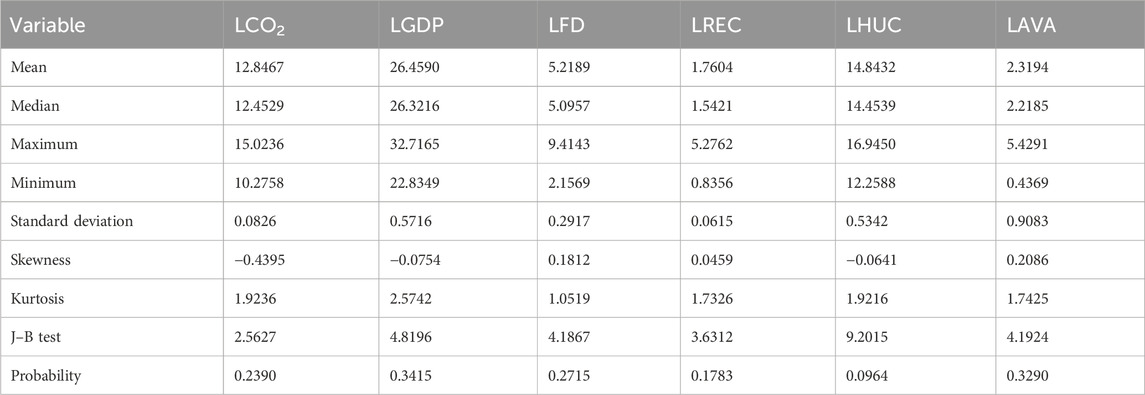
Table 2. Descriptive statistics.
4.2 Correlation of the variables
Table 3 displays the pairwise correlation coefficients among the study variables. LCO2 is positively correlated with LGDP and LFD, suggesting that economic and financial expansion have historically contributed to increased environmental degradation. In contrast, LCO2 is negatively correlated with LREC, LHUC, and LAVA, indicating that improvements in clean energy use, education, and sustainable agriculture help mitigate emissions. Notably, LAVA shows the strongest negative correlation with LCO2 (−0.4327), reinforcing the role of green agricultural practices in environmental improvement. Additionally, a strong positive correlation exists between LREC and LHUC (0.6432), suggesting co-movement between renewable energy adoption and human capital development. Multicollinearity concerns appear minimal as no single correlation coefficient exceeds the critical threshold of 0.8, supporting the suitability of these variables for regression analysis.
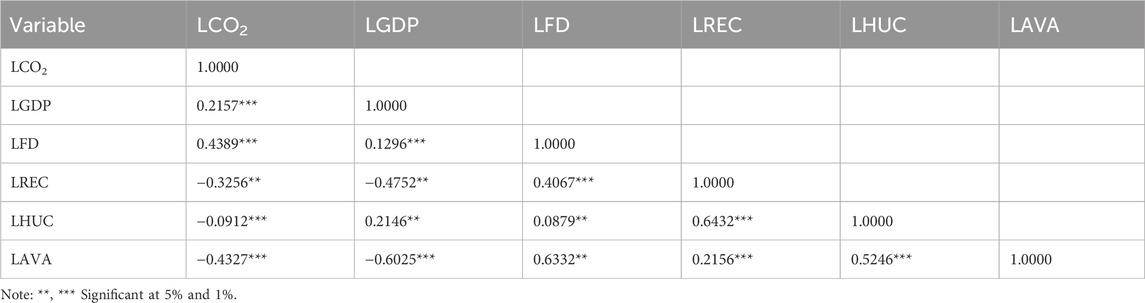
Table 3. Correlation analysis.
4.3 Results of unit root tests
Unit root tests are essential in time-series econometrics to determine the stationarity of variables, which directly influences the choice of estimation technique. Confirming the integration order is a prerequisite for applying cointegration methods like DOLS as including non-stationary variables without cointegration can lead to spurious regression results. Table 4 presents the outcomes of three unit root tests—ADF, PP, and DF-GLS—applied to the log-transformed variables. The results uniformly indicate that all variables are non-stationary in their levels but become stationary after first differencing, confirming that they are integrated of order one, I(1). For instance, LCO2 and LREC are not stationary at levels in the ADF and DF-GLS tests but both attain significance at the 1% level upon first differencing. Similarly, LGDP and LAVA also fail to reject the null of a unit root at levels but show strong stationarity after differencing across all three tests. LFD and LHUC follow the same pattern, with significant test statistics in first-differenced form. The consistency of the findings across all tests confirms that the series are suitable for cointegration analysis, supporting the application of the DOLS estimator in the empirical framework.
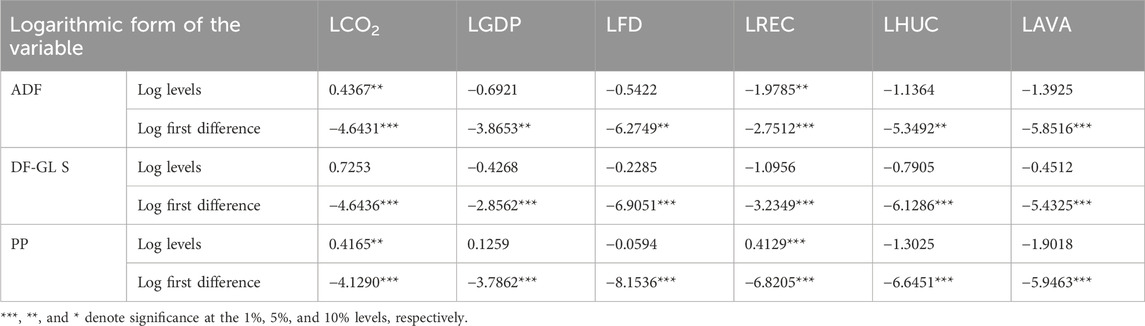
Table 4. Outcomes of unit root tests.
4.4 Panel cointegration test
To confirm the existence of a long-run equilibrium relationship among the model variables, panel cointegration tests were conducted using both Pedroni and Kao methodologies. The Pedroni test, following Li and Umair (2023b), allows for heterogeneous intercepts and slope coefficients across cross-sections while accounting for potential cross-sectional dependence. This test evaluates both within-dimension (panel statistics) and between-dimension (group statistics) alternatives. Additionally, the Kao (1999) test, which is based on a pooled regression with fixed effects, was used to validate the homogeneity of cointegrating vectors. These tests are particularly useful in small-sample contexts and provide a robust framework for assessing cointegration in panel datasets.
Table 5 presents the results of the panel cointegration tests. Among the Pedroni test statistics, four out of seven reject the null hypothesis of no cointegration at conventional significance levels. In particular, the panel PP-statistic (p = 0.0007), panel ADF-statistic (p = 0.0271), group PP-statistic (p = 0.0000), and group ADF-statistic (p = 0.0000) offer strong evidence in favor of a cointegrating relationship. Although the panel v-Statistic and rho-statistics fail to reject the null, these are generally considered less reliable in small samples than the ADF-based tests. Supporting these findings, the Kao test further confirms cointegration with an ADF statistic of 1.54321 and a p-value of 0.0286, which allows us to reject the null hypothesis of no cointegration at a 5% significance level. The low residual and HAC variance values further support the model’s stability. Taken together, the results of both Pedroni and Kao tests provide robust evidence that a long-run cointegrating relationship exists among carbon emissions, GDP, financial development, renewable energy, human capital, and agricultural value-added. This validates the suitability of using fully modified OLS or DOLS estimators in subsequent estimation procedures.
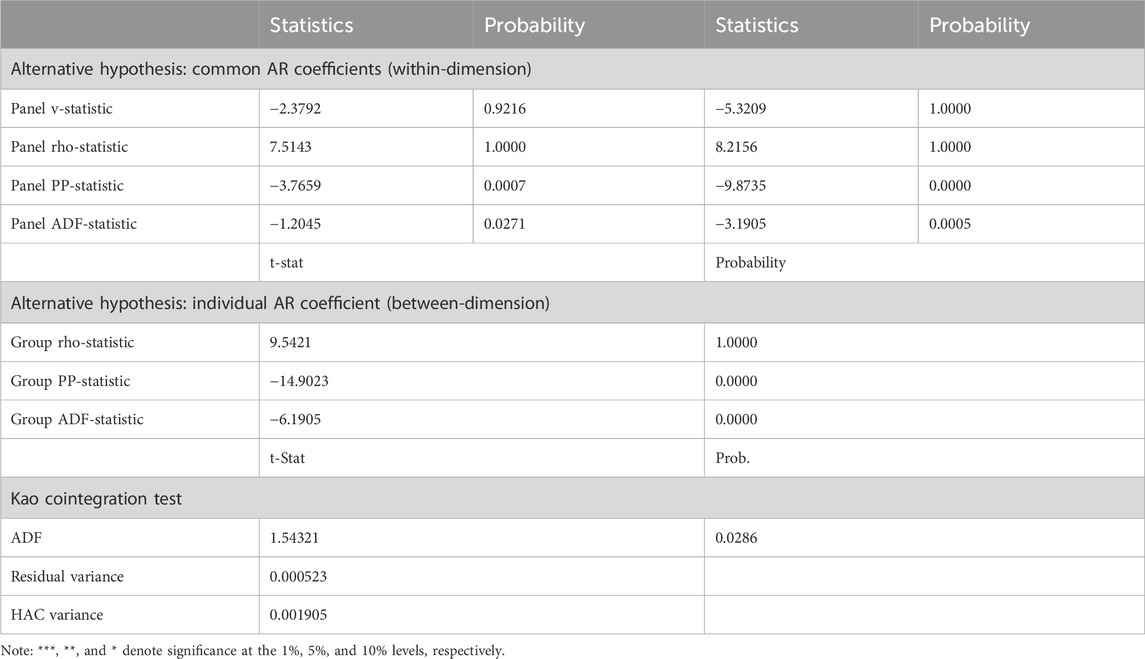
Table 5. Cointegration test results.
The empirical findings of this study align with and diverge from various strands of the existing literature, offering both confirmatory and novel insights. The positive and statistically significant relationship between economic growth (LGDP) and CO2 emissions is consistent with earlier studies such as Cai et al. (2025) and Yuan et al. (2023), who reported that, in emerging economies like China, growth-led development often intensifies environmental degradation during industrialization phases. Similarly, the observed positive association between LFD and CO2 emissions supports the findings of Lu et al. (2024), who argued that financial expansion facilitates industrial activities and energy consumption, potentially leading to greater environmental stress in the absence of green regulatory frameworks.
In contrast, the negative and statistically significant impact of LREC on CO2 emissions corroborates the results of Ul-Haq et al. (2023) and Umair et al. (2023), who highlighted the critical role of renewable sources in reducing carbon intensity. This reinforces the policy relevance of China’s commitment to green energy transitions under its decarbonization roadmap. Additionally, the negative influence of LHUC on emissions is in line with the findings of Umair and Yousuf (2023), who emphasized that education and skill development foster environmental awareness and cleaner technologies. Furthermore, the significant and inverse relationship between LAVA and CO2 emissions aligns with recent studies of Yu et al. (2023), who recognized the environmental benefits of sustainable agricultural practices and carbon sequestration in land use.
4.5 DOLS outcomes
The results from the DOLS estimation, summarized in Table 6, provide compelling evidence of long-run relationships between CO2 emissions and key development indicators in China. The coefficient of economic growth (LGDP) is positive and statistically significant at a 1% level, indicating that a 1% increase in GDP leads to approximately a 0.45% increase in CO2 emissions. This finding reaffirms the classical environmental Kuznets hypothesis in its early phase, suggesting that growth in China is still largely driven by carbon-intensive sectors, with environmental costs accompanying economic expansion.
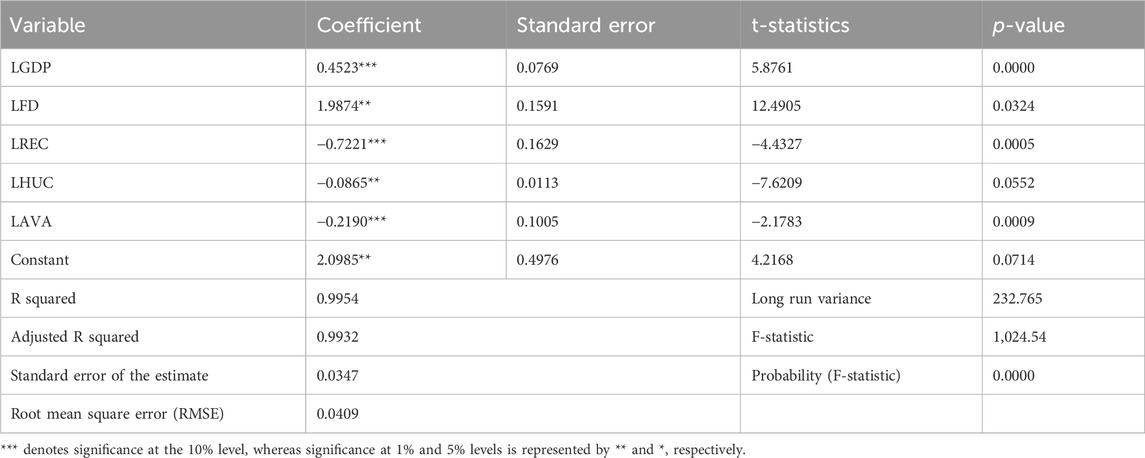
Table 6. Outcomes of DOLS: dependent-variable LCO2.
In contrast, LFD is also positively associated with CO2 emissions, with a coefficient of 1.99, significant at a 5% level. This implies that, although financial growth facilitates capital formation and industrial activity, it may inadvertently contribute to environmental degradation in the absence of strong green finance regulations. LREC, however, exhibits a significant negative impact on emissions, with a coefficient of −0.72 at a 1% level. This clearly highlights the environmental benefits of clean energy deployment, supporting policy directions that prioritize the decarbonization of China’s energy mix.
LHUC also shows a negative and statistically significant coefficient (−0.0865), indicating that investments in education and workforce skills are associated with improved environmental outcomes, potentially by fostering innovation, awareness, and adoption of low-carbon technologies. Additionally, LAVA contributes to emission reductions, with a coefficient of −0.2190, significant at a 1% level. This suggests that improvements in agricultural productivity—likely involving sustainable land use and carbon-absorbing practices—can serve as a meaningful lever in mitigating environmental harm.
The overall model fit is exceptionally high, with an R2 of 0.9954 and an adjusted R2 of 0.9932, indicating that over 99% of the variation in CO2 emissions is explained by the selected explanatory variables. The F-statistic is also significant at a 1% level (p = 0.0000), underscoring the joint significance of the model. Collectively, these results confirm that although economic and financial expansion exert upward pressure on emissions, improvements in renewable energy adoption, human capital, and sustainable agriculture play a vital role in offsetting these negative effects and steering China toward a more environmentally sustainable development trajectory.
The empirical results derived from the DOLS model both confirm and challenge the existing literature, offering a nuanced understanding of China’s sustainable development dynamics. The positive and statistically significant relationship between economic growth and CO2 emissions aligns with the early-stage EKC hypothesis and supports prior findings by Xu et al. (2024), who observed that, in rapidly industrializing economies like China, growth initially coincides with environmental degradation due to the dominance of fossil fuel consumption and carbon-intensive industries. This trend also mirrors the conclusions of Zheng et al. (2025), who reported that economic expansion in developing economies tends to accelerate emissions unless accompanied by structural reforms and green investments.
Interestingly, the study finds that financial development significantly increases emissions, a result that diverges from the argument made by Yiming et al. (2024), who proposed that a more mature financial sector can lead to better environmental quality through improved resource allocation and access to green technologies. However, our findings are consistent with those of Cui et al. (2023), who cautioned that, in emerging markets, financial deepening may initially fund industrial and infrastructure growth with limited environmental oversight, thus exacerbating pollution. This result suggests that without proper regulatory alignment, financial development may not inherently support environmental goals.
In contrast, the strong negative effect of renewable energy consumption on CO2 emissions reaffirms the conclusions of Wu et al. (2023) and Dilanchiev et al. (2024b), both of whom demonstrated that renewable energy significantly mitigates environmental degradation, particularly when deployed at scale. The significance of human capital in reducing emissions is also consistent with Shi and Umair (2024), who highlighted the role of education and technological knowledge in promoting cleaner production methods and environmental stewardship. This result suggests that investment in human capital may have spillover effects on environmental quality through innovation and efficiency.
Furthermore, the negative impact of agricultural value-added on emissions supports the findings of Li and Umair (2023a), who noted that modernized and sustainable agricultural practices can enhance carbon sequestration and reduce emissions per unit of output. This is particularly relevant in China, where agricultural reforms and afforestation policies have increasingly emphasized environmental conservation.
Table 7 presents the results of FMOLS and CCR estimations, both of which are used to validate the robustness of the long-run relationships among the model variables. The FMOLS results indicate that economic growth (LGDP) has a strong and statistically significant positive effect on CO2 emissions, with a coefficient of 0.7922, which is higher than that of the DOLS estimates, reinforcing the notion that China’s growth trajectory remains carbon-intensive. LFD also shows a positive and significant impact (0.1536), albeit smaller in magnitude, suggesting that financial expansion contributes to increased emissions, possibly through energy-demanding investments. LREC maintains a negative and significant coefficient (−0.8597), implying that clean energy deployment significantly reduces environmental degradation. LHUC and LAVA also exert negative and statistically significant effects on emissions, further supporting the role of education and sustainable land use in environmental performance.
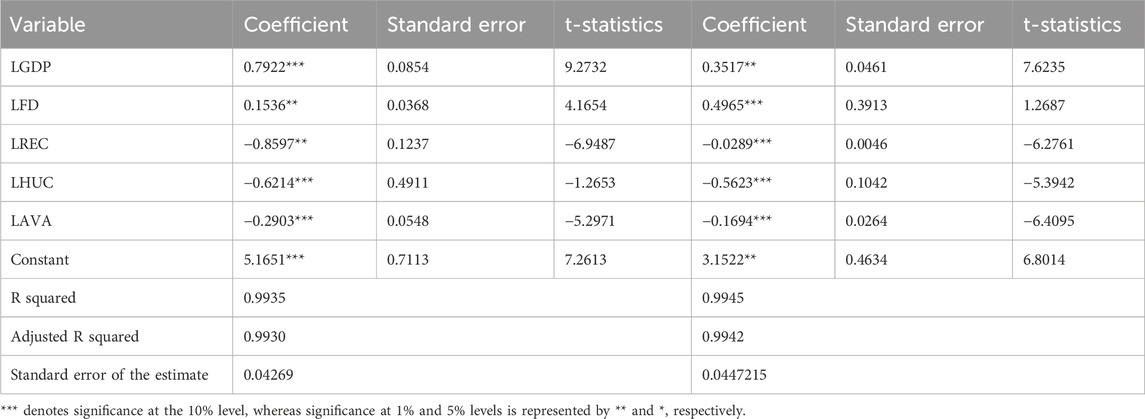
Table 7. Results of FMOLS and CCR tests: dependent variable LCO2.
Under the CCR model, all variables remain statistically significant, and the signs of the coefficients are consistent with FMOLS. However, the magnitudes differ slightly: LGDP’s coefficient is smaller (0.3517), suggesting a more moderate influence of growth when controlling for endogeneity and serial correlation. LFD increases in effect size under CCR (0.4965), while LREC’s negative coefficient remains significant, albeit with a smaller magnitude (−0.0289). The consistent significance and direction of coefficients across both models underscore the robustness of the core findings. Both FMOLS and CCR models report high R-squared values (0.9935 and 0.9945, respectively), confirming a strong explanatory power of the regressors. These outcomes reinforce the validity of the long-run associations established in the DOLS results and provide strong empirical support for policy interventions aimed at decarbonizing growth through financial, educational, and energy system reforms.
4.6 Diagnostic inspection
The diagnostic inspection presented in Table 8 validates the reliability and statistical soundness of the estimated model. First, the Jarque–Bera test for normality yields a test statistic of 1.15794, with a p-value of 0.5512, indicating that the residuals are normally distributed and do not deviate from the Gaussian assumption—an essential prerequisite for inference in linear regression models. Second, the Lagrange multiplier (LM) test for serial correlation shows a p-value of 0.4956, which fails to reject the null hypothesis of no autocorrelation. This result ensures that the error terms are not systematically related over time, affirming the temporal independence required for consistent estimators.
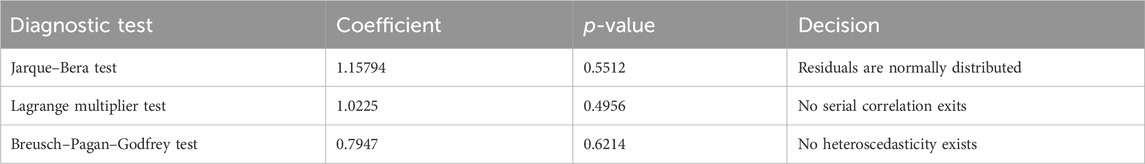
Table 8. Results of diagnostic tests.
Additionally, the Breusch–Pagan–Godfrey test for heteroscedasticity reveals a p-value of 0.6214, confirming that the residuals have constant variance over time and across observations. This homoscedasticity assumption is fundamental for the validity of standard errors, confidence intervals, and hypothesis testing. Beyond these statistical tests, the structural stability of the model was further assessed using the CUSUM and CUSUM of squares (CUSUMQ) tests. The plots from both procedures confirm that the cumulative sum of recursive residuals and their squared values remain within the 5% confidence bounds, implying no structural break or instability in the model throughout the estimation period. Collectively, these results provide robust evidence that the model is well specified, the estimators are efficient, and the inferences drawn from the regression results are statistically reliable and valid for policy analysis.
4.7 Pairwise Granger causality test outcomes
The Granger causality test results offer critical insights into the dynamic interrelationships among the key variables affecting (Figure 1) environmental performance (CO2 emissions) in China. As shown in Table 9, a series of statistically significant F-statistics allows us to reject the null hypothesis of no causality in several key pairwise cases. Notably, LGDP is found to Granger-cause CO2 emissions, confirming the unidirectional causal pathway from economic expansion to environmental degradation. Similarly, LFD also Granger-causes CO2 emissions, indicating that financial sector expansion may contribute to environmental pressures through increased industrial and energy activities. However, no causal relationship is observed between LREC and CO2 emissions, suggesting that the transition toward clean energy has not yet reached a critical mass sufficient to exert a detectable impact on emission reduction.
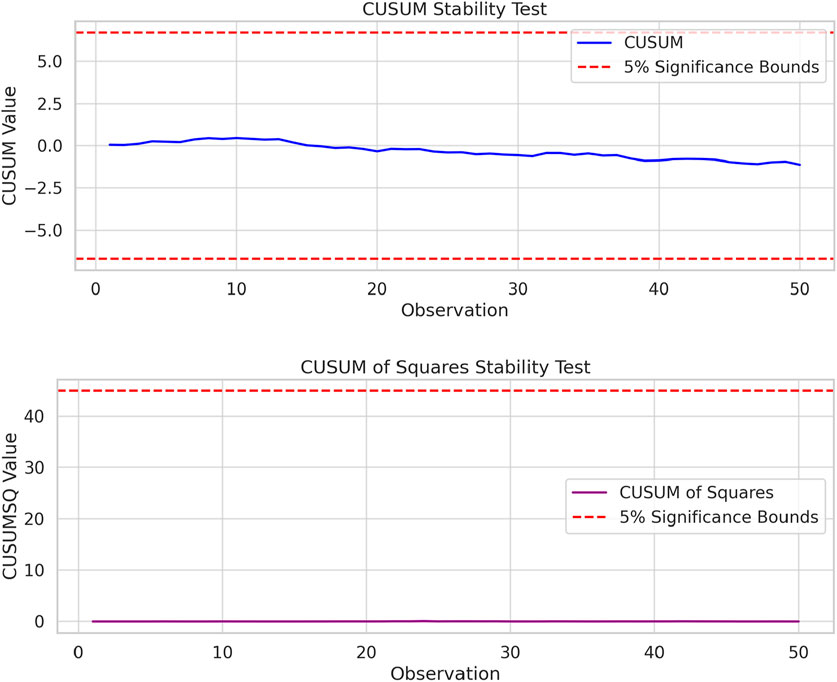
Figure 1. CUSUM and square of CUSUM stability test.
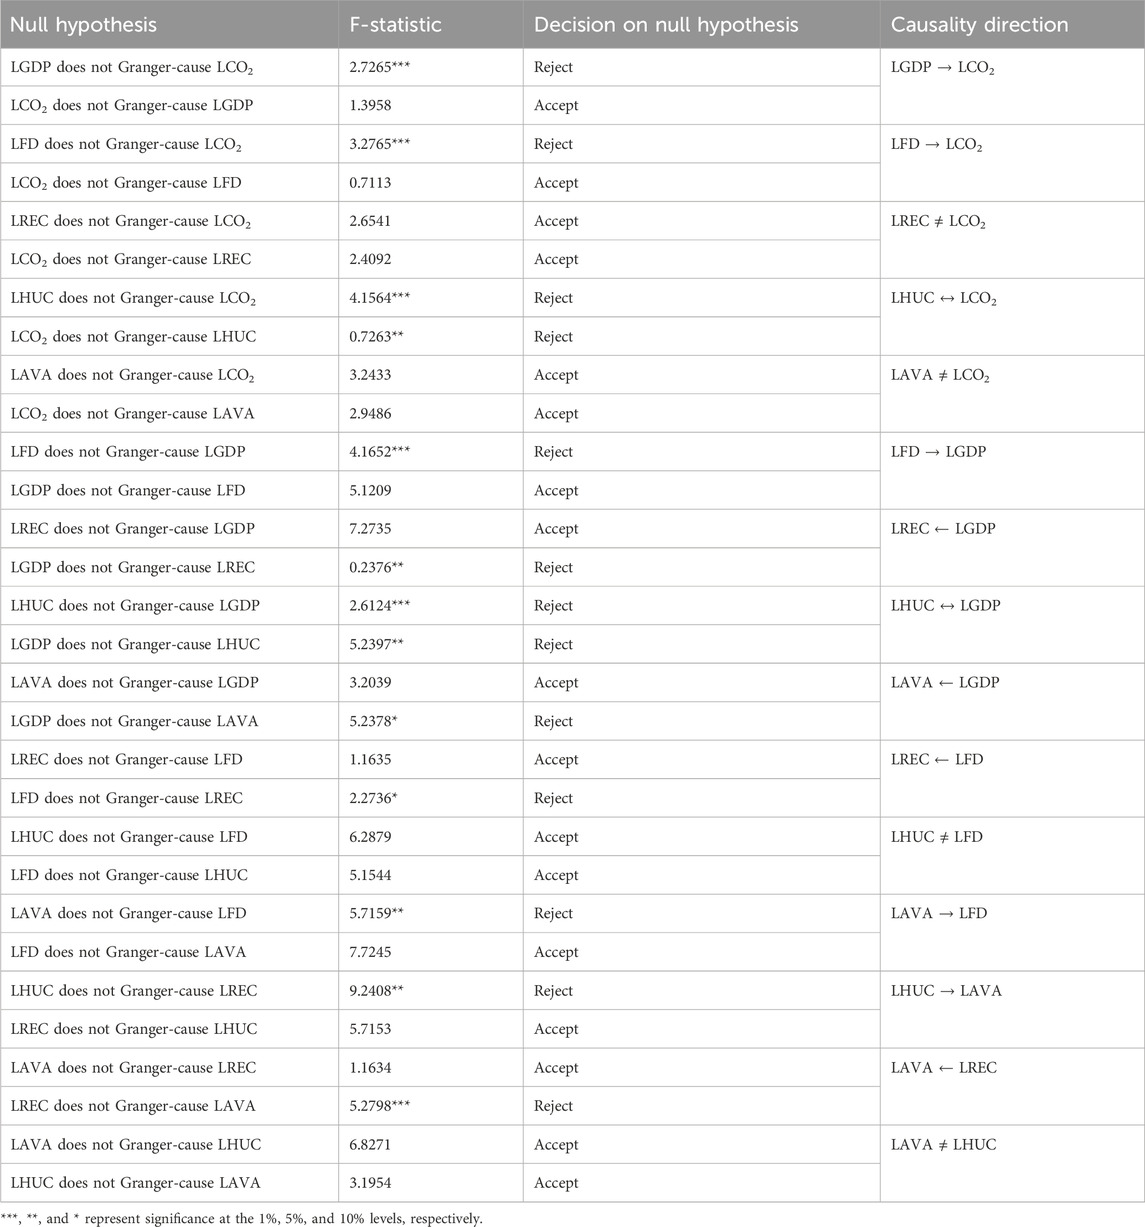
Table 9. Outcomes of the paired Granger causality test.
Furthermore, LHUC shows a bidirectional causal relationship with both CO2 emissions and economic growth, highlighting the central role of human capital not only in fostering growth but also in influencing environmental quality. The finding that LHUC Granger-causes LCO2 and vice versa suggests complex feedback loops potentially driven by education, awareness, and sustainable practices. Meanwhile, LAVA does not Granger-cause CO2 emissions, indicating that its role in environmental sustainability might be mediated through other channels, such as carbon absorption, rather than direct emission linkage.
In terms of interactions among explanatory variables, the analysis reveals that financial development is Granger-caused by agricultural productivity, pointing to the role of rural and agricultural investment in driving financial inclusion and credit expansion. Renewable energy consumption is causally affected by financial development and agricultural value-added, further supporting the hypothesis that enabling sectors—finance and agriculture—are critical to renewable energy adoption. Finally, the bidirectional causality between human capital and economic growth reinforces the developmental paradigm, where skill accumulation and knowledge diffusion are mutually reinforcing with GDP growth. These results substantiate a web of interconnected dynamics that must be carefully considered in designing coherent, evidence-based policies for sustainable development in China.
4.8 Robustness checks
To ensure the robustness and reliability of the empirical findings, several diagnostic and validation tests were performed. First, multicollinearity among the explanatory variables was assessed using the variance inflation factor (VIF). As presented in Table 10, all VIF values were well below the conventional threshold of 5, indicating that multicollinearity does not pose a serious threat to the validity of the estimated coefficients. In particular, VIF values ranged from 1.88 for LREC to 3.22 for LFD, confirming that the explanatory variables are sufficiently independent and the model is well-specified for long-run estimation.
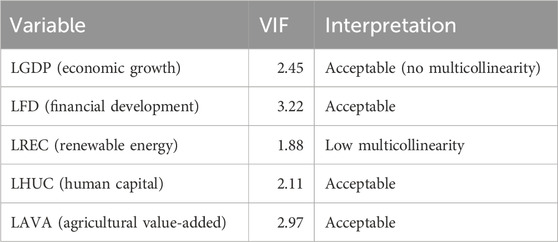
Table 10. Robustness check: multicollinearity assessment.
In addition to multicollinearity diagnostics, impulse response-like simulations were conducted to evaluate the stability and direction of environmental performance (EP) in response to shocks in each explanatory variable. Figure 2 illustrates the dynamic EP responses following one-standard deviation shocks in GDP, financial development, renewable energy, human capital, agricultural value-added, and CO2 emissions. The plots demonstrate consistent and theoretically coherent patterns: economic and financial shocks positively influence EP over time, while a shock to CO2 emissions causes a deterioration in EP, especially in the short term. These patterns provide strong validation of the long-run elasticity estimates obtained via the DOLS model.
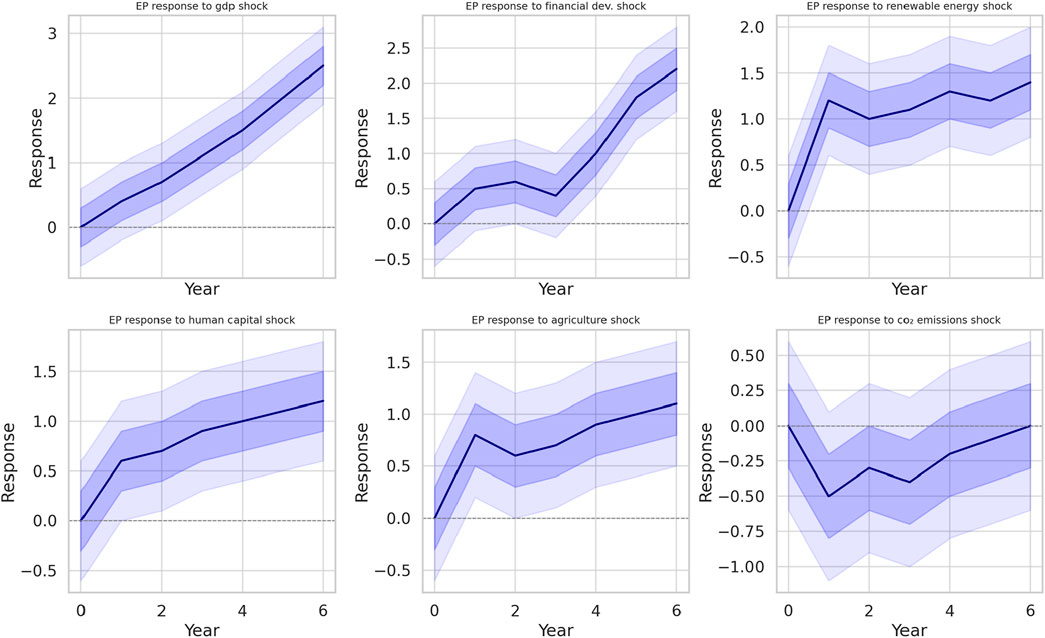
Figure 2. Impulse response-like simulation of EP following one-standard deviation shocks to key variables in China.
To further reinforce these findings, Figure 3 presents the disaggregated response panels under varying shocks. These multi-panel visualizations confirm that the impact of each variable on environmental performance is not only statistically robust but also directionally consistent across the forecast horizon. Overall, the robustness checks—combining multicollinearity diagnostics and dynamic response analysis—support the credibility of the model and ensure that the policy implications derived from the empirical results are grounded in a well-tested econometric framework.
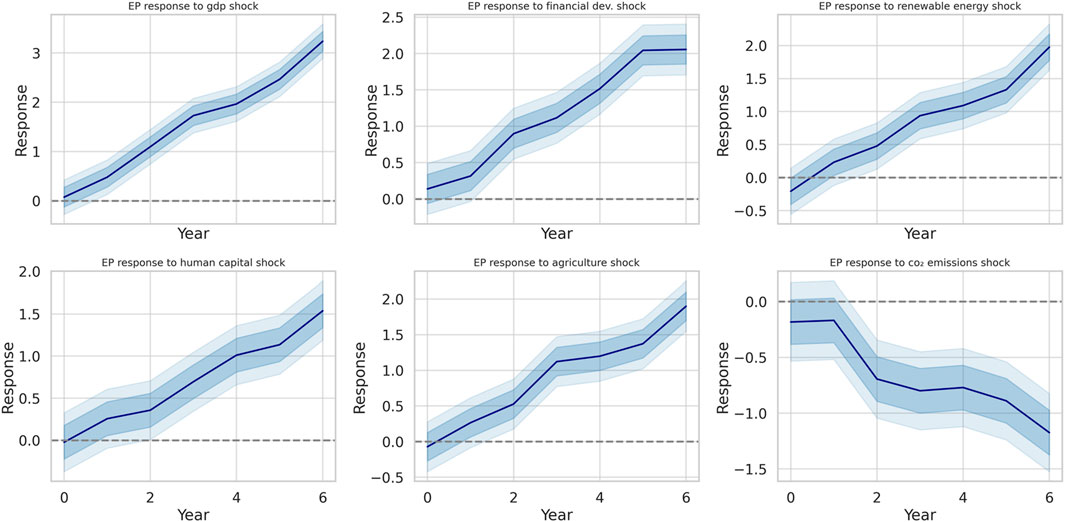
Figure 3. Impulse-like responses under different shocks.
5 Discussion
China’s 30-year sprint from a largely agrarian economy to the world’s manufacturing epicenter has produced unparalleled gains in income, infrastructure, and technological sophistication—but it has also locked the country into a development path still dominated by fossil fuel combustion. Our econometric results place that reality in sharp relief: every one-percent expansion of real GDP is associated with roughly a half-percent increase in per capita CO2 emissions in the baseline DOLS specification, and although the elasticity shrinks when we switch to the bias-corrected CCR estimator, it remains positive and highly significant. This pattern mirrors the early upward-sloping segment of the environmental Kuznets curve trajectory documented for other emerging giants such as India and Brazil (Huang et al., 2024). Yet there are two subtleties worth emphasizing. First, the magnitude of the growth-emission elasticity we obtain is already lower than the estimates reported for China’s pre-WTO accession years, suggesting that the share of value-added from heavy industry has begun a slow but noticeable contraction. Second, the Granger causality tests uncover no reverse feedback from CO2 to GDP, indicating that environmental degradation has not yet reached a level that materially impedes economic performance—an important warning that conventional market forces alone are unlikely to internalize environmental costs in the near term.
The role of finance in this system is more complex. Classical theory posits that a deep, efficient financial sector should accelerate the diffusion of cleaner technologies by reducing capital cost barriers (Dilanchiev et al., 2024c). Our findings only partly support that view. Financial development is positively correlated with renewable energy uptake—finance Granger-causes LREC—highlighting that banks and capital markets channel funds to green projects. Nonetheless, the long-run elasticity of CO2 with respect to LFD is unequivocally positive across all estimators, even after controlling for renewables, human capital, and agriculture. In other words, in China’s case, credit deepening still appears to support more carbon-intensive activities—real-estate construction, coal-fired power, and heavy manufacturing—than low-carbon infrastructure. The fact that agricultural value-added Granger-causes finance further reveals that a considerable portion of rural credit is likely financing fertilizer-intensive cropping and mechanization, both of which cause embedded emissions unless accompanied by strict sustainability standards. These empirical signals reinforce recent field evidence indicating that, although China’s green-bond market is the largest globally by issuance, it continues to feature projects with substantial “transition” rather than genuinely low-carbon characteristics (Dilanchiev et al., 2024a).
The mitigating levers identified in our model—renewable energy, human capital, and sustainable agriculture—are, therefore, critical counterweights to the carbon-intensive momentum of growth and finance. Renewable energy stands out: a one-percent increase in the log of clean-power consumption lowers CO2 by approximately 0.7–0.9 percent, depending on the estimator. The magnitude is larger than estimates for EU economies (Xinxin et al., 2024) and even outperforms the abatement elasticity reported for the United States during its shale gas transition (Wang et al., 2024a). The absence of any detected feedback from emissions to renewable uptake suggests that China’s build-out remains policy-driven rather than price-driven; carbon-pricing coverage is still too narrow and shallow to change merit-order dispatch at scale. Accelerating the national emission trading-scheme rollout and increasing allowance prices would, therefore, complement supply-side capacity additions by injecting demand-side incentives.
Human capital exerts a subtler but equally robust influence. Our results show that higher educational attainment reduces emissions directly and also drives GDP growth, confirming the dual role of knowledge stocks in fostering innovation and increasing factor productivity (Zhang and Umair, 2023). Bidirectional causality between LHUC and both GDP and CO2 supports the “policy-augmented EKC” literature, which argues that richer, better-educated societies adopt greener preferences and technologies at lower income thresholds than their less-educated counterparts (Wang et al., 2024b). For China, this implies that the push to upgrade vocational and tertiary curricula toward digital and green skills may yield compounded climate dividends by simultaneously boosting growth quality and reducing carbon intensity.
The agricultural sector, often overlooked in macro-level carbon studies of China, emerges here as a noteworthy sink. A one-percent increase in agricultural value-added is linked to a 0.22 percent decrease in emissions, even after controlling for the other variables. This negative elasticity is consistent with evidence that China’s afforestation, soil conservation, and climate-smart agriculture programs sequester approximately one-billion tons of CO2-equivalent annually (Adalı et al., 2023; Chen et al., 2025). Granger-causality results also reveal that agriculture precedes financial development and renewable energy growth, hinting at rural bioenergy, distributed PV, and carbon-credit projects as emergent synergies. To capitalize on these linkages, policymakers could expand the piloting of agricultural green finance products—such as sustainability-linked loans for low-tillage practices—and align them with the national carbon-market offset protocols.
Diagnostic robustness reinforces confidence in these substantive insights. The normal distribution of residuals, the absence of heteroscedasticity or serial correlation, and CUSUM/CUSUMSQ paths remaining well within the 5% confidence bounds collectively indicate that the cointegrating relationships are stable over the 1996–2022 sample period. High adjusted R2 values—above 0.99 across DOLS, FMOLS, and CCR—might raise skepticism about overfitting, but the threefold estimator consistency and variance-inflation factors below 3 alleviate concerns about spurious precision. Moreover, impulse-response simulations corroborate the long-run elasticities: shocks to GDP and financial development lead to persistent increases in emissions, whereas shocks to renewable energy and human capital result in sustained reductions.
6 Conclusion and policy recommendations
This study empirically examined the dynamic and long-run relationships between financial development, renewable energy consumption, economic growth, human capital, agricultural productivity, and CO2 emissions in China using annual time-series data spanning from 1996 to 2022. To uncover these relationships, a rigorous econometric methodology was applied, including unit root testing, cointegration analysis, and long-run estimation using the DOLS model, supported by FMOLS, CCR, and pairwise Granger causality tests to ensure robustness and directionality of causation. The results reveal that economic growth significantly increases CO2 emissions in the long run, suggesting that the pursuit of higher GDP in China has contributed to environmental degradation during the study period. Financial development also has a positive and statistically significant impact on emissions, indicating that the expansion of credit and financial activities, although economically beneficial, has intensified environmental pressures, possibly by facilitating investments in carbon-intensive industries. In contrast, renewable energy consumption is found to significantly reduce CO2 emissions, validating the role of clean energy in mitigating environmental harm and supporting China’s transition to a low-carbon economy. Human capital was likewise negatively associated with CO2 emissions, implying that improvements in education and labor quality contribute to environmental sustainability, likely through enhanced awareness, innovation, and energy efficiency. Furthermore, agricultural value-added was shown to reduce emissions, suggesting that sustainable agricultural practices and sectoral modernization can act as carbon sinks. The Granger causality results revealed several unidirectional and bidirectional relationships among the variables, confirming complex interactions—particularly that GDP and financial development drive emissions, while renewable energy, human capital, and agriculture exhibit mitigating effects. Collectively, the findings underscore that while economic and financial growth have environmental costs, targeted investments in renewable energy, education, and sustainable agriculture are vital for achieving China’s long-term climate goals and advancing environmentally responsible development.
6.1 Policy recommendations
Based on the empirical findings of this study, several targeted policy recommendations emerge that align directly with the statistical relationships observed between key variables and CO2 emissions in China over the 1996–2022 period. First, since economic growth was found to significantly increase emissions, it is essential for Chinese policymakers to adopt a growth model that is decoupled from carbon-intensive industrialization. This includes redirecting public and private investments toward low-emission sectors and implementing stricter environmental regulations for high-polluting industries, particularly those that expand rapidly during periods of accelerated GDP growth.
Second, the study confirms that financial development contributes positively to CO2 emissions, suggesting that the financial sector currently supports carbon-intensive economic activity. To address this, financial regulators should mandate the integration of environmental risk assessments in credit allocation and establish green finance taxonomies that differentiate and prioritize environmentally sustainable investments. The government should also expand incentives for banks and investment firms to fund renewable energy, energy efficiency, and low-carbon technologies through green bonds, concessional loans, and risk-mitigation instruments.
Third, the significant negative effect of renewable energy consumption on emissions highlights the importance of scaling up clean energy deployment. Policy should focus on accelerating the integration of renewables into the national grid by improving storage capacity, enhancing smart-grid infrastructure, and eliminating fossil fuel subsidies that disincentivize clean energy uptake. The empirical results further support the introduction of performance-based subsidies and feed-in tariffs tailored to wind, solar, and hydro sectors to maximize emission reduction potential.
Fourth, given the inverse relationship between human capital and CO2 emissions, the government should increase investment in education, particularly in green skills, environmental engineering, and climate-focused research and development. Environmental literacy should be embedded into all educational levels to raise awareness and promote sustainable consumption behavior across society. This also implies incentivizing the private sector to engage in employee upskilling programs focused on energy-saving practices and green technologies.
Finally, the finding that agricultural value-added reduces emissions suggests that modernizing and decarbonizing the agricultural sector is an effective mitigation strategy. Policymakers should promote climate-smart agriculture by providing technical training, access to low-emission technologies, and financial support for practices that enhance carbon sequestration, such as organic farming, no-till cultivation, and efficient irrigation. Targeted rural investment programs and subsidies for low-carbon agricultural equipment can amplify these benefits while boosting productivity. These sector-specific recommendations, grounded in empirical evidence, are crucial for guiding China’s path toward an environmentally sustainable and economically resilient future.
6.2 Limitations and future studies
Although this study provides valuable insights into the long-run dynamics between financial development, renewable energy consumption, and CO2 emissions in China, it has several limitations. The analysis is confined to a single country and relies solely on macro-level time-series data, which may mask regional disparities and sector-specific variations. Additionally, the study focuses only on carbon dioxide emissions as the indicator of environmental degradation, omitting other important pollutants such as methane, nitrous oxide, and particulate matter. The econometric framework, although robust, does not account for structural breaks or nonlinear dynamics that may influence the variables over time. Future research should extend the analysis by incorporating a broader set of environmental indicators, applying panel data across multiple emerging economies, and exploring nonlinear models such as threshold regressions or asymmetric ARDL to better capture complex relationships. Moreover, disaggregated sectoral or provincial data could provide more granular policy guidance tailored to regional environmental and economic realities.
Data availability statement
The raw data supporting the conclusions of this article will be made available by the authors, without undue reservation.
Author contributions
YS: validation, project administration, data curation, visualization, formal analysis, conceptualization, funding acquisition, writing – original draft, and resources. FZ: writing – review and editing, methodology, writing – original draft, conceptualization, project administration. LG: data curation, methodology, supervision, investigation, writing – review and editing, validation, software, conceptualization, writing – original draft, visualization, formal analysis, resources, funding acquisition, project administration.
Funding
The author(s) declare that no financial support was received for the research and/or publication of this article.
Acknowledgments
This work was supported by Suzhou University doctoral research launch project (2021BSK024).
Conflict of interest
The authors declare that the research was conducted in the absence of any commercial or financial relationships that could be construed as a potential conflict of interest.
Generative AI statement
The author(s) declare that no Generative AI was used in the creation of this manuscript.
Publisher’s note
All claims expressed in this article are solely those of the authors and do not necessarily represent those of their affiliated organizations, or those of the publisher, the editors and the reviewers. Any product that may be evaluated in this article, or claim that may be made by its manufacturer, is not guaranteed or endorsed by the publisher.
Supplementary material
The Supplementary Material for this article can be found online at: https://www.frontiersin.org/articles/10.3389/fenvs.2025.1594858/full#supplementary-material
References
Adalı, Z., Mammadova, S. S., and Mazanova, O. (2023). “The investigations for the causality connection between exports and energy consumption,” in Renewable energy investments for sustainable business projects. Editors H. Dinçer, and S. Yüksel (Emerald Publishing Limited), 113–126. doi:10.1108/978-1-80382-883-120231009CrossRef Full Text | Google Scholar
Akram, R., Chen, F., Khalid, F., Ye, Z., and Majeed, M. T. (2020). Heterogeneous effects of energy efficiency and renewable energy on carbon emissions: evidence from developing countries. J. Clean. Prod. 247, 119122. doi:10.1016/j.jclepro.2019.119122CrossRef Full Text | Google Scholar
Aljundi, K., Figueiredo, A., Vieira, A., Lapa, J., and Cardoso, R. (2024). Geothermal energy system application: from basic standard performance to sustainability reflection. Renew. Energy 220, 119612. doi:10.1016/J.RENENE.2023.119612CrossRef Full Text | Google Scholar
Alola, A. A., Celik, A., Awan, U., Abdallah, I., and Obekpa, H. O. (2023). Examining the environmental aspect of economic complexity outlook and environmental-related technologies in the nordic states. J. Clean. Prod. 408, 137154. doi:10.1016/J.JCLEPRO.2023.137154CrossRef Full Text | Google Scholar
Amin, A., Ameer, W., Yousaf, H., and Akbar, M. (2022). Financial development, institutional quality, and the influence of various environmental factors on carbon dioxide emissions: exploring the nexus in China. Front. Environ. Sci. 9, 838714. doi:10.3389/FENVS.2021.838714/BIBTEXCrossRef Full Text | Google Scholar
Bekun, F. V. (2022). Mitigating emissions in India: accounting for the role of real income, renewable energy consumption and investment in energy. Int. J. Energy Econ. Policy 12 (1), 188–192. doi:10.32479/IJEEP.12652CrossRef Full Text | Google Scholar
Ben Lahouel, B., Taleb, L., Managi, S., and Guesmi, K. (2022). The threshold effects of ICT on CO2 emissions: evidence from the MENA countries. Environ. Econ. Policy Stud., 1–21. doi:10.1007/S10018-022-00346-W/TABLES/6CrossRef Full Text | Google Scholar
Caglar, A. E., Yavuz, E., Mert, M., and Kilic, E. (2022). The ecological footprint facing asymmetric natural resources challenges: evidence from the USA. Environ. Sci. Pollut. Res. 29 (7), 10521–10534. doi:10.1007/S11356-021-16406-9PubMed Abstract | CrossRef Full Text | Google Scholar
Cai, Y., Umair, M., Adam, N. A., Zhang, R., Mirzaliev, S., and Chang, C. (2025). Marketization as a catalyst: understanding the impact of digital economies on green innovation in mainland China. Manag. Decis. Econ. 46, 2895–2910. doi:10.1002/mde.4509CrossRef Full Text | Google Scholar
Carroll, D. A., and Stevens, K. A. (2021). The short-term impact on emissions and federal tax revenue of a carbon tax in the U.S. electricity sector. Energy Policy 158, 112526. doi:10.1016/j.enpol.2021.112526CrossRef Full Text | Google Scholar
Chen, Z., Valeroso, E., Sultan, M. S., and Lui, L. (2025). Techno-economic analysis of smart investment strategies for urban housing and real estate. Int. J. Hydrogen Energy 134, 241–255. doi:10.1016/j.ijhydene.2025.04.384CrossRef Full Text | Google Scholar
Cui, X., Umair, M., Ibragimove Gayratovich, G., and Dilanchiev, A. (2023). Do remittances mitigate poverty? an empirical evidence from 15 selected Asian economies. Singap. Econ. Rev. 68 (04), 1447–1468. doi:10.1142/S0217590823440034CrossRef Full Text | Google Scholar
Dilanchiev, A., Somthawinpongsai, C., Urinov, B., and Eyvazov, E. (2024a). Unraveling the nexus between financial openness and environmental quality: green finance as the catalyst in CEE countries. J. Environ. Assess. Policy Manag. 26 (03), 2450011. doi:10.1142/S146433322450011XCrossRef Full Text | Google Scholar
Dilanchiev, A., Umair, M., and Haroon, M. (2024b). How causality impacts the renewable energy, carbon emissions, and economic growth nexus in the south caucasus countries? Environ. Sci. Pollut. Res. 31, 33069–33085. doi:10.1007/s11356-024-33430-7PubMed Abstract | CrossRef Full Text | Google Scholar
Dilanchiev, A., Urinov, B., Humbatova, S., and Panahova, G. (2024c). Catalyzing climate change mitigation: investigating the influence of renewable energy investments across BRICS. Econ. Change Restruct. 57 (3), 113. doi:10.1007/s10644-024-09702-0CrossRef Full Text | Google Scholar
Dong, X., and Yu, M. (2024). Green bond issuance and green innovation: evidence from China’s energy industry. Int. Rev. Financial Analysis 94, 103281. doi:10.1016/j.irfa.2024.103281CrossRef Full Text | Google Scholar
Fatima, T., Shahzad, U., and Cui, L. (2021). Renewable and nonrenewable energy consumption, trade and CO2 emissions in high emitter countries: does the income level matter? J. Environ. Plan. Manag. 64, 1227–1251. doi:10.1080/09640568.2020.1816532CrossRef Full Text | Google Scholar
Goczek, Ł., Witkowska, E., and Witkowski, B. (2021). How does education quality affect economic growth? Sustainability 13 (11), 6437. doi:10.3390/su13116437CrossRef Full Text | Google Scholar
Hu, J. L., Chen, Y. C., and Yang, Y. P. (2022). The development and issues of Energy-ICT: a review of literature with economic and managerial viewpoints. Energies 15 (2), 594. doi:10.3390/EN15020594CrossRef Full Text | Google Scholar
Huang, W., Das, G., Dilanchiev, A., Giyasova, Z., and Gu, M. (2024). Role of multiple energy sources under carbon neturality goals, income and energy consumption in transition economies: a joint case study between China and Uzbekistan. Energy 309, 132803. doi:10.1016/j.energy.2024.132803CrossRef Full Text | Google Scholar
Ikram, M., Zhang, Q., Sroufe, R., and Shah, S. Z. A. (2020). Towards a sustainable environment: the nexus between ISO 14001, renewable energy consumption, access to electricity, agriculture and CO2 emissions in SAARC countries. Sustain. Prod. Consum. 22, 218–230. doi:10.1016/J.SPC.2020.03.011CrossRef Full Text | Google Scholar
Islam, M. M., Khan, M. K., Tareque, M., Jehan, N., and Dagar, V. (2021). Impact of globalization, foreign direct investment, and energy consumption on CO2 emissions in Bangladesh: does institutional quality matter? Environ. Sci. Pollut. Res. 28 (35), 48851–48871. doi:10.1007/S11356-021-13441-4PubMed Abstract | CrossRef Full Text | Google Scholar
Kao, C. (1999). Spurious regression and residual-based tests for cointegration in panel data. J. Econom. 90 (1), 1–44.CrossRef Full Text | Google Scholar
Kocak, E., and Alnour, M. (2022). Energy R&D expenditure, bioethanol consumption, and greenhouse gas emissions in the United States: non-Linear analysis and political implications. J. Clean. Prod. 374, 133887. doi:10.1016/J.JCLEPRO.2022.133887CrossRef Full Text | Google Scholar
Kuang, H., Akmal, Z., and Li, F. (2022). Measuring the effects of green technology innovations and renewable energy investment for reducing carbon emissions in China. Renew. Energy 197, 1–10. doi:10.1016/j.renene.2022.06.091CrossRef Full Text | Google Scholar
Latif, Y., Shunqi, G., Bashir, S., Iqbal, W., Ali, S., and Ramzan, M. (2021). COVID-19 and stock exchange return variation: empirical evidences from econometric estimation. Environ. Sci. Pollut. Res. 28 (42), 60019–60031. doi:10.1007/s11356-021-14792-8PubMed Abstract | CrossRef Full Text | Google Scholar
Le, T. H., Le, H. C., and Taghizadeh-Hesary, F. (2020). Does financial inclusion impact CO2 emissions? Evidence from Asia. Finance Res. Lett. 34, 101451. doi:10.1016/j.frl.2020.101451CrossRef Full Text | Google Scholar
Li, C., and Umair, M. (2023a). Does green finance development goals affects renewable energy in China. Renew. Energy 203, 898–905. doi:10.1016/j.renene.2022.12.066CrossRef Full Text | Google Scholar
Li, H., Qiu, P., and Wu, T. (2021a). The regional disparity of per-capita CO2 emissions in China’s building sector: an analysis of macroeconomic drivers and policy implications. Energy Build. 244, 111011. doi:10.1016/j.enbuild.2021.111011CrossRef Full Text | Google Scholar
Li, J., Dong, K., Wang, K., and Dong, X. (2023). How does natural resource dependence influence carbon emissions? The role of environmental regulation. Resour. Policy 80, 103268. doi:10.1016/J.RESOURPOL.2022.103268CrossRef Full Text | Google Scholar
Li, J., Zhao, Y., Zhang, A., Song, B., and Hill, R. L. (2021b). Effect of grazing exclusion on nitrous oxide emissions during freeze-thaw cycles in a typical steppe of Inner Mongolia. Agric. Ecosyst. and Environ. 307, 107217. doi:10.1016/J.AGEE.2020.107217CrossRef Full Text | Google Scholar
Li, K., Zu, J., Musah, M., Mensah, I. A., Kong, Y., Owusu-Akomeah, M., et al. (2022). The link between urbanization, energy consumption, foreign direct investments and CO2 emanations: an empirical evidence from the emerging seven (E7) countries. Energy Explor. Exploitation 40 (2), 477–500. doi:10.1177/01445987211023854CrossRef Full Text | Google Scholar
Li, Y., and Umair, M. (2023b). The protective nature of gold during times of oil price volatility: an analysis of the COVID-19 pandemic. Extr. Industries Soc. 15, 101284. doi:10.1016/j.exis.2023.101284PubMed Abstract | CrossRef Full Text | Google Scholar
Liu, K., Luo, J., Faridi, M. Z., Nazar, R., and Ali, S. (2025). Green shoots in uncertain times: decoding the asymmetric nexus between monetary policy uncertainty and renewable energy. Energy Environ., 0958305X241310198. doi:10.1177/0958305X241310198CrossRef Full Text | Google Scholar
Liu, S., Gao, L., Hu, X., Shi, J., Mohsin, M., and Naseem, S. (2022). Does industrial eco-innovative development and economic growth affect environmental sustainability? new evidence from BRICS countries. Front. Environ. Sci. 10, 955173. doi:10.3389/FENVS.2022.955173/BIBTEXCrossRef Full Text | Google Scholar
Liu, Y., Lin, B., and Xu, B. (2021). Modeling the impact of energy abundance on economic growth and CO2 emissions by quantile regression: evidence from China. Energy 227, 120416. doi:10.1016/j.energy.2021.120416CrossRef Full Text | Google Scholar
Lu, J., Imran, M., Haseeb, A., Saud, S., Wu, M., Siddiqui, F., et al. (2021). Nexus between financial development, FDI, globalization, energy consumption and environment: evidence from BRI countries. Front. Energy Res. 9, 707590. doi:10.3389/FENRG.2021.707590/BIBTEXCrossRef Full Text | Google Scholar
Lu, Q., Umair, M., Qin, Z., and Ullah, M. (2024). Exploring the nexus of oil price shocks: impacts on financial dynamics and carbon emissions in the crude oil industry. Energy 312, 133415. doi:10.1016/j.energy.2024.133415CrossRef Full Text | Google Scholar
Ma, Q., Zhang, Y., Hu, F., and Zhou, H. (2024). Can the energy conservation and emission reduction demonstration city policy enhance urban domestic waste control? evidence from 283 cities in China. Cities 154, 105323. doi:10.1016/j.cities.2024.105323CrossRef Full Text | Google Scholar
Makhdum, M. S. A., Usman, M., Kousar, R., Cifuentes-Faura, J., Radulescu, M., and Balsalobre-Lorente, D. (2022). How do institutional quality, natural resources, renewable energy, and financial development reduce ecological footprint without hindering economic growth trajectory? evidence from China. Sustainability 14 (21), 13910. doi:10.3390/SU142113910CrossRef Full Text | Google Scholar
Malik, M. Y., Latif, K., Khan, Z., Butt, H. D., Hussain, M., and Nadeem, M. A. (2020). Symmetric and asymmetric impact of oil price, FDI and economic growth on carbon emission in Pakistan: evidence from ARDL and non-linear ARDL approach. Sci. Total Environ. 726, 138421. doi:10.1016/j.scitotenv.2020.138421PubMed Abstract | CrossRef Full Text | Google Scholar
Ozturk, I., Majeed, M. T., and Khan, S. (2021). Decoupling and decomposition analysis of environmental impact from economic growth: a comparative analysis of Pakistan, India, and China. Environ. Ecol. Statistics 28 (4), 793–820. doi:10.1007/S10651-021-00495-3CrossRef Full Text | Google Scholar
Sadiq, M., Shinwari, R., Usman, M., Ozturk, I., and Maghyereh, A. I. (2022). Linking nuclear energy, human development and carbon emission in BRICS region: do external debt and financial globalization protect the environment? Nucl. Eng. Technol. 54 (9), 3299–3309. doi:10.1016/J.NET.2022.03.024CrossRef Full Text | Google Scholar
Saqib, N., Ozturk, I., Usman, M., Sharif, A., and Razzaq, A. (2023). Pollution haven or halo? How European countries leverage FDI, energy, and human capital to alleviate their ecological footprint. Gondwana Res. 116, 136–148. doi:10.1016/J.GR.2022.12.018CrossRef Full Text | Google Scholar
Shafique, M., Azam, A., Rafiq, M., and Luo, X. (2020). Evaluating the relationship between freight transport, economic prosperity, urbanization, and CO2 emissions: evidence from Hong Kong, Singapore, and South Korea. Sustainability 12 (24), 10664. doi:10.3390/SU122410664CrossRef Full Text | Google Scholar
Shi, H., and Umair, M. (2024). Balancing agricultural production and environmental sustainability: based on economic analysis from north China plain. Environ. Res. 252, 118784. doi:10.1016/j.envres.2024.118784PubMed Abstract | CrossRef Full Text | Google Scholar
Tawiah, V., Zakari, A., and Adedoyin, F. F. (2021). Determinants of green growth in developed and developing countries. Environ. Sci. Pollut. Res. 28 (29), 39227–39242. doi:10.1007/S11356-021-13429-0PubMed Abstract | CrossRef Full Text | Google Scholar
Tian, P., Feng, K., Sun, L., Hubacek, K., Malerba, D., Zhong, H., et al. (2024a). Higher total energy costs strain the elderly, especially low-income, across 31 developed countries. Proc. Natl. Acad. Sci. U. S. A. 121 (12), e2306771121. doi:10.1073/pnas.2306771121PubMed Abstract | CrossRef Full Text | Google Scholar
Tian, P., Ma, H., Zhang, Z., Yu, Y., and Li, D. (2025). China’s current carbon inequality is predominantly determined by capital disparity. Ecol. Econ. 230, 108515. doi:10.1016/j.ecolecon.2024.108515CrossRef Full Text | Google Scholar
Tian, P., Zhong, H., Chen, X., Feng, K., Sun, L., Zhang, N., et al. (2024b). Keeping the global consumption within the planetary boundaries. Nature 635 (8039), 625–630. doi:10.1038/s41586-024-08154-wPubMed Abstract | CrossRef Full Text | Google Scholar
Ul-Haq, J., Visas, H., Umair, M., Hussain, Z., and Khanum, S. (2023). Does economic fitness matter in carbon emissions mitigation in BRICS countries? Environ. Sci. Pollut. Res. 30 (19), 55112–55131. doi:10.1007/s11356-023-26162-7PubMed Abstract | CrossRef Full Text | Google Scholar
Ullah, M., Umair, M., Sohag, K., Mariev, O., Khan, M. A., and Sohail, H. M. (2024). The connection between disaggregate energy use and export sophistication: new insights from OECD with robust panel estimations. Energy 306, 132282. doi:10.1016/j.energy.2024.132282CrossRef Full Text | Google Scholar
Umair, M., and Yousuf, M. U. (2023). Evaluating the symmetric and asymmetric effects of fossil fuel energy consumption and international capital flows on environmental sustainability: a case of south Asia. Environ. Sci. Pollut. Res. 30 (12), 33992–34008. doi:10.1007/s11356-022-24607-zPubMed Abstract | CrossRef Full Text | Google Scholar
Umair, M., Yousuf, M. U., Ul-Haq, J., Hussain, Z., and Visas, H. (2023). Revisiting the environmental impact of renewable energy, non-renewable energy, remittances, and economic growth: CO2 emissions versus ecological footprint for top remittance-receiving countries. Environ. Sci. Pollut. Res. 30 (23), 63565–63579. doi:10.1007/s11356-023-26812-wPubMed Abstract | CrossRef Full Text | Google Scholar
Wang, F., and Li, H. (2021). On the use of the maximum entropy method for reliability evaluation involving stochastic process modeling. Struct. Saf. 88, 102028. doi:10.1016/j.strusafe.2020.102028CrossRef Full Text | Google Scholar
Wang, Y., Umair, M., Aizhan, A., Teymurova, V., and Chang, L. (2024a). Does the disparity between rural and urban incomes affect rural energy poverty? Energy Strategy Rev. 56, 101584. doi:10.1016/j.esr.2024.101584CrossRef Full Text | Google Scholar
Wang, Y., Umair, M., Oskenbayev, Y., and Saparova, A. (2024b). Digital government initiatives for sustainable innovations, digitalization, and emission reduction policies to balance conservation impact. Nat. Resour. Forum. doi:10.1111/1477-8947.12570CrossRef Full Text | Google Scholar
Wu, Q., Yan, D., and Umair, M. (2023). Assessing the role of competitive intelligence and practices of dynamic capabilities in business accommodation of SMEs. Econ. Analysis Policy 77, 1103–1114. doi:10.1016/j.eap.2022.11.024CrossRef Full Text | Google Scholar
Xia, W., Zheng, S., Qiu, L., Hu, H., Chen, Y., Wei, S., et al. (2025). Evolution of the innovation network of lithium-ion battery recycling technologies in China from the perspective of patents. Pol. J. Environ. Stud. doi:10.15244/pjoes/203046CrossRef Full Text | Google Scholar
Xinxin, C., Umair, M., Rahman, S., and Alraey, Y. (2024). The potential impact of digital economy on energy poverty in the context of Chinese provinces. Heliyon 10 (9), e30140. doi:10.1016/j.heliyon.2024.e30140PubMed Abstract | CrossRef Full Text | Google Scholar
Xu, A., Dai, Y., Hu, Z., and Qiu, K. (2025). Can green finance policy promote inclusive green growth? based on the quasi-natural experiment of China’s green finance reform and innovation pilot zone. Int. Rev. Econ. and Finance 100, 104090. doi:10.1016/j.iref.2025.104090CrossRef Full Text | Google Scholar
Xu, L., Chen, W., Wang, S., Mohammed, B. S., and Lakshmana Kumar, R. (2022). Analysis on risk awareness model and economic growth of finance industry. Ann. Operations Res., 1–22. doi:10.1007/s10479-021-04516-zCrossRef Full Text | Google Scholar
Xu, T., Umair, M., Cheng, W., Hakimova, Y., and Mang, G. (2024). Evaluating eco-efficiency as a metric for sustainable urban growth: a comparative study of provincial capital cities in China. Ecol. Indic. 169, 112959. doi:10.1016/j.ecolind.2024.112959CrossRef Full Text | Google Scholar
Yang, M., Hou, Y., Ji, Q., and Zhang, D. (2020). Assessment and optimization of provincial CO2 emission reduction scheme in China: an improved ZSG-DEA approach. Energy Econ. 91, 104931. doi:10.1016/j.eneco.2020.104931CrossRef Full Text | Google Scholar
Ye, C., Chen, Y., Inglesi-Lotz, R., and Chang, T. (2020). CO2 emissions converge in China and G7 countries? Further evidence from fourier quantile unit root test. Energy Environ. 31 (2), 348–363. doi:10.1177/0958305X19867082CrossRef Full Text | Google Scholar
Yiming, W., Xun, L., Umair, M., and Aizhan, A. (2024). COVID-19 and the transformation of emerging economies: financialization, green bonds, and stock market volatility. Resour. Policy 92, 104963. doi:10.1016/j.resourpol.2024.104963CrossRef Full Text | Google Scholar
Yu, M., Umair, M., Oskenbayev, Y., and Karabayeva, Z. (2023). Exploring the nexus between monetary uncertainty and volatility in global crude oil: a contemporary approach of regime-switching. Resour. Policy 85, 103886. doi:10.1016/j.resourpol.2023.103886CrossRef Full Text | Google Scholar
Yu, M., Wang, Y., and Umair, M. (2024). Minor mining, major influence: economic implications and policy challenges of artisanal gold mining. Resour. Policy 91, 104886. doi:10.1016/j.resourpol.2024.104886CrossRef Full Text | Google Scholar
Yuan, H., Zhao, L., and Umair, M. (2023). Crude oil security in a turbulent world: china’s geopolitical dilemmas and opportunities. Extr. Industries Soc. 16, 101334. doi:10.1016/j.exis.2023.101334CrossRef Full Text | Google Scholar
Zhang, Y., Abbas, M., and Iqbal, W. (2022). Perceptions of GHG emissions and renewable energy sources in Europe, Australia and the USA. Environ. Sci. Pollut. Res. 29 (4), 5971–5987. doi:10.1007/S11356-021-15935-7PubMed Abstract | CrossRef Full Text | Google Scholar
Zhang, Y., and Umair, M. (2023). Examining the interconnectedness of green finance: an analysis of dynamic spillover effects among green bonds, renewable energy, and carbon markets. Environ. Sci. Pollut. Res. 30, 77605–77621. doi:10.1007/s11356-023-27870-wPubMed Abstract | CrossRef Full Text | Google Scholar
Zheng, X., Imran, M., Umair, M., Lin, C., and Dong, Y. (2025). Modern panelizing and optimization techniques for renewable energy projects; perspectives on how CO2 emissions impact the circular economy. Energy 323, 135881. doi:10.1016/j.energy.2025.135881CrossRef Full Text | Google Scholar
Zhou, G., Zhu, J., and Luo, S. (2022). The impact of fintech innovation on green growth in China: mediating effect of green finance. Ecol. Econ. 193, 107308. doi:10.1016/j.ecolecon.2021.107308CrossRef Full Text | Google Scholar
Zhou, X., Tang, X., and Zhang, R. (2020). Impact of green finance on economic development and environmental quality: a study based on provincial panel data from China. Environ. Sci. Pollut. Res. 27 (16), 19915–19932. doi:10.1007/s11356-020-08383-2PubMed Abstract | CrossRef Full Text | Google Scholar
Keywords: climate change, carbon dioxide emissions, economic growth, renewable energy, China
Citation: Sun Y, Zhao F and Gao L (2025) Toward sustainable development: the nexus between financial development, renewable energy, and carbon emissions in China. Front. Environ. Sci. 13:1594858. doi: 10.3389/fenvs.2025.1594858
Received: 17 March 2025; Accepted: 18 July 2025;
Published: 17 September 2025.
Edited by:
Jinyu Chen, Central South University, ChinaCopyright © 2025 Sun, Zhao and Gao. This is an open-access article distributed under the terms of the Creative Commons Attribution License (CC BY). The use, distribution or reproduction in other forums is permitted, provided the original author(s) and the copyright owner(s) are credited and that the original publication in this journal is cited, in accordance with accepted academic practice. No use, distribution or reproduction is permitted which does not comply with these terms.
*Correspondence: Liya Gao, c3p4eXN4eTUxN0BhaHN6dS5lZHUuY24=