 Zhe Pang
 Dongwen Hua1,2,3
 Juan Li
- 1Institute of Land Engineering and Technology, Shaanxi Provincial Land Engineering Construction Group Co., Ltd., Xi’an, China
- 2Shaanxi Agricultural Development Group Co., Ltd., Xi’an, China
- 3Technology Innovation Center for Land Engineering and Human Settlements, Shaanxi Land Engineering Construction Group Co., Ltd., Xi’an Jiaotong University, Xi’an, China
Introduction: Based on 2021–2023 meteorological data from the northern Qinling foothills.
Methods: This study reveals spatiotemporal variations in soil heat flux (G) and surface solar radiation and their correlations with environmental factors.
Results: Results show soil heat flux (G), measured at 5 cm depth, exhibits a distinct ‘S’-shaped diurnal pattern and seasonal differences, with correlations with surface radiation of R2 = 0.85 (daily scale) and 0.92 (monthly scale) (p < 0.001), respectively. Environmental temperature, soil moisture, and wind speed are significantly positively correlated with G (r = 0.72, 0.24, 0.27, respectively; p < 0.001), while rainfall and atmospheric pressure show negative correlations (r = −0.27, −0.70).
Discussion: These findings provide data support for studying energy exchange in regional soil-vegetation-atmosphere systems.
1 Introduction
The Qinling Mountains, a temperate-subtropical transition zone, are ecologically and geographically significant in disciplines such as ecology, geography, and soil and water conservation (Jiang et al., 2013). As a key geographic boundary in China’s mid-latitude region, the Qinling Mountains are a sensitive area for regional responses to and adaptations to global changes. Their unique geographic location makes them particularly valuable for research in geography, forest hydrology, and ecology. Most studies on climate change and environmental effects in the region have focused on the spatial and temporal changes in conventional hydrometeorological elements, such as temperature, precipitation, drought indicators and runoff, along with their interrelationships. Climate change research has also emphasized changes in vegetation cover, species diversity (animal and plant), and soil and water conservation. As the main driving force of terrestrial ecosystems and a crucial energy source for human activities, solar radiation directly affects the photosynthetically active radiation of vegetation and indirectly affects vegetation evaporation and soil moisture content. Soil, as the natural environment for plant survival, is a vital component of ecosystems and a key medium for energy exchange; Soil heat flux is a key component of the surface heat balance and an important physical parameter characterizing soil thermal conditions. This component directly influences soil temperature changes and is a crucial factor in the energy balance equation of forest ecosystems, substantially affecting the system’s energy closure (Jiang et al., 2013). Although soil heat flux may be numerically small in observations, this component is essential for evaluating energy closure at smaller time scales. Furthermore, changes in soil heat flux can have a substantial effect on the root uptake capacity of crops (Hurd and Craves, 1985). Wang Guosheng et al. analyzed the variation characteristics of each radiation flux and surface albedo at different time scales and under different weather conditions on the East Pamir Plateau (Wang et al., 2023). In addition, other scholars have also deeply analyzed the characteristics of the energy flat component of the subsurface of deserts (Chang et al., 2021; Li et al., 2022a; Cao et al., 2021), grasslands (Zhang et al., 2020; Li et al., 2021; Xiao et al., 2011) and farmlands (Chen et al., 2016; Wu et al., 2007). While numerous studies have focused on changes in rainfall and temperature in the Qinling regionexploring the spatial and temporal patterns and dynamics of climate, temperature, and rainfall in the northern and southern foothills of the Qinling Mountains, the impact of land heat flux on climate, energy balance, and vegetation types in the region is also substantial (Li et al., 2012; Bai, et al., 2012). For example, Sun Cheng et al. highlighted the importance of soil temperature (and changes in soil heat flux) for the emergence of Moso bamboo (Sun et al., 2013). Specifically, between March and May each year, when the soil temperature reaches 13 °C for a period of 10 days, Moso bamboo shoots begin to emerge from the ground.
Numerous studies have been conducted on surface solar radiation and soil heat fluxes in the regions such as the Tibetan Plateau (Ci et al., 2013; Gu et al., 2018; Zhang et al., 2021; Ma et al., 2005), southern subtropical mixed coniferous and broad forests (Wang et al., 2005), and the Minqin Desert area (Wang et al., 2004). However, studies on surface solar radiation and soil heat fluxes in the Qinling region are relatively limited. Soil heat flux (G) is defined as vertical heat transfer (W·m-2), with positive values indicating downward flow (heat sink) and negative values upward release (heat source). Surface solar radiation refers to total solar irradiance (W·m-2).
The seasonal dynamics of soil heat flux represent a critical component of surface energy partitioning and regional climate regulation. This is particularly true in ecologically sensitive areas with complex topography and distinct climatic transitions, such as the northern foothills of the Qinling Mountains (Qin et al., 2022). However, significant research gaps persist regarding the mechanisms by which soil heat flux variations regulate energy balance in this region. While existing studies have revealed universal patterns such as soil thermal lag effects (Zhang et al., 2011) and energy suppression during freezing periods, local observational data specific to the Qinling foothills remain scarce. As a product of coupled water-heat processes, soil heat flux dynamics are governed by the synergistic interactions of temperature, precipitation, wind speed, and biological activities. However, the mechanisms underlying these multi-factor interactions—and their specific impacts in the northern Qinling foothills—remain unclear. For example, precipitation events may modulate heat diffusion efficiency by altering soil water content, while wind disturbances could accelerate surface soil evaporative cooling, creating a competitive relationship with solar radiation-driven warming effects (Yang D. et al., 2024).
This study takes the northern foothills of the Qinling Mountains as the research object, continuously monitors the meteorological and soil data of this region from 2021 to 2023, and collates and analyzes the data. The 2021–2023 dataset includes normal climatic conditions and extreme events (such as 166 mm precipitation in August 2023), providing a robust basis for analyzing the responses of soil heat flux to diverse environmental stresses. By integrating multi-source observations and model simulations (Xu et al., 2021), this study focuses on the macro-scale impacts of soil heat flux on energy balance at seasonal scales, and then reveals micro-scale driving mechanisms from the perspective of multi-factor interactions. These two aspects form a progressive “phenomenon-mechanism” relationship. For the first time in the northern Qinling foothills, this research quantifies the coupling between soil heat flux and surface solar radiation across different time scales, as well as the mutual influence coefficients among environmental factors, soil heat flux, and surface solar radiation. The goal is to uncover the controls of regional climate and soil properties on energy exchange, provide multi-dimensional insights for studying energy cycles in mountain ecosystems, and offer a scientific basis for the sustainable management of mountain ecosystems.
2 Materials and methods
2.1 Experimental site
The test area is located at the Qinling Field Monitoring Center Station (34° 8′31 “E, 107° 53′24” N) of the Key Laboratory of Degraded and Unutilized Land Remediation of the Ministry of Natural Resources, at an elevation of 605.8 m. The study site in Meixian County, Baoji City, Shaanxi Province, on the northern side of the main peak of the Qinling Mountains, Taibai. Meixian County features loessial soils and a mixed deciduous broadleaf forest ecosystem, with an average annual temperature of 12.8 °C and precipitation of 581.6 mm, characteristic of warm temperate continental monsoon climates. This area is situated Meixian County, Baoji City, Shaanxi Province, on the northern side of the main peak of the Qinling Mountains, Taibai. The region falls under a warm temperate continental monsoon climate with characteristics of rain and heat in the same season. This area is characterized by large diurnal temperature variation, high rainfall, strong evaporation, and dryness; it also has an average annual temperature of 12.8 °C and receives an average precipitation of 581.6 mm per year.
Due to the influence of different surface covers on soil thermal conductivity and heat flux (Li et al., 2008; Fu et al., 2017), to eliminate potential impacts of vegetation coverage and micro-topography on heat flux measurements at the experimental site, this study adopted a bare ground treatment and established the experimental area in a relatively flat region.
2.2 Test facilities
The data source is the SMR-CR series environmental weather station at the Qinling Field Testing Center Station, established in May 2017 and put into operation thereafter. The station is equipped with CSI’s CR series data collector as the core, which connects various meteorological and ecological environmental sensors, including those for wind speed, wind direction, air temperature, air humidity, atmospheric pressure, rainfall (snow), surface solar radiation, and soil temperature, humidity, and salinity. The system is supported by the necessary chassis, brackets, and power supply (solar/AC) to form a complete, unattended field environmental monitoring station. The data collector serves as the core of the system, controlling its operation and storing raw data files for researchers to access and analyze.
The weather station is equipped with a CR1000 data collector from CSI, a TE525MM tipping bucket rain gauge (capable of measuring precipitation increments of 0.1 mm), a CMP3 total radiation meter, a Hydya Probe II soil temperature, moisture, and salinity probe, and two HFP01 soil heat flux panels. The two HFP01 soil heat flux plates used have a measurement range of −200 to 200 W/m2, a measurement precision of ±5% within the rated measurement range, a response time of less than 1 s, and adopt the thermocouple-based measurement principle, which can accurately capture the flux changes during the soil heat transfer process. Only the facilities relevant to the data presented in this paper are listed here.
2.3 Test methods
The experimental data, including surface solar radiation, rainfall, ambient temperature, soil temperature, and soil heat flux, were obtained from the environmental weather station, with data collected once every 30 min.
Daily statistics were calculated by averaging all data collected within a single day, and monthly statistics were derived by averaging the daily statistics.
Data Quality Control: Raw data were processed using the following steps: (1) Outliers were identified and removed using the 3σ criterion, with missing values imputed via linear interpolation based on adjacent measurements. (2) Soil heat flux sensors (HFP01) were buried at 5 cm depth to minimize surface disturbance and capture shallow soil flux relevant to vegetation root zones, with calibration performed annually using a heat flux standard (±5% accuracy). (3) For multivariate analysis, collinearity was assessed via variance inflation factor (VIF) values (<2, indicating no severe collinearity), and Pearson correlation assumptions (normality, linearity) were verified using Q-Q plots and scatter diagrams.
Total missing rate of 3-year (2020–2022) data was ∼3.2%; soil moisture had the highest missing proportion (1.5%) due to temporary sensor malfunctions, while other factors had <1% missing rate. Missing values were evenly distributed across seasons (3.0% spring, 3.5% summer, 3.1% autumn, 3.2% winter), with no concentration in extreme weather. Only 1-day missing data occurred in September 2021 (sensor calibration), accounting for 0.3% of total missing data. Using 2021 (2.1% missing rate) as the validation period: compared correlation coefficients between “interpolated data” and “original complete data—max daily difference = 0.02, monthly differences <0.01, indicating negligible impact of linear interpolation on key results.
The data were processed and plotted using Excel, and statistical analysis was performed using SPSS 19 software and Origin 2024.
3 Results and analysis
3.1 Patterns of changes in soil heat flux
3.1.1 Daily patterns of soil heat fluxes in different seasons
Soil heat flux is negative when the deeper soil layers release heat to the soil surface or the atmosphere, and positive when heat is transferred from the soil surface or the atmosphere to the deeper soil layers. The half-hourly continuous data of soil heat flux were averaged for each moment of the month to generate a graph showing the daily progression of the monthly average (Figure 1). Similarly, the data were averaged for each moment of the season to produce a graph illustrating the daily progression across different seasons (Figure 2).

Figure 1. Daily variation patterns of soil heat flux in different seasons: (a) Spring, (b) Summer, (c) Autumn, and (d) Winter. Figure caption: Error bars represent standard deviation (n=3 years for monthly data, n=12 months for seasonal data).

Figure 2. Daily variation patterns of soil heat flux in different seasons.
As shown in Figures 1, 2, the monthly average daily change process exhibits a clear “S” shape, with the daily change curve for each month showing distinct trends. A notable peak is also observed, which occurs consistently around 14:30 throughout the year. The size of the peak substantially varies across months, with the order being summer > spring > fall > winter. This peak indicates the maximum heat transfer from the soil surface or the atmosphere to the deeper soil layer. In winter, the peak value indicates the maximum heat transfer from the soil surface or atmosphere to the deep soil layer. The trough and peak values of soil heat flux in the early morning followed different trends, with the order being winter > spring > summer > fall. As the sun rose and set, the time at which the heat flux changed from negative to positive was gradually delayed, while the time for the change from positive to negative in the afternoon was gradually advanced. During the night, the change patterns for summer, fall, and winter were similar, with the values remaining relatively consistent across the seasons. The trough value indicates the maximum heat release from the deep soil layer to the soil surface or to the atmosphere. Although winter nighttime temperatures are the lowest, the heat release is not maximized because the soil temperature in winter is the lowest throughout the year, and the surface soil temperature (or atmospheric temperature) are also at their lowest. Therefore, the temperature difference is smaller, leading to less heat flux exchange during the night. The ‘S'-shaped diurnal variation in soil heat flux is primarily driven by solar radiation, which enhances soil surface temperature gradients and promotes downward heat conduction. Soil moisture and heat capacity further modulate peak flux values by altering thermal conductivity (Idso et al., 1975).
3.1.2 Monthly patterns of soil heat fluxes in different years
The pattern of change in the mean soil heat flux for each month of the three different years, namely, 2021, 2022, and 2023, is shown in Figure 3. Notably, the average soil heat flux is positive from March to August, with the soil acting as a “heat sink,” transferring heat from the atmosphere to the soil. In contrast, from September to February, the average soil heat flux is negative, indicating that the soil acts as a heat source, transferring heat from the soil to the atmosphere. Monthly soil heat flux variations are driven not only by solar radiation but also significantly modulated by rainfall and soil moisture. The maximum heat flux in 2023 and 2022 occurs in May instead of July and August when temperatures are highest. This anomaly may be related to local climatic characteristics. Specifically, the months of July and August experience higher rainfall and a greater number of rainy days. In May 2023, 65.2 mm of rainfall fell over 7 days, while June saw 87.2 mm of rainfall over 8 days, and July had 98.2 mm of rainfall across 16 days. Increased rainfall raises the water content of the soil, leading to greater heat storage within the soil and reducing the heat release to the atmosphere. For instance, in August 2023, 166 mm of rainfall fell across 16 days, followed by 10 days of rainfall. This higher moisture content in the soil limits the release of heat, supporting the conclusion of Sun Cheng that “soil moisture content and soil heat flux are negatively correlated (Sun et al., 2013)”, and is consistent with the statistically significant (p < 0.001) negative correlations between soil moisture content/rainfall and soil heat flux presented in Section 2.3 of this study. The negative minimum of soil heat flux in winter occurs during unstable months with considerable uncertainty, which is positively correlated with the daytime temperature differences across different winter months and years. In the northern Qinling foothills, intense summer solar radiation causes significant surface temperature elevation, creating a strong downward temperature gradient (surface temperature > deep soil temperature) that drives heat flux transfer to deeper soil layers (Wang et al., 2005). During winter, when radiation weakens, surface cooling forms a reverse gradient, leading to upward heat flux release. This dynamic process dominates the seasonal characteristics of regional energy balance by regulating the allocation ratio between surface sensible heat (H) and latent heat (LE).

Figure 3. Variation patterns of monthly average soil heat flux (W·m-2) in different years (2021–2023). Figure caption: Positive values indicate that the soil acts as a ‘heat sink’ (absorbing heat from the atmosphere),and negative values indicate that the soil acts as a ‘heat source’ (releasing heat to the atmosphere).
3.2 Patterns of change in surface solar radiation
3.2.1 Daily patterns of average solar radiation in different seasons
Surface solar radiation reflects sunrise time and light intensity, with evident seasonal differences. As shown in Figures 4, 5, the sunshine duration and light intensity are consistent with summer > spring > autumn > winter, and the difference in sunshine duration between summer (6:00–20:00) and winter (7:30–18:30) is 3 h. The daily variation of surface solar radiation shows the trend of “low in the morning and evening, high at noon” which is mainly due to the smaller solar altitude angle in the morning and evening and the less solar radiation reaches the opposite side. Therefore, the ground absorbs minimal solar radiation at noon. This finding is mainly due to the smaller solar altitude angle in the morning and evening. The solar radiation reaching the opposite side is minimal, and the solar radiation absorbed by the ground is small. Conversely, the opposite is true at noon. The maximum value of surface solar radiation occurs in May, and the minimum value occurs in October, which is not exactly positively correlated with the height of the monthly average temperature. Analysis results of the rainfall in these months (Table 1) reveal that rainfall or cloudy weather has a substantial influence on the solar radiation reaching the ground. This finding is due to the fact that with the increase in the amount of clouds in the sky on cloudy days, the amount of solar radiation received by the ground surface decreases, which is similar to that described in the work of Zhang Mingli in the paper “Rainfall impacts on solar radiation in Qinghai-Tibet”. This trend is consistent with the conclusion of Zhang Mingli in the study “Effect of rainfall on surface solar radiation in the permafrost region of the Tibetan Plateau” (Zhang et al., 2021).

Figure 4. Daily variation patterns of surface solar radiation. (a) Spring, (b) Summer, (c) Autumn, and (d) Winter. Figure caption: Error bars represent standard deviation (n=3 years for monthly data, n=12 months for seasonal data).

Figure 5. Daily variation patterns of surface solar radiation in different seasons.
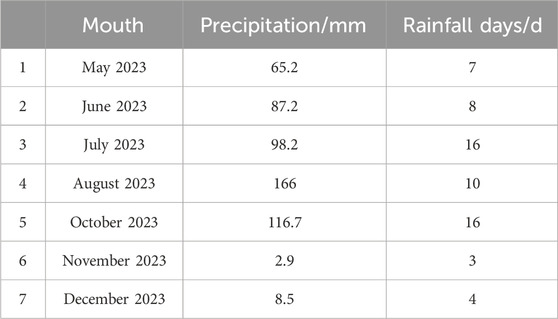
Table 1. Rainfall and rainy days in selected months of 2023 (source: SMR-CR weather station).
3.2.2 Monthly patterns of surface solar radiation in different years
Figure 6 illustrates the monthly changes in mean surface solar radiation over the 3 years. Clear seasonal differences are observed, with spring and summer exhibiting higher radiation levels than autumn and winter. This finding can be attributed to the higher solar altitude angles during spring and summer, compared to the lower angles in autumn and winter. The lower the sun’s altitude angle, the longer the distance light travels through the atmosphere, leading to greater energy attenuation. Additionally, during spring and summer, the Northern Hemisphere tilts toward the sun, which enhances solar radiation due to the favorable tilt of the Earth’s axis. However, the mean value of surface solar radiation only partially aligns with changes in the solar altitude angle and the Earth’s axis. This discrepancy is due to the unique climatic conditions in the northern foothills of the Qinling Mountains, where the test site experiences notable rainfall, accounting for more than 50% of the annual precipitation from June to August. The rainy weather and cloud shading reduce the amount of solar radiation reaching the ground.

Figure 6. Variation pattern of monthly mean surface solar radiation (W·m-2) in different years (2021–2023).
3.3 Multivariate interaction analysis between environmental factors and soil heat flux
Using annual daily data from 2023, we performed Pearson correlation analysis with Bonferroni correction (p < 0.001) to control for multiple testing errors. The Correlation Plot plugin in Origin 2024 was used to visualize pairwise relationships, with VIF values confirming no significant collinearity (all VIF<1.8). We conducted multivariate interaction analysis between Soil heat flux (soil-G-W) and eight environmental factors: ambient temperature (Ta), 20-cm soil temperature (Soil-T-20 cm), 20-cm volumetric soil moisture content (Soil-VWC-20 cm), wind speed (WS), atmospheric pressure (Pa), surface solar radiation (Solar-R), rainfall (Rain), and relative humidity (RH).
The Correlation Plot plugin in Origin 2024 was employed to analyze daily averages of these parameters. Notably, lag effects exist between some environmental variables and G: for example, rainfall events may suppress G for 1–2 days due to increased soil moisture reducing thermal conductivity—a pattern consistent with transient changes in soil thermal properties (Xu et al., 2013). As shown in Figure 7, surface solar radiation dominated soil heat flux variation with an statistically significant positive correlation (r = 0.83, p < 0.001), and environmental temperature showed a strong positive correlation with soil heat flux (r = 0.72, p < 0.001). Soil temperature at 20 cm, soil moisture at 20 cm, and wind speed showed significant positive correlations (r = 0.57, 0.24, and 0.27 respectively), while atmospheric pressure, rainfall, and humidity demonstrated significant negative correlations (r = −0.70, −0.27, and −0.18 respectively).

Figure 7. Heatmap of multivariate interaction analysis between environmental factors and soil heat flux.
3.4 Correlation analysis between surface solar radiation and soil heat flux on different time scales
Soil heat flux and solar radiation were averaged for each day from January to June 2023, and a binary regression analysis was performed on the two parameters. The daily soil heat flux and solar radiation showed a highly significant correlation with a significance level of 0.001, with a coupling relationship of Gsoil = 0.083RSolar-10.56 and a fitting coefficient of R2 = 0.8502, “Rsolar” is defined as surface solar radiation. as shown in Figure 8.

Figure 8. Analysis of the correlation between soil heat flux and surface solar radiation on a daily time scale.
Monthly mean values of soil heat flux and solar radiation were collected from January to June 2023. Regression analysis of their mean values showed highly significant correlation with a significance level of 0.001, as shown in Figure 9, with a coupling relationship of Gsoil = 0.0863RSolar-11.152 and a fitting coefficient of R2 = 0.9249.
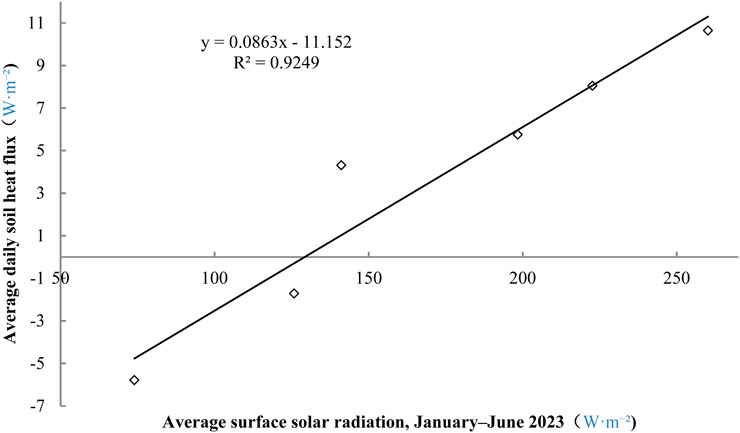
Figure 9. Correlation analysis of soil heat flux and surface solar radiation on a monthly time scale.
The correlation between soil heat flux and surface solar radiation was highly significant on daily and monthly scales. This finding is attributed to the fact that solar radiation is the main source of soil heat flux. During the fall and winter seasons or at night, the soil acts as a heat source, transferring energy from the soil to the atmosphere. In contrast, during the spring and summer seasons or during the daytime, when sunlight is more abundant, the soil functions as a heat sink, absorbing solar radiation and soring heat. However, considering the correlation coefficient, the relationship is more closely observed on the monthly scale, which is also consistent with the findings of Park et al. (2017), Sun et al. (2013) and Hu et al. (2014) who demonstrated the correlation between soil heat flux and net radiation. The clear linear relationship between soil heat flux and surface solar radiation in this study may also be related to the minimal influence of cover factors, such as plant leaf area index and canopy height, around the meteorological stations involved in this study. The stronger monthly-scale correlation (R2 = 0.92) compared to the daily scale (R2 = 0.85) may arise from two factors: (1) Thermal lag effects, where soil heat flux responds to radiation changes with a delay of 1–3 h (Li et al., 2022b); (2) Daily-scale measurement errors from turbulent flux fluctuations and short-term rainfall-induced soil moisture changes (Xu et al., 2013), which are mitigated by monthly averaging.
4 Discussion and conclusion
4.1 Analysis of variation patterns in soil heat flux and surface solar radiation
The results show that soil heat flux (G) exhibits pronounced diurnal variations and distinct seasonal characteristics. The diurnal amplitude of G is smaller in winter and largest in summer. During the daytime, as solar radiation increases after sunrise, heat flux transfers from the atmosphere and soil surface to deeper soil layers, leading to a rise in soil temperature. After sunset, as solar radiation decreases, heat flux shifts direction, transferring heat from deeper soil layers to the surface and atmosphere, accompanied by a decline in soil temperature. This demonstrates that soil temperature dynamics are governed by soil heat flux.
In the northern foothills of the Qinling Mountains, seasonal analysis reveals that G is positive (soil acting as a “heat sink,” with heat transferred from the atmosphere to the soil) during spring and summer, and negative (soil acting as a “heat source,” with heat released from the soil to the atmosphere) during autumn and winter. The timing of sign transitions varies across seasons. The monthly mean G remains positive from March to August (7.296 × 10³ MJ m-2), while it becomes negative from September to February, peaking at −22.58 MJ m-2 in December. These seasonal patterns are primarily driven by variations in solar radiation intensity.
On an annual scale, the soil acts as a net heat sink (7.296 × 10³ MJ m-2), while winter exhibits a net heat source (−4.197 × 104.1 MJ m-2). Annual surface solar radiation totals 1.721 × 10⁶ MJ m-2, with soil heat flux accounting for 2.44% of this total. Although this proportion is small, monthly-scale analysis reveals that G can contribute up to 9.41% of surface solar radiation (e.g., December). This highlights that soil heat flux cannot be neglected at finer temporal scales and significantly impacts assessments of ecosystem energy closure. These findings align with studies (Yue et al., 2012; Wang H. et al., 2022), which report that ignoring G reduces energy balance closure rates by 5%–8%. Seasonal variations in soil heat flux may influence local vegetation phenology. For example, the emergence of Moso bamboo shoots requires soil temperatures ≥13 °C for 10 consecutive days (Sun et al., 2013). The positive soil heat flux from March to May helps meet this temperature threshold, highlighting the agricultural and ecological guiding significance of studying soil heat flux.
4.2 Correlation analysis between environmental factors and soil heat flux
Multivariate interaction analysis of environmental factors and surface solar radiation indicates that solar radiation dominates soil heat flux dynamics. As the core driver of surface energy balance, solar radiation directly regulates net surface solar radiation (Rn) and indirectly influences soil thermodynamic processes, exerting a decisive control on Guo et al. (2015). Recent studies further confirm the direct regulatory role of solar radiation on soil heat flux (Zan et al., 2024; Wang Y. et al., 2022). Additionally, environmental factors such as air temperature, soil temperature, wind speed, air pressure, humidity, and soil moisture show significant correlations with G: Temperature modifies soil thermal properties (e.g., thermal conductivity and diffusivity) to directly influence heat flux (Park et al., 2017). Vertical soil temperature gradients are the primary driver of heat conduction, with larger temperature differences between surface and deeper layers amplifying G. During daytime surface warming, heat transfers downward (positive G); nighttime cooling reverses this process (negative G) (Miao et al., 2012; Liu et al., 2024). Global observations indicate that a 1 K soil temperature anomaly increases energy closure bias by over 3 W m-2, significantly elevating sensible heat flux (Fu et al., 2024). Soil moisture regulates G by altering soil heat capacity and thermal conductivity (Idso et al., 1975). Increased moisture replaces air in soil pores, enhancing thermal conductivity and heat transfer efficiency, thereby substantially impacting G calculations (Wu et al., 2020; Chang et al., 2021). Wind speed indirectly affects G through turbulent exchange. Strong winds accelerate surface evaporative cooling, reducing surface soil temperature gradients and suppressing heat transfer to deeper layers (Wu et al., 2020; Liu et al., 2024). Air pressure influences G via changes in air density and gas movement in soil pores. Under low-pressure conditions, reduced air density lowers thermal conductivity, potentially inhibiting heat transfer (Guo and Sun, 2002).
The combined effects of these environmental factors exhibit synergistic coupling. Future research must integrate multi-scale observations and dynamic models to improve the prediction accuracy of surface energy closure rates.
4.3 Correlation analysis between surface solar radiation and soil heat flux across temporal scales
Bivariate regression confirms a linear relationship between soil heat flux and surface solar radiation at both daily and monthly scales, with correlations reaching extreme significance (p < 0.01). The monthly-scale correlation is stronger (r = 0.9249), as daily-scale relationships are disrupted by transient meteorological disturbances (e.g., abrupt cloud cover, precipitation, and wind gusts) that cause asynchronous fluctuations between surface solar radiation and G. For example, precipitation alters soil moisture, thereby modifying thermal conductivity and heat transfer efficiency. While cloud cover may simultaneously reduce surface solar radiation, phase differences between radiation and G responses can span several hours (Xu et al., 2013). Additionally, diurnal variations in G exhibit significant thermal lag effects (Li et al., 2022b; Xu et al., 2013), and low energy balance closure rates (70%–90%) due to turbulent flux measurement errors and soil heat storage calculation biases further obscure daily-scale linear relationships (Xu et al., 2013; Yang D. et al., 2024).
In contrast, monthly averaging mitigates short-term noise, weakens thermal hysteresis, improves energy closure, and enhances seasonal synchrony, thereby strengthening the linear correlation between G and surface solar radiation (Yang Y. et al., 2024). This finding holds critical implications for parameterizing land surface models under mountainous terrain, such as refining the soil moisture-thermal conductivity modules in the Noah-MP model to account for the 1–2 days lag effect between rainfall and soil heat flux observed in this study. For the Community Land Model (CLM), our results support adjusting the energy closure algorithm to incorporate the stronger monthly-scale correlation (R2 = 0.92) between surface solar radiation and soil heat flux, reducing biases in mountainous energy balance simulations. Additionally, in the WRF-LSM model, the distinct diurnal ‘S'-shaped pattern of soil heat flux (driven by solar radiation) can inform improvements to the diurnal cycle parameterization of surface energy exchange in the Qinling foothills, enhancing the model’s ability to capture local microclimate dynamics. Monthly-scale data are better suited for long-term regional energy balance analysis, and future studies should quantify threshold effects of temporal scale transitions across ecosystems to optimize the spatiotemporal resolution of global energy balance simulations.
4.4 Global implications
The findings from this study highlight the unique energy exchange mechanisms in mid-latitude montane ecosystems like the northern Qinling foothills, contrasting with other globally studied regions such as the Tibetan Plateau and desert areas. For instance, soil heat flux in alpine grasslands of the Tibetan Plateau is predominantly driven by solar radiation and soil temperature gradients (Zhang et al., 2020; Li et al., 2022), with limited influence from soil moisture due to the arid climate. In desert ecosystems (e.g., Gurbantunggut Desert), surface solar radiation dominates heat flux dynamics, while soil moisture plays a negligible role in energy balance (Cao et al., 2021; Chang et al., 2021). By contrast, the Qinling foothills exhibit a more complex interplay of environmental factors: soil moisture (r = 0.24, p < 0.001) and wind speed (r = 0.27) significantly modulate heat flux, reflecting the region’s higher precipitation (581.6 mm/year) and loessial soil properties that enhance thermal conductivity during wet seasons (Fu et al., 2017).
This mid-latitude montane sensitivity to both radiative and hydrological processes underscores its role as a critical “energy buffer” in climate regulation. Unlike low-latitude tropical forests or high-latitude tundra, the Qinling system experiences distinct seasonal transitions in heat source/sink functions (positive flux from March to August, negative from September to February), which are tightly linked to monsoon-driven precipitation patterns. Such dynamics have broader implications for global land surface model parameterization, particularly in regions with similar climatic regimes (e.g., the U.S. Appalachian Mountains, European Alps). Incorporating soil moisture–radiation feedbacks observed here could improve the accuracy of energy balance simulations in mid-latitude mountainous zones, which are often underrepresented in global climate models (Yang Y. et al., 2024; Zan et al., 2024).
Chaturvedi et al. highlighted hydro-climatic dynamics in river systems, which is conceptually similar to the coupled soil-atmosphere-hydrology feedbacks in the Qinling region (Chaturvedi et al., 2024). Zhang et al. reviewed environmental biogeochemical cycles under external stressors, providing insights into the link between soil heat flux and biogeochemical processes in this study area (Zhang et al., 2024). Chaturvedi et al. discussed soil-ecology interactions, emphasizing that soil fauna and fungi may modulate heat transfer, which is a potential direction for future research in the Qinling foothills (Chaturvedi et al., 2025). These findings theoretically enhance our understanding of soil-vegetation-atmosphere energy exchange in mid-latitude montane ecosystems and practically support agricultural irrigation scheduling (e.g., optimizing water use based on soil heat flux dynamics), ecological restoration strategies and regional climate model parameterization. In the specific context of the northern foothills of the Qinling Mountains (our study area), such practical implications can be further illustrated through local scenarios: For one, soil heat flux (G) changes affect the phenology of local typical vegetation Quercus aliena var. acuteserrata—a rise in spring G advances its leaf emergence by 2–3 days, while a drop in autumn G delays leaf senescence by 1–2 days, which provides a clear basis for optimizing local ecological restoration planning. For another, regarding winter wheat (the main food crop in this region), when the daily average G during the jointing stage exceeds 8 W m-2, the soil maintains sufficient moisture for crop growth; farmers can thus adjust irrigation frequency from once every 7 days to once every 10 days, reducing seasonal water use by about 15% without impacting yield.
This study has two main limitations: (1) The single-site bare soil design may not fully represent vegetated areas; future studies should include vegetated plots (e.g., mixed deciduous broadleaf forests) to explore the impact of vegetation coverage on heat flux dynamics and enhance the generalizability of findings; (2) The 3-year dataset limits long-term trend analysis, necessitating multi-decadal observations in the future. Future research should integrate remote sensing data (e.g., MODIS land surface temperature) and WRF-LSM models to upscale the research scale and investigate soil heat flux responses to extreme climate events (such as prolonged droughts or heavy rainfall).
Data availability statement
The original contributions presented in the study are included in the article/supplementary material, further inquiries can be directed to the corresponding author.
Author contributions
ZP: Conceptualization, Writing – original draft, Data curation, Validation. DH: Writing – review and editing, Supervision, Conceptualization, Funding acquisition, Project administration. JuL: Formal Analysis, Writing – original draft, Conceptualization, Software. JiL: Writing – review and editing, Methodology, Software.
Funding
The author(s) declare that financial support was received for the research and/or publication of this article. This study received funding from Innovation Capability Support Program of Shaanxi (2024RS-CXTD-55), and the Technology Innovation Center for Land Engineering and Hu-man Settlements, Shaanxi Land Engineering Construction Group Co., Ltd. and Xi’an Jiaotong University (2024WHZ0243), Internal Scientific Research Project of Shaanxi Provincial Land Engineering Construction Group (DJNY2024-54) the Shaanxi Province key industrial chain project (2022ZDLNY02-04). The funder was not involved in the study design, collection, analysis, interpretation of data, the writing of this article, or the decision to submit it for publication.
Conflict of interest
Authors ZP, DH, JuL, and JiL were employed by Shaanxi Provincial Land Engineering Construction Group Co., Ltd. Authors ZP, DH, JuL, and JiL were employed by Shaanxi Agricultural Development Group Co., Ltd. Author DH is affiliated with the Innovation Center for Land Engineering and Human Settlements, a joint initiative between Xi’an Jiaotong University and Shaanxi Land Engineering Construction Group Co., Ltd.
This study received funding from Shaanxi Land Engineering Construction Group Co., Ltd. The funder was not involved in the study design, analysis, interpretation of data, the writing of this article or the decision to submit it for publication.
Generative AI statement
The author(s) declare that no Generative AI was used in the creation of this manuscript.
Any alternative text (alt text) provided alongside figures in this article has been generated by Frontiers with the support of artificial intelligence and reasonable efforts have been made to ensure accuracy, including review by the authors wherever possible. If you identify any issues, please contact us.
Publisher’s note
All claims expressed in this article are solely those of the authors and do not necessarily represent those of their affiliated organizations, or those of the publisher, the editors and the reviewers. Any product that may be evaluated in this article, or claim that may be made by its manufacturer, is not guaranteed or endorsed by the publisher.
References
Bai, H. Y., Ma, X. P., Gao, X., and Hou, Q. L. (2012). Variations in January temperature and 0 °C isothermal curve in Qinling Mountains based on DEM. J. Geogr. 67 (11), 1443–1450. doi:10.11821/xb201211001
Cao, J. C., Wang, Y., S, H., Ali, M., Liu, Y. Q., Zhao, X. S., et al. (2021). Characteristics of surface radiation budget in Gurbantunggut Desert. J. Desert Res. 41 (1), 47–58. doi:10.7522/j.issn.1000-694X.2013.00147
Chang, Y., Zhang, L., Ding, J., Xueqin, W., Xiaoxi, L., Yunhu, X., et al. (2021). Effects of soil moisture on surface radiation balance and water-heat flux in desert steppe environment of Inner Mongolia. Pol. J. Environ. Stud. 30 (2), 1881–1891. doi:10.15244/pjoes/127019
Chaturvedi, S., Chakraborty, B., Min, L., Kumar, A., Pathak, B., Kumar, R., et al. (2024). Exploring the dynamic microbial tapestry of South Asian rivers: insights from the Ganges and Yamuna ecosystems. Ecohydrology 17 (6), e2662. doi:10.1002/eco.2662
Chaturvedi, S., Kumar, A., Min, L., Mohan, K., Singh, N., and Kumar, R. (2025). Insights into earthworms and fungi: pioneering roles in mitigating global food scarcity and combatting land degradation. Land Degrad. and Dev. 36 (5), 1405–1429. doi:10.1002/ldr.5446
Chen, X., Yu, Y., Chen, J. B., Li, Z. C., Ma, C. C., and Xie, J. (2016). Seasonal variation of radiation and energy fluxes over the rainfed cropland in the semi-arid area of Loess Plateau. Plateau Meteorol. 35 (2), 351–362. doi:10.5846/stxb201503020452
Ci, N. M., Dan, L. B., Xuan, Y. J., and Chen, C. L. (2013). Characteristic of seasonal variation of surface radiation balance at Yangbajin in Qinghai-Xizang Plateau. Plateau Meteorol. 32 (5), 1253–1260. doi:10.7522/j.issn.1000-0534.2013.00036
Fu, Q., Yan, P., Li, T. X., Hou, R. J., Zhou, Z. Q., and Ma, Z. (2017). Influence of different coverage and meteorological factors on soil thermal conductivity and heat flux during freezing and thawing period. Trans. CSAE 33, 98–105. doi:10.11975/j.issn.1002-6819.2017.20.013
Fu, Z., Ciais, P., Wigneron, J. P., Gentine, P., Feldman, A. F., Makowski, D., et al. (2024). Global critical soil moisture thresholds of plant water stress. Nat. Commun. 15, 4826. doi:10.1038/s41467-024-49244-7
Gu, X. Y., Ma, Y. M., Ma, W. Q., and Sun, F. L. (2018). Climatic characteristics of surface radiation flux over the Qinghai-Tibetan Plateau. Plateau Meteorol. 37 (6), 1458–1469. doi:10.7522/j.issn.1000-0534.2018.00001
Guo, W., and Sun, S. (2002). Preliminary study on the effects of soil thermal anomaly on land surface energy budget. Acta Meteorol. Sin. (6), 706–714. doi:10.11676/qxxb2002.084
Guo, Y., Zuo, H., Chen, J., Wang, X., and Dong, L. (2015). Comparison of soil heat flux calculation approaches and their impacts on surface energy balance closure over homogeneous bare soil surface. Clim. Environ. Res. 20 (2), 177–187. doi:10.3878/j.issn.1006-9585.2014.14019
Hurd, R. U., and Craves, C. J. (1985). Some effects of air and root temperatures on the yield and quality of glasshouse tomatoes. J. Hortic. Sci. Biotechnol. 60, 359–371. doi:10.1080/14620316.1985.11515640
Idso, S. B., Aase, J. K., and Jackson, R. D. (1975). Net radiation — soil heat flux relations as influenced by soil water content variations. Boundary-Layer Meteorol. 9, 113–122. doi:10.1007/BF00232257
Jiang, C., Wang, F., Liu, S. J., Mu, X. M., Li, R., and Liu, Y. X. (2013). Evaporation paradox in the northern and southern regions of the Qinling mountains. Acta Ecologica Sinica 33 (3), 0844–0855. doi:10.5846/stxb201207271069
Li, M., Luo, T., Guo, J., He, J., and Liu, X. (2008). Soil heat flux in Abies georgei virgin forest at the alpine timberline, southeastern Tibetan Plateau. J. Mt. Sci. 26 (4), 490–495. doi:10.1007/s11632-008-0490-7
Li, S. S., Yan, J. P., and Wan, J. (2012). The characteristics of temperature change in Qinling Mountains. Geoscience 32 (7), 853–858. doi:10.13249/j.cnki.sgs.2012.07.853
Li, W. J., Luo, S. Q., Hao, X. H., Wang, J. Y., and Wang, Y. X. (2021). Observations of eastern Qinghai-Tibet Plateau snow cover effects on surface energy and water exchange in different seasons. Plateau Meteorol. 40 (3), 455–471. doi:10.7522/j.issn.1000-0240.2022.0079
Li, Q., Liu, S. M., Gao, G. L., et al. (2022a). Variation and simulation of surface soil heat flux in Ejin Oasis. J. Desert Res. 42 (6), 176–184. doi:10.7522/j.issn.1000-694X.2022.00050
Li, Y., Wu, J., Li, C., and Qin, G. (2022b). Temporal and spatial variation in grassland ground surface soil heat flux on the Qinghai-Tibetan plateau from 2003 to 2018. Acta Prataculturae Sin. 31 (11), 1–14. doi:10.5846/stxb202009212443
Liu, X. W., Bai, L., and Wang, Y. (2024). Characteristics of heat and moisture fluxes and factors affecting them in a Conifer-broadleaf mixed forest ecosystem in Jinyun mountain, Chongqing. Sci. Soil Water Conservation (1), 77–85. doi:10.16843/j.sswc.2023024
Ma, W. Q., Ma, Y. M., Li, M. S., Su, Z., and Wang, J. M. (2005). Seasonal variation on land surface energy budget and energy balance components in the Northern Tibetan Plateau. Glacial Permafr. 27 (5), 673–679. doi:10.7522/j.issn.1000-0240.2005.0103
Miao, Y., Liu, S., Lü, S., and Zhang, Y. (2012). A comparative study of computing methods of soil thermal diffusivity, temperature and heat flux. Chin. J. Geophys. 55 (2), 441–451. doi:10.6038/j.issn.0001-5733.2012.02.008
Park, H.-S., Kwon, B. H., Kim, I.-K., Oh, S. B., and Kang, D. h. (2017). Analysis of variations in soil heat flux and air temperature by net radiation at a mud flat in Hampyeong Bay. J. Environ. Sci. Int. 26 (9), 1101–1110. doi:10.5322/JESI.2017.26.9.1101
Qin, Z., Li, Z. J., Zhang, J. H., and Dubs, F. (2022). Topographic modulation of soil thermal regimes in the northern Qinling Mountains: observations and modeling. Geoderma 418, 115841. doi:10.1016/j.geoderma.2022.115841
Sun, C., Jiang, H., Chen, J., Wang, B., Liu, Y. L., and Chen, Y. Q. (2013). Forest ecosystem in China variation of soil heat flux in subtropical Phyllostachys edulis. J. Soil Sci. 50 (5), 966–973. doi:10.11766/trxb20130128005
Wang, B., Cui, X. H., and Bao, Y. H. (2004). Characteristics of radiation and heat balance in transitional region between oasis and desert. For. Sci. 40 (3), 26–32. doi:10.11707/j.1001-7488.20040305
Wang, X., Zhou, G. Y., Zhang, D. Q., and Wang, C. L. (2005). Soil heat fluxes of mixed coniferous and broad-leaf forest in the south subtropics in China. Ecol. Environ. 14 (2), 260–265. doi:10.16258/j.cnki.1674-5906.2005.02.027
Wang, H., Zan, B., Wei, J., Song, Y., and Mao, Q. (2022). Spatiotemporal characteristics of soil moisture and land–atmosphere coupling over the Tibetan plateau derived from three Gridded datasets. Remote Sens. 14 (22), 5819. doi:10.3390/rs14225819
Wang, Y., You, C., Tan, X., Chen, B. Y., Xu, M. Z., and Chen, S. P. (2022). Seasonal and interannual variations in energy balance closure over arid and semi-arid grasslands in northern China. Chin. J. Plant Ecol. 12, 1448–1460. doi:10.17521/cjpe.2021.0428
Wang, G. S., He, Q., Xing, H. Y., and Tang, X. (2023). Surface radiation budget and surface albedo characteristics in Eastern Pamir Plateau. Plateau Meteorol. 42 (3), 619–631. doi:10.7522/j.issn.1000-0534.2022.00088
Wu, J. K., Ding, Y. J., Wei, Z., and Wang, G. X. (2007). Characteristics of radiation budget in intercropping field in the middle reach of Heihe River Basin. Plateau Meteorol. 26 (2), 286–292. doi:10.5846/stxb202007311983
Wu, B., Oncley, S., Yuan, H., and Chen, F. (2020). Ground heat flux determination based on near-surface soil hydro-thermodynamics. J. Hydrology 591, 125578. doi:10.1016/j.jhydrol.2020.125578
Xiao, Y., Zhao, L., Li, R., and Yao, J. M. (2011). Seasonal variation characteristics of surface energy budget components in permafrost regions of Qinghai-Tibet Plateau. J. Glaciol. Geocryol. 33 (5), 1033–1039. doi:10.7522/j.issn.1000-0240.2015.0064
Xu, Z. W., Liu, S. M., Xu, T. R., and Ding, Y. (2013). The observation and calculation method of soil heat flux and its impact on the energy balance closure. Adv. Earth Sci. 28 (8), 875–889. doi:10.11867/j.issn.1001-8166.2013.08.0875
Xu, X., Li, Y., Shi, Z., Naderpour, R., Houtz, D., Lemmetyinen, J., et al. (2021). Temperature effects on L-band vegetation optical depth of a boreal forest. Remote Sens. Environ. 263, 112542. doi:10.1016/j.rse.2021.112542
Yang, D., Wu, J., and Li, C. (2024). Estimation and spatiotemporal distribution of soil heat flux over the qinghai–Tibetan plateau. Clim. Environ. Res. 29 (2), 113–124. doi:10.3878/j.issn.1006-9585.2023.23028
Yang, Y., Tilman, D., Jin, Z. N., Smith, P., Barrett, C. B., Zhu, Y. G., et al. (2024). Climate change exacerbates the environmental impacts of agriculture. Science 385, eadn3747–eadn3747. doi:10.1126/science.adn3747
Yue, P., Zhang, Q., Niu, S., Cheng, H. W, and Wang, X. Y. (2012). Characters of surface energy balance over a semi-arid grassland and effects of soil heat flux on energy balance closure. Acta Meteorol. Sin. (1), 136–143. doi:10.11676/qxxb2012.013
Zan, B., Wang, H., Wei, J., and Song, Y. (2024). Temporal and spatial soil moisture–precipitation coupling relationships over the Tibetan plateau. J. Geophys. Res. Atmos. 129 (2013), e2023JD040621. doi:10.1029/2023JD040621
Zhang, H. H., Jiang, H. M., Chen, Q., and Xiao, J. S. (2020). Influence of snow cover on soil temperature, soil moisture and surface energy budget at alpine meadow. Plateau Meteorol. 39 (4), 740–749. doi:10.7522/j.issn.1000-0240.2021.0078
Zhang, M. L., Wang, B., Wang, D., Ye, W. L., Guo, Z. Y., Gao, Q., et al. (2021). The effects of rainfall on the surface radiation of permafrost regions in Qinghai-Tibet Plateau: a case study in Beiluhe area. J. Glaciol. Geocryol. 43 (4), 1092–1101. doi:10.7522/j.issn.1000-0240.2021.0073
Keywords: northern foothills of the Qinling Mountains, surface solar radiation, soil heat flux, seasonal variation characteristics, environmental factors
Citation: Pang Z, Hua D, Li J and Li J (2025) Temporal variation and environmental drivers of soil heat flux and surface solar radiation in the northern Qinling foothills. Front. Environ. Sci. 13:1594923. doi: 10.3389/fenvs.2025.1594923
Received: 17 March 2025; Accepted: 25 September 2025;
Published: 24 October 2025.
Edited by:
Xixi Wang, Old Dominion University, United StatesReviewed by:
Yu Liu, Northwestern Polytechnical University, ChinaLin Guo, Shaanxi Institute of Forestry Survey and Planning, China
Sadashiv Chaturvedi, Nanjing University of Information Science and Technology, China
Copyright © 2025 Pang, Hua, Li and Li. This is an open-access article distributed under the terms of the Creative Commons Attribution License (CC BY). The use, distribution or reproduction in other forums is permitted, provided the original author(s) and the copyright owner(s) are credited and that the original publication in this journal is cited, in accordance with accepted academic practice. No use, distribution or reproduction is permitted which does not comply with these terms.
*Correspondence: Juan Li, bGlqdWFuODEzNkAxNjMuY29t