 Yuping Long1
 Feng Li2*
- 1Hubei University of Arts and Science, Xiangyang, Hubei, China
- 2University of Sanya, Sanya, Hainan, China
Introduction: The tourism industry significantly contributes to China’s economic growth, yet its high energy consumption poses substantial carbon emission challenges. Addressing these issues is essential to align the sector with national low-carbon development goals and ensure environmental sustainability.
Methods: This study develops a system dynamics model to evaluate carbon emission reduction pathways for the tourism sector under a low-carbon policy framework. Based on macroeconomic and tourism industry data from Hubei Province spanning 2013 to 2023, the model incorporates four subsystems: economic, energy, policy, and environmental. Comparative scenario simulations were conducted, including a baseline and a joint policy scenario integrating carbon taxation, technological subsidies, and green standard enforcement. Sensitivity analysis was performed to assess the robustness of the emission control strategies.
Results: Under the baseline scenario, carbon emissions from the tourism industry are projected to rise from 1 million tons in 2013 to 1.8229 million tons by 2033, reflecting a 3.36% average annual increase. However, the joint policy scenario limits emissions to 1.412 million tons in 2033—a 22.5% reduction compared to the baseline—while maintaining tourism revenue at 742 billion yuan, only 0.4% below the baseline. Sensitivity analysis reveals that policy intensity and technological progress are critical factors in moderating emissions. Under the joint policy scenario, the 95% confidence interval for emissions narrows to between 1.387 and 1.439 million tons, with a fluctuation of less than 50,000 tons.
Discussion: The findings demonstrate that integrated low-carbon policy mixes can effectively curb carbon emissions in the tourism sector without significantly compromising economic output. This study not only provides empirical support for policy optimization but also uncovers the underlying drivers of tourism-related emissions, offering theoretical and practical guidance for advancing sustainable tourism and green economic transformation.
1 Introduction
As global climate change becomes an increasingly severe issue, carbon neutrality has become a common consensus within the international community. Tourism, as a significant sector in terms of energy consumption and carbon emissions, faces substantial challenges in its development model under the context of a green and low-carbon transformation. As one of the primary drivers of global tourism growth, China’s tourism industry, while meeting the demands of economic development, has placed considerable pressure on the ecological environment through its carbon emissions (Li and Wei, 2021). However, the tourism industry’s high dependency on energy consumption under traditional development paths has created significant bottlenecks for achieving low-carbon development. In this context, exploring the optimal growth path for carbon emissions in the tourism sector under enhanced low-carbon scenarios not only holds significant theoretical value but also has practical implications for achieving China’s “dual carbon” goals and ensuring the sustainable development of the tourism industry. Against this backdrop, there is an urgent need to explore how to achieve effective carbon emission control while sustaining the growth of the tourism industry. In response to this challenge, this study proposes and simulates an “optimal growth path,” centered on a single-objective function that minimizes carbon emissions. By evaluating multiple policy scenarios, the study identifies a relatively optimal low-carbon development trajectory, aiming to provide scientific evidence and policy references for the green transformation of the tourism sector.
System dynamics (SD) models are simulation tools that focus on the dynamic behavior of complex systems. By examining feedback loops between variables and the process of time evolution, these models reveal the non-linear characteristics and development trends of systems. In the low-carbon field, system dynamics has been applied to assess the effects of different energy policies, such as fossil energy substitution, the increase of renewable energy proportions, and the integrated effects of the low-carbon transformation of the power sector (Yang et al., 2021; Savio et al., 2022). In urban carbon emissions dynamic simulations, researchers have used SD models to analyze the long-term impact of population growth, industrial structure adjustment, and technological progress on urban carbon emissions (Lin et al., 2022; Zeng et al., 2023). In regional low-carbon economic path exploration, system dynamics provides decision-makers with quantitative evidence for balancing carbon reduction and economic growth (Wei et al., 2023; Li and Zhang, 2024), particularly in optimizing policy conflicts and synergies. Additionally, SD models have been used in multi-scenario analysis, simulating the potentialities of various low-carbon paths through assumptions of different policies or technological progress, offering comprehensive and flexible reference points for policy formulation (Gao et al., 2023; Zhang et al., 2024).
Although system dynamics has been widely applied to simulate carbon emissions in the energy, industrial, and urban sectors, insufficient attention has been paid to the tourism industry—an inherently consumption-driven sector involving multiple carbon-intensive activities such as transportation and accommodation (Shafiee et al., 2022). Existing models often rely on static structures or single-policy instruments, making them inadequate for capturing the feedback mechanisms of tourism’s multi-source carbon emissions or the dynamic interactions among policy, technology, and consumer behavior (Zhang, 2024). To address these limitations, this study develops a system dynamics model based on macroeconomic and tourism industry data from Hubei Province spanning 2013–2023, encompassing four subsystems: economy, energy, policy, and environment. In contrast to traditional energy-centered model structures, this study incorporates key carbon sources from tourism activities—such as tourist volume, transportation modes, and accommodation energy use—into state variables. It also introduces “policy intensity coefficient” and “technology development index” as regulatory variables, and designs a set of multi-policy synergistic intervention pathways that highlight the dynamic interactions among carbon taxes, technology subsidies, and green standards (Ridwan et al., 2024). By constructing a closed-loop feedback model reflecting the structural characteristics of tourism-related carbon emissions and policy responses, this study expands both the structural depth and application breadth of system dynamics in tourism carbon governance, demonstrating notable applied innovation. Accordingly, the study sets a baseline scenario and an enhanced low-carbon scenario, and introduces multiple policy combination pathways to systematically simulate the evolution of carbon emissions in China’s tourism industry under various policy interventions. The research findings reveal the dynamic mechanisms by which policy interventions optimize carbon emission pathways in China’s tourism industry under the enhanced low-carbon scenario. This not only enriches the application of system dynamics in the field of low-carbon tourism development but also provides empirical support for the synergistic effects of different policy combinations on emission reduction outcomes.
The structure of this paper is arranged as follows: Section 1 presents the introduction, elaborating on the research background, significance, and main research questions. Section 2 provides a literature review, summarizing the application of system dynamics models in carbon emission research. Section 3 describes the research design, including data sources, variable settings, and model construction, and discusses the research scenario settings. Section 4 presents the research results and analysis, comparing the carbon emission paths under the baseline and enhanced low-carbon scenarios through model simulations, and reveals the mechanisms by which different policy combinations contribute to carbon reduction. Section 5 discusses the theoretical contributions and limitations of this study, offering policy recommendations. Finally, Section 6 concludes the study and suggests directions for future research.
2 Literature review
System dynamics (SD), as a method for studying complex dynamic systems, has become a core tool in many fields since its inception. By establishing causal feedback loops and dynamic equations, it simulates the interactions between variables, effectively revealing the temporal and spatial evolution characteristics of complex systems. In low-carbon development research, the application of system dynamics models is particularly widespread (Tang et al., 2021; Sorokin et al., 2022; Baryshnikov, 2022). With the increasing severity of global climate change, low-carbon development has become a focal point for many countries. System dynamics, as a tool that can dynamically simulate the interactions between policies, technologies, economies, and the environment, has attracted significant attention from researchers and has made notable progress in carbon emission forecasting, low-carbon policy simulation, and sustainable development path design (Zhang et al., 2021; Li and Zhang, 2024; Yuan et al., 2022).
System dynamics, as a powerful dynamic analysis tool, has demonstrated unique advantages in studying the complex coupling relationship between carbon emissions and economic growth. Recent studies have gradually shifted from static analysis to dynamic forecasting, with a greater focus on the long-term impacts of low-carbon policies. Sun et al. (2022) utilized a system dynamics model to examine the role of energy consumption structure optimization in achieving carbon neutrality, finding that technological progress and industrial restructuring are key to long-term low-carbon development. However, a major limitation of this study is its insufficient exploration of the time-lag effects of policy implementation, which may lead to an overestimation of short-term policy effects. Dong et al. (2024) further explored the changes in carbon emission intensity, revealing the core role of innovation in green development through dynamic feedback. However, this study did not fully consider the dynamic coupling between technological innovation and regional differences. This indicates that while important progress has been made in revealing the relationship between carbon emissions and economic growth, detailed analyses at the regional and sectoral levels are still lacking.
In policy evaluation, system dynamics has provided strong support for analyzing the synergistic effects of multiple policy tools. Tang and Mizunoya (2021) conducted dynamic simulations based on carbon tax policy scenarios and found that a moderately gradual carbon tax adjustment strategy could balance economic development with emission reduction goals. However, this study did not systematically assess the joint effects of carbon tax policies with other policy tools. Zhang et al. (2022) explored the synergistic effects of carbon pricing and subsidy policies, emphasizing the regional adaptability and sectoral differences of policies. However, the long-term guiding role of policy stability on market behavior was not thoroughly analyzed. Most studies, however, tend to focus on individual policies or simple policy combinations, overlooking the long-term impact of complex policy interventions on industrial restructuring and behavioral changes. Deng et al. (2024) introduced variables such as technological innovation and energy efficiency improvements, revealing the carbon emission pathways under the synergy of multiple policies and suggesting that policy combinations could significantly enhance long-term emission reduction effects. These studies share a common feature of revealing the short-term effects of policy interventions but lack detailed exploration of the long-term dynamic evolution of policy combinations across industries and regions.
In the tourism sector, the application of system dynamics models has been limited but is gradually gaining attention. Sun et al. (2021) used a model to simulate the dynamic impact of green transportation and eco-tourism on carbon emissions, proposing that eco-tourism is the core direction of industry transformation. However, this study mainly relied on ideal scenarios and lacked a comprehensive analysis of policy implementation barriers. Qian et al. (2023) studied the impact of tourism operation modes on carbon emissions and found that optimizing tourist behavior and coordinating management strategies could significantly reduce emissions. Julita et al. (2024) analyzed the carbon reduction potential in the hotel industry through dynamic energy management and green certification. However, their model had limited applicability to small hotels and could not fully reflect the industry’s overall dynamics. Additionally, Wang (2024) explored the indirect emission reduction effects of promoting smart tourism technologies and low-carbon consumption habits, broadening the research perspective but still presenting limitations in variable dynamic interactions and scenario settings.
To address these limitations, some recent studies have attempted to identify the heterogeneous impact pathways of tourism on carbon emissions using statistical quantile methods and threshold mechanisms. Yıldırım et al. (2021), in their study on Mediterranean countries, identified a nonlinear threshold relationship between “tourism intensity and carbon emissions,” finding that once tourism reaches a certain level of development, emissions may decrease due to a green transformation. However, the study did not incorporate policy variables to model their regulatory influence on the turning point, thereby limiting its applicability for forecasting emission pathways under varying policy combinations in China. Yıldırım et al. (2023) further employed a threshold panel model to explore the interaction effects among tourism, population, and growth, revealing how structural differences shape pollution burdens. Nevertheless, their approach focuses on static identification and fails to capture how policy feedback drives the evolution of internal system variables. Hasanov et al. (2021) introduced variables such as ecotourism, fintech, and resource governance, using quantile regression to demonstrate their heterogeneous emission reduction effects across different emission percentiles, highlighting policy response potential in highly polluted areas. Although methodologically flexible, this approach does not account for dynamic feedback between variables or simulate the synergistic pathways of multi-policy implementation. From an industry decoupling perspective, Hong et al. (2025) applied the LMDI decomposition method to examine the decoupling of carbon emissions and growth in China’s textile industry, confirming the role of technological progress and energy structure optimization in achieving “strong decoupling.” However, this static and linear method cannot characterize behavioral responses, technological pathway evolution, or policy interactions in complex service sectors. Erdoğan et al. (2020), using multi-sector G20 data, emphasized the significant emission reduction role of technological innovation in industrial sectors, but found that service industries respond weakly to innovation unless reinforced by strong policy interventions. Yet, this study lacked sector-specific simulations and did not identify emission reduction mechanisms specifically targeting transportation and accommodation—the two major carbon sources in tourism.
Although existing literature has made notable progress in examining the impact mechanisms of tourism on carbon emissions, most studies rely on static panel regressions, decomposition models, or structural identification approaches, which are limited in capturing policy implementation lags and the dynamic effects of multi-policy interactions. Yıldırım et al. (2021), Yıldırım et al. (2023) employed threshold regression to identify nonlinear mechanisms, while Hasanov et al. (2021) used quantile regression to reveal differentiated policy responses across emission levels. However, none of these approaches embedded causal feedback chains among variables, nor could they simulate the cumulative effects of policy tools evolving over time. In contrast, the system dynamics model proposed in this study incorporates state variables, flow variables, and feedback mechanisms to dynamically depict the interactive evolution among policies, technologies, and behaviors. It is well-suited for multi-scenario pathway simulations and effectively addresses current research gaps in “policy synergy modeling” and “scenario-based evolutionary forecasting.”
3 Research design
3.1 Data sources
This study utilizes macroeconomic data and tourism-related data from Hubei Province, China, covering the period from 2013 to 2023, as well as environmental data related to carbon emissions. The specific data collection methods are as follows: The macroeconomic and tourism-related data are sourced from the National Bureau of Statistics, the China Tourism Statistical Yearbook, and the World Bank database. These datasets include core indicators such as China’s GDP, added value of the tertiary industry, total tourism revenue, number of inbound tourists, and number of domestic tourists. To ensure the comprehensiveness and consistency of the data, the study prioritizes publicly available annual statistical reports as data sources and performs multiple cross-checks to improve data quality. Environmental data related to carbon emissions were sourced from the China Energy Statistical Yearbook, the International Energy Agency (IEA) database (2023 edition), and the Emissions Database for Global Atmospheric Research (EDGAR v6.0, 2021 edition). Key indicators include total energy consumption, energy structure, and carbon emission coefficients for various energy types. Based on these data and the IPCC carbon emission estimation methodology, this study estimates the carbon emissions of the tourism sector. To improve estimation accuracy and capture sectoral heterogeneity, tourism-related transportation activities are disaggregated into air, road, and rail travel, with separate emission calculations conducted for each category. This approach avoids the masking effect of traditional aggregate estimations, which often overlook the emission disparities among different travel modes. Additionally, considering the abnormal disruptions caused by the COVID-19 pandemic between 2020 and 2022, a dummy variable Dcovid is introduced (assigned a value of 1 during pandemic years and 0 otherwise) to control for short-term shocks, thereby enhancing the robustness of model fitting and the reliability of trend simulations. All data are standardized and missing values are filled using interpolation methods. Time series analysis and multivariate regression verification are conducted as needed to eliminate outliers and noise that could interfere with model simulation.
3.2 System dynamics model construction
3.2.1 Causal analysis
Causal relationship analysis is the core of system dynamics modeling. By analyzing the interactions and feedback mechanisms between variables, it can reveal the overall dynamic characteristics of the system. This study constructs a causal relationship framework comprising four core modules: economy, energy, policy, and environment. Based on the feedback mechanism logic of system dynamics, the framework identifies the interactive relationships and feedback pathways among these modules. The specific causal loop diagram developed using Vensim is shown in Figure 1.
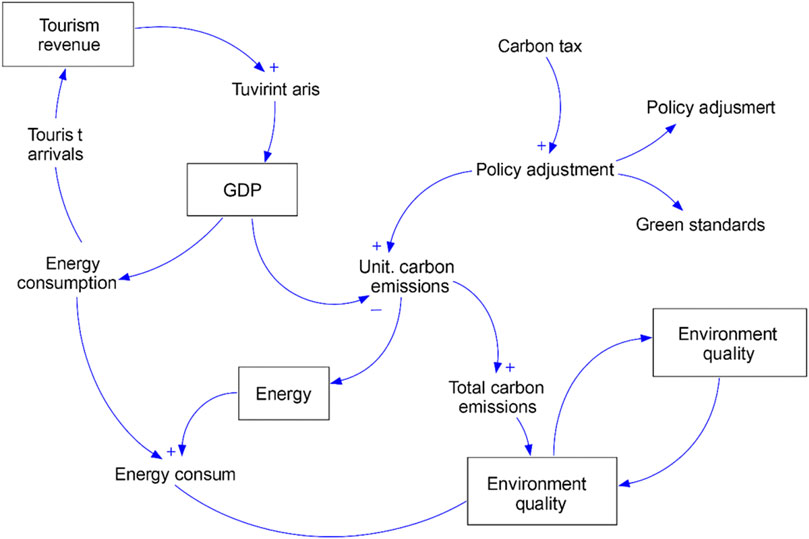
Figure 1. Causal loop diagram of the tourism carbon emission system.
3.2.1.1 Economic module
The economic module describes the driving effects of tourism economic activities on energy demand and carbon emissions, and includes the following causal chains:
(1) The growth of GDP and tourism income promotes infrastructure development and consumer spending in the tourism industry, directly increasing energy demand.
(2) The introduction of green investment improves energy efficiency and encourages the use of clean energy, which partially alleviates carbon emission pressure.
3.2.1.2 Energy module
The energy module reflects the energy consumption and emission characteristics of tourism-related activities. The causal relationships include:
(1) Transportation and accommodation facilities are the primary sources of energy consumption in the tourism industry, directly determining the total carbon emissions.
(2) Optimizing the energy structure (increasing the proportion of clean energy) and improving energy efficiency help reduce carbon emissions per unit of energy.
3.2.1.3 Policy module
The policy module describes the regulatory role of external policy interventions on tourism sector carbon emissions, including the following feedback paths:
(1) Carbon tax policies raise the cost of fossil energy use, prompting enterprises and consumers to opt for low-carbon alternatives.
(2) The implementation of technology incentives and green standards promotes the development of clean energy technologies, thereby reducing carbon emissions.
3.2.1.4 Environmental module
The environmental module depicts the impact of carbon emissions on environmental quality and its feedback mechanisms:
(1) Increased carbon emissions lead to a decline in environmental quality, which in turn prompts the government to strengthen policy regulation.
(2) Environmental improvements can form a positive feedback loop on economic activities, helping to stabilize the system dynamically in the long term.
3.2.2 Variable setup and model equations
This study scientifically classifies and selects model variables through an in-depth review of relevant literature, combined with actual data and system dynamics theory. Meanwhile, the causal relationships between variables are logically validated using Vensim-PLE software to ensure the scientific integrity and completeness of the model structure. The main variables of the study and their meanings are shown in Table 1:
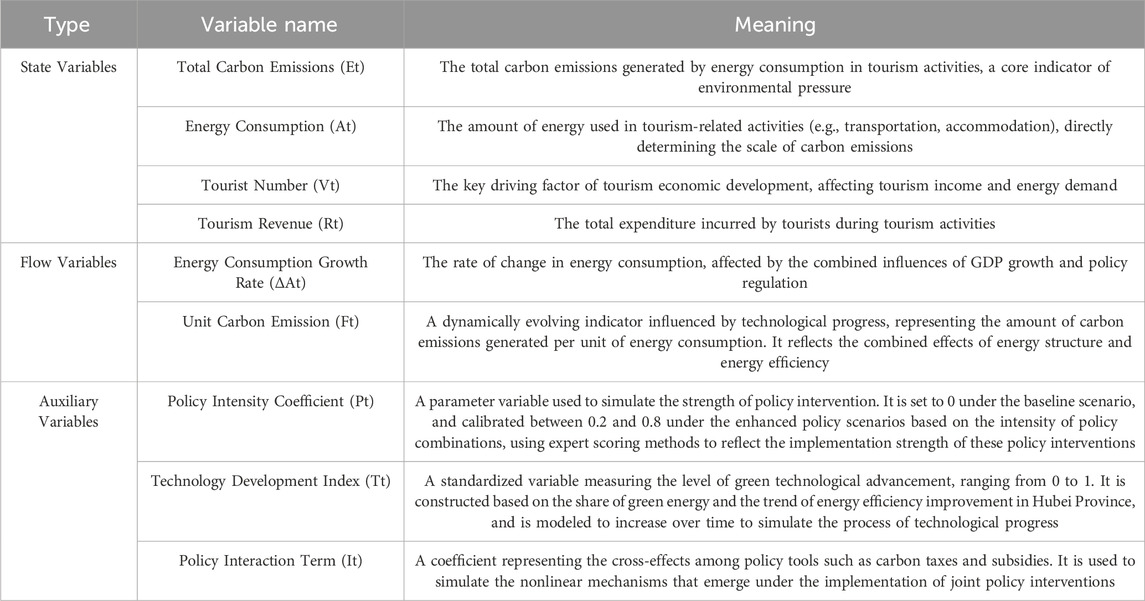
Table 1. Variable names and their meanings.
Under the system dynamics framework, changes in carbon emissions are jointly determined by state variables, flow variables, and auxiliary variables. To clarify the relationships between these variables, this study constructs the following core equations based on the dynamic characteristics of tourism development:
3.2.3 Carbon emission calculation
The total carbon emissions are determined by the energy consumption of various tourism-related activities (including transportation and accommodation) and their corresponding carbon emission factors. The specific calculation formula is shown in Equation 1:
where Ait denotes the energy consumption of the ith type of tourism activity in year t, and Fit represents the corresponding unit carbon emission factor. The index i includes the main carbon sources: air transport (air), road transport (road), rail transport (rail), and accommodation (accom).
To further reveal the behavioral drivers of energy demand among tourists, the energy consumption structure is modeled separately for transportation and accommodation categories:
For transportation activities (i∈{air,road, rail}), the energy consumption is calculated using Equation 2:
Where Vt is the total number of tourists, Si,t is the proportion of tourists choosing transport mode i, Disti is the average travel distance per tourist for mode i (in kilometers), EFi is the energy consumption coefficient per passenger-kilometer for mode i.
For accommodation activities (i = accom), the energy consumption is calculated using Equation 3:
where Lt denotes the average length of stay per tourist (in nights), EUaccom is the unit energy consumption per tourist per night for accommodation services.
3.2.4 Energy consumption growth
The annual increment in energy consumption is jointly influenced by macroeconomic growth, tourism consumption intensity, policy interventions, and technological advancements. Considering the short-term disruptions caused by the COVID-19 pandemic during 2020–2022, this study incorporates a dummy variable Dcovid into the energy consumption growth function to account for these effects, the functional relationship is given in Equation 4:
where GDPt represents economic growth, Pt reflects the intensity of policy intervention, Tt denotes the level of technological advancement, Rt is tourism revenue, δ is the adjustment coefficient for the pandemic shock, γ1,γ2,γ3 are weighting parameters.
3.2.5 Policy and technology adjustment
The carbon intensity per unit of energy consumption (Ft) is influenced by policy instruments, technological progress, and the interaction effects among policies. Its dynamic evolution is described in Equation 5:
where F0 denotes the baseline carbon emission intensity, α and θ represent the sensitivity coefficients for policy adjustment effects and policy interaction effects, respectively, λ is the emission reduction efficiency coefficient of technological progress, It is the policy interaction term.
3.3 Scenario setting
This study evaluates the impact of policy interventions on the carbon emission growth path of China’s tourism industry by setting two scenarios: the baseline scenario and the enhanced low-carbon scenario. The scenario settings are based on the “14th Five-Year Plan for Energy Conservation and Emission Reduction Implementation Plan of Hubei Province” and related statistical data, ensuring the scientific and rationality of the assumptions.
Under the baseline scenario, it is assumed that China’s tourism industry will follow a natural growth trajectory without the introduction of new policy interventions. Energy consumption is projected to increase in parallel with the expansion of the tourism sector. To better reflect the natural progression of national policy, it is further assumed that although the energy structure of the tourism industry is not subject to strong external policy pressures, its trend will still be influenced by the broader national energy transition—manifested as a moderate, year-on-year increase in the share of renewable energy. Specifically, in the baseline scenario, the share of renewables in energy consumption within tourism-related sectors is assumed to rise by 1 percentage point annually from its 2023 level, reaching approximately 30% by 2030. Meanwhile, tourism consumption behavior is not significantly shaped by green values, and improvements in energy efficiency are mainly attributed to market-driven adjustments.
The enhanced low-carbon scenario assumes that under significant policy interventions, the energy structure is optimized by gradually increasing the proportion of renewable energy in the tourism industry’s energy consumption while strictly limiting the use of high-carbon energy. In addition, carbon taxes and carbon emission quotas are introduced, setting stricter annual carbon emission targets for the tourism industry and using market-based mechanisms to encourage enterprises and consumers to reduce carbon emissions. The government promotes green travel through fiscal incentives, supports the development and promotion of low-carbon tourism products, and further guides the public to choose low-carbon consumption patterns. Under the dual influence of policy guidance and changes in public behavior, the effective control of tourism industry carbon emissions is achieved.
Based on the enhanced low-carbon scenario, this study further introduces the combined policy scenario to simulate the intervention effects of different policy combinations and analyze their specific impact on the optimization of the carbon emission path. The combined policy scenarios include: A combination of carbon tax and technology subsidies, which reduce both energy consumption and carbon emissions by increasing the cost of fossil energy use and providing financial support for the research and development of low-carbon technologies; A combination of carbon tax and green standards, which raises the cost of fossil energy while enforcing green standards to constrain high-carbon energy use and promote energy structure optimization; A combination of technology subsidies and green standards, which reduce carbon emissions in tourism activities by promoting the application of green technologies and restricting high-energy consumption facilities; A comprehensive joint policy of carbon tax, technology subsidies, and green standards, simulating the strictest low-carbon scenario to evaluate the maximum control effect of multiple policies on carbon emissions.
4 Research results and analysis
4.1 Carbon emission results in the baseline scenario
As shown in Figure 2, under the baseline scenario, carbon emissions and economic performance in Hubei Province exhibit a clear upward trend from 2013 to 2033. Over this period, carbon emissions from the tourism industry are projected to rise steadily from 1 million tons in 2013 to 1.8229 million tons in 2033, with an average annual growth rate of 3.36%. Between 2013 and 2019, emissions increased from 1 million to 1.316 million tons, primarily driven by the simultaneous growth in tourist volume and tourism revenue. In 2015, carbon emissions reached 1.1025 million tons—an increase of 10.25% compared to 2013—while tourism revenue grew from 230.8 billion yuan in 2013 to 306.1 billion yuan in 2015, with an annual growth rate exceeding 10%, highlighting a strong synchronicity between carbon emissions and economic benefits. The COVID-19 pandemic in 2020 and 2021 caused a sharp contraction in tourism activities, with emissions falling to 1.1844 million tons and 1.1252 million tons respectively—down 10% and 5% compared to 2019. Correspondingly, tourism revenue declined from 512.3 billion yuan in 2019 to 403.6 billion yuan in 2020, reflecting a synchronized downturn in both carbon emissions and economic output. As tourism gradually recovered from 2022 onward, emissions rebounded to 1.169 million tons and tourism revenue rose to 429.4 billion yuan. By 2033, carbon emissions are projected to reach 1.8229 million tons, while tourism revenue is expected to exceed 745 billion yuan, demonstrating the industry’s strong post-pandemic recovery momentum. Although the share of renewable energy in the energy structure increases year by year and the unit carbon intensity factor (Ft) declines moderately, the rapid expansion of tourism activities continues to drive overall energy consumption upward. The marginal improvements in carbon intensity have not fully offset the emissions pressure stemming from expanding tourist volumes and continued reliance on traditional transportation modes. In summary, the carbon emission trajectory under the baseline scenario reveals the development logic of the tourism sector in the absence of external policy interventions: on the one hand, it provides a significant boost to regional economic growth, reflected in the sustained increase in tourist consumption and tourism revenue; on the other hand, without sector-specific policy support and relying solely on the national-level energy transition, the relationship between carbon emissions and economic growth remains “strongly coupled,” falling short of the decoupling goal of “decarbonization with value creation” pursued by green transformation.
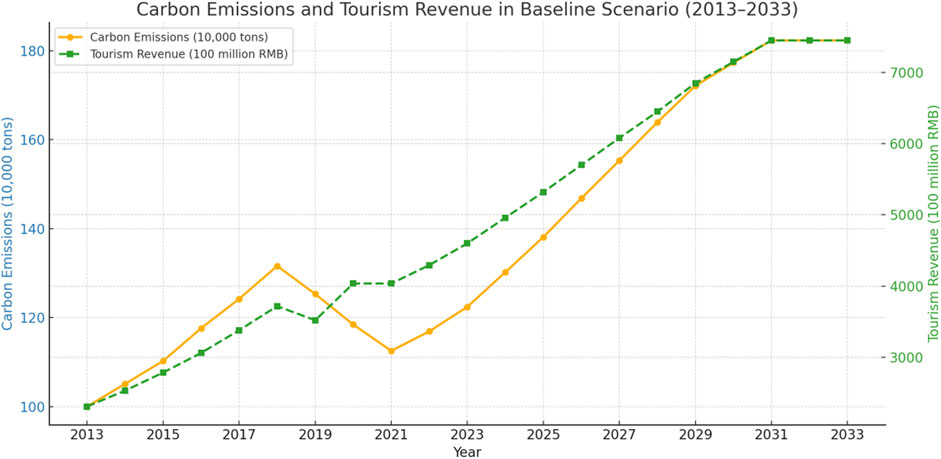
Figure 2. Trends in carbon emissions and tourism revenue of Hubei’s tourism industry under the baseline scenario.
4.2 Path optimization in the strengthened low-carbon scenario
The optimization of carbon emission pathways for Hubei’s tourism industry under different policy combination scenarios is illustrated in Figure 3. In the “Carbon Tax + Technology Subsidy” scenario, carbon emissions in 2033 decrease from 1.8229 million tons in the baseline scenario to 1.465 million tons, representing a reduction of approximately 19.64%. This policy mix regulates the two main high-emission domains—transportation and accommodation—through a dual mechanism: on one hand, the carbon tax increases the operating costs of traditional fuel-based transport and energy-intensive accommodation facilities; on the other hand, technology subsidies significantly accelerate the adoption of new energy vehicles and energy-efficient equipment. Although the carbon tax slightly suppresses tourist numbers and per capita spending in the short term, the enhanced appeal of green tourism services and the emergence of cost-substitution mechanisms lead to a total tourism revenue of 725 billion yuan in 2033, only 2.7% lower than the baseline. This reflects a favorable “emission reduction–growth” synergy. In the “Carbon Tax + Green Standards” scenario, carbon reduction effects are particularly notable in the short term (2023–2025). For example, in 2026, emissions drop by approximately 8% compared to the baseline. The mandatory implementation of green standards accelerates energy retrofitting in the accommodation sector and expedites the phasing out of outdated high-energy devices such as gas water heaters and old central air-conditioning systems. The carbon tax adds cost pressure to high-carbon energy use, further promoting the penetration of clean energy. On the economic side, traditional businesses are somewhat impacted during the early policy phase, and tourism revenue growth slows slightly before 2025. However, as a standardized green tourism supply system becomes established and tourist preferences adapt, tourism revenue rebounds to 708 billion yuan in 2033—around 5% below the baseline.
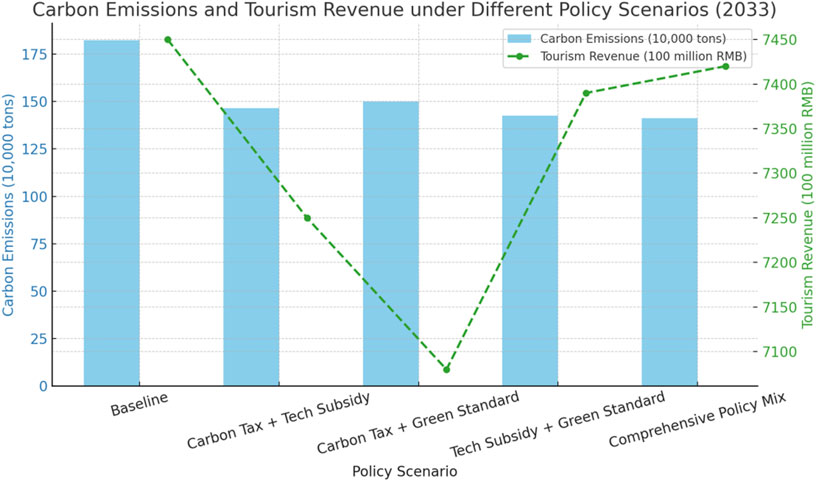
Figure 3. Carbon emissions and tourism revenue in 2033 under different policy scenarios.
The “Technology Subsidy + Green Standards” scenario yields more substantial medium-to long-term emission reductions, with emissions falling to 1.425 million tons by 2033—a 21.8% decrease compared to the baseline. This scenario promotes both green product supply and a shift in consumption structure through measures such as promoting energy-saving accommodation technologies, customized green travel routes, and eco-tourism certification. As tourists gradually develop green preferences, tourism revenue in this scenario reaches 739 billion yuan in 2033, just 0.8% below the baseline—virtually achieving the goal of “emission reduction without income loss,” and reflecting high economic adaptability and strong synergy with industrial transformation. The “Comprehensive Joint Policy” scenario delivers the most optimal emission reduction outcome, lowering carbon emissions to 1.412 million tons by 2033—a 22.5% reduction from the baseline. This scenario integrates carbon taxes, green standards, and technology subsidies to comprehensively address carbon-intensive links such as transportation, accommodation, and scenic area operations. By 2033, the penetration rate of new energy tourism vehicles reaches 70%, becoming a key driver of emission reduction. The accommodation sector widely adopts high-efficiency equipment and implements green rating standards, effectively limiting the market share of high-carbon practices. Although the policy mix is relatively stringent, it strongly stimulates green supply optimization and changes in tourist behavior. As a result, tourism revenue in 2033 reaches 742 billion yuan—nearly identical to the baseline—demonstrating the policy combination’s potential to achieve a win–win balance between emission reduction and economic growth.
Overall, the various policy combinations under the enhanced low-carbon scenario differ significantly not only in their emission reduction outcomes but also in their elasticity regarding economic impacts on the tourism sector. As shown in Figure 3, although some scenarios temporarily reduce tourism revenue in the short term, the construction of a green service system and the evolution of consumer preferences can, in the medium to long term, effectively close the income gap and even foster high-quality development of the industry. This indicates that well-designed low-carbon policy combinations do not undermine tourism vitality; instead, they may serve as vital tools for driving green transformation and optimizing supply-side structures.
4.3 Uncertainty analysis and sensitivity testing
To enhance the credibility of model predictions and the robustness of policy recommendations, perturbation experiments were conducted by varying the values of Pt and Tt within ±10% of their baseline levels to simulate their marginal impacts on the projected carbon emissions in 2033. As shown in Figure 4, variations in both parameters significantly affect total carbon emissions. The influence of Pt fluctuations is slightly greater than that of Tt, indicating that policy intensity remains the most direct external force driving the low-carbon transition. In contrast, under the baseline technological progress scenario, the projected carbon emissions in 2033 exhibit higher uncertainty, with a 95% confidence interval ranging from 1.773 to 1.886 million tons—a fluctuation of over 110,000 tons—reflecting the system’s relatively weak resilience to environmental shocks in the absence of policy intervention. In policy intervention scenarios, the uncertainty of emission forecasts declines markedly. Particularly under the “Comprehensive Joint Policy” scenario, the 2033 carbon emission projection converges within a narrow 95% confidence interval of 1.387–1.439 million tons, with a fluctuation range of less than 52,000 tons. This demonstrates the effectiveness of integrated policy strategies in stabilizing emission volatility and improving prediction reliability.
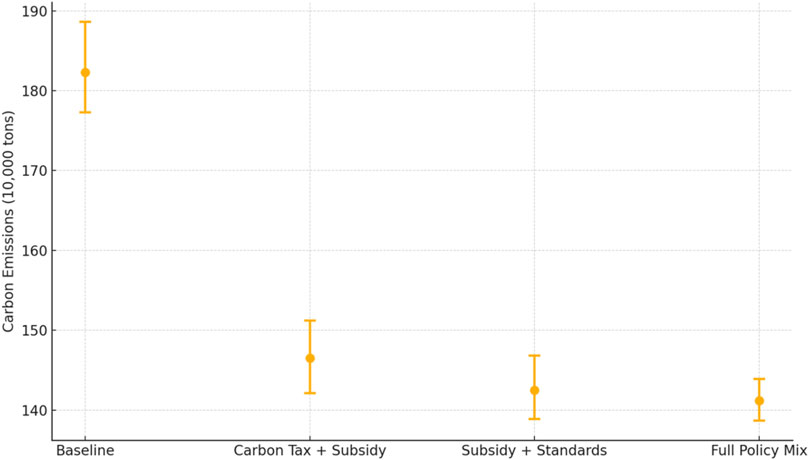
Figure 4. 95% confidence intervals for projected tourism carbon emissions in 2033 under different policy scenarios.
In summary, different policy combinations not only exert significant impacts on the central level of carbon emissions but also substantially reduce the system’s sensitivity to perturbations in key variables. Notably, under the triple intervention of carbon tax + technology subsidy + green standards, system carbon emissions exhibit high stability, reinforcing the dominant role of policy implementation in guiding the decarbonization pathway of the tourism industry. The long-term effect of technological progress, in turn, is reflected in enhanced energy efficiency and reduced unit carbon intensity.
5 Discussion
This study simulates the carbon emission paths of Hubei Province’s tourism industry under low-carbon scenarios using a system dynamics model, highlighting the significant role of policy interventions in carbon emission reduction. The research shows that through policy combination scenarios (such as the integration of carbon taxes, technology subsidies, and green standards), carbon emissions in the tourism industry can be significantly reduced, with the comprehensive combined policy scenario yielding the most optimal results. This finding not only provides theoretical support for the development of a low-carbon tourism industry but also emphasizes the core role of enhanced policy intervention in carbon emission control.
Compared to existing research, the results of this study reflect a combination of inheritance and innovation in terms of methodology, content, and conclusions, offering new perspectives and theoretical foundations for optimizing carbon emission paths in the tourism industry under low-carbon scenarios. Firstly, in terms of research methodology, Anwar et al. (2021) used linear programming models and regression analysis to assess the impact of energy structure optimization on carbon emissions in the Asian tourism industry and the economic feasibility of low-carbon policies. These studies emphasized the linear relationship between total energy consumption and carbon emissions but failed to consider the dynamic interactions between multiple variables within the system. In contrast, this study is based on a system dynamics (SD) model that dynamically integrates the four major modules of economy, energy, policy, and environment, capturing causal feedback mechanisms and nonlinear interactions between these modules. Secondly, in terms of research on policy combination effects, Hu et al. (2021) considered carbon tax as the core of policy intervention, arguing that its impact on the cost of traditional energy is the primary mechanism driving carbon emissions reductions. However, their research was limited to the analysis of the effects of a single policy and did not quantify the cumulative effects of multiple policy combinations over different time scales. Building on this, this study introduces a combination of carbon tax, technology subsidies, and green standards, providing a comprehensive assessment of the medium-to long-term impacts of policy synergies on carbon emissions in the tourism industry. The study specifically verified the key role of the carbon tax and technology subsidies combination in the popularization of new energy vehicles in the transportation sector, addressing the lack of comprehensiveness in single-policy research. Finally, regarding the low-carbon promoting effect of technology subsidies, Li et al. (2024) emphasized the core role of government subsidies in promoting the research and development of new energy technologies, particularly in manufacturing applications. However, their study did not consider the synergy between policies and technologies in the scenario setting, nor did it analyze the specific impact of subsidies on energy efficiency improvements in various consumption scenarios. In contrast, this study reveals the synergistic effects of technology subsidies and green standards in the tourism industry, especially their dual role in improving energy efficiency in the accommodation sector.
From a theoretical perspective, this study deepens research on carbon emissions and sustainable development in the tourism industry, enriching the application of system dynamics models in low-carbon development scenarios. The results highlight the key role of green technologies and policy combinations in carbon reduction. In practice, the study suggests that first, the carbon reduction synergies should be enhanced through policy combinations, such as gradually introducing phased carbon taxes, encouraging the research and application of green energy technologies, and implementing strict green standards covering tourism sectors like transportation and accommodation. This comprehensive intervention can reduce high-emission behaviors in the short term while promoting long-term green transformation. Second, differentiated policies should be formulated based on regional characteristics. For example, in Hubei Province, renewable energy should be prioritized, with a focus on supporting the technological transformation of high-energy-consuming facilities, and after piloting, such measures should be promoted to other similar regions. Finally, efforts should be made to strengthen the supply capacity of green products and services within the tourism sector, particularly by promoting the establishment of “low-carbon certification” systems and dynamic incentive mechanisms in key areas such as transportation and accommodation. By improving standards for low-carbon infrastructure and developing a green star-rating system, tourism enterprises can be guided to cultivate differentiated green competitive advantages. This approach enhances the overall intensity and pace of green supply-side transformation—without relying on modeling individual consumer preferences—thereby enabling indirect guidance and regulation of carbon emissions in the tourism industry.
Although this study has made significant progress in revealing the optimization effect of low-carbon policies on tourism industry carbon emission paths, it still has some limitations. First, the research data primarily comes from regional statistics in Hubei Province, which may limit the generalizability of the conclusions to other regions. Different regions have significantly different economic structures, energy consumption characteristics, and policy environments. Second, while the system dynamics model in this study can capture the dynamic effects of policy interventions, the variables and causal relationships in the model may oversimplify the complexity of real-world issues, such as consumer behavior and market responses, which were not fully reflected in the model. Finally, although the time span of this study extends to 2033, it does not consider the potential disruptions to carbon emission paths caused by sudden events (such as economic crises or technological breakthroughs).
6 Conclusion
This study applies a system dynamics model to simulate the optimized carbon emission pathways of the tourism industry in Hubei Province under low-carbon policy scenarios and investigates the dynamic impacts of various policy combinations on carbon emission control. The central conclusions of the study are as follows:
(1) Under the baseline scenario, with the continued expansion of tourism activities, carbon emissions from the tourism industry increase from 1 million tons in 2013 to 1.8229 million tons in 2033, reflecting an average annual growth rate of 3.36%. Although the proportion of renewable energy steadily rises over time, carbon emissions continue to grow in tandem with tourism revenue, indicating that the industry has not yet achieved an effective decoupling between carbon reduction and value creation.
(2) In the enhanced low-carbon scenario, all types of policy combinations significantly curb the expansion of carbon emissions. Among them, the comprehensive joint policy scenario performs the best, with carbon emissions decreasing to 1.412 million tons by 2033—a 22.5% reduction compared to the baseline—while tourism revenue declines by only 0.4%, essentially maintaining its original growth trajectory. This reflects a strong synergy between policy interventions and economic performance. Sensitivity analysis further reveals that policy intensity and technological advancement exert substantial influence on carbon emission forecasts. Moreover, the comprehensive policy scenario demonstrates stronger stability in mitigating system uncertainty, highlighting its superior capacity for maintaining environmental equilibrium.
This study uses a system dynamics model to verify the impact of low-carbon policy combinations on carbon emission control in the tourism industry, while outlining several directions for future research. At the data level, future studies will expand the sample coverage by incorporating a broader range of regions with representative characteristics in terms of economic structure, energy use, and policy environment, thereby enhancing the model’s external applicability and generalizability. Additionally, national “dual-carbon” strategic trajectories will be integrated into the scenario settings by constructing parameter mapping between regional outcomes and national carbon neutrality goals. This aims to bridge the logical gap in regional extrapolation and improve the model’s policy relevance in supporting national-level strategies. In terms of model structure, more sophisticated mechanisms of consumer behavior responses and market feedback loops will be introduced. Specifically, the evolutionary process of tourists’ green preferences and its impact on energy structure choices will be refined to more accurately simulate the underlying mechanisms of low-carbon policies. Moreover, recognizing that real-world policy outcomes are often subject to unexpected external shocks, future studies will incorporate a “disturbance module” into the existing system dynamics framework. This module will simulate scenarios such as public health emergencies (e.g., pandemics), major technological breakthroughs, or macroeconomic crises. By establishing a “stock-flow” stress-response mechanism, the model will evaluate the resilience and recovery pathways of tourism carbon emissions systems under extreme disruptions, thereby strengthening its capacity to capture the non-linear complexities of real-world conditions.
Data availability statement
The original contributions presented in the study are included in the article/supplementary material, further inquiries can be directed to the corresponding author.
Author contributions
YL: Conceptualization, Data curation, Formal Analysis, Methodology, Visualization, Writing – original draft, Writing – review and editing. FL: Funding acquisition, Investigation, Project administration, Resources, Software, Supervision, Validation, Writing – original draft, Writing – review and editing.
Funding
The author(s) declare that financial support was received for the research and/or publication of this article. The Hainan Provincial Philosophy and Social Science Planning Project, Hainan Social Science Fund Project: Study on the Pattern, Mechanism and Path of Carbon Emission Reduction Effect of Multi-scale Energy Technology Innovation in Hainan (Project No: HNSK (Yb) 22-46). The Hainan Provincial Natural Science Foundation High-level Talent Project, Hainan Natural Science Foundation Project: Study on Spatial-temporal Pattern, Evolution Mechanism and Promotion Path of Carbon Emission Reduction Effect of Multi-scale Energy Technology Innovation in China (Project No: 721RC605).
Conflict of interest
The authors declare that the research was conducted in the absence of any commercial or financial relationships that could be construed as a potential conflict of interest.
Generative AI statement
The author(s) declare that no Generative AI was used in the creation of this manuscript.
Publisher’s note
All claims expressed in this article are solely those of the authors and do not necessarily represent those of their affiliated organizations, or those of the publisher, the editors and the reviewers. Any product that may be evaluated in this article, or claim that may be made by its manufacturer, is not guaranteed or endorsed by the publisher.
References
Anwar, A., Siddique, M., Dogan, E., and Sharif, A. (2021). The moderating role of renewable and non-renewable energy in environment-income nexus for ASEAN countries: evidence from Method of Moments Quantile Regression. Renew. Energy 164, 956–967. doi:10.1016/j.renene.2020.09.128
Baryshnikov, Y. (2022). Topological perplexity of feedback stabilization. J. Appl. Comput. Topol. 7, 75–87. doi:10.1007/s41468-022-00098-2
Deng, W., Zhang, Z., Wang, H., and Li, M. (2024). Improving urban energy efficiency through the collaborative effect of policy mix–urban panel analysis based on China. Pol. J. Environ. Stud. 33 (6), 6083–6095. doi:10.15244/pjoes/185349
Dong, J., Tian, J., Lin, H., Suo, X., Wu, H., and Zeng, R. (2024). Can corporate digital innovation speed up climate change mitigation? Evidence from China. IEEE Trans. Eng. Manag. 71, 7797–7814. doi:10.1109/TEM.2024.3386181
Erdoğan, S., Yıldırım, S., Yıldırım, D. Ç., and Gedikli, A. (2020). The effects of innovation on sectoral carbon emissions: evidence from G20 countries. J. Environ. Manage. 267, 110637. doi:10.1016/j.jenvman.2020.110637
Gao, X., Zhu, A., and Yu, Q. (2023). Exploring the carbon abatement strategies in shipping using system dynamics approach. Sustainability 15 (18), 13907. doi:10.3390/su151813907
Hasanov, F. J., Khan, Z., Hussain, M., and Tufail, M. (2021). Theoretical framework for the carbon emissions effects of technological progress and renewable energy consumption. Sustain. Dev. 29 (5), 810–822. doi:10.1002/SD.2175
Hong, Y., Ma, L., Kang, S., and Zhang, G. (2025). Decoupling carbon emissions from economic growth in China's textile industry: a decomposition of driving factors. Front. Environ. Sci. 13, 1587498. doi:10.3389/fenvs.2025.1587498
Hu, H., Dong, W., and Zhou, Q. (2021). A comparative study on the environmental and economic effects of a resource tax and carbon tax in China: analysis based on the computable general equilibrium model. Energy Policy 156, 112460. doi:10.1016/J.ENPOL.2021.112460
Julita, J., Basri, G. A., and Anastasia, M. (2024). Analysis of green hotel implementation at holiday inn jakarta kemayoran. Int. J. Green Tour. Res. Appl. 6 (1), 21–32. doi:10.31940/ijogtra.v6i1.21-32
Li, F., and Zhang, Y. (2024). Simulation of development strategies and evaluation of low-carbon development level in jiangsu Province under carbon peaking and carbon neutrality goals. Sustainability 16 (4), 1597. doi:10.3390/su16041597
Li, G., and Wei, W. (2021). Financial development, openness, innovation, carbon emissions, and economic growth in China. Energy Econ. 97, 105194. doi:10.1016/J.ENECO.2021.105194
Li, M., Cao, G., Li, H., Hao, Z., and Zhang, L. (2024). How government subsidies affect technology innovation in the context of Industry 4.0: evidence from Chinese new-energy enterprises. Kybernetes 53 (11), 4149–4171. doi:10.1108/k-08-2022-1098
Lin, G., Jiang, D., Fu, J., and Yin, Y. (2022). Pathways for the carbon peak of resource-based cities under an energy-water coupling relationship: a case study of Taiyuan, Shanxi Province. Front. Environ. Sci. 10, 994543. doi:10.3389/fenvs.2022.994543
Qian, L., Xu, X., Zhou, Y., Sun, Y., and Ma, D. (2023). Carbon emission reduction effects of the smart city pilot policy in China. Sustainability 15 (6), 5085. doi:10.3390/su15065085
Ridwan, M., Akther, A., Al Absy, M. S. M., Tahsin, M. S., Bin Ridzuan, A. R., Yagis, O., et al. (2024). The role of tourism, technological innovation, and globalization in driving energy demand in major tourist regions. Int. J. Energy Econ. Policy 14 (6), 675–689. doi:10.32479/ijeep.17344
Savio, A., De Giovanni, L., and Guidolin, M. (2022). Modelling energy transition in Germany: an analysis through ordinary differential equations and system dynamics. Forecasting 4 (2), 438–455. doi:10.3390/forecast4020025
Shafiee, S., Jahanyan, S., Ghatari, A., and Hasanzadeh, A. (2022). Developing sustainable tourism destinations through smart technologies: a system dynamics approach. J. Simul. 17, 477–498. doi:10.1080/17477778.2022.2030656
Sorokin, A. B., Zheleznyak, L. M., Suprunenko, D. V., and Kholmogorov, V. V. (2022). Designing modules of system dynamics in decision support systems. Russ. Technol. J. 10 (4), 18–26. doi:10.32362/2500-316x-2022-10-4-18-26
Sun, W., Zhao, Y., Li, Z., Yin, Y., and Cao, C. (2022). Carbon emission peak paths under different scenarios based on the LEAP model—a case study of suzhou, China. Front. Environ. Sci. 10, 905471. doi:10.3389/fenvs.2022.905471
Sun, Y., Kamran, H. W., Razzaq, A., Qadri, F. S., and Suksatan, W. (2021). Dynamic and causality linkages from transportation services and tourism development to economic growth and carbon emissions: new insights from Quantile ARDL approach. Integr. Environ. Assess. Manag. 18 (5), 1272–1287. doi:10.1002/ieam.4570
Tang, A. Q., and Mizunoya, T. (2021). A study on selecting greenhouse gas reduction options: a simulation analysis for vietnam. Sustainability 13 (24), 13530. doi:10.3390/su132413530
Tang, L., Guo, J., Zhao, B., Wang, X., Shao, C., and Wang, Y. (2021). Power generation mix evolution based on rolling horizon optimal approach: a system dynamics analysis. Energy 224, 120075. doi:10.1016/J.ENERGY.2021.120075
Wang, X. (2024). High quality development strategy of tourism industry supply chain driven by the. Acad. J. Bus. Manag. 6 (9). doi:10.25236/ajbm.2024.060930
Wei, W., Xin-gang, Z., Wenjie, L., and Shuran, H. (2023). The sustainable development of a low-carbon system using a system dynamics model: a case study of China. J. Renew. Sustain. Energy 15 (1). doi:10.1063/5.0130437
Yang, H., Li, X., Li, L., and Li, Z. (2021). Using system dynamics to analyse key factors influencing China's energy-related CO2 emissions and emission reduction scenarios. J. Clean. Prod. 320, 128811. doi:10.1016/J.JCLEPRO.2021.128811
Yıldırım, D. Ç., Ektiren, B., and Erdoğan, F. (2023). The threshold effect of tourism, growth, and population interactions on environmental pollution in Mediterranean countries. Tour. Manag. Perspect. 47, 101118. doi:10.1016/j.tmp.2023.101118
Yıldırım, S., Yıldırım, D. Ç., Aydın, K., and Erdoğan, F. (2021). Regime-dependent effect of tourism on carbon emissions in the Mediterranean countries. Environ. Sci. Pollut. Res. 28 (39), 54766–54780. doi:10.1007/s11356-021-14391-7
Yuan, F., Su, L., Wang, S., Yu, J., Wang, Y., Teng, Y., et al. (2022). A study on carbon emission forecasting in the power industry under the background of new power system. Proc. 2022 Int. Conf. Electr. Eng. Control Sci. (IC2ECS), 306–311. doi:10.1109/IC2ECS57645.2022.10087952
Zeng, Y., Zhang, W., Sun, J., Sun, L. A., and Wu, J. (2023). Research on regional carbon emission reduction in the beijing–tianjin–hebei urban agglomeration based on system dynamics: key factors and policy analysis. Energies 16 (18), 6654. doi:10.3390/en16186654
Zhang, W., Ji, C., Liu, Y., Hao, Y., Song, Y., Cao, Y., et al. (2024). Dynamic interactions of carbon trading, green certificate trading, and electricity markets: insights from system dynamics modeling. PLOS ONE 19, e0304478. doi:10.1371/journal.pone.0304478
Zhang, W., Zhang, M., Wu, S., and Liu, F. (2021). A complex path model for low-carbon sustainable development of enterprise based on system dynamics. J. Clean. Prod. 321, 128934. doi:10.1016/j.jclepro.2021.128934
Zhang, W., Zhao, B., Jiang, Y., Nie, Y., Sharp, B., Gu, Y., et al. (2022). Co-benefits of regionally-differentiated carbon pricing policies across China. Clim. Policy 24, 57–70. doi:10.1080/14693062.2022.2119198
Zhang, Y. (2024). Carbon emissions dynamics and environmental sustainability in China’s tourism sector: a 22-year comprehensive regional study. Sustainability 16 (16), 7091. doi:10.3390/su16167091
Appendix A: Core equation list of the system dynamics model
This appendix presents the five core equations of the system dynamics model, encompassing the estimation of carbon emissions in the tourism sector, the mechanism of energy consumption growth, and the regulatory pathways through which policy and technology influence carbon intensity. Table A1 summarizes the equation number, equation name, mathematical expression, and the corresponding functional description within the model, thereby facilitating a clear understanding of the model’s structure and operational logic.
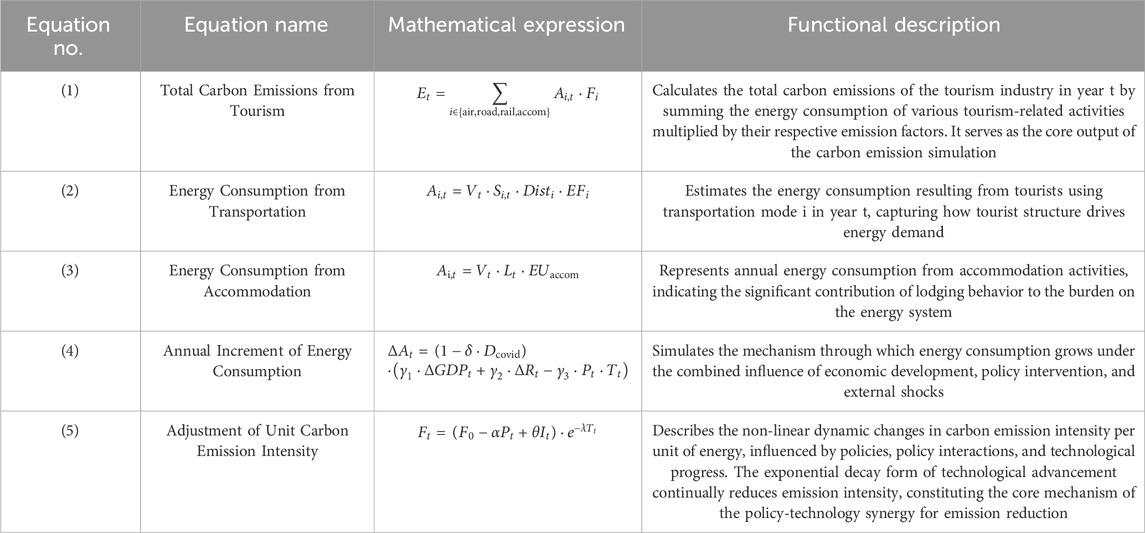
TABLE A1. Core Equations of the system dynamics model and their functional descriptions.
Keywords: low-carbon policy, tourism industry, carbon emissions, system dynamics, scenario simulation
Citation: Long Y and Li F (2025) Policy simulation and analysis of the optimal growth path of carbon emissions in Hubei Province’s tourism industry under low-carbon scenario. Front. Environ. Sci. 13:1595465. doi: 10.3389/fenvs.2025.1595465
Received: 18 March 2025; Accepted: 10 June 2025;
Published: 24 June 2025.
Edited by:
Durmuş Çağrı Yıldırım, Namik Kemal University, TürkiyeReviewed by:
Valentin Vasilev, Higher School of Security and Economics, BulgariaTuğba Kantarcı, Gelisim University, Türkiye
Gamze Yıldız Şeren, Namik Kemal University, Türkiye
Copyright © 2025 Long and Li. This is an open-access article distributed under the terms of the Creative Commons Attribution License (CC BY). The use, distribution or reproduction in other forums is permitted, provided the original author(s) and the copyright owner(s) are credited and that the original publication in this journal is cited, in accordance with accepted academic practice. No use, distribution or reproduction is permitted which does not comply with these terms.
*Correspondence: Feng Li, YXJibXllb25AaG90bWFpbC5jb20=