 Yi Zhu
 Xieqihua Liu1†
 Chao Feng
 Tao Zhang
 Xi Wang
- 1Faculty of Humanities and Social Sciences, Macao Polytechnic University, Macao, China
- 2Department of Economic Management, CPC Guizhou Provincial Party School, Guiyang, China
- 3School of Economics and Management, Jiangxi Agricultural University, Nanchang, China
This study analyzes energy-related carbon emissions in the Yangtze River Economic Belt (YREB) from 2000 to 2022 using regional energy consumption data and IPCC guidelines. The Mann-Kendall trend test and mutation point detection methods are applied to examine emission trends and structural shifts. The Kaya identity and Logarithmic Mean Divisia Index (LMDI) approach are used to decompose the impacts of energy structure, economic activity, population, and energy intensity on carbon emissions across subregions. The results show that since 2000, the growth rate of carbon emissions across the YREB has slowed significantly, with annual growth remaining below 2.5% since 2012. The energy mix has improved, with coal’s share decreasing from 77% to 69%, while natural gas and electricity’s combined share grew from 1% to 4%. Regionally, emissions in the Midstream reaches have peaked and are declining, while the Upstream reaches are nearing their peak. Although the Downstream reaches have not yet peaked, their emission growth has markedly decelerated. Overall, energy intensity and structural optimization have suppressed emissions, while economic growth and population expansion remain the dominant drivers. These findings highlight the need for continued optimization of both energy and industrial structures, with differentiated carbon reduction strategies tailored to each subregion’s unique characteristics and development stages within the YREB.
1 Introduction
As human society continues to develop, the ongoing intensification of global warming has led to a rising frequency of extreme climate events—such as floods, heatwaves, and desertification—which increasingly threaten human survival and safety. In particular, carbon dioxide (CO2) emissions from energy consumption accounted for 30.7% of global CO2 emissions in 2022 (Wayth, 2023). Consequently, the mitigation of carbon emissions from energy use has become a focal point of international scientific inquiry. Major global economies have reached a broad consensus on curbing ecological degradation and limiting global temperature rise (Minx et al., 2021).
As the world’s largest energy consumer and carbon emitter, China plays a pivotal role in the realization of global emission reduction targets, including the Paris Agreement and Nationally Determined Contributions (NDCs). China’s commitment to peak carbon emissions before 2030 and achieve carbon neutrality before 2060—commonly referred to as the “dual carbon” goals—will be decisive in meeting these international commitments (Li and Zhang, 2024). According to the Statistical Communiqué of the People’s Republic of China on the 2023 National Economic and Social Development, China’s total energy consumption reached 5.72 billion tons of standard coal in 2022, with coal accounting for 55.3% of the energy mix. This indicates a continued heavy reliance on high-carbon fossil fuels.
The YREB, which spans nine provinces and two centrally administered municipalities along the Yangtze River, crosses China’s eastern, central, and western regions. It is one of the world’s most densely populated, industrially concentrated, and urbanized river basins, and remains one of China’s most dynamic and economically promising regions (He et al., 2025). As a crucial pillar of the national economy, the YREB contributes nearly half of China’s GDP. Its energy consumption and associated carbon emissions have a substantial impact on the country’s overall emissions profile. However, the region increasingly faces challenges related to energy consumption and carbon emissions, which now constitute key constraints on its sustainable development.
Low-carbon development is widely recognized as a strategic pathway to address the region’s environmental and resource constraints, ensure ecological security, and achieve long-term sustainability. In response, the Chinese government has implemented several policy initiatives aimed at promoting green development across the YREB. The 13th Five-Year Plan for National Economic and Social Development emphasized that total energy consumption within the YREB should be capped at five billion tons of standard coal equivalent. More recently, the 14th Five-Year Implementation Plan for the Development of the Yangtze River Midstream Reaches Urban Agglomeration (2022) highlighted the necessity of enhanced interprovincial coordination to facilitate a smooth and effective low-carbon transition across the region.
Given the vast geographical coverage of the YREB and the significant heterogeneity in energy consumption characteristics across its constituent provinces and cities, a detailed analysis of the spatial and temporal patterns of energy-related carbon emissions—and their driving factors—is essential. Such research will not only inform regional policy decisions but also provide critical insights into the broader realization of China’s “dual carbon” objectives.
The remainder of this paper is organized as follows: Section 2 reviews the relevant literature; Section 3 outlines the methodological framework, empirical model, and data sources; Section 4 presents and analyzes the empirical results; Section 5 offers an in-depth discussion; and Section 6 concludes with key findings, policy implications, research limitations, and directions for future study.
2 Literature review
In recent years, domestic and international scholars have conducted extensive research on the factors influencing carbon emissions using various methodologies. The literature primarily falls into the following three thematic categories:
(1) Methodologies for Carbon Emissions AccountingIn the context of global climate change, carbon emissions from energy consumption serve as a critical indicator for assessing a country’s overall carbon footprint. Accurate estimation methods have thus garnered significant scholarly attention. Among the numerous methods employed, the input–output method, direct measurement, and emission coefficient approach are most widely used. The input–output method is particularly suited for macroeconomic analyses and policy development, offering actionable insights for governments and enterprises. For instance, Zhu et al. (2012) developed an input–output model to estimate indirect carbon emissions from residential consumption in China, revealing a distinct urban–rural disparity and relatively low per capita emissions compared to Western nations.The direct measurement approach, while accurate in specific contexts, is limited by data availability and the influence of geographic and environmental factors. Nevertheless, it has been applied across multiple domains, including vehicle emissions, industrial machining processes, and agricultural carbon footprints (Li et al., 2015). Wang et al. (2015) proposed a plume-based analysis to identify high-emission vehicles through real-time monitoring in Canada. Amediek et al. (2017) employed a novel airborne lidar system to monitor CO2 and CH4 emissions and quantify major point sources. The emission coefficient method, based on experimental data and emission factors, is straightforward and widely adopted. Hutchins et al. (2017) compared high-resolution fossil-fuel CO2 inventories across the U.S., contributing to the development of spatially explicit databases. Similarly, Fang et al. (2019) used the LMDI decomposition method to estimate the carbon emissions of urban households in Beijing between 2006 and 2016, noting a rapid average annual growth rate of 7.29%. Overall, the IPCC inventory method, a top-down approach, remains widely used due to its simplicity and accuracy for national and regional carbon accounting.
(2) Spatiotemporal Characteristics of Carbon Emissions. Understanding the spatial and temporal dynamics of carbon emissions is essential for formulating region-specific mitigation strategies. Such studies are typically conducted at national, regional, and urban scales. Nassar et al. (2013) improved the temporal and spatial resolution of global fossil fuel emission datasets, offering weekly and daily insights via satellite data integration. In China, Hu et al. (2015) employed ESDA and GWR models to analyze provincial carbon emissions between 1997 and 2012, identifying significant spatial autocorrelation. Cheng et al. (2023) further examined the spatiotemporal performance of provincial carbon emissions from 2002 to 2018, uncovering an east-to-west decreasing gradien. Other studies have addressed specific spatial dimensions such as river basins (Wang et al., 2021), urban agglomerations (Qian et al., 2022), and ports (Gian et al., 2020). At the sectoral level, Su et al. (2017) analyzed carbon emissions from China’s power sector between 2007 and 2012, identifying a steady upward trend. Xu et al. (2017) conducted an empirical analysis of carbon emissions in 18 central Chinese cities from 2000 to 2014, estimating contributions from fossil fuel combustion and industrial processes. Collectively, these studies suggest that most research has concentrated on national and provincial levels, with limited focus on intra-regional variations and multi-scalar spatial dynamics.
(3) Driving Factors of Carbon Emissions. Identifying the key drivers of carbon emissions is crucial for designing effective mitigation policies. Numerous studies have empirically examined these factors. Shuai et al. (2017), analyzing panel data from 125 countries between 1990 and 2011 using the STIRPAT model, found that affluence, technological progress, and population size ranked as the dominant drivers, in that order. In a regional study of Xinjiang, Wang et al. (2017) segmented the timeline into three historical periods and identified economic growth and industrial expansion as primary contributors to emissions. Yu et al. (2019) explored the relationship between carbon emissions and resource endowments under environmental regulation, concluding a positive correlation between energy endowment and emissions. Chen et al. (2023) used the LMDI model to decompose the contributing factors to per capita emissions in China from 2011 to 2019, quantifying their individual impacts. Broader analyses have consistently highlighted economic output, population dynamics, industrial structure, urbanization, technological advancement, and environmental regulation as significant determinants (Pan and Guo, 2024; Wang et al., 2025; Li et al., 2024).
Despite the wealth of studies on carbon accounting methods, spatiotemporal trends, and driving mechanisms, several limitations persist. Many existing works focus primarily on national or provincial levels, neglecting multi-scale, cross-regional analyses within economic belts. Moreover, most studies rely on single-method approaches, limiting comprehensive understanding of carbon drivers. In the case of the YREB, prior research has disproportionately focused on either the entire region or specific urban clusters, with insufficient attention paid to upstream–midstream–downstream differentiation.
To address these gaps, the present study investigates the spatiotemporal evolution and driving forces of carbon emissions in the YREB from 2000 to 2022 using a combined Kaya identity and LMDI decomposition approach. Special attention is given to the dynamic evolution of the energy structure and its impact on carbon emissions. The Belt is divided into upstream, midstream, and downstream segments to explore intra-regional heterogeneity, thereby providing empirical evidence to inform region-specific mitigation policies.
This study offers three main contributions:
(1) This study enhances spatial granularity and emphasizes regional heterogeneity. In contrast to existing literature that predominantly focuses on national or provincial levels, this paper disaggregates the Yangtze River Economic Belt into upper, middle, and lower reaches. It identifies temporal turning points and structural differences in the evolution of carbon emissions, thereby systematically revealing interregional heterogeneity in energy structure transitions and emission-driving mechanisms.
(2) This study innovatively integrates the Kaya identity with the Logarithmic Mean Divisia Index (LMDI) model. While previous studies often rely on a single decomposition approach—such as STIRPAT or the traditional LMDI framework—this paper embeds the Kaya identity into the LMDI decomposition, enabling a more comprehensive and multidimensional analysis of carbon emission drivers. This integrated approach improves both the systematic nature and explanatory power of the mechanism analysis.
(3) The study offers differentiated policy implications tailored to regional contexts. Unlike prior research that tends to propose generic emission reduction strategies, this paper develops practical policy recommendations based on disaggregated empirical findings. By considering differences in energy and economic structures across regions, it highlights the importance of coordinated governance and targeted measures under differentiated pathways, thereby enhancing both the feasibility and applicability of policy responses.
3 Materials and methods
3.1 Study area
As the largest river in both Asia and China, the Yangtze River spans across the eastern, central, and western regions of the country, exhibiting diverse topographical features and complex ecosystems. With a total water resource volume of 1.286 trillion cubic meters and 658 nationally designated nature reserves (Zhu et al., 2024), the Yangtze River serves as a crucial biological gene bank and an essential ecological security barrier for China. As shown in Figure 1, the YREB extends across 11 provinces and municipalities, including Shanghai, Zhejiang, Jiangsu, Anhui, Jiangxi, Hubei, Hunan, Chongqing, Sichuan, Yunnan, and Guizhou. Covering a total area of 2.0523 million km2—approximately 21.4% of China’s total landmass—the YREB accounts for over 40% of the national population and economic output. In 2022, the region’s average urbanization rate reached 63.22%, while its total GDP amounted to 55.98 trillion RMB. As one of the world’s largest economic corridors and the most densely populated and industrialized region in China (Miao and Sun, 2020), the YREB exhibits substantial regional diversity in both natural conditions and human activities due to variations in latitude, longitude, and elevation. However, the well-developed agricultural and manufacturing industries require substantial energy consumption, with the total energy consumption in the YREB reaching
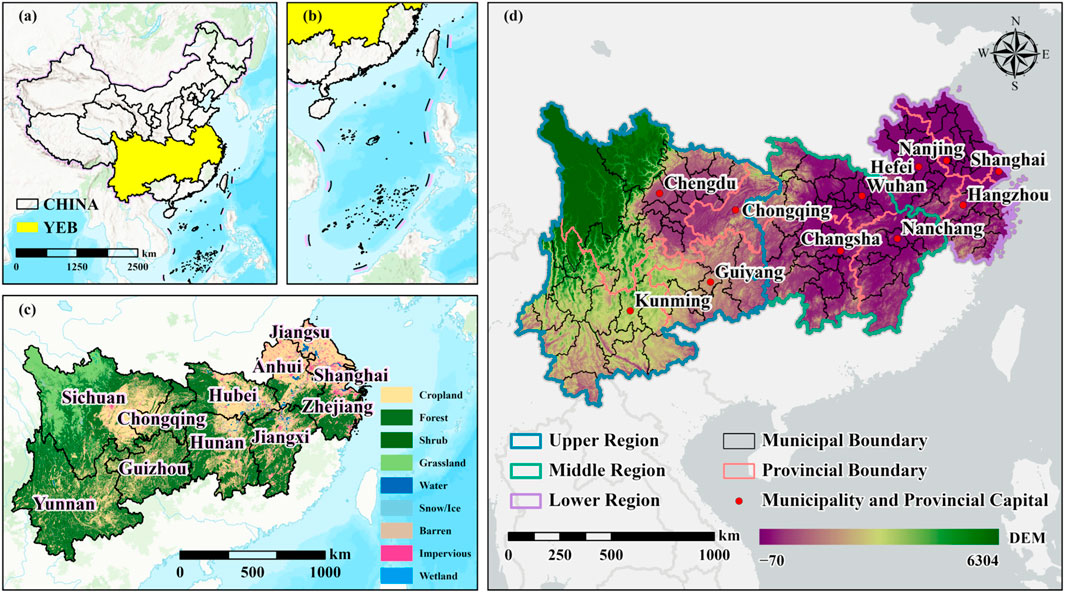
Figure 1. Geographic scope of the study area.
3.2 Data sources
This study selects the eleven provinces constituting the YREB as the primary sample. The dataset comprises annual data from 2000 to 2022, including energy consumption, permanent resident population, gross domestic product (GDP), and sector-specific energy use across the primary, secondary, and tertiary industries. All data are derived from provincial Statistical Yearbooks (2001–2023), such as the Shanghai Statistical Yearbook, as well as from the China Energy Statistical Yearbook (2000–2023). Informed by the actual characteristics of energy consumption in the YREB and the availability and continuity of historical data, this study draws upon prior empirical insights to guide variable selection and methodological design (Wang et al., 2024; Tang et al., 2019). Specifically, nine major energy categories—coal, coke, crude oil, gasoline, kerosene, diesel, fuel oil, natural gas, and electricity—are incorporated into the analysis. The carbon content coefficients and standard coal conversion factors for these energy sources are adopted from the 2006 IPCC Guidelines for National Greenhouse Gas Inventories. Missing data, which are relatively minor and sporadically distributed across certain provinces and years, are addressed with targeted imputation strategies. For isolated gaps within time series, linear interpolation based on adjacent years is applied. For entire missing values in specific years for certain provinces, imputation is guided by data from neighboring provinces with similar economic structures and energy consumption patterns.
3.3 Research methodology
3.3.1 Calculation of carbon emissions from energy consumption
The estimation of carbon emissions from energy consumption in this study is based on annual energy consumption data for various energy types across the 11 provinces of the YREB. Carbon emissions were calculated following the methodology outlined in the 2006 IPCC Guidelines for National Greenhouse Gas Inventories (IPCC, 2006). Specifically, this approach provides standardized emission factors and estimation formulas tailored to different categories of energy use and fuel types, ensuring methodological consistency and international comparability in emissions accounting (IPCC, 2006). The corresponding equation employed for quantifying emissions from each type of energy is as follows:
In Equations 1–3,
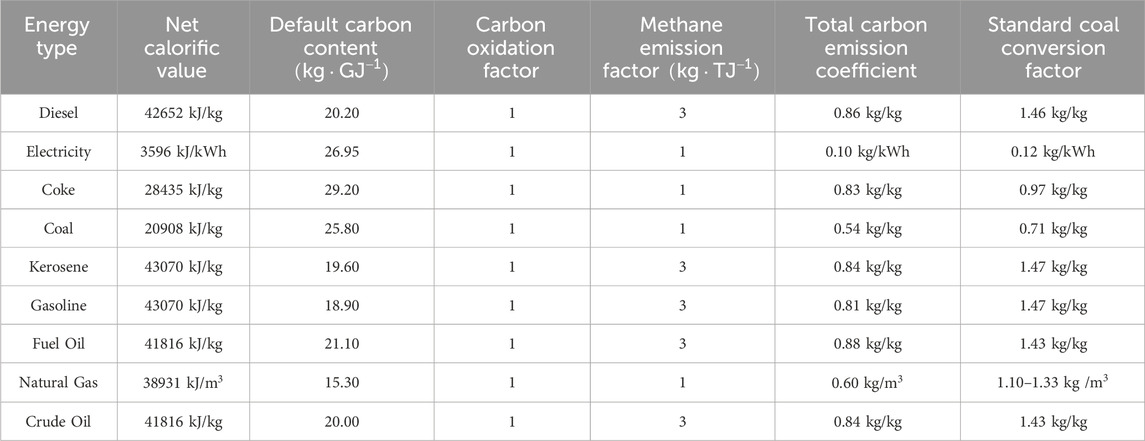
Table 1. Standard coal conversion factors and carbon emission coefficients.
3.3.2 Abrupt change analysis of carbon emissions from energy consumption
In this study, the Mann–Kendall (MK) trend test was employed primarily due to its non-parametric characteristics and minimal assumptions regarding the distribution of data. Unlike conventional parametric approaches such as linear regression or the t-test, the MK test does not require the data to follow a normal distribution, making it particularly well-suited for analyzing time series data that may be non-normally distributed, contain missing values, or exhibit outliers (Hamed and Rao, 1998; Ogundele et al., 2022). Additionally, the MK test is robust against outliers and is capable of reliably detecting monotonic trends—i.e., consistent increases or decreases over time—without assuming linearity. These methodological advantages have led to its widespread application in environmental science, climate change, and hydrological research. For instance, Yue et al. (2002) demonstrated the MK test’s high robustness and reliability in handling autocorrelated and non-normally distributed hydrological time series data. Furthermore, the MK test can be integrated with Sen’s slope estimator to quantify the magnitude of detected trends. In comparison, while other non-parametric tests such as Spearman’s rank correlation also serve as tools for trend analysis, they may introduce biases when applied to autocorrelated data. Therefore, considering both the nature of the data and the suitability of different methods, the MK test was selected in this study to identify the change points in carbon emissions from energy consumption within the YREB.
First, for a time series x with a sample size of n, an ordered sequence
Then, under the assumption that the time series is independently and randomly distributed, the test statistic is defined as follows:
In Equation 6,
The test statistic
3.3.3 Analysis of factors influencing carbon emissions from energy consumption
Among existing methodological approaches, econometric regression analysis typically requires large data samples to ensure statistical reliability. However, the factors influencing carbon emissions span across multiple socioeconomic domains, which complicates model construction. When the number of research subjects is limited, the available dataset often fails to meet the precision requirements of econometric models. This leads to low statistical significance for some regression parameters, thereby weakening explanatory power and limiting the broader applicability of the findings (Dong et al., 2018; Zhao et al., 2022). In contrast, structural decomposition analysis (SDA), particularly the Logarithmic Mean Divisia Index (LMDI) method, offers key advantages—such as zero residuals and strong interpretability—which make it especially suitable for macro-level entities such as provinces or municipalities (Sun and Huang, 2022). Nonetheless, the LMDI method is constrained by its mathematical formulation: the decomposed ratios, composed of binary variables, must be clearly attributable to specific socioeconomic indicators. As such, LMDI-based decomposition is typically confined to carbon emissions from energy consumption, ensuring robust correspondence between decomposition factors and measurable socioeconomic variables. In this study, we adopt the Kaya Identity as the theoretical foundation to develop a stepwise LMDI-based model for analyzing the drivers of carbon emissions. Originally proposed by Japanese scholar Yoichi Kaya in the IPCC context, the Kaya Identity establishes a quantitative relationship between carbon emissions and key factors such as population, policy, and economic activity (Kaya, 1983). Its general formulation, shown in Equation 9, allows for wide applicability, conceptual clarity, and empirical measurability. As a result, the Kaya Identity has been extensively applied in studies of low-carbon energy transitions (Lin et al., 2023; Shi, 2021).
In Equation 9, A represents the total carbon emissions, B denotes the carbon emissions generated by various energy sources, C indicates the consumption of different types of energy, D refers to the total energy consumption, GDP stands for the gross domestic product, and P represents the total population. This identity facilitates a theoretical understanding of the driving forces behind carbon emissions, but it does not, in itself, possess the capability to quantitatively disentangle the contributions of individual factors.
The carbon emission coefficient of energy is defined as
Building upon this, and drawing on the Logarithmic Mean Divisia Index (LMDI) method proposed by Ang (2015), the driving factors of energy-related carbon emissions are decomposed into five distinct effects: (
The equation for calculating the change in carbon emissions from energy consumption in the YREB over the study period is expressed as follows:
The comprehensive effect
4 Results and analysis
4.1 Temporal characteristics and trends of carbon emissions from energy consumption
First, a multicollinearity test was conducted on total carbon emissions from energy consumption, population, and GDP. The results indicate that the highest variance inflation factor (VIF) value is 1, which is well below the critical threshold of 10. This suggests that multicollinearity is not a significant concern. The regression results of the model are presented in Table 2.
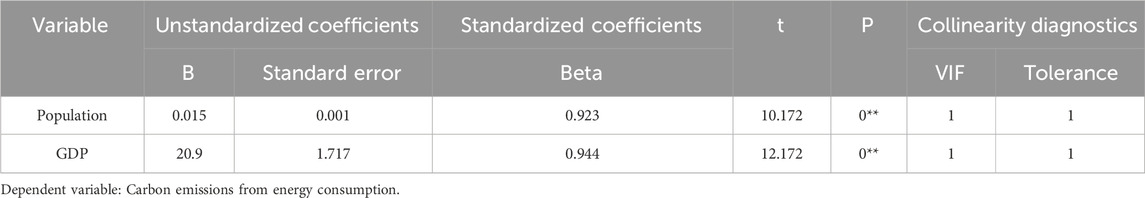
Table 2. Collinearity diagnostics for population, GDP, and total carbon emissions from energy consumption.
By calculating key indicators such as the total carbon emissions from energy consumption, growth rate, carbon emissions per unit of GDP, and per capita carbon emissions from energy consumption in the 11 provinces of the YREB from 2000 to 2022, several notable trends emerge. As shown in Figure 2a, both the total carbon emissions from energy consumption and per capita emissions exhibit a fluctuating upward trend. The cumulative total carbon emissions from energy consumption reached
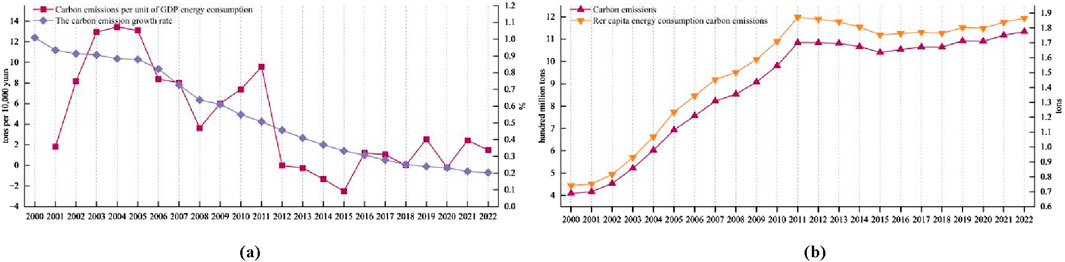
Figure 2. Trends in energy consumption and carbon emissions in the Yangtze river economic belt from 2000 to 2022. (a) Total and per capita carbon emissions from energy consumption. (b) Growth rate and carbon emissions per unit GDP from energy consumption.
However, as illustrated in Figure 2b, the growth rate of carbon emissions has shown a significant decline during this period. Between 2000 and 2022, the average annual growth rate of carbon emissions across the YREB remained at 4.40%. Nevertheless, since 2012, this rate has been effectively controlled below 2.50%, with 5 years experiencing negative growth. From 2012 to 2022, the average annual growth rate further declined to 0.4%. Notably, carbon emissions per unit of GDP have also exhibited a significant downward trend, decreasing from 1.01 t/10,000 yuan in 2000 to 0.21 t/10,000 yuan in 2022. This trend aligns with China’s 14th Five-Year Plan, which emphasizes reducing carbon emissions per unit of GDP. Looking ahead, economic development will no longer rely solely on high energy consumption and high carbon emissions but will instead transition toward clean and low-carbon energy sources, driving industrial restructuring.
Significant regional disparities in both the total volume and proportional contributions of energy-related carbon emissions are evident across the Upstream, Midstream, and Downstream reaches of the YREB. As illustrated in Figure 3a, from 2000 to 2022, the spatial distribution of energy consumption-related CO2 emissions across the YREB exhibited a distinct gradient, characterized by the pattern: Downstream reaches > Upstream reaches > Midstream reaches. Notably, the Downstream reaches—comprising provinces such as Jiangsu, Zhejiang, and the municipality of Shanghai—have consistently accounted for over 50% of the region’s total emissions. This dominance is primarily attributed to their advanced economic development, high levels of industrialization and urbanization, and the concentration of energy-intensive industries. While efforts in energy structure optimization and technological innovation have yielded some progress in recent years, the sheer scale of economic activity in the Downstream reaches has kept aggregate emissions persistently high (Shao et al., 2025). In contrast, the Upstream reaches—covering regions such as Sichuan, Chongqing, and Yunnan—witnessed a rapid surge in emissions between 2000 and 2012, coinciding with accelerated economic growth. However, since 2013, the growth rate of carbon emissions in these areas has moderated, reflecting the effectiveness of national energy conservation and emissions reduction policies (Hu et al., 2024). The Midstream reaches—comprising Hubei, Hunan, and Jiangxi—remain in a phase of economic transition. The continued reliance on traditional industries and relatively low energy efficiency have resulted in stable but persistently high carbon emission levels that have proven difficult to reduce substantially (Liu and Hao, 2022).
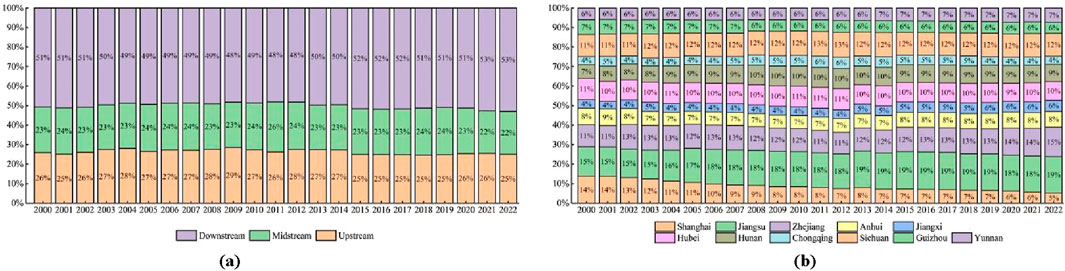
Figure 3. Total energy consumption-related carbon emissions and their contribution ratio across the upstream, midstream, and downstream regions of the Yangtze River Economic Belt, as well as among the 11 provinces. (a) Up/mid/downstream energy consumption emissions and contribution. (b) Total carbon emissions and contribution ratio from energy consumption in 11 province.
Figure 3b further illustrates that, between 2000 and 2022, Jiangsu, Shanghai, and Zhejiang collectively contributed nearly 40% of the YREB’s total energy-related carbon emissions. Among them, Jiangsu’s emissions have continued to rise, driven by a high proportion of heavy and chemical industries, a coal-dominant energy structure, and a strong reliance on thermal power generation—factors that have consistently placed the province among China’s top emitters (Sun, 2024). Conversely, Shanghai has demonstrated a gradual decline in emissions, attributable to a restructured industrial base, significant improvements in energy efficiency within key sectors, and sustained reductions in coal consumption (Shanghai Municipal People’s Government, 2022). Beyond these core contributors, Sichuan, Hubei, Hunan, and Anhui also exhibit notable emissions levels, while provinces such as Jiangxi, Yunnan, Guizhou, and Chongqing make relatively minor contributions to the regional total. Sichuan, in particular, experienced a decline in emissions between 2000 and 2010, largely due to its substantial reliance on hydropower and increased investments in clean energy development. However, the ongoing industrialization and economic expansion in less-developed southwestern provinces such as Yunnan, Guizhou, and Chongqing have resulted in a recent upward trend in carbon emissions.
4.2 Mann-Kendall trend analysis and abrupt change detection
As shown in Figure 4, the intersection of the UF and UB curves is approximately around the year 2007. The area above the critical line following this intersection marks the onset of a significant change in trend.
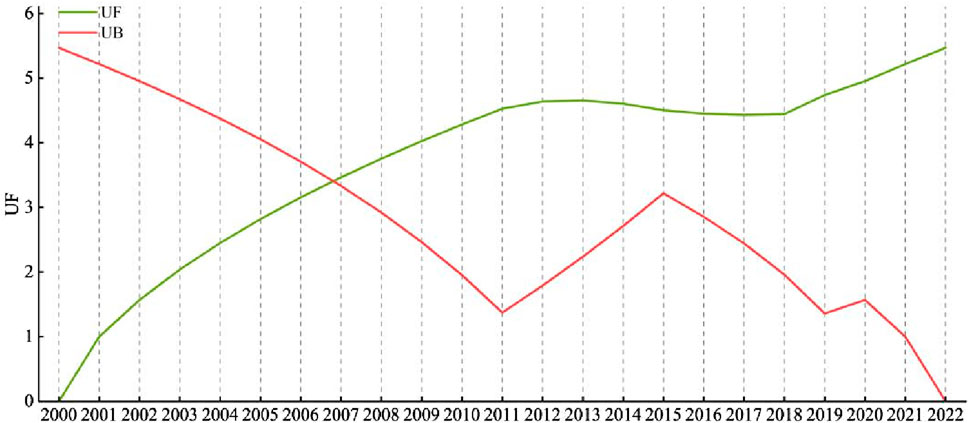
Figure 4. Mk trend analysis and abrupt change detection of carbon emissions from energy consumption in the Yangtze river economic belt.
Based on these findings and in conjunction with national policies, the total carbon emissions from energy consumption across the YREB from 2000 to 2022 can be divided into three distinct phases: rapid growth, decelerated growth, and stabilization.
The period from 2000 to 2006 represents the rapid growth phase. During this stage, total carbon emissions from energy consumption in the YREB increased by 100 metric tons, with an average annual growth rate of 9.64%, surpassing the national average of 7.86% (Liu et al., 2021). This period witnessed the fastest increase in carbon emissions from energy consumption. The rapid advancement of industrialization across the provinces along the Yangtze River led to a sharp rise in energy-related carbon emissions, characterized by a development model of “high input, high consumption, high emissions, and low efficiency” (Jiang, 2011).
The period from 2007 to 2011 marks the phase of decelerated growth. During this stage, the growth rate of total carbon emissions from energy consumption began to slow, with the average rate declining to 6.92%. This trend closely aligns with the energy conservation and emission reduction policies implemented during China’s 11th Five-Year Plan period (2006–2009). As a result, energy consumption growth moderated, and carbon emissions exhibited a more gradual upward trend.
The period from 2012 to 2022 represents the stabilization phase. During this time, the total carbon emissions from energy consumption in the YREB increased from
It is worth noting that the YREB Development Plan was officially released in 2016. However, the turning point in carbon emission trends emerged around 2011. This suggests that prior to the formal implementation of the coordinated development strategy of “one axis, two wings, three poles, and multiple nodes,” earlier national policies had already played a crucial role in influencing carbon emissions.
4.3 Regional disparities in carbon emissions and energy structure
By calculating the carbon emissions, energy structure, and carbon emissions per unit of GDP for the entire YREB as well as its Upstream, Midstream, and Downstream reaches, the results are presented in Figure 5. Overall, coal remains the dominant energy source for carbon emissions in the YREB, although the energy structure has been gradually improving. Specifically, the share of coal in total carbon emissions initially increased before declining, while the proportion of carbon emissions from oil exhibited a fluctuating upward trend. Meanwhile, the shares of carbon emissions from natural gas and electricity consumption have increased. From 2000 to 2022, the proportions of carbon emissions from coal, oil, natural gas, and electricity shifted from 77%, 19%, 0%, and 1%–69%, 26%, 1%, and 3%, respectively.
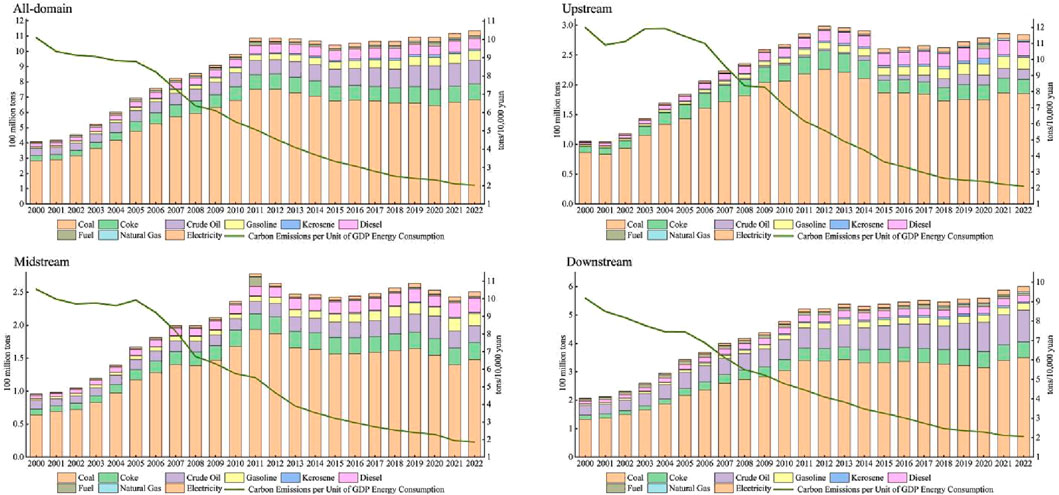
Figure 5. Carbon emissions from various energy sources and carbon emission intensity per unit of GDP in the Yangtze River Economic Belt and its upstream, midstream, and downstream reaches (2000–2022).
The Upstream, Midstream, and Downstream reaches of the YREB are at different stages in the implementation of the “dual carbon” goals, namely, carbon peaking and carbon neutrality. In terms of both carbon emissions from energy consumption and energy consumption structure, the Upstream and Midstream reaches exhibit a trend of “first rising, then declining” carbon emissions.
In the Upstream reaches, total carbon emissions from energy consumption increased from
Similarly, in the Midstream reaches, carbon emissions from energy consumption rose from
In contrast, the Downstream reaches exhibit the highest carbon emissions from energy consumption, reaching
Despite active efforts in recent years to promote industrial upgrading and transformation, historical accumulation and industrial inertia continue to sustain high emission levels. Although the growth rate of coal and coke-related emissions has gradually slowed, and the consumption of electricity and natural gas has steadily increased, the Downstream reaches have not yet reached their carbon emission peak. Nevertheless, the significant decline in the carbon emission growth rate suggests that the region has made substantial progress in adopting cleaner energy sources and advancing carbon reduction initiatives.
Increasing the proportion of low-carbon energy sources such as natural gas and primary electricity is an effective pathway for emissions reduction. Additionally, the development of clean coal technologies is crucial for China’s emissions reduction strategy. China’s energy resource endowment is characterized by abundant coal, limited oil, and scarce natural gas, with coal reserves accounting for 94% of total fossil fuel resources. In contrast, China’s reliance on imported natural gas exceeds 40% (Yuan et al., 2014). Given the current international geopolitical landscape, a substantial increase in natural gas consumption may undermine energy security and supply stability. At the same time, renewable energy sources such as wind and hydropower exhibit intermittency, randomness, and fluctuations, making them difficult to completely replace coal-fired power in the short term. Therefore, coal remains essential for ensuring energy security and grid stability. The relationship between renewable energy and traditional fossil fuels should not be viewed as a simple substitution but rather as a complementary and synergistic system (Lyu and Chai, 2022). While advancing the development of clean coal, upgrading coal production and utilization technologies to enhance coal efficiency is a crucial emissions reduction strategy.
Carbon emissions per unit of GDP (carbon intensity) serve as a key indicator of a region’s contribution to emissions reduction alongside economic development. As shown in Figure 5, the carbon intensity of the entire YREB decreased from 1.01 t per 10,000 yuan of GDP in 2000 to 0.2 t per 10,000 yuan in 2022, reflecting an 80.2% reduction. The Upstream reaches exhibited the lowest and fastest decline in carbon intensity, decreasing from 1.00 t per 10,000 yuan to just 0.12 t per 10,000 yuan. The Midstream reaches experienced a reduction from 1.05 t per 10,000 yuan to 0.19 t per 10,000 yuan, while the Downstream reaches saw a decrease from 0.91 t per 10,000 yuan to 0.21 t per 10,000 yuan. The most significant reductions occurred in western provinces within the Upstream reaches, such as Sichuan, Chongqing, and Guizhou. These provinces possess abundant energy resources and have benefited from national industrial policies and ecological protection initiatives, shifting away from economic development at the expense of environmental degradation. Furthermore, since 2013, national policies promoting ecological civilization have accelerated the adoption of clean energy sources such as wind and natural gas in Guizhou and Chongqing as part of pilot projects for ecological development (Liu et al., 2017; Lu et al., 2018). Overall, the YREB has experienced rapid economic growth alongside a continuous decline in carbon intensity, significantly reducing its dependence on energy consumption.
4.4 Analysis of factors influencing carbon emissions
Based on the Kaya identity, the factors influencing carbon emissions from energy consumption are decomposed into population, per capita GDP, energy intensity, energy structure, and the carbon emission coefficient of energy consumption. The trends of population, per capita GDP, energy intensity, and the carbon emission coefficient of energy consumption are illustrated in Figure 6.
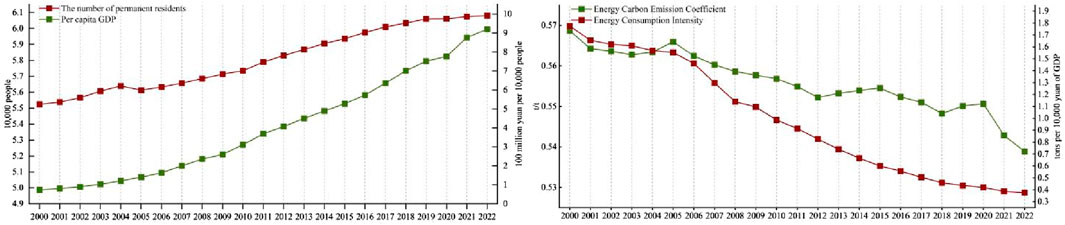
Figure 6. Trends of factors influencing carbon emissions from energy consumption.
As shown in Figure 6, between 2000 and 2022, both the total population and per capita GDP of the YREB exhibited a steady upward trend, indicating rapid economic growth alongside population expansion. A long-term cointegration relationship exists between total carbon emissions from fossil energy consumption and GDP (Zhao et al., 2021). Studies suggest that absolute CO2 emission reductions can only be achieved when the GDP growth rate is Downstream than the decline rate of carbon emissions per unit of GDP (He and Liu, 2004). From 2000 to 2022, the annual average decline rate of carbon intensity (carbon emissions per unit of GDP) in the YREB was 3.5%, which remained Downstream than the annual GDP growth rate, indicating that absolute carbon emission reductions have not yet been realized.
Energy intensity, an indicator of energy utilization efficiency, decreases as energy efficiency improves. The carbon emission coefficient of energy consumption is defined as the ratio of carbon emissions to energy consumption (measured in standard coal equivalent). For a given energy type, this coefficient remains constant over time. However, when multiple energy sources are considered, the total carbon emission coefficient is calculated as the ratio of total carbon emissions to total energy consumption (in standard coal equivalent). As illustrated in Figure 6, energy intensity across the YREB has shown a consistent decline, reflecting improvements in energy efficiency. Meanwhile, the overall carbon emission coefficient of energy consumption has exhibited a fluctuating downward trend, suggesting effective control of energy demand driven by economic development.
To further analyze the contributions of different factors to carbon emissions, the Logarithmic Mean Divisia Index (LMDI) decomposition method was applied to evaluate the annual effects of influencing factors on energy-related carbon emissions in the YREB and its upstream, midstream, and downstream regions from 2000 to 2022. The results are presented in Figure 7, where energy intensity specifically refers to energy consumption intensity.
(1) Population Scale Effect. Between 2000 and 2022, population factors have played a generally positive role in the variation of carbon emissions within the YREB. However, the impact’s intensity and trends differ significantly across regions. On a regional scale, the cumulative contribution of population factors has been positive in most years, especially peaking in 2011 and 2012, indicating that population growth had the most pronounced effect on carbon emissions during this period. The Midstream and Downstream reaches of the river show a more stable positive driving trend, while the Upstream reaches exhibit more volatility, with some years even showing negative contributions, such as in 2001 (−0.51), suggesting that in certain periods, population changes in these areas had a mitigating effect on carbon emissions. From a regional perspective, the Downstream reaches experienced the most concentrated carbon emission pressures due to population growth, particularly in 2011 and 2013. This reflects the typical association between population growth and expanded consumption, as well as increased energy demand, especially under the rapid urbanization context, where the growing demand for transportation, construction, and electricity significantly boosted energy consumption (Zhao and Lu, 2019). This analytical result is consistent with the findings of Zhou et al. (2025), who examined the carbon emission drivers and peak forecasts in the Yangtze River Economic Belt. In the Midstream reaches, the population contribution remained relatively low but steadily increased, reflecting the synchronicity between industrial development and population agglomeration. In the Upstream reaches, although there has been certain population growth in recent years, the region’s limited base and sDownstream urbanization process have resulted in a weaker driving effect on carbon emissions. At the same time, it is important to note that in recent years, increased low-carbon awareness and a slowdown in population growth have contributed to a decelerating effect, especially in the Downstream reaches, where the promotion of green lifestyles and energy-saving technologies has led to a deceleration in per capita carbon emissions growth.
(2) Economic Development Effect. Economic development, represented by per capita GDP, is one of the core driving factors of carbon emission growth in the YREB. This factor has shown a strong positive effect almost every year since 2000, with significant peaks in 2010 and 2011, reflecting the direct driving force of rapid economic growth on energy demand and carbon emissions. This trend is evident across all three regions, with the Upstream reaches showing the most substantial marginal driving effect, with per capita GDP contributing 36.40 and 40.53 in 2010 and 2011, respectively. In the Midstream reaches, the concentration of energy-intensive industries due to industrial transfer contributed strongly to carbon emission growth, with similar trends in 2010 and 2011. In the Downstream reaches, despite the larger economic scale and more developed infrastructure, the promotion of per capita GDP on carbon emissions remained steady but weaker compared to the Midstream reaches. Overall, the increase in carbon emissions in the YREB is closely related to regional economic expansion, the rise in the proportion of heavy industries, and the increase in transportation and logistics. According to Jiang et al. (2017), in their analysis of provincial-level carbon emissions in China, per capita GDP was found to be the strongest explanatory factor for carbon emission growth, particularly during the early stages of economic development. Additionally, this driving effect tends to slow down in the later stages of industrialization, suggesting the potential for a transition from “high-carbon growth” to “low-carbon growth.” From the perspective of development economics, the increase in carbon emissions driven by economic growth represents the early stage of the “Kuznets Curve,” where pollution increases with rising income before decreasing.
(3) Energy Intensity Effect. Energy intensity factors have shown a consistent and strong negative suppressive effect in the LMDI decomposition. Data across the region indicate that this factor has significantly suppressed carbon emission growth almost every year since 2005, especially in 2008, 2010, and 2013, when its contribution was particularly notable. This trend is particularly pronounced in the Midstream reaches, reflecting the region’s gradual achievement of some energy efficiency improvements, aided by national energy-saving and emission reduction policies and the industrial structure adjustment and technological transformation under the “Central China Rising” strategy (Wang et al., 2022). However, after 2021, this effect weakened, indicating that the region’s energy-saving potential has yet to be fully released. The Downstream reaches showed a more stable and progressively optimizing energy intensity suppression effect, indicating that this region has entered the “deep-water zone” in terms of green and low-carbon development. In recent years, significant progress has been made in energy-saving technologies, industrial digitization, and green buildings (Guo et al., 2024). This also reflects the generally superior energy utilization efficiency in Eastern cities compared to the central and western regions. In contrast, the Upstream reaches, due to relatively weak technological foundations and low energy efficiency, exhibited a polarizing effect in the energy intensity suppression, with significant reductions in 2008 and 2010 of −27.56 and −33.79 units, respectively, which were directly related to the strengthening of energy-saving and emission reduction assessment mechanisms during the “11th Five-Year Plan” period. However, in years like 2002 and 2003, positive contributions were observed, reflecting the region’s continued reliance on outdated industrial structures and technological path dependencies (Wang and Yang, 2025).
(4) Energy Structure Effect. On a regional scale, the energy structure demonstrated a negative effect on carbon emissions from 2000 to 2022, with the emission reduction effect gradually strengthening, though with significant differences in intensity and pace across regions and periods. The Downstream reaches showed the most persistent energy structure effect, with sustained negative values from 2012 to 2018, peaking in 2014 (−7.51) and 2015 (−4.59), due to its strong capacity to integrate clean energy and a diversified energy consumption structure (such as natural gas and electricity substituting coal). In the Midstream reaches, the energy structure still exhibited some volatility in certain years, indicating that although the clean energy base has gradually improved, the dependency on traditional high-carbon energy sources has not been completely eliminated, especially in areas like Jiangxi and Hunan, where hydropower and new energy development lag behind. Li et al. (2022) noted that the nonlinear process of energy structure optimization contributes limitedly to short-term carbon reduction. In the Upstream reaches, the energy structure effect on carbon emission reduction was the weakest, with contributions typically below −1 in most years (e.g., −0.18 in 2022), reflecting the region’s relatively backward resource endowment and energy infrastructure, along with limited clean energy promotion due to infrastructure and economic constraints, resulting in slow progress in energy system transformation and limited effects of structural adjustments (Lu and Chen, 2024).
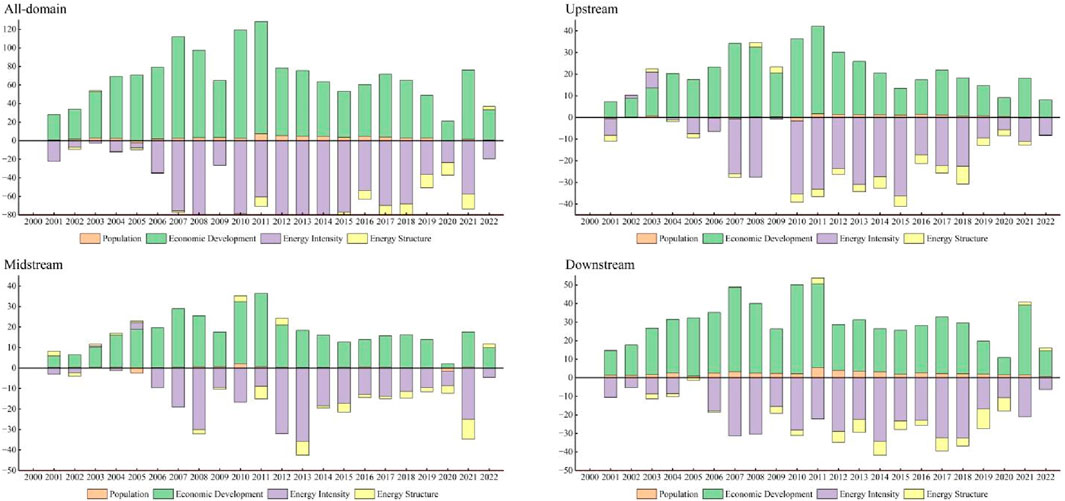
Figure 7. Decomposition of factors influencing carbon emissions from energy consumption in the Yangtze River Economic Belt and its upstream, midstream, and downstream reaches (2000–2022).
Existing research suggests that regional differences in carbon emissions are significantly associated with variations in industrial structure (Dong et al., 2020). Therefore, this study examines energy consumption patterns across the primary, secondary, and tertiary industries in the YREB and its subregions, with the results presented in Figure 8.
• The analysis of the overall characteristics of industrial structural evolution and carbon emission intensity disparities between 2000 and 2022 reveals that energy consumption in the three major industries of the YREB increased significantly. Energy consumption of the secondary industry rose from 25.4 million tons in 2000 to 41.7 million tons in 2022, while that of the tertiary industry surged from 53.4 million tons to 361.9 million tons. Throughout this period, the secondary industry maintained a dominant share, consistently exceeding 70%, thus becoming a key source of carbon emissions. From the perspective of carbon intensity, the secondary industry exhibits a higher carbon emission coefficient and Downstream energy efficiency, resulting in significantly higher carbon emissions per unit of energy consumption compared to the primary and tertiary industries (Yang et al., 2024). In contrast, although the energy consumption of the tertiary industry has grown substantially (from 53.4 million tons in 2000 to 361.9 million tons in 2022), its marginal effect on carbon emissions is relatively weak, due to its reliance on cleaner energy sources such as electricity and natural gas, along with higher energy utilization efficiency. This “carbon intensity differentiation” underscores the varying impact of energy expansion across industries on carbon emissions, revealing a structural driving effect. Specifically, the degree of carbon emission growth triggered by energy expansion differs significantly across industries, reflecting a structural shift where energy growth of equivalent magnitude leads to varied carbon emission increases in different sectors (Chuai et al., 2012).
• The driving mechanism of carbon emission disparities due to the evolution of industrial structure within regions can be further explored by examining changes in energy consumption contributions across regions. In downstream areas, although energy consumption of the secondary industry increased from 18.6 million tons in 2000 to 57.1 million tons in 2022, its share in total energy consumption declined, with the tertiary industry increasing its share from 2.8 million tons to 15.4 million tons. This internal structural adjustment led to a continuous decrease in carbon emissions per unit of GDP. In contrast, upstream and midstream regions experienced a faster expansion in secondary industry energy consumption (from 10.0 million tons to 35.1 million tons in the upstream and from 10.2 million tons to 30.3 million tons in the midstream), although the share of the tertiary industry also grew, but at a sDownstream pace. This indicates that the upstream and midstream regions have absorbed some of the energy-intensive manufacturing industries, leading to stronger carbon emission-driving effects from energy consumption structure, with a smaller decline in carbon intensity or even occasional rebounds (Tao et al., 2024). From the perspective of LMDI decomposition, the expansion of the secondary industry in the upstream and midstream regions has contributed more to carbon emissions than in the downstream areas, demonstrating that the spatial reconfiguration of industrial structure plays a significant role in the regional carbon emission differences. This study finds that the industrial structure effect exhibits a significant gradient across the upstream, midstream, and downstream regions. This aligns with the findings of Guo et al., 2024, who report that industrial upgrading has a stronger suppressive effect on carbon emissions in the downstream region of the Yangtze River Economic Belt (YREB). However, our study further quantifies this regional gradient and emphasizes that policy design should account for differentiated, stage-specific interventions.
• The spatial effects of carbon emissions during industrial transfer in the YREB further amplify regional carbon emission disparities. Between 2000 and 2022, energy consumption in the secondary industry increased by 25.1 million tons in the upstream and 20.1 million tons in the midstream regions, far surpassing the increase of approximately 18.0 million tons in the downstream. This shift in energy consumption is closely related to national policies promoting industrial transfer across regions. However, unlike the “scale growth - carbon intensity reduction” trend observed in the tertiary industry, the expansion of the secondary industry is associated with “scale expansion - carbon intensity maintenance” or even “carbon intensity increase” (Wu et al., 2025). Particularly in provinces with a strong resource-based or traditional industrial foundation, such as Sichuan, Guizhou, Chongqing, and Hubei, the clustering of energy-intensive industries has led to a higher carbon emission elasticity coefficient, reflecting a “carbon emission uplift” in upstream regions. This indicates that, during industrial restructuring, the carbon emission characteristics of different industries determine the spatial coupling effects of carbon emissions, which, in turn, influence the carbon peaking path of the entire YREB.
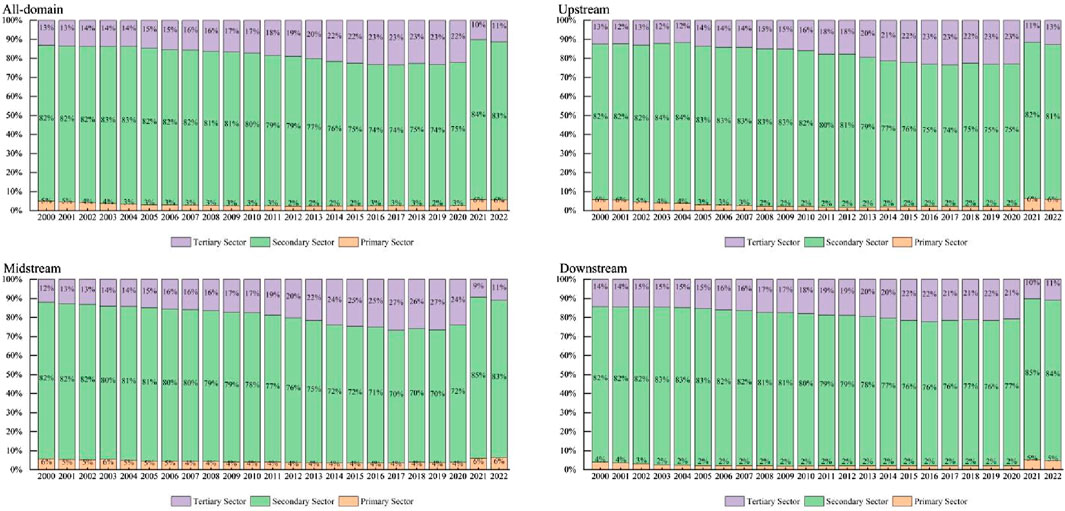
Figure 8. Energy consumption of the primary, secondary, and tertiary sectors in the Yangtze River Economic Belt and its upstream, midstream, and downstream reaches from 2000 to 2022.
5 Discussion
This study provides a comprehensive analysis of energy consumption carbon emissions, their variation characteristics, and the contributing factors influencing the YREB, a region known for its high energy consumption and economic development. The findings highlight the following key insights:
Firstly, the total carbon emissions from energy consumption in the YREB have significantly increased, with notable disparities across regions. Spatially, the hotspots for energy consumption carbon emissions show a gradual eastward shift, with economic factors having the most prominent influence. This deduction is similar to the results of the structural decomposition analysis by Wang et al. (2020). Specifically, between 2000 and 2021, the carbon emission intensity from energy consumption across provinces in the YREB ranged from 23.13 to 76.8 Gg per billion yuan, significantly higher than other provinces in central China. For example, the carbon emission intensity in Jiangxi Province between 2000 and 2019 ranged from 22.3 to 9.5 Gg per billion yuan (Chen et al., 2022). This is primarily due to the YREB’s status as a critical economic support region, characterized by high urbanization, population density, industrial concentration, and significant demand for energy in both production and daily life, resulting in a continuous increase in total and per capita carbon emissions (Zhou, 2023). However, the energy consumption carbon emissions per unit of GDP in this region have shown a downward trend, indicating a decreasing dependency on energy for economic development. This shift can be attributed to the optimization and adjustment of the industrial structure in recent years, with the YREB gradually entering a post-industrial phase led by the tertiary and quaternary industries. The industrial structure of the YREB shifted from 15.66:46.54:37.80 in 2000 to 5.1:38.9:56 in 2020, where the proportion of the primary and secondary industries decreased, and the proportion of the tertiary industry increased. This deduction was also confirmed in the study of energy and economic decoupling by Li et al. (2021).
Secondly, the spatial distribution of energy consumption carbon emissions across provinces in the YREB exhibits significant heterogeneity. Jiangsu Province saw the largest increase in both total energy consumption carbon emissions and per capita energy consumption carbon emission intensity. The total carbon emissions from energy consumption in Jiangsu increased from 86.12 million tons in 2000 to 358.24 million tons in 2022, with an annual growth rate exceeding 6.6%. During the same period, per capita carbon emissions rose from 1.175 tons per person to 4.207 tons per person, an increase of over 250%. This finding aligns with previous studies, which indicated that Jiangsu’s carbon emissions from energy consumption have continued to rise since 2000 (Deng et al., 2024). This rapid increase can be attributed to Jiangsu’s location in the eastern coastal region of China and the significant influence of the “West-to-East Gas Transmission” project, which led to a substantial increase in natural gas consumption, thereby accelerating energy consumption carbon emissions (Chang et al., 2017). In contrast, areas with Downstream energy consumption carbon emissions per unit of GDP are primarily located in economically less developed regions of southwest China. This distribution pattern mirrors previous research, which found that the upstream areas of the YREB exhibited higher energy consumption carbon emission intensity per unit of GDP than downstream areas from 2003 to 2020. This phenomenon is mainly due to the challenging natural conditions, weak economic foundation, slow industrial upgrades, and a predominant reliance on the secondary industry in the western regions, leading to Downstream energy efficiency and higher energy dependence (Zhu et al., 2025).
Lastly, the spatiotemporal characteristics of energy consumption carbon emissions in the YREB are influenced by multiple factors, with economic development being the most significant driver of carbon emissions growth. This is particularly evident in the peak years of 2010–2011, where rapid economic growth directly led to a surge in energy demand, followed by population scale effects. In contrast, energy intensity and energy structure have emerged as key forces in mitigating carbon emissions. Particularly after 2005, energy intensity continued to decline, reflecting the substantial effects of energy-saving technological advances and policy guidance. The central and downstream regions of the YREB stand out in this regard, where energy consumption per unit of GDP has consistently decreased, effectively countering the carbon emissions growth driven by economic expansion. Simultaneously, the optimization of the energy structure has also played a role, with an increase in the proportion of clean energy contributing to a phase-wise reduction in carbon emissions (Khaleel et al., 2024). However, regional disparities remain, as downstream areas benefit from stronger clean energy integration, leading to more significant carbon reduction effects. In contrast, upstream areas are constrained by resource endowments and infrastructure conditions, and the energy structure adjustment remains in its early stages. These findings align with previous studies, which emphasize that industrial upgrading can significantly suppress energy consumption carbon emissions in the YREB (Guo et al., 2024). Population growth and economic development have a positive effect on carbon emissions, however, this conclusion differs somewhat from findings at the national scale. For instance, Zhu and Peng (2012), using national data from 1978 to 2008, found that consumption levels and population structure had a significantly greater impact on carbon emissions than the population size itself. This divergence may be attributed to differences in variable construction priorities, as well as scale and spatial heterogeneity.
6 Conclusion
This study presents a statistical analysis of the carbon emissions from energy consumption and their change characteristics in the YREB and its upstream, midstream, and downstream regions from 2000 to 2022. It delves into the energy structure, regional disparities, and influencing factors of the area, leading to the following key conclusions:
(1) As a key region for China’s economic development, the YREB saw its total carbon emissions from energy consumption significantly increase from 2000 to 2022, with an average annual growth rate of 4.4%. However, the growth rate has shown a distinct slowdown. Meanwhile, carbon emissions per unit of GDP showed a fluctuating downward trend.
(2) The energy structure of the YREB remains dominated by coal, but its share has decreased from 73.72% to 59.48%, indicating an optimization trend in the energy mix. The upstream region is gradually approaching the “carbon peak” target, while the midstream region has already achieved carbon emission “peaking.” Although the downstream region has not yet reached the “peak,” its growth rate has notably slowed.
(3) Overall, economic development and population growth positively impact carbon emissions, while improvements in energy intensity and energy structure act to mitigate emissions. Notably, the impact of population growth on carbon emissions has been gradually weakening over the years.
Currently, the provinces along the YREB are adhering to principles of inter-provincial consultation, ecological governance, regional cooperation, and shared development. These efforts aim to enhance regional connectivity, policy unity, regulatory consistency, and coordination in implementation, steadily advancing the construction of ecological and economic communities, consolidating prior development achievements, and laying a foundation for long-term goals. Based on the research conclusions, the following recommendations are made:
The upstream region should focus on the construction of clean energy infrastructure and the reduction of coal-fired power emissions. On one hand, leveraging national policies supporting the western development program, efforts should be made to expedite the approval and grid connection of small and medium-sized hydropower, wind, and solar projects. On the other hand, in the context of the coal-dominated traditional industries, high-quality construction of “coal power + CCUS/CCS” demonstration projects should be promoted, prioritizing technical upgrades over simple and inefficient capacity expansion in collaboration with provincial energy regulatory departments. Additionally, energy efficiency assessments should be strictly enforced in high-energy-consuming industries like steel and cement to reduce per-unit product energy consumption, in line with local economic transformation needs.
The midstream region needs to accelerate the upgrade of high-energy-consuming industrial structures and strengthen the technical and talent support under the “Central China Rise” strategy. The provinces in the central region should focus on supporting traditional industrial parks, such as those for automotive parts and equipment manufacturing, to carry out energy-saving and emission-reduction transformations, thereby Downstreaming energy consumption levels in high-energy-consuming enterprises. Furthermore, by establishing a “Low-carbon Advanced Manufacturing Technology Joint Laboratory” in collaboration with universities in the central region, talents in new energy and energy-saving technologies should be attracted and cultivated, facilitating the rapid transformation of research outcomes into local enterprises.
The downstream region should leverage the “Yangtze River Delta Integration” and “Carbon Peak Action Plan” to deepen industrial low-carbon transitions and capitalize on carbon market advantages. First, carbon intensity assessments should be incorporated into the inter-provincial benchmarking system, with key industries such as chemicals, textiles, and electronics subject to a “carbon emission quota + dual control of energy consumption” policy. Second, the downstream provinces and municipalities should further refine the carbon trading market, support carbon financial innovations, and promote the “green credit + carbon collateral” model to provide preferential loan rates for enterprises exceeding carbon emission standards. Moreover, pilot programs for “residential carbon footprint public disclosure and energy-saving subsidies” should be launched, utilizing mechanisms such as “carbon points” incentives and subsidies for green transportation.
Of course, this study does have certain limitations. First, the LMDI decomposition model considers only five key factors but does not further distinguish energy consumption differences within sub-industries, such as the significant differences in energy use and carbon emission characteristics between manufacturing and the building materials industry, both of which belong to the secondary sector. Second, the scope of the study is limited to carbon emissions from energy consumption, excluding non-energy-related carbon emissions from industrial processes, agriculture, and land-use changes. This underestimates the total carbon emissions and the diversity of their driving mechanisms. Finally, the study period ends in 2022 and does not capture the latest developments in the “dual carbon” policies in the later stages of the 14th Five-Year Plan or the early part of the 15th Five-Year Plan, as well as the short-term dynamics of carbon emissions. Future research could incorporate smaller-scale geographical units, improve carbon emission accounting, include non-energy emission sources, and use policy evaluation models to explore the spatial-temporal evolution of carbon emissions and policy effects.
Data availability statement
The raw data supporting the conclusions of this article will be made available by the authors, without undue reservation.
Author contributions
YZ: Conceptualization, Data curation, Formal Analysis, Methodology, Resources, Validation, Writing – original draft. XL: Data curation, Investigation, Methodology, Validation, Writing – original draft, Writing – review and editing. CF: Formal Analysis, Investigation, Visualization, Writing – review and editing. TZ: Formal Analysis, Visualization, Writing – review and editing. XW: Formal Analysis, Project administration, Supervision, Writing – review and editing.
Funding
The author(s) declare that no financial support was received for the research and/or publication of this article.
Conflict of interest
The authors declare that the research was conducted in the absence of any commercial or financial relationships that could be construed as a potential conflict of interest.
Correction note
A correction has been made to this article. Details can be found at: 10.3389/fenvs.2025.1674735.
Generative AI statement
The author(s) declare that no Generative AI was used in the creation of this manuscript.
Publisher’s note
All claims expressed in this article are solely those of the authors and do not necessarily represent those of their affiliated organizations, or those of the publisher, the editors and the reviewers. Any product that may be evaluated in this article, or claim that may be made by its manufacturer, is not guaranteed or endorsed by the publisher.
Supplementary material
The Supplementary Material for this article can be found online at: https://www.frontiersin.org/articles/10.3389/fenvs.2025.1596713/full#supplementary-material
References
Amediek, A., Ehret, G., Fix, A., Wirth, M., Büdenbender, C., Quatrevalet, M., et al. (2017). CHARM-F—a new airborne integrated-path differential-absorption lidar for carbon dioxide and methane observations: measurement performance and quantification of strong point source emissions. Appl. Opt. 56 (18), 5182–5197. doi:10.1364/AO.56.005182
Ang, B. W. (2015). LMDI decomposition approach: a guide for implementation. Energy Policy 86, 233–238. doi:10.1016/j.enpol.2015.07.007
Chang, Z. G., Xue, T. T., Chen, Y. J., and Chao, X. H. (2017). Prediction model of energy consumption in Jiangsu Province based on constraint condition of carbon emission. IOP Conf. Ser. Earth Environ. Sci. 93, 012038. doi:10.1088/1755-1315/93/1/012038
Cheng, Y., Zhang, Y., and Wang, J. (2023). Spatial-temporal evolution of provincial carbon emission performance and driving force of technological innovation in China. Sci. Geogr. Sin. 43 (2), 313–323. doi:10.13249/j.cnki.sgs.2023.02.013
Chen, T., Li, X. Y., and Chen, B. (2023). Decomposition of influencing factors and peak prediction of carbon emissions in China. J. Saf. Environ. 24 (01) doi:10.13637/j.issn.1009-6094.2022.1448
Chen, Y., Wang, T., Zhan, M., and Qin, J. (2022). Study on carbon emission intensity and its influence factor for the energy consumption in Jiangxi Province during 2000–2019. Meteorology Disaster Reduct. Res. 45 (1), 38–45. doi:10.13202/j.cnki.cer.2024.11.002
Chuai, X., Huang, X., Wang, W., Wen, J., Chen, Q., and Peng, J. (2012). Spatial econometric analysis of carbon emissions from energy consumption in China. J. Geogr. Sci. 22, 630–642. doi:10.1007/s11442-012-0952-z
Deng, J., Liu, C., and Mao, C. (2024). Carbon emissions drivers and reduction strategies in Jiangsu Province. Sustainability 16 (13), 5276. doi:10.3390/su16135276
Dong, K., Hochman, G., Zhang, Y., Sun, R., Li, H., Liao, H., et al. (2018). CO2 emissions, economic and population growth, and renewable energy: Empirical evidence across regions. Energy Econ. 75, 180–192. doi:10.1016/j.eneco.2018.08.017
Dong, B., Ma, X., Zhang, Z., Zhang, H., Chen, R., Song, Y., et al. (2020). Carbon emissions, the industrial structure and economic growth: evidence from heterogeneous industries in China. Environ. Pollut. 262, 114322. doi:10.1016/j.envpol.2020.114322
Fang, D., Chen, Z., and Peng, H. A. O. (2019). The influence mechanism of carbon emissions of urban residents in Beijing—based on LMDI decomposition method. J. Beijing Inst. Technol., 30–38. doi:10.15918/j.jbitss1009-3370.2019.6537
Gian, P. G., Luca, D. L., and Francesca, B. (2020). Impact of port emissions on EU-regulated and non-regulated air quality indicators: the case of Civitavecchia (Italy). Sci. Total Environ. 719, 134984. doi:10.1016/j.scitotenv.2019.134984
Guo, B., Feng, W., and Lin, J. (2024). The effect of industrial upgrading on energy consumption. Energy Strategy Rev. 54, 101451. doi:10.1016/j.esr.2024.101451
Hamed, K. H., and Rao, A. R. (1998). A modified Mann–Kendall trend test for autocorrelated data. J. Hydrology 204 (1-4), 182–196. doi:10.1016/S0022-1694(97)00125-X
He, J. K., and Liu, B. (2004). Analysis of carbon emission intensity as the main index for greenhouse gas emission mitigation commitments. J. Tsinghua Univ. Sci. Technol. 44 (6), 740–743. doi:10.16511/j.cnki.qhdxxb.2004.06.006
He, Y., Zhang, X., and Zheng, H. (2025). Impact of the Yangtze River economic belt on high-quality economic development in China: evidence from a spatial difference-in-differences model. Econ. Model. 143, 106962. doi:10.1016/j.econmod.2024.106962
Hu, H., Wang, L., and Yang, M. (2024). Multi-scale analysis of spatial and temporal evolution of carbon emissions in Yangtze River economic belt and study of decoupling effects. Sustainability 16 (10), 4222. doi:10.3390/su16104222
Hutchins, M. G., Colby, J. D., Marland, G., and Marland, E. (2017). A comparison of five high-resolution spatially-explicit, fossil-fuel, carbon dioxide emission inventories for the United States. Mitig. Adapt. Strategies Glob. Change 22, 947–972. doi:10.1007/s11027-016-9709-9
Hu, Y., Pan, J., and Wang, Y. (2015). Spatial-temporal evolution of provincial carbon emission in China from 1997 to 2012 based on ESDA and GWR model. Acta Sci. Circumstantiae 35 (6), 1896–1906. doi:10.13671/j.hjkxxb.2014.1025
IPCC. IPCC guidelines for national greenhouse gas inventories. (2006). Available online at: http://www.ipcc.ch/report/2006-ipcc-guidelines-for-national-greenhouse-gas-inventories/ (Accessed March 27, 2023)
Jiang, J. H. (2011). The characteristics of China’s carbon emissions and strategies for developing a low-carbon economy. Econ. Res. Reference (5). doi:10.16110/j.cnki.issn2095-3151.2011.05.003
Jiang, J., Ye, B., Xie, D., and Tang, J. (2017). Provincial-level carbon emission drivers and emission reduction strategies in China: combining multi-layer LMDI decomposition with hierarchical clustering. J. Clean. Prod. 169, 178–190. doi:10.1016/j.jclepro.2017.03.189
Kaya, Y. (1983). Transportation and energy in Japan. Energy 8 (1), 15–27. doi:10.1016/0360-5442(83)90005-1
Khaleel, M., Yusupov, Z., Alderoubi, N., Abdul_jabbar, R. L., Elmnifi, M., Nassar, Y., et al. (2024). Evolution of emissions: the role of clean energy in sustainable development. Challenges Sustain. 12 (2), 122–135. doi:10.56578/cis120203
Li, C., Hu, H., Deng, L., Liu, Y., and Wang, Z. (2021). Structural decoupling the sectoral growth from complete energy consumption in China. Energy Strategy Rev. 34, 100634. doi:10.1016/j.esr.2021.100634
Li, C., Tang, Y., Cui, L., and Li, P. (2015). A quantitative approach to analyze carbon emissions of CNC-based machining systems. J. Intelligent Manuf. 26, 911–922. doi:10.1007/s10845-013-0812-4
Li, Q., and Zhang, P. (2024). Temporal–spatial characteristics of carbon emissions and low-carbon efficiency in Sichuan Province, China. Sustainability 16 (18), 7985. doi:10.3390/su16187985
Li, S., Yao, L., Zhang, Y., Zhao, Y., and Sun, L. (2024). China’s provincial carbon emission driving factors analysis and scenario forecasting. Environ. Sustain. Indic. 22, 100390. doi:10.1016/j.indic.2024.100390
Liu, H., Shao, M., and Ji, Y. (2021). Spatial pattern and dynamic evolution of carbon emissions in China: an empirical study based on county-level carbon emission data. Sci. Geogr. Sin. 41 (11), 1917–1924. doi:10.13249/j.cnki.sgs.2021.11.005
Liu, Q., and Hao, J. (2022). Regional differences and influencing factors of carbon emission efficiency in the Yangtze River Economic Belt. Sustainability 14 (8), 4814. doi:10.3390/su14084814
Liu, Q., Li, Q., and Zheng, X. (2017). Prediction of carbon dioxide emissions peak in Chongqing based on fossil energy consumption. Acta Sci. Circumstantiae 37 (4), 1582–1593. doi:10.13671/j.hjkxxb.2016.0121
Li, W., Ji, Z., and Dong, F. (2022). Spatio-temporal evolution relationships between provincial CO2 emissions and driving factors using geographically and temporally weighted regression model. Sustain. Cities Soc. 81, 103836. doi:10.1016/j.scs.2022.103836
Lin, Y., Ma, L., Li, Z., and Ni, W. (2023). The carbon reduction potential by improving technical efficiency from energy sources to final services in China: An extended Kaya identity analysis. Energy 263, 125963. doi:10.1016/j.energy.2022.125963
Lu, Y., and Chen, S. (2024). Exploring the realization pathway of carbon peak and carbon neutrality in the provinces around the Yangtze river of China. J. Clean. Prod. 466, 142904. doi:10.1016/j.jclepro.2024.142904
Lu, Y., Li, X., and Yang, Z. (2018). Status and peak prediction of energy carbon emissions in Guizhou Province. Environ. Sci. Technol. 41 (11), 173–180. doi:10.19672/j.cnki.1003-6504.2018.11.028
Lyu, Q., and Chai, Z. (2022). Highly efficient and clean utilization of fossil energy under carbon peak and neutrality targets. Bull. Chin. Acad. Sci. Chin. Version 37 (4), 13. doi:10.16418/j.issn.1000-3045.20220328001
Miao, L., and Sun, Y. L. (2020). Quantitative analysis of regional economic balance and sustainable development in Yangtze River Delta and Pearl River Delta. J. Coast. Res. SI115, 570–574. doi:10.2112/JCR-SI115-153.1
Minx, J. C., Lamb, W. F., Andrew, R. M., Canadell, J. G., Crippa, M., Döbbeling, N., et al. (2021). A comprehensive and synthetic dataset for global, regional, and national greenhouse gas emissions by sector 1970–2018 with an extension to 2019. Earth Syst. Sci. Data 13 (11), 5213–5252. doi:10.5194/essd-13-5213-2021
Nassar, R., Napier-Linton, L., Gurney, K. R., Andres, R. J., Oda, T., Vogel, F. R., et al. (2013). Improving the temporal and spatial distribution of CO2 emissions from global fossil fuel emission datasets. J. Geophys. Res. Atmos. 118, 917–933. doi:10.1029/2012JD018196
Ogundele, L. T., Adewole, O. O., Alobid, M., Szűcs, I., and Kassouri, Y. (2022). Sources and sectoral trend analysis of CO2 emissions data in Nigeria using a modified Mann-Kendall and change point detection approaches. Energies 15 (3), 766. doi:10.3390/en15030766
Pan, X., and Guo, S. (2024). Decomposition analysis of regional differences in China’s carbon emissions based on socio-economic factors. Energy 303, 131932. doi:10.1016/j.energy.2024.131932
Qian, Y., Zheng, H., Meng, J., Shan, Y., Zhou, Y., and Guan, D. (2022). Large inter-city inequality in consumption-based CO2 emissions for China’s pearl river basin cities. Resour. Conservation Recycl. 176, 105923. doi:10.1016/j.resconrec.2021.105923
Shanghai Municipal People’s Government. Shanghai Carbon Peaking Implementation Plan [Document no. 7 [2022]] (2022). Available online at: https://www.ndrc.gov.cn/fggz/hjyzy/tdftzh/202208/t20220808_1332758_ext.html (Accessed August 8, 2022)
Shao, Z., Li, X., Chen, J., Geng, Y., Zhai, X., Zhang, K., et al. (2025). Spatiotemporal evolution and influencing factors of carbon footprint in Yangtze River economic Belt. Land 14 (3), 641. doi:10.3390/land14030641
Shi, F. (2021). Influencing factors of carbon emission intensity in China’s manufacturing industry (Master’s thesis). Yunnan University of Finance and Economics. doi:10.27455/d.cnki.gycmc.2021.000193
Shuai, C., Shen, L., Jiao, L., Wu, Y., and Tan, Y. (2017). Identifying key impact factors on carbon emission: evidences from panel and time-series data of 125 countries from 1990 to 2011. Appl. Energy 187, 310–325. doi:10.1016/j.apenergy.2016.11.029
Sun, J. (2024). Green economy development and industrial structure upgrading in the Yangtze River Delta under China’s “Dual Carbon” Ggal. J. Appl. Econ. Policy Stud. 7, 60–65. doi:10.54254/2977-5701/7/2024063
Sun, W., and Huang, C. (2022). Predictions of carbon emission intensity based on factor analysis and an improved extreme learning machine from the perspective of carbon emission efficiency. J. Clean. Prod. 338, 130414. doi:10.1016/j.jclepro.2022.130414
Su, S., Fang, X., Zhao, J., and Hu, J. (2017). Spatiotemporal characteristics of consumption-based CO2 emissions from China’s power sector. Resour. Conservation Recycl. 121, 156–163. doi:10.1016/j.resconrec.2016.06.004
Tang, D., Zhang, Y., and Bethel, B. J. (2019). An analysis of disparities and driving factors of carbon emissions in the Yangtze River Economic Belt. Sustainability 11 (8), 2362. doi:10.3390/su11082362
Tao, M., Poletti, S., Wen, L., and Sheng, M. S. (2024). Modelling the role of industrial structure adjustment on China’s energy efficiency: insights from technology innovation. J. Clean. Prod. 441, 140861. doi:10.1016/j.jclepro.2024.140861
Wang, J. M., Jeong, C. H., Zimmerman, N., Healy, R. M., Wang, D. K., Ke, F., et al. (2015). Plume-based analysis of vehicle fleet air pollutant emissions and the contribution from high emitters. Atmos. Meas. Tech. 8 (8), 3263–3275. doi:10.5194/amt-8-3263-2015
Wang, J. Y., Sun, K., Ni, J., and Xie, D. (2021). Evaluation and factor analysis of industrial carbon emission efficiency based on “Green-Technology Efficiency”—The case of Yangtze River Basin, China. Land 10 (12), 1408. doi:10.3390/land10121408
Wang, C., Miao, W., and Lu, M. (2022). Evolution of the Chinese industrial structure: a social network perspective. Technol. Forecast. Soc. Change 184, 121972. doi:10.1016/j.techfore.2022.121972
Wang, C., Wang, F., Zhang, X., Yang, Y., Su, Y., Ye, Y., et al. (2017). Examining the driving factors of energy related carbon emissions using the extended STIRPAT model based on IPAT identity in Xinjiang. Renew. Sustain. Energy Rev. 67, 51–61. doi:10.1016/j.rser.2016.09.006
Wang, N., Qu, Z., Li, J., Zhang, Y., Wang, H., Xi, H., et al. (2025). Spatial-temporal patterns and influencing factors of carbon emissions in different regions of China. Environ. Res. 276, 121447. doi:10.1016/j.envres.2025.121447
Wang, Q., Chen, S., and Qu, T. (2024). Differences in carbon intensity of energy consumption and influential factors between Yangtze River economic Belt and yellow River Basin. Sustainability 16 (6), 2363. doi:10.3390/su16062363
Wang, W., and Yang, G. (2025). Sustainable carrying capacity: integrating SDGs to assess evidence of sustainable development: a case study of the Yangtze River Economic Belt in China. J. Clean. Prod. 486, 144569. doi:10.1016/j.jclepro.2024.144569
Wang, Z., Meng, J., and Guan, D. (2020). Dynamic driving forces of India’s emissions from production and consumption perspectives. Earth’s Future 8, e2020EF001485. doi:10.1029/2020ef001485
Wayth, N. (2023). Statistical Review of World Energy 2023. London, UK: Energy Institute. [Accessed October 2, 2024]. Available online at: https://www.energyinst.org/statistical-review
Wu, R., Yu, G., and Cao, Y. (2025). The impact of industrial structural transformation in the Yangtze River economic belt on the trade-offs and synergies between urbanization and carbon balance. Ecol. Indic. 171, 113165. doi:10.1016/j.ecolind.2025.113165
Xu, X. W. H., Huo, H., Liu, J., Shan, Y., Li, Y., Zheng, H., et al. (2017). Patterns of CO2 emissions in 18 central Chinese cities from 2000 to 2014. J. Clean. Prod. 172, 529–540. doi:10.1016/j.jclepro.2017.10.136
Yang, Z., Duan, J., and Fan, N. (2024). Towards carbon neutrality: the decoupling effect of industrial restructuring and non-fossil energy substitution on carbon emissions. Energy 308, 132787. doi:10.1016/j.energy.2024.132787
Yu, X. Y., Li, Y., Chen, H., and Li, C. (2019). Study on the impact of environmental regulation and energy endowment on regional carbon emissions from the perspective of resource curse. China Popul. Resour. Environ. 29 (5), 52–60. doi:10.12062/cpre.20190109
Yuan, J., Xu, Y., Zhang, X., Hu, Z., and Xu, M. (2014). China’s 2020 clean energy target: consistency, pathways and policy implications. Energy Policy 65, 692–700. doi:10.1016/j.enpol.2013.09.061
Yue, S., Pilon, P., and Cavadias, G. (2002). Power of the Mann–Kendall and Spearman’s rho tests for detecting monotonic trends in hydrological series. J. Hydrology 259 (1-4), 254–271. doi:10.1016/S0022-1694(01)00594-7
Yu, X., and Zhang, M. (2015). Decomposition of factors influencing carbon emissions in the region of Beijing–Tianjin–Hebei, based on the perspective of terminal energy consumption. Energy, Ecol. Environ. 36 (4), 338–344. doi:10.1080/10042857.2014.953781
Zhang, F. Q., and Ang, B. W. (2001). Methodological issues in cross-country/region decomposition of energy and environment indicators. Energy Econ. 23 (2), 179–190. doi:10.1016/S0140-9883(00)00069-4
Zhao, X. G., and Lu, F. (2019). Spatial distribution characteristics and convergence of China’s regional energy intensity: an industrial transfer perspective. J. Clean. Prod. 233, 903–917. doi:10.1016/j.jclepro.2019.06.073
Zhao, M., Lü, L., Zhang, B., and Luo, H. (2021). Dynamic relationship between energy consumption, economic growth, and carbon emissions in China. Res. Environ. Sci. 34 (6), 1509–1522. doi:10.13198/j.issn.1001-6929.2020.12.20
Zhao, Y., Su, Q., Li, B., Zhang, Y., Wang, X., Zhao, H., et al. (2022). Have those countries declaring “zero carbon” or “carbon neutral” climate goals achieved carbon emissions–economic growth decoupling?. J. Clean. Prod. 363, 132450. doi:10.1016/j.jclepro.2022.132450
Zhou, R. (2023). Economic growth, energy consumption and CO2 emissions—An empirical study based on the Yangtze River economic belt of China. Heliyon 9 (9), e19865. doi:10.1016/j.heliyon.2023.e19865
Zhou, Z., Jiang, P., and Chen, S. (2025). Decomposition of carbon emission drivers and carbon peak forecast for three major urban agglomerations in the Yangtze River Economic Belt. Sustainability 17 (6), 2689. doi:10.3390/su17062689
Zhu, Q., Peng, X.-z., and Wu, K.-y. (2012). Calculation and analysis on indirect carbon emissions from residential consumption based on input-output model. J. Nat. Resour. 27 (12), 2018–2029. doi:10.11849/zrzyxb.2012.12.003
Zhu, Q., and Peng, X. (2012). The impacts of population change on carbon emissions in China during 1978–2008. Environ. Impact Assess. Rev. 36, 1–8. doi:10.1016/j.eiar.2012.03.003
Zhu, Y., Feng, C., Liu, X., Zhang, T., and Wang, X. (2025). An analysis of the factors influencing energy consumption based on the STIRPAT model: a case Study of the Western regions of China. Energies 18 (9), 2379. doi:10.3390/en18092379
Keywords: carbon emissions, energy consumption, energy structure, influencing factors, Yangtze River Economic Belt
Citation: Zhu Y, Liu X, Feng C, Zhang T and Wang X (2025) An empirical study on the evolution and driving factors of energy-related carbon emissions in the Yangtze River Economic Belt. Front. Environ. Sci. 13:1596713. doi: 10.3389/fenvs.2025.1596713
Received: 20 March 2025; Accepted: 30 June 2025;
Published: 24 July 2025; Corrected: 20 August 2025.
Edited by:
Qunhai Huo, Chinese Academy of Sciences (CAS), ChinaReviewed by:
Zhe Cui, Nantong University, ChinaYaohui Liu, Shandong Jianzhu University, China
Yaqi Wu, North Minzu University, China
Xuewei Zhang, Inner Mongolia University, China
Copyright © 2025 Zhu, Liu, Feng, Zhang and Wang. This is an open-access article distributed under the terms of the Creative Commons Attribution License (CC BY). The use, distribution or reproduction in other forums is permitted, provided the original author(s) and the copyright owner(s) are credited and that the original publication in this journal is cited, in accordance with accepted academic practice. No use, distribution or reproduction is permitted which does not comply with these terms.
*Correspondence: Tao Zhang, dGFvemhhbmdAbXB1LmVkdS5tbw==
†These authors have contributed equally to this work and share first authorship