 Chen Bian
 Zongyi Chen2*
 Zhiguo Fan
- 1Economics Management College, Weifang University of Science and Technology, Weifang, China
- 2School of Finance, Qilu University of Technology, Jinan, China
Introduction: Addressing global climate change urgently requires worldwide collaborative efforts. Balancing the dialectical relationship between economic growth stabilization and carbon emission reduction has become a core challenge for China in advancing green, high-quality development. As evidenced by practice, policy-driven green technology innovation constitutes the key pathway to resolve this development challenge.
Methods: To evaluate the policy effects of carbon taxes and carbon reduction credit, this study develops an Environmental Dynamic Stochastic General Equilibrium (E-DSGE) framework, integrating parameter calibration with Bayesian estimation methods to systematically simulate the dynamic responses of macroeconomic variables to carbon tax and carbon reduction credit shocks.
Results: (1) carbon reduction credit demonstrates superior policy efficacy compared to carbon tax mechanisms. Aligning with the neoclassical “compliance cost” framework, the carbon tax exhibits weaker incentives for green technology innovation and less balanced carbon reduction-growth coordination than carbon reduction credit. (2) supporting policies—such as tax cuts, fiscal expenditure expansion, and monetary tools like central bank lending rate cuts and reserve requirement ratio reductions—can significantly enhance the implementation effectiveness of carbon reduction credit. (3) the coordinated implementation of carbon reduction policies and macro-control policies yields stronger outcomes in both emission reduction and growth stabilization than standalone policies, while generating positive social welfare spillover effects.
Discussion: Our paper offers new perspectives for green finance theory and public policy research. It validate the strategic value of carbon reduction credit mechanisms in advancing China’s sustainable development, providing an innovative policy tool for resolving the tension between environmental governance and economic growth.
1 Introduction
Tackling climate change, a defining challenge of our time, necessitates coordinated global action. The Paris Agreement represents this vital international cooperation, requiring each participating country to define and submit its own plan (NDC) for cutting carbon emissions (Diaz and Moore, 2017; Cheng et al., 2021; Ghosh et al., 2024). As a leading global emitter of carbon dioxide, China’s approach and progress in reducing emissions are crucial for global climate action. The government has pledged to peak its carbon emissions by 2030 and achieve carbon neutrality by 2060 (Mohsin et al., 2021; Pei et al., 2022).
China faces immense pressure to reduce carbon emissions, making the adoption of diverse decarbonization measures essential for achieving its dual carbon goals (peak carbon by 2030, carbon neutrality by 2060). Currently, the carbon pricing mechanism centers on an emissions trading scheme (ETS), yet its policy effectiveness remains constrained by structural limitations: On one hand, the national carbon market covers a limited scope, currently including only a few high-emission sectors like power generation, failing to create incentives for emission reduction across entire industrial chains. On the other hand, carbon prices remain significantly lower than those in mature markets like the EU, and the price signaling mechanism has not yet fully realized its role in resource allocation. China’s carbon emissions, carbon market trading volume, and average carbon trading price from 2021 to 2023, compared with relevant data from the United States and the European Union, are shown in Table 1.
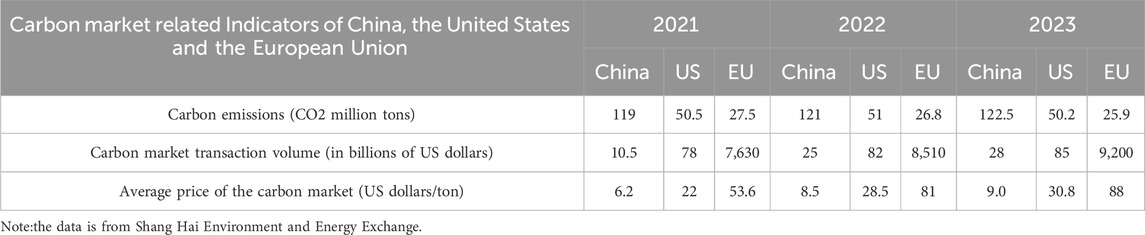
Table 1. Comparison of carbon data between China and the United States and the European Union.
Against this backdrop, strengthening the carbon policy toolkit is imperative. Potential solutions include exploring the introduction of a carbon tax—designed with differentiated rates to create policy synergy and address coverage gaps in the carbon market—alongside deepening the innovative application of green finance tools and refining carbon emission reduction support tools.
The theoretical research in the field of environmental tax has developed a relatively comprehensive academic system, and the academic community has accumulated extensive theoretical achievements on this topic. The core purpose of imposing carbon tax is to incentivize enterprises to internalize external environmental costs. Although short-term financial performance may be temporarily affected due to the “compliance costs” effect, from a long-term perspective, it can stimulate the “Porter Effect” (Lu et al., 2025; Wang et al., 2024; Liu N. et al., 2023; Adanma and Ogunbiyi, 2024), effectively safeguarding the ecological environment while driving economic growth. Particularly important is that when environmental taxes are implemented in conjunction with structural tax reductions targeting taxes associated with market distortions, they can generate a “double dividend” effect. This promotes both economic prosperity and strengthens environmental protection (Jin et al., 2024). The mechanism for achieving this “double dividend” lies in its ability to incentivize increased investment in technological innovation, accelerate the optimization and upgrading of industrial structures, and expand labor demand.
Green finance, as a specialized financial approach, directs capital towards environmentally beneficial activities to improve resource allocation, strengthen environmental governance, and tackle climate change globally. It involves various tools such as green credit, green investments, green bonds, green insurance, and green funds. These tools employ rigorous selection criteria, return assurance mechanisms, and risk management protocols (Fan et al., 2024). Green finance contributes to carbon reduction through dual pathways: at the macro level, it drives industrial upgrading and technological innovation, thereby lowering carbon emission intensity; at the micro level, it reduces internal corporate carbon emissions via financing support, incentive structures, and external supervision (Zhao et al., 2024). Extensive empirical evidence confirms that green finance effectively enhances green total factor productivity, facilitates industrial transformation, and mitigates both carbon emissions and air pollution (Gu et al., 2021; Zhang S. L. et al., 2021; Lee and Lee, 2022; Mamun et al., 2022). Moreover, as a market-oriented environmental policy tool, green credit demonstrates superior effectiveness compared to traditional government regulation and has emerged as a primary mechanism for the government to influence resource allocation by financial institutions (Lv et al., 2023; Chai et al., 2022; Xu and Li, 2020; Fan et al., 2021; Zhang S. et al., 2021).
Emphasizing the reduction of carbon emissions is not incompatible with pursuing economic growth. Instead, it involves embedding the principles of green and sustainable development within the economic framework to foster greater harmony between economic progress and environmental safeguarding (Sharif et al., 2023; Omri et al., 2025). To strike this balance, it is crucial to actively foster green industries while simultaneously exploring technologies that boost energy efficiency and facilitate cleaner production in traditional, energy-intensive sectors. This green transformation relies on continuous advancements in green technology. However, the accelerated growth of green finance has predominantly channeled funds towards developing green industries, frequently leaving the financing needs of existing high-carbon industries inadequately addressed (Han and Li, 2022; Irfan et al., 2022; Yu et al., 2022). Therefore, for China to effectively attain its green and sustainable development goals, green credit—as a cornerstone of green finance—must be instrumental in guiding the low-carbon transition of industries with high carbon emissions (Wang, 2025). Several Chinese commercial banks are actively exploring innovative ways to incorporate green credit principles into financing for high-carbon industries. In a significant move to extend green credit to carbon reduction, the Shenzhen Branch of the People’s Bank of China (PBOC) prompted local financial institutions in July 2024 to launch carbon reduction credit products. This mechanism links a company’s loan interest rate directly to its carbon reduction performance. By creating a pricing structure that rewards emission-cutting efforts, it motivates businesses to achieve targeted reductions in their operations, thereby broadening both the scope and impact of green credit.
Given this context, we are interested in investigating several key issues: (1) What are the policy effectiveness of carbon tax and carbon reduction credits, and whether they can achieve the “win-win” situation of carbon reduction and stabilizing economic growth by promoting green technology innovation? (2) How do macroeconomic policies affect the policy effectiveness of carbon reduction credit, and what are the policy outcomes of their coordinated implementation? (3) How do carbon reduction policies and their coordinated implementation with macroeconomic policies affect social welfare?
There is considerable discussion within academia regarding the effectiveness of carbon tax policies, and the impacts following the implementation of the Green Credit Guidelines have also been widely debated (Chen Z. G. et al., 2022; Xu et al., 2023; Lai et al., 2024; Liu et al., 2024; Xu and Lin, 2025). However, no existing literature has yet examined the policy implications of the novel green credit instrument—carbon reduction credit. Studies that incorporate both carbon reduction credit and carbon tax within the same analytical framework to discuss their effects are even rarer. In light of this gap, to comprehensively evaluate the policy effects of implementing carbon reduction credit and carbon taxes within a unified framework, this study establishes an E-DSGE comprehensive analytical framework. Compared to other macroeconomic models, the DSGE model offers distinct advantages, as it can integrate and assess multiple policies simultaneously while clearly illustrating the dynamic changes of economic variables around their steady state following policy implementation. Furthermore, the model facilitates in-depth analysis of both short-term and long-term policy effects, enables the precise identification of policy transmission mechanisms, and allows for a thorough investigation into the interactions and influences among various policies. The E-DSGE model extends the traditional DSGE framework by incorporating environmental factors into business cycle analysis, making it an efficient tool for evaluating the impacts of carbon reduction credit policies (Liu N. et al., 2023).
The main contributions of our study can be summarized as follows:
First, we innovatively integrate both carbon taxation and carbon reduction credit into an environmental dynamic stochastic general equilibrium (E-DSGE) framework, thereby significantly expanding the analytical scope of traditional DSGE models in climate policy research. This methodological advancement enables a more comprehensive evaluation of heterogeneous policy tools within a unified macroeconomic system.
Second, we conduct a multi-dimensional impact assessment of how carbon pricing mechanisms and targeted credit facilities interact with green technology innovation, systematically analyzing their dual effects on economic stabilization and decarbonization. This analytical framework provides crucial theoretical underpinnings for optimizing China’s green transition policy mix, particularly in balancing emission reduction targets with sustainable growth objectives.
Third, our study carries out the examination of synergistic interactions between conventional macroeconomic policies and specialized carbon mitigation tools. By quantifying both policy substitution effects and complementary benefits, we reveal the welfare implications of different policy combinations, offering important insights for designing coordinated climate-finance strategies that enhance overall socio-economic welfare.
The remainder of the paper is organized as follows. Section 2 provides a review of the related literature. Section 3 constructs a E-DSGE model to portray China’ carbon reduction credit. Section 4 provides the numerical analysis. Section 5 and Section 6 carry on the policy simulation. Section 7 concludes the paper.
2 Literature review
The E-DSGE model, developed from the RBC framework by Fischer and Springborn (2011) and Heutel (2012) by incorporating emissions and environmental externalities, serves as a key lab for environmental policy evaluation. Annicchiarico and Di Dio (2015) integrated price stickiness, aligning it better with short-term realities and making it a mainstream tool. The academic community has systematically explored the integration of environmental taxation policy instruments and green finance theoretical frameworks into Environmental Dynamic Stochastic General Equilibrium (E-DSGE) models, achieving substantial advances in driving innovation within quantitative analytical frameworks for environmental economic policies. The literature review of our study primarily focuses on the application of taxes related to resources and the environment and green financial policies within the E-DSGE model.
In the field of environmental tax research, Xiao et al. (2018) incorporates environmental tax and emission permits into an E-DSGE framework, analyzing various shocks. They find environmental tax shock to be counter-cyclical, with emission intensity shock exerting greater effects than both environmental tax shocks and emission cap shocks. Xiao et al. (2021) extend the E-DSGE model by incorporating clean and fossil energy sectors. They analyze the dynamic interaction effects and optimal design of China’s sulfur dioxide emission tax and carbon emission trading. Their findings show that the synergistic emission reduction effect between carbon trading and the sulfur tax enhances the automatic stabilizing effects of both policies. If a Renewable Portfolio Standard (RPS) were incorporated into the E-DSGE model, it would cause the optimal tax rate, CO2 quota quantity, and renewable energy share to all exhibit pro-cyclical patterns, with each policy functioning as an automatic stabilizer (Xiao et al., 2024). Chan (2020a) builds a two-country E-DSGE model to compare optimal carbon tax rates under non-cooperative and cooperative scenarios across different economic shocks. He finds that without cooperation, a country’s optimal carbon tax increases less during a positive domestic TFP shock and decreases more during a positive energy price shock. Using an E-DSGE model, Chan (2020b) compares the effectiveness of standard macroeconomic tools versus carbon tax in curbing air pollution. The study finds that carbon taxes should complement monetary policy, but should not react to fiscal policy. Chan et al. (2024) develops an E-DSGE model featuring green and brown sectors with endogenous default to assess climate-induced threats to financial stability. They find that overly stringent carbon taxes would elevate medium-term default rates in industries, thereby undermining financial stability due to potential adverse effects on bank balance sheets. Ma and Li (2024) develops an endogenous growth E-DSGE model to analyze environmental regulation’s impact on energy efficiency and carbon reduction. Results indicate that while such policies improve energy efficiency, their effectiveness is limited and may fall short of supporting production expansion.
In the field of green finance research, Liu and He (2021) develops a DSGE model to analyze the output and welfare effects of green credit in China. The study finds that both price-based and quantity-based green credit generate significant output, environmental, health, and utility welfare effects, facilitating the greening of China’s industrial structure and thereby achieving dual benefits in output and environmental outcomes. Using a heterogeneous-firm DSGE model incorporating a financial accelerator mechanism and uncertainty shocks, Ma et al. (2024) finds that green credit significantly reduces emission levels, while its effectiveness is constrained by rising external uncertainty. Liu H. Y. et al. (2023) develops a DSGE model incorporating banking and insurance sectors, finding that transition risk insurance mitigates the negative output and employment impacts of unexpected risk shocks. Moreover, green credit incentives not only curb carbon emissions but also increase the likelihood of energy transition among producers, thus promoting low-carbon economic growth. Xin et al. (2024) constructs a six-sector DSGE model to analyze whether the synergistic evolution of Central Bank Digital Currency (CBDC) and green bonds can fully unleash their positive role in promoting a net-zero economy. The research finds that an increase in CBDC supply has a positive impact on the economy, promoting green bond financing and net-zero emissions.
It is noteworthy that existing extensions of the E-DSGE framework have yet to incorporate the endogenous evolution mechanism of green technology innovation—a core driver of China’s green economic transition. Green technological innovation not only improves environmental quality but also reshapes corporate value creation logic by overcoming the “dual externality” dilemma. This is achieved both by internalizing environmental benefits through breakthroughs in clean production technologies and by creating green consumer markets via the supply of environmentally friendly products (Lin and Ma, 2021; Wang et al., 2021; Lei et al., 2025). While market-based environmental policy tools such as environmental tax systems have been extensively studied, research specifically analyzing the policy effects of carbon reduction credit within the DSGE paradigm remains insufficient. Crucially, the existing literature has yet to establish a systematic analytical framework incorporating dual policy tools—carbon reduction credit and carbon tax. Such a gap not only constrains the scientific assessment of synergistic effects among multi-dimensional policy tools but may also delay the iterative optimization of the low-carbon transition policy toolkit.
Unlike previous studies that treat green technology innovation as exogenous, this research constructs a comprehensive analytical framework by simultaneously embedding endogenous green technology innovation alongside traditional carbon reduction policy tools (carbon tax) and the novel carbon reduction policy tool (carbon reduction credit) within an extended E-DSGE architecture. This study aims to elucidate the transmission mechanisms and policy effects of these two tools, as well as how they can be coordinated with macroeconomic policies to achieve the dual goals of macroeconomic stability and carbon neutrality, thereby promoting theoretical advancement in environmental macroeconomics and enabling evidence-based optimization of China’s green policy mix.
3 Model
We construct an extended E-DSGE model based on the New Keynesian framework. It includes six agents: households, capital goods producers and entrepreneurs, commercial bank, firms, the green patent intermediate goods department, government and central bank. The relationship among the six departments is shown in Figure 1.
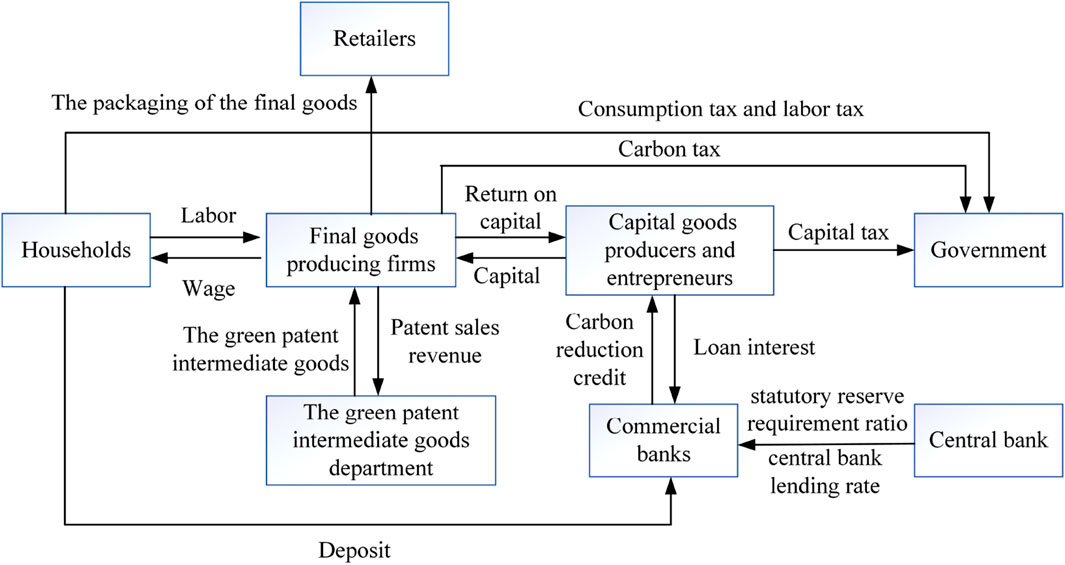
Figure 1. Model structure framework containing six departments.
3.1 Households
A representative household maximises its expected lifetime utility as follows:
where
Where
3.2 Capital goods producers and entrepreneurs
3.2.1 Capital goods producers
We assume that the capital goods producers are homogeneous and operate under conditions of perfect competition. The capital goods producer purchases the remaining capital goods
The capital goods equation for period t&1 is as follows:
where
Dividing both sides of Equation 7 by
3.2.2 Entrepreneurs
We assume that entrepreneurs are homogeneous and obtain loans from commercial banks, with the loan amount denoted by
Taking the first-order derivative of Equation 9 with respect to
3.3 Commercial bank
We assume there are commercial banks which receive at time
Where
The asset side of the commercial bank’s balance sheet primarily consists of loan quotas
Substitute Equation 12 into Equation 11, find the first-order derivative of O, and after sorting, we can get the formula for optimizing LPR.
Commercial banks must price loans based on the firms carbon account rating reports provided by the local government’s credit reporting platform, thereby implementing the carbon reduction credit policy. Commercial banks adjust the
Where
3.4 Firms
3.4.1 Retailers
In the first nested layer, retailers operating in a perfectly competitive maket use
Where
3.4.2 Final goods-producing firms
In the second nested layer, final goods-producing firm
Where
Where
The emissions from production are
Where
Where
The government imposes a carbon tax on final goods-producing firms based on their actual carbon emissions with a carbon tax rate
To minimize production costs and better determine the marginal cost, final goods-producing firms optimize the usage ratio of production factors, including labor, capital, and green patent, based on the principle of cost minimization.
Furthermore, by incorporating the marginal cost of carbon emissions, the total marginal cost is
We assume a Calvo price-setting mechanism and retailers adjust each period their prices with a probability
3.5 The green patent intermediate goods department
The profit of the green patent Intermediate goods department is
Where
The monopoly discounted value of green patent intermediate goods is
Where
The R&D function of the green patent intermediate goods department is
Where
Where
For the green patent intermediate goods department, the income from R&D activities
3.6 Government and central bank
3.6.1 Government
The government revenue
Fiscal revenue
We sets the consumption tax rate
3.6.2 Central bank
The central bank employs monetary policy tools—such as adjusting the statutory reserve requirement ratio
3.7 Market clearing and aggregation
In equilibrium, we have the market-clearing condition
4 Parameter calibration and Bayesian estimation
4.1 Parameter calibration
In this section, we discuss how the parameter values of the Table 2 summarizes the parameter values used for calibration. The model assumes that each period corresponds to one-quarter.
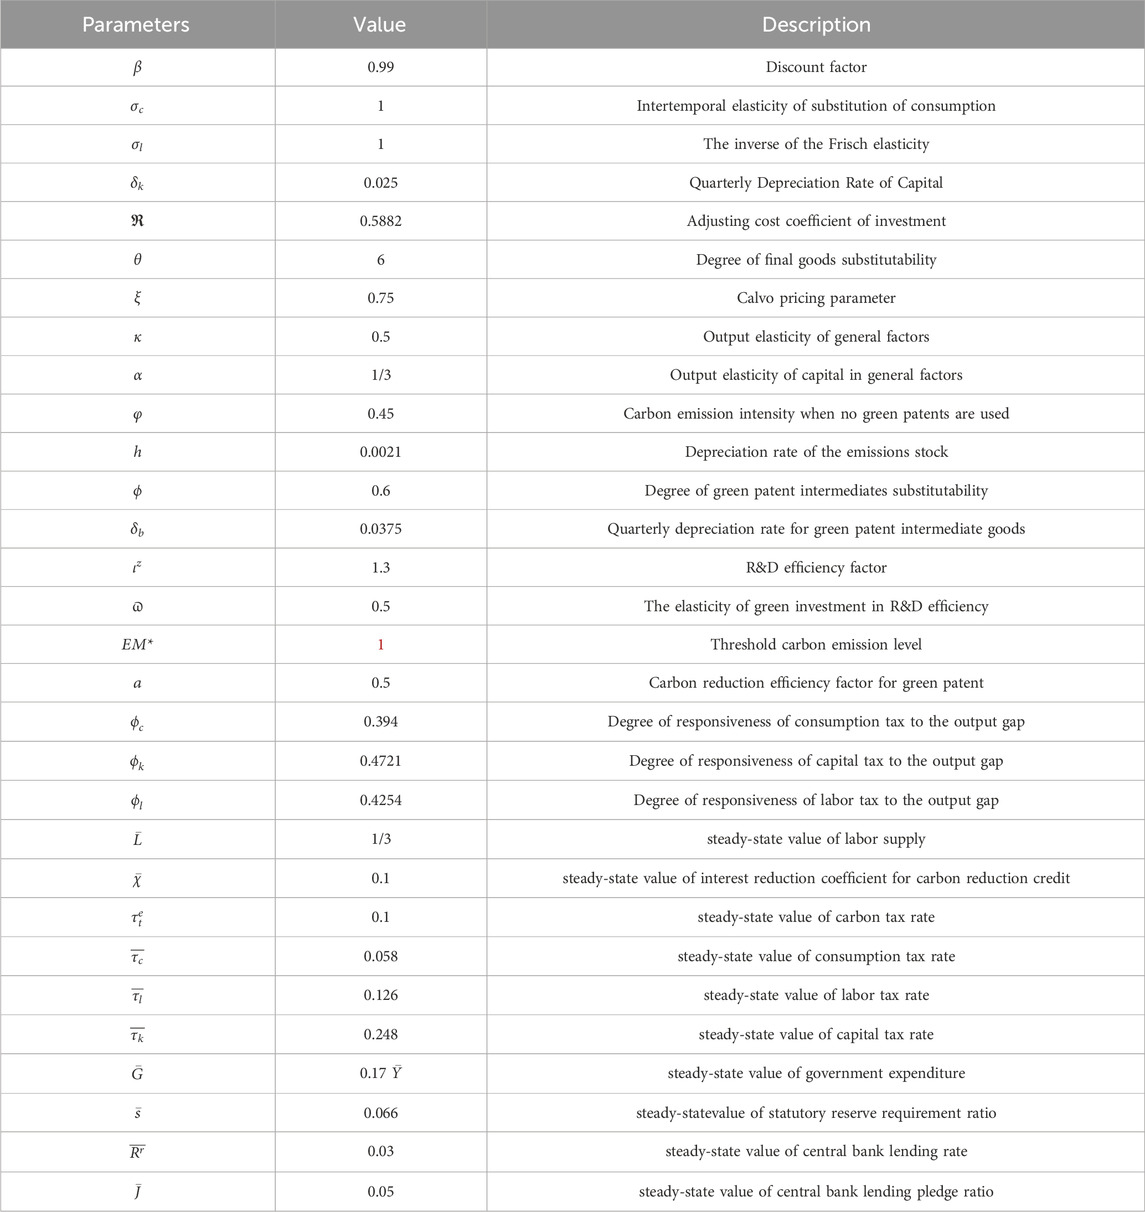
Table 2. The calibrated parameter values used for numerical analysis.
On the household side, following the tradition, the discount factor
On the capital goods producers side, following Christiano et al. (2014), the adjusting cost coefficient of investment
On the commercial banks side, we set the carbon emission threshold level
On the firms side, following Annicchiarico and Di Dio (2015), the degree of final goods substitutability
On the green patent Intermediate goods department side, as in Chen L. F. et al. (2022), the R&D efficiency factor
On the government and central bank sides, We follow Wang et al. (2020) to set steady-state value of consumption tax rate, steady-state value of labor tax rate, steady-state value of capital tax rate to be 0.058, 0.126, 0.248, respectively. Following Bian et al. (2019), degree of responsiveness of consumption tax to the output gap
4.2 Bayesian estimation
According to the Bayesian estimation framework, output gap (
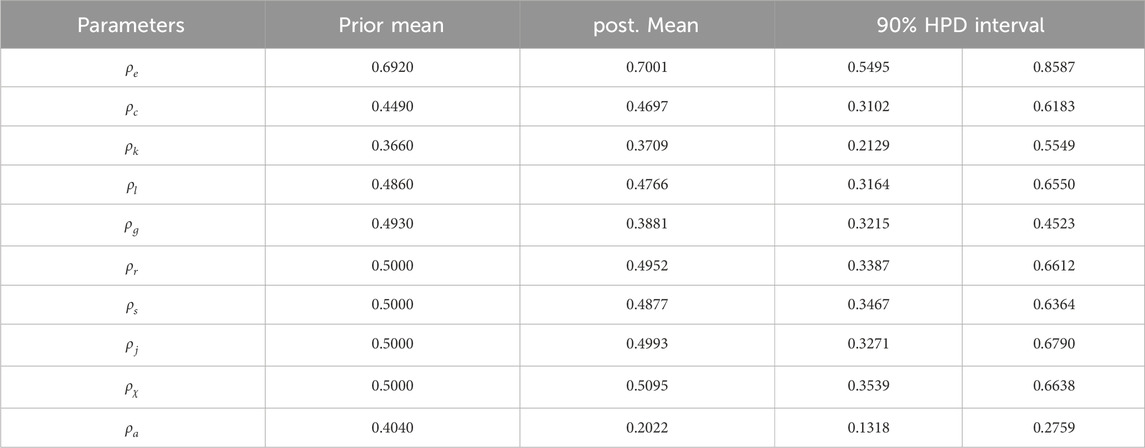
Table 3. Bayesian estimated values for numerical analysis.
5 Numerical analysis
5.1 The impact of carbon reduction credit
We quantify the policy’s effects on stabilizing economic growth, reducing carbon emissions, and promoting green technology innovation by analyzing the steady-state deviations induced by policy shocks on the output gap, carbon emission gap, and the gap in green patent intermediate product categories. To clearly illustrate the dynamic impact mechanism of the carbon reduction credit on green technology innovation, carbon emission reduction, and stabilizing economic growth, we analyze the impulse responses of key macroeconomic indicators to the carbon reduction credit interest rate reduction, as depicted in Figure 2.
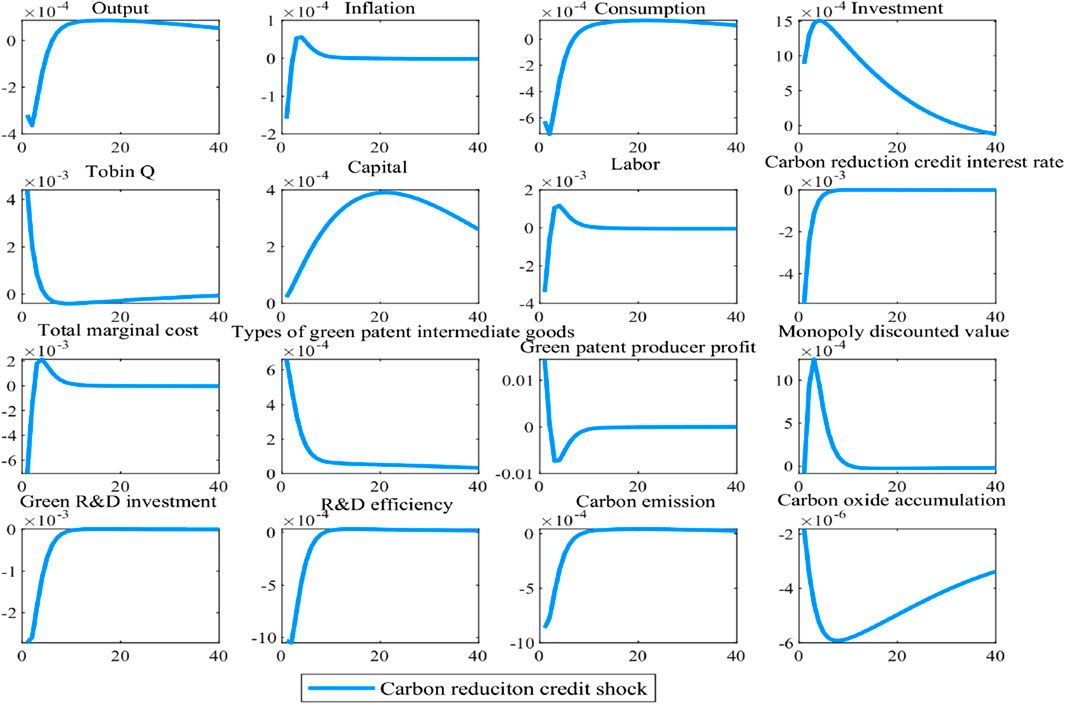
Figure 2. Impulse response to carbon reduction credit shock.
Figure 2 shows that 1% carbon reduction credit shock leads to an immediate increase of 0.066% in the types of green patent intermediate goods. The impulse response for the types of green patent intermediate goods remains consistently positive over 40 periods, demonstrating that the carbon reduction credit shock has a sustained and long-lasting positive effect on green technology innovation. 1% carbon reduction credit shock immediately reduces output by 0.032% with the negative impact persisting for 6 periods. After this initial phase, the impulse response of output turns positive, suggesting that the implementation of the carbon reduction credit has a nonlinear effect on output growth—initially suppressing and later stimulating it, which demonstrates the policy’s long-term stabilizing effect on economic growth. 1% carbon reduction credit shock immediately reduces carbon emissions by 0.086%, and the effect on emissions remains consistently negative throughout the 40 periods, which underscores the significant and sustained impact of the carbon reduction credit in reducing carbon emissions.
From the perspective of the transmission mechanism, the impact of carbon reduction credit operates through an interest rate determination mechanism that prioritizes carbon emission reduction, leading to an immediate decrease in the interest rates of carbon reduction credit. As a result, on the one hand, the Tobin Q value rises, leading to an increase in investment levels and capital supply. On the other hand, through the market-based interest rate transmission mechanism, the risk-free interest rate is pushed lower in a short time and then pushed higher, which owes to the effect of the interest rate cut is shared by the decline in carbon reduction credit interest rate and the increase in LPR. Thereby, it encourages households to increase savings while reducing consumption expenditures. Shifts in consumption alter the labor-leisure substitution elasticity, as improving marginal utility from consumption coupled with a relative reduction in labor supply’s marginal value incentivizes households to reduce labor supply. The change in risk-free interest rates has reduced discount factors, thereby increasing the monopoly discount value of patents and boosting the profits of green patent producers, which has enhanced the expected returns for green patent developers. As a result, It will encourage the green patent intermediate goods department to intensify its green innovation efforts and expand its portfolio of green patent applications. However, constrained by the production possibility frontier, the increase in investment generates a substitution effect on green R&D investment. This substitution effect is sufficiently large to outweigh the positive inducement effect created by the rising expected total returns from various new green patent intermediate goods, thereby crowding out green R&D investment and reducing R&D efficiency. Consequently, the expansion of the types of green patent intermediate goods only exhibits short-term effects rather than generating sustained long-term effectiveness.
In the short term, the decrease in consumption and green R&D investment cannot be fully offset by the rise in investment, resulting in a reduction in aggregate demand and a decline in output. However, as consumption levels recover, output is expected to rise in the long term. From a supply-side perspective, this long-term increase in output is driven by the diversification of green patent intermediate goods and the expansion of the capital stock, both of which effectively counterbalance the negative impact of reduced labor on output.
Carbon emissions are influenced by two key factors, which contain output growth and the increase in the variety of green patent intermediates. On the one hand, emissions are positively correlated with output. On the other hand, they are negatively correlated with the expansion of green patent intermediate goods. In the short term, the combined effect of reduced output and the rise in green patent intermediate goods lead to a decline in carbon emissions. In the long term, although higher output levels tend to increase emissions, this effect is outweighed and offset by the stronger carbon reduction impact resulting from advancements in green technology innovation. Consequently, carbon emissions continue to decrease throughout the simulation period, resulting in a negative impulse response trajectory for cumulative carbon emissions.
Figure 3 illustrates the transmission mechanism through which the interest rate cut on carbon reduction credit influences green technology innovation, carbon emission reduction, and economic stabilization.
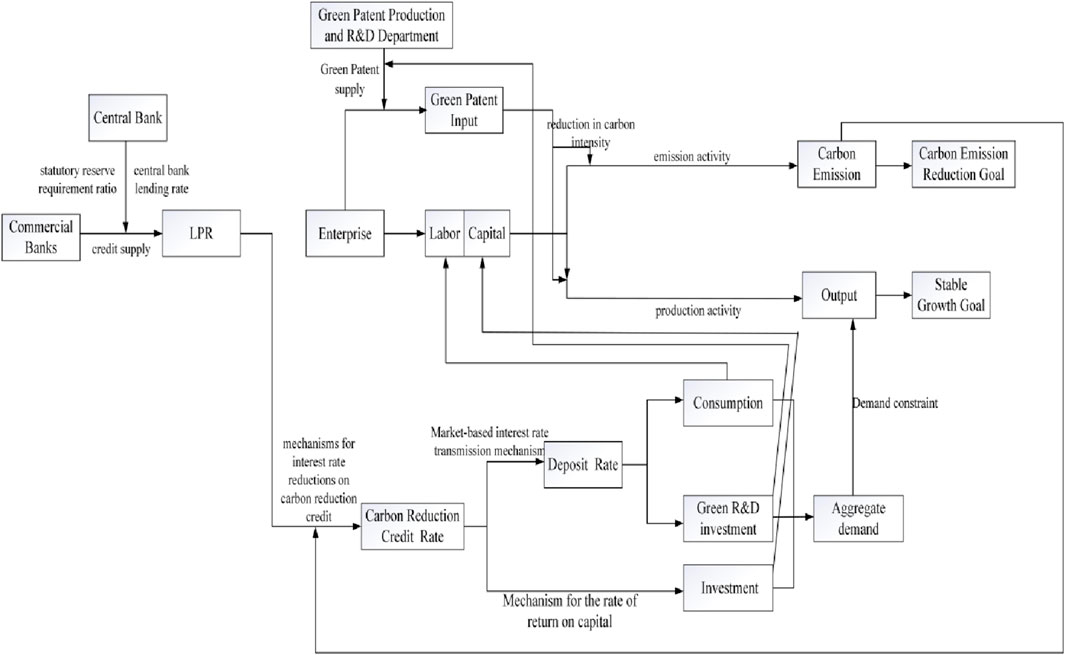
Figure 3. Delivery mechanism to carbon reduction credit.
5.2 The impact of carbon tax
We further analyze the policy effect of the carbon tax. The result is as shown in Figure 4.
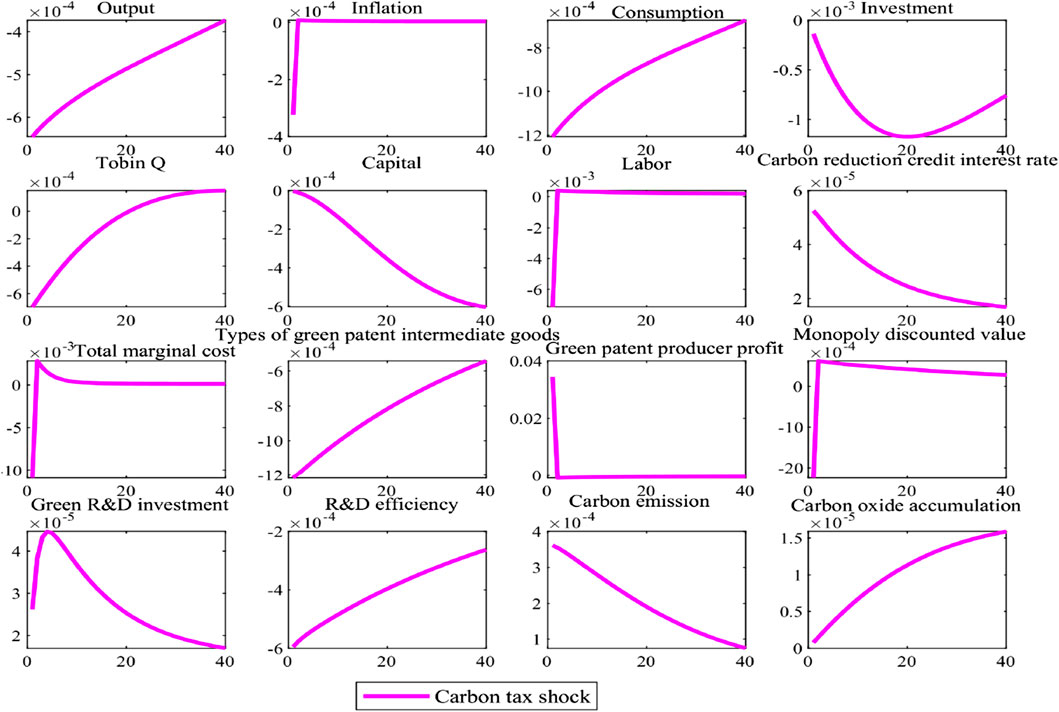
Figure 4. Impulse response to carbon tax shock.
As illustrated in Figure 4, a 1% carbon tax shock induces three distinct macroeconomic effects: First, it triggers an immediate 0.12% contraction in green patent intermediate goods production, with this downward trajectory persisting through 40 observation periods. This persistent and prolonged adverse impact suggests carbon taxation substantially inhibits green technology innovation momentum. Second, the policy shock simultaneously initiates a 0.064% output reduction that maintains across the same 40 periods, indicating measurable trade-offs between environmental regulation and economic growth. Most paradoxically, the simulation reveals a 0.036% near-term increase in carbon emissions following the tax implementation, with this counterintuitive upward trend enduring through 40 periods empirical evidence challenging conventional assumptions about carbon pricing mechanisms’ environmental efficacy. The tripartite results collectively demonstrate that the “compliance cost effect” induced by carbon taxation has outweighed the “Porter effect”, leading to supply-side failures in green technology innovation, ultimately resulting in a lose-lose scenario characterized by both economic growth slowdown and compromised environmental sustainability.
From the perspective of transmission mechanisms, the carbon tax shock initially causes a transient decline in total marginal costs on the supply side, followed by rapid escalation. Final goods-producing firms consequently reduce production factor prices to cut costs. This triggers dual effects: On one hand, declining wages reduce labor supply, depressing household disposable income and thereby curtailing consumption. On the other hand, the diminished capital return rate lowers Tobin’s Q, weakening investment incentives for capital goods producers and reducing capital supply. The contraction in household savings elevates risk-free interest rates, which reduces the discount factor and consequently depreciates the monopoly discount value of green patents intermediate goods. This undermines green patent developers’ anticipated total returns. As a result, it will suppress the green patent intermediate goods department to intensify its green innovation efforts, leading to a reduction in the supply of green patent intermediate goods. Simultaneously, constrained by the production possibility frontier, reduced consumption and investment exert a crowding-in effect on green R&D investment. Consequently, the reduction of green patent intermediate goods recovers to a certain extent.
The reduction in consumption and investment outweighs the increase in green R&D investment, leading to a short-term reduction in output levels. From the supply-side perspective, the reason for the decline in output in the short term lies in the dual decrease in both conventional production factors and the supply of green patented intermediate goods.
Carbon emissions are influenced by two factors: output growth and the types of green patent intermediate goods. Although the carbon tax reduces output, generating a certain “carbon reduction effect”, it simultaneously inhibits green technology innovation, creating a stronger “carbon increase effect”. This ultimately leads to an increase in carbon emissions. Throughout the simulation period, carbon emissions continue to rise, resulting in a cumulative carbon emissions trajectory exhibiting a positive impulse response.
5.3 Parameters sensitivity analysis of carbon reduction credit and carbon tax
5.3.1 Parameters sensitivity analysis of carbon reduction credit
To ensure the robustness of the study, this section conducts a parameter sensitivity analysis to simulate the effects of changes in the threshold carbon emission level and the steady-statevalue of the interest reduction coefficient for carbon reduction credit. The results are presented in Figures 5, 6, respectively.
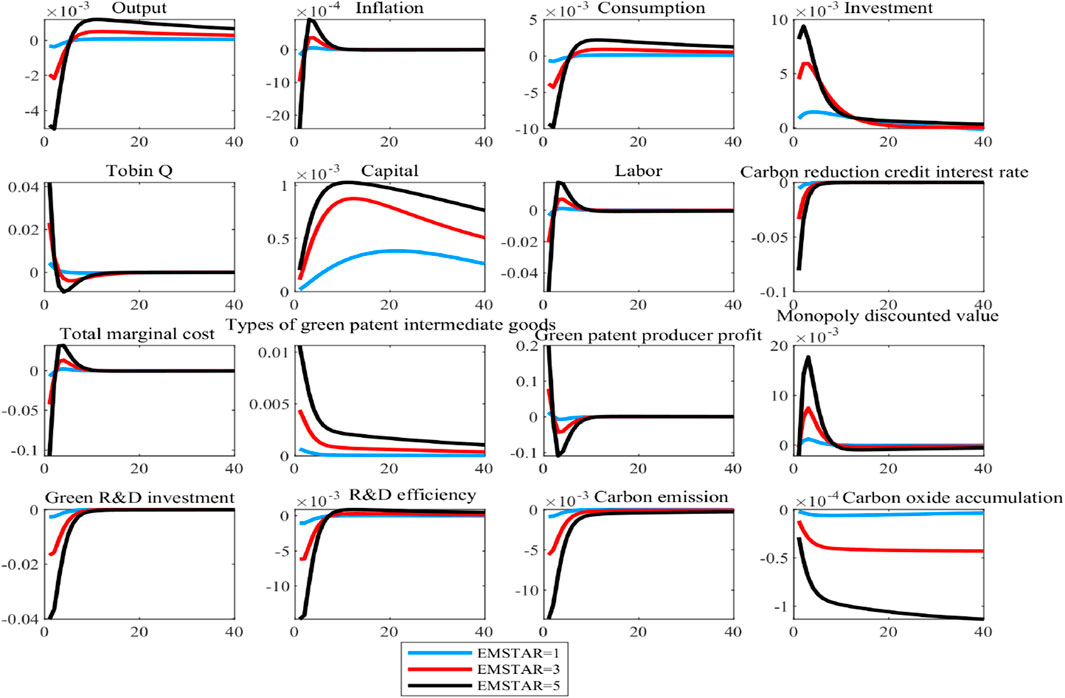
Figure 5. Sensitivity analysis of threshold carbon emission level.
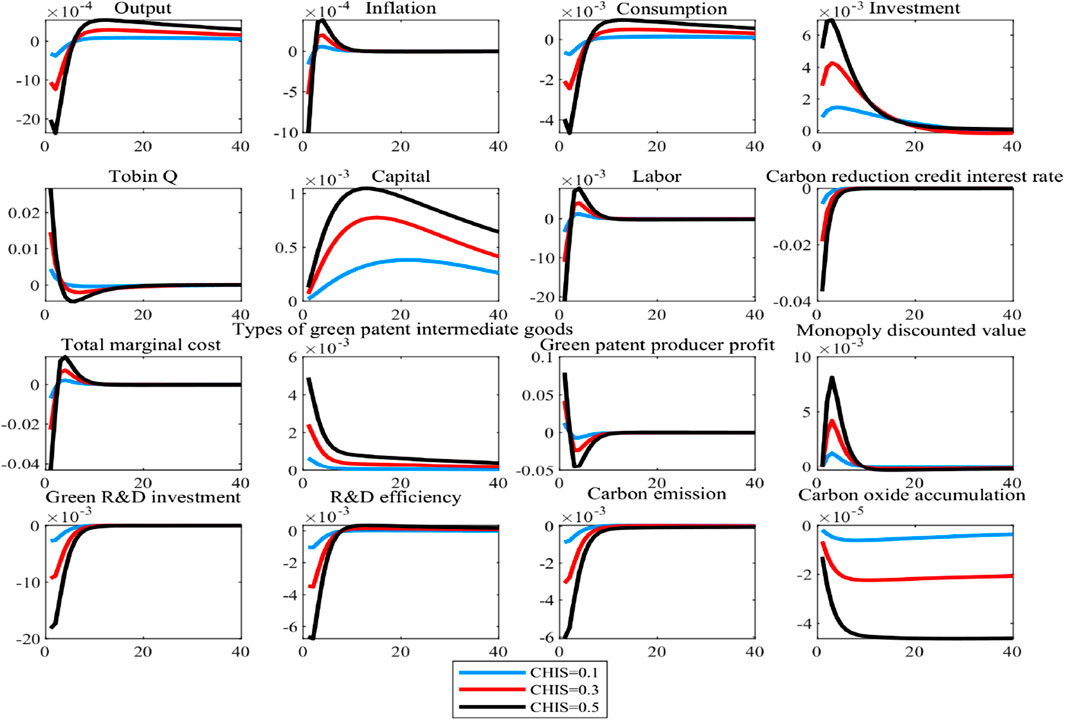
Figure 6. Sensitivity analysis of steady-state value of interest reduction coefficient for carbon reduction credit.
Figure 5 shows that as the threshold carbon emission level gradually rises, the carbon reduction credit plays an increasingly significant role in promoting green technology innovation, which is evidenced by the higher impulse response values for the types of green patent intermediate goods. At the same time, the policy’s impact on short-term and long-term economic output exhibits a differentiated strengthening trend. In the short term, a higher threshold carbon emission level amplifies the negative effect of interest rate cuts on output, as reflected by a decline in the short-term output impulse response value. In the long term, however, it fosters positive output growth, with the long-term output impulse response value increasing accordingly. The difference between short-term and long-term policy effects shows that raising the threshold carbon emission level helps enhance the policy’s long-term economic stabilization effect. In addition, the increase in threshold carbon emission levels significantly enhance the effectiveness of the carbon reduction credit in reducing carbon emissions. Specifically, under higher thresholds, the impulse response values for both carbon emissions and cumulative carbon oxide levels are notably lower.
From an economic mechanism perspective, the rise in the threshold carbon emissions value leads to a corresponding reduction in the interest rates of carbon reduction credit. This, by affecting the risk-free interest rate, exacerbates the restraining effect on consumption within the carbon emission reduction credit interest rate mechanism, resulting in a temporary contraction in aggregate demand and a decline in output levels. However, in the long term, as the consumption crowding-out effect gradually diminishes, aggregate demand expands, driving higher growth in output levels. In addition, the lower interest rate on carbon reduction credit directly increases the monopoly discount value of patents and expanding the profit margins for green patent producers which boosts the overall volume of R&D activities, ultimately leading to the creation of a more types of green patent intermediate goods. The advancement in green technology innovation, coupled with the relative decline in output levels, has collectively contributed to stronger carbon emission reduction effects and a reduction in cumulative carbon oxide levels.
We also examine the changing trends in the policy’s impact on green technology innovation, economic stabilization, and carbon emission reduction as the steady-state value of interest reduction coefficient for carbon reduction credit increases from 0.1 to 0.5. The dynamic effect exhibits similar to those observed with the rise in the threshold carbon emission level. Figure 6 shows this trend.
5.3.2 Parameters sensitivity analysis of carbon tax
To ensure the robustness of the study, this section conducts a parameter sensitivity analysis to simulate the effects of changes in the carbon tax rate. The results are presented in Figure 7.
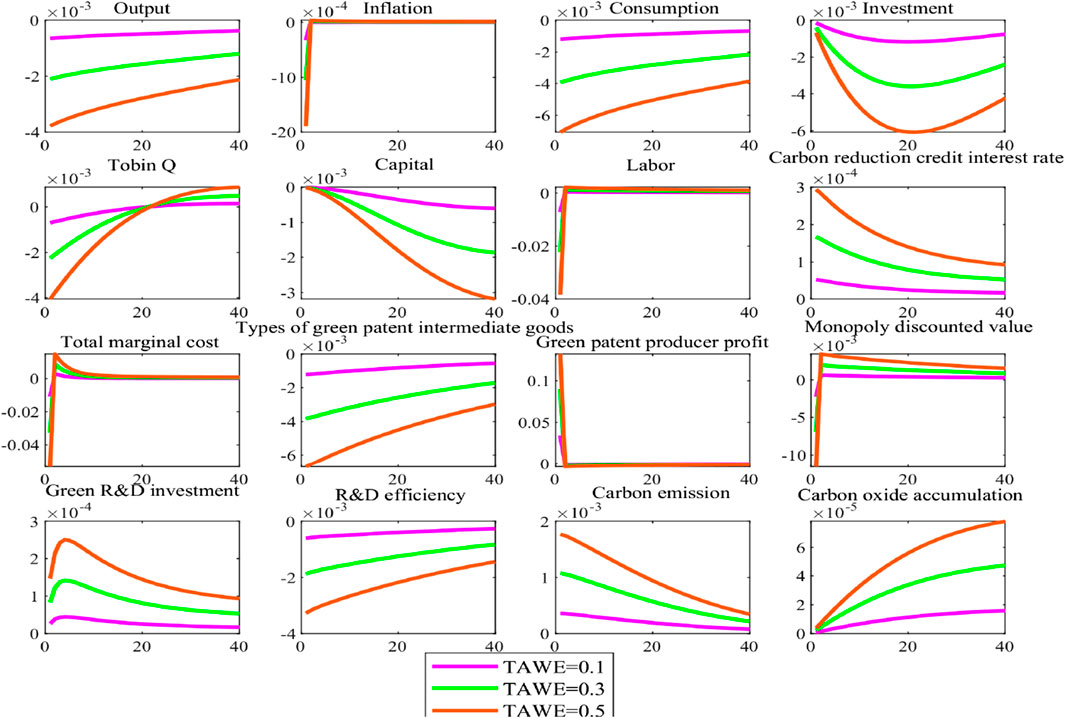
Figure 7. Sensitivity analysis of steady-state value of carbon tax rate.
Figure 7 shows that as the steady-state value of carbon tax rate rises, the inhibitory effect of carbon reduction credit on green technology innovation becomes more pronounced. This is manifested through a growing trend of negative deviations from steady-state in the types of green intermediate patents. Simultaneously, higher carbon tax rates exert a more significant crowding-out effect on output levels while also demonstrating a more substantial inhibitory impact on carbon emission reduction.
From the perspective of transmission mechanisms, an increase in carbon tax rates generates composite effects through dual negative transmission pathways. First, as tax rates rise incrementally, the crowding-out effects on both consumption and investment are significantly amplified, leading to a persistent leftward shift of the aggregate demand curve and exacerbating output losses. Second, excessively high tax burdens suppress enterprises’ momentum to invest in green technology innovation, thereby weakening the technology-driven effects of carbon reduction policies and creating a counterproductive incentive mechanism characterized by “high tax rates, low innovation, weak abatement”. This dual transmission mechanism reveals diminishing marginal effects in carbon tax policies, necessitating a dynamic equilibrium between environmental benefits and economic efficiency.
5.3.3 Comparison of the policy effects between carbon reduction credit and carbon tax
This section will visually demonstrate the deviation direction from steady-state of key macroeconomic indicators—output, carbon emissions, and types of green intermediate goods—under carbon reduction credit shock and carbon tax shock, as shown in Table 4.
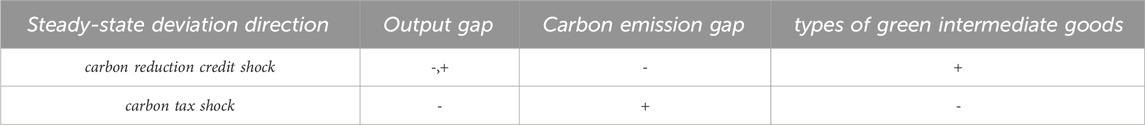
Table 4. The steady-state deviation direction of the main endogenous variables.
Table 4 shows that observations of the steady-state deviation direction of key macroeconomic indicators under carbon reduction credit shock reveal that the long-term steady-state deviation direction of the output gap aligns with the impulse response direction of the types of green intermediate goods. The steady-state deviation direction of the carbon emissions gap runs counter to the impulse response direction of the types of green intermediate goods. These findings demonstrate that green technology innovation serves as a critical pathway through which carbon reduction credit facilitate both output growth and carbon emission reduction.
Observations on the steady-state deviation directions of key macroeconomic indicators under a carbon tax shock show that the steady-state deviation direction of the output gap is opposite to the impulse response direction of the types of green intermediate goods. The steady-state deviation direction of the carbon emissions gap aligns with the impulse response direction of the types of green intermediate goods. The findings indicate that the carbon tax cannot achieve both output growth promotion and carbon emission reduction through promoting green technology innovation.
The research findings above indicate that carbon tax is less effective than implementing carbon reduction credit in promoting green technology innovation to achieve carbon reduction and steady economic growth. This provides a theoretical basis for China’s current adoption of low-carbon loan policies over carbon tax.
5.4 Impact of monetary policy on carbon reduction credit
The interest rate transmission mechanism is a key channel for the implementation of the central bank’s monetary policy and is deeply rooted in the core operations of commercial banks. As a result, the execution of monetary policy inevitably influences the effectiveness of commercial banks’ carbon reduction credit. Building on this principle, this section simulates the impact of changes in the intensity of monetary policy adjustments on the effectiveness of carbon reduction credit in promoting green technology innovation, stabilizing economic growth, and reducing carbon emissions. The simulation results are presented in Table 5.
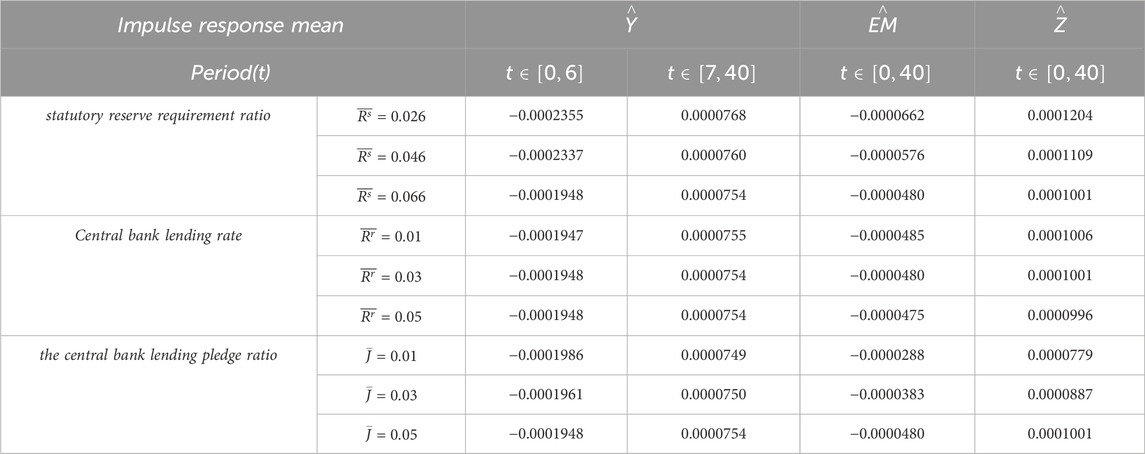
Table 5. The impact of monetary policy changes on the carbon reduction credit.
Table 5 shows that adjustments in monetary policy intensity does not alter the fundamental trends in the impulse responses of the output gap, carbon emission gap, and the types of green patent intermediate goods gap under the carbon reduction credit shock. Specifically, the impact on output retains its nonlinear characteristic of initially suppressing and later boosting growth, while carbon emissions continues to experience a sustained negative effect, and the types of green patent intermediate goods maintains a consistently positive response. The only change observed is in the magnitude of these responses, which demonstrates that the interest rate mechanism, as a critical channel for both the carbon reduction credit and monetary policy transmission, ensures the basic stability of the carbon reduction credit transmission mechanism even as monetary policy intensity varies.
From the perspective of changes in monetary policy intensity, lowering the statutory reserve requirement ratio and the central bank lending rate all can strengthen the positive incentive effect of the carbon reduction credit on green patent intermediate goods, thereby promoting green technology innovation and enhancing the policy’s effectiveness in reducing carbon emissions. However, it can also amplify the long-term stabilizing impact of carbon reduction credit on economic growth, contributing to higher output levels in the long run. The above results show that implementing an loose monetary policy by lowering statutory reserve requirement ratio creates a synergistic effect with carbon reduction credit. Lowering the central bank lending pledge ratio would weaken the positive effects of the policy in stabilizing economic growth, reducing carbon emissions, and stimulating green technology innovation. It reveals a policy conflict between reducing the central bank lending pledge ratio and the carbon reduction credit.
5.5 Impact of fiscal policy on carbon reduction credit
Fiscal policies directly influence aggregate demand, which in turn have a profound impact on output levels, carbon emissions, and the types of green patent intermediate goods. The chain reactions will undoubtedly play a significant role in the effective implementation of carbon reduction credit. To this end, this section conducts an in-depth simulation of the specific effects of fiscal policies with varying intensities on the effectiveness of carbon reduction credit in promoting green technology innovation, ensuring stabilizing economic growth, and achieving carbon reduction goals. The simulation results are detailed in Table 6.
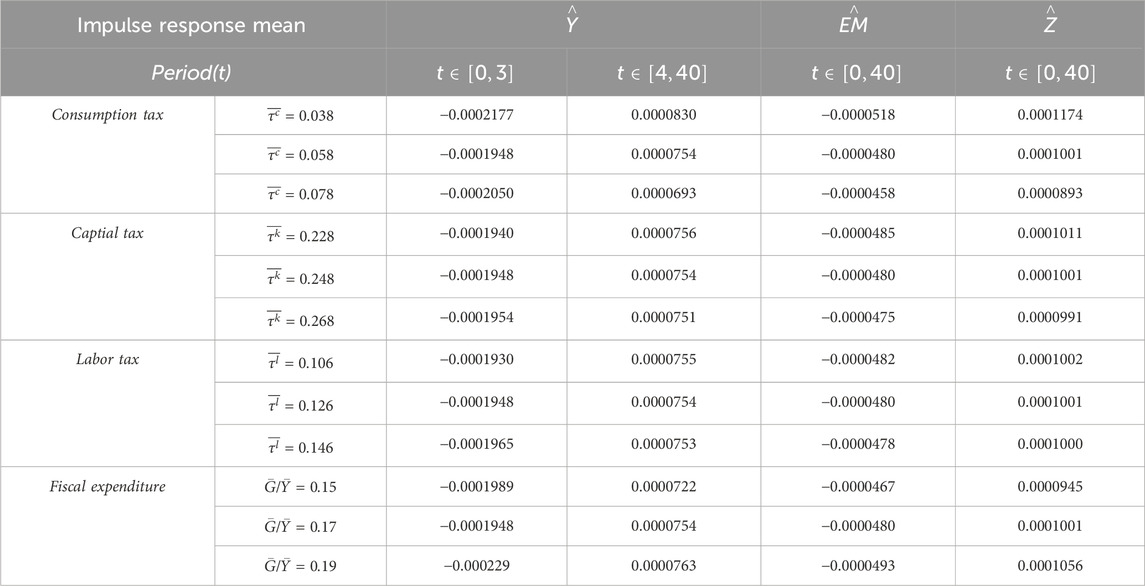
Table 6. The impact of fiscal policy changes on the carbon reduction credit.
Table 6 shows that adjusting the intensity of fiscal policy intensity does not alter the fundamental trends in the impulse responses of the output gap, carbon emission gap, and the types of green patent intermediate goods gap under the carbon reduction credit shock. Specifically, the impact on output retains its nonlinear characteristic of initially decreasing and later increasing, while carbon emissions continues to be suppressed, and the types of green patent intermediates maintains a consistently positive response. The only change observed is in the magnitude of these responses, which indicates that the transmission mechanism of the carbon reduction credit remains stable even as fiscal policy intensity varies.
From the perspective of changes in fiscal policy intensity, on the one hand, tax reduction are implemented by lowering consumption tax, capital tax, and labor tax rates, and on the other hand, fiscal expenditure on consumption is increased. Both measures significantly enhance the positive incentive effect of carbon reduction credit on the types of green patent intermediates, thereby accelerating green technology innovation and improving the effectiveness in reducing carbon emissions. Additionally, these measures strengthen the long-term stable role of carbon reduction credit in supporting economic growth, contributing to sustained improvements in output levels, which demonstrates that fiscal policies involving tax cuts and expanded fiscal expenditure complement carbon reduction credit and enhance its overall implementation effectiveness.
5.6 Analysis of the policy combinations
To thoroughly examine the differences between the comprehensive effects of coordinated macroeconomic policies and carbon reduction credit versus the effects of single policy implementation, we conduct the following policy combinations for simulation: “carbon reduction credit and tax cuts”, “carbon reduction credit and fiscal expenditure expansion”, “carbon reduction credit and loose monetary policy”, and “carbon reduction credit and full mix of policy tools”. We first analyze the individual effects of tax cuts, fiscal expenditure expansion, loose monetary policy, and the comprehensive application of all policy tools, as shown in Figure 8.
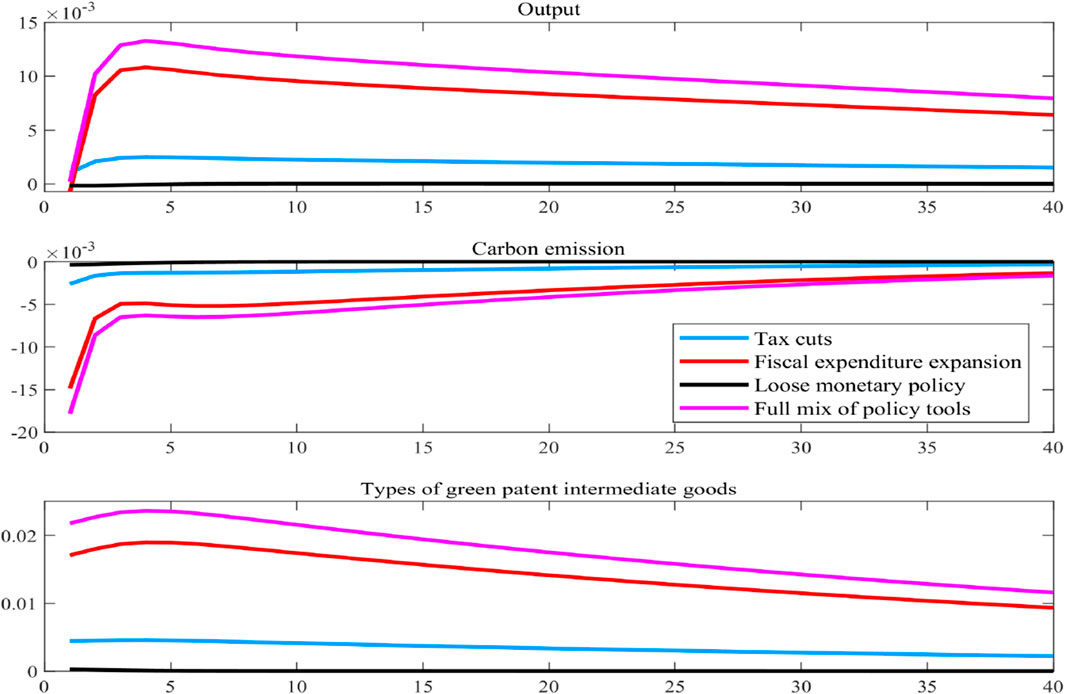
Figure 8. Comparing the policy effects of different macroeconomic policy combinations.
Figure 7 shows that four different macroeconomic policy combinations all can enhance green technology innovation, and thus they all contribute to promoting carbon emission reduction. However, different macroeconomic policy combinations have varied effects on output. Tax cuts consistently boost output throughout the simulation period. Fiscal expenditure expansion may cause some output loss in the initial period but significantly enhances output thereafter. Monetary policy combination may exert negative effects on output for approximately 6 periods, followed by positive impacts. The full mix of policy tools generate persistently positive output effects during the entire simulation period, outperforming any single policy.
Macroeconomic policies demonstrate significant advantages in fostering green technology innovation, stabilizing economic growth and driving carbon emission reduction. Figure 9 shows the synergistic enhancement effect of carbon reduction credit and macroeconomic policy combinations on overall effectiveness.
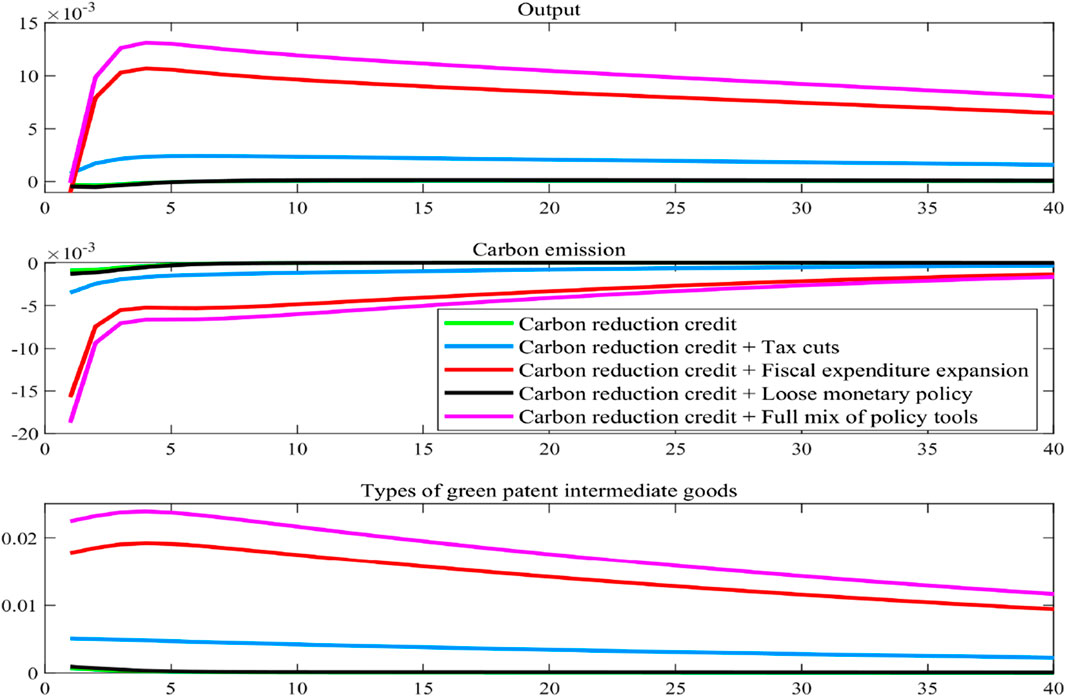
Figure 9. Comparing the policy effects of carbon reduction credit when implemented alongside different macroeconomic policy combinations.
Figure 9 indicates that carbon reduction credit exhibits synergistic effects with four types of macroeconomic policy combinations in promoting green technology innovation and achieving carbon reduction goals. However, the impact mechanisms of different policy combinations on economic output demonstrate significant heterogeneity.
In promoting green technology innovation and carbon emission reduction, when implemented in synergy with four types of macroeconomic policy combinations, carbon reduction credit produces a compounding effect (1 + 1>2) in promoting green technology innovation compared to their standalone implementation, ultimately resulting in more substantial carbon reduction outcomes. This synergistic effect primarily stems from functional complementarity among policy combinations: carbon reduction credit provides targeted funding support, while macroeconomic policies optimize resource allocation through macro-level adjustments. Together, they establish a “funding guidance—technological breakthrough—emission reduction achievement” transmission chain.
At the output effect level, different policy combinations exhibit distinct dynamic impact pathways: Tax cuts generate an immediate compensatory effect by lowering the tax burden on enterprises. This effectively offsets potential output fluctuations in the early stages of implementing carbon reduction credit while also stimulating market vitality to foster long-term growth momentum. This approach thus addresses the dual objectives of balancing short-term and long-term output. Fiscal expenditure expansion displays a phased characteristic. Initially, it exacerbates output fluctuations. However, starting from the second period of implementation, the output loss caused by carbon reduction credit is counteracted by the fiscal expenditure expansion. Furthermore, the full mix of policy tools generate a synergistic force that significantly enhances output levels in the long run. Loose monetary policy exacerbates the output loss caused by carbon reduction credit within the first 6 periods. From the seventh period onwards, however, the two policies begin to form a synergistic force that promotes higher output levels. The full combination of macroeconomic policy tools leverages multi-dimensional adjustment mechanisms. It harnesses the immediate stabilizing function of tax reduction, integrates the guiding role of fiscal expenditure expansion, and utilizes the aggregate adjustment advantages of monetary policy. This integrated approach effectively balances the objectives of both short-term and long-term output.
In terms of the overall effectiveness in achieving stabilizing long-term economic growth, reducing carbon emissions, and advancing green technology innovation, the combination of carbon reduction credit and full mix of policy tools delivered the strongest effect, followed by the combination with fiscal expenditure expansion, then the combination with tax cuts, and finally with loose monetary policy.
6 Social welfare analysis
In this section, we analyze the impact of varying intensities of carbon reduction credit and the interplay of policy coordination on social welfare. To achieve this, we employ the concept of Consumption Compensation Change (CCV) to systematically compare and evaluate welfare outcomes across distinct policy scenarios (Lester, et al., 2014). Compensation changes do not involve a direct comparison of lifetime utility between models with differing policies but instead quantify welfare differences at the consumption level. Specifically, the Consumption Compensation Change (CCV) measures the compensation required in terms of consumption to align the lifetime utility of households under one policy framework with that of another.
Under policy scenario
Where
The analytical expression of the conditional consumption compensation change is
The social welfare compensation effect of changes in the parameters related to carbon reduction credit is shown in Figure 10.
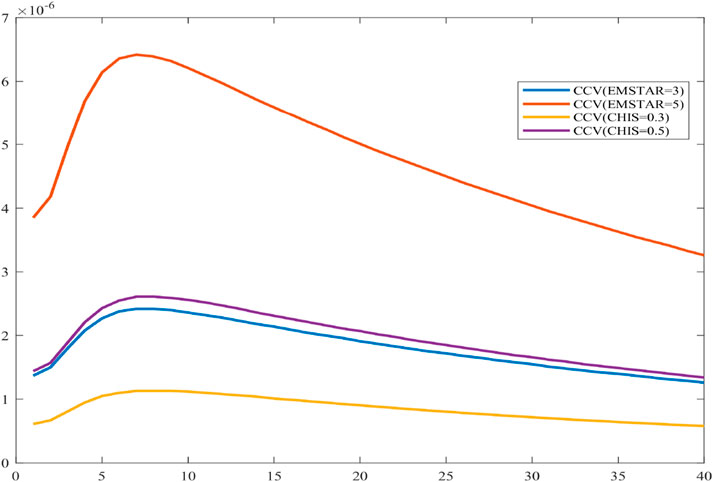
Figure 10. Impact on social welfare compensation effect of changes in parameters related to carbon reduction credit.
Figure 10 shows that when the threshold carbon emission level is set to 3 and 5, both values are above the baseline scenario’s threshold of 1. In this case, the CCV curve exhibits positive values, indicating that, compared to the baseline scenario, the higher threshold carbon emission levels does not create a demand for consumption compensation. Furthermore, as the threshold carbon emission level rises from 1 to 5, the CCV curve’s value also increases. Simulation Results shows that higher threshold carbon emission levels lead to improved social welfare. In other words, a higher threshold carbon emission level can enhance social welfare or reduce the need for consumption compensation.
When the steady-state value of interest reduction coefficient for carbon reduction credit is set to 0.3 and 0.5, both values exceed the baseline scenario’s value of 0.1, which means the CCV curve displays positive values, indicating that, compared to the baseline scenario, a higher interest reduction coefficient for carbon reduction credit results in increased social welfare or consumption benefits. Further analysis reveals that as the steady-state value of interest reduction coefficient for carbon reduction credit rises from 0.1 to 0.5, the CCV curve’s value also increases, which demonstrates that a higher steady-state value of interest reduction coefficient for carbon reduction credit further enhances the level of social welfare.
Next, we will further analyze the social welfare compensation effects of carbon reduction credit and macroeconomic policy combinations, as shown in Figure 11.
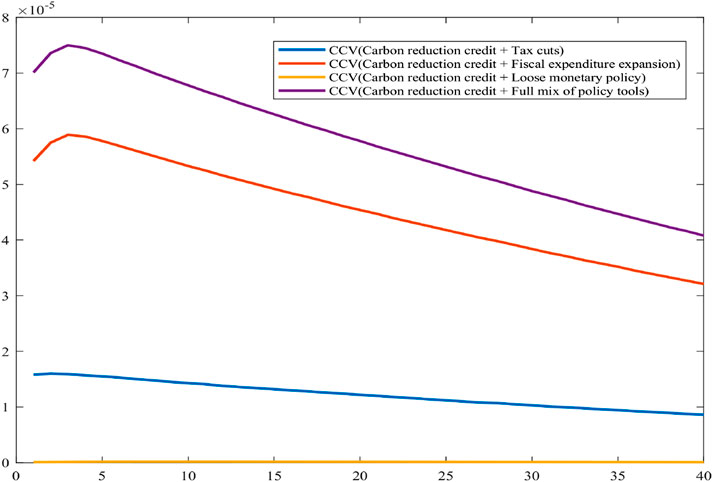
Figure 11. Impact on social welfare compensation effects of carbon reduction credit and macroeconomic policy combinations.
Figure 11 shows that when carbon reduction credit is implemented alongside four types of macroeconomic policy combinations, the resulting social welfare gains substantially exceed those achieved through its individual implementation, which is evidenced by the consumption compensation curve (CCV) remaining in the positive region under these combined policy scenarios. From the perspective of the relative size of social welfare brought about by policy combinations, the combination of carbon emission reduction credit and full mix of policy tools combined has the strongest effect, followed by the combination of fiscal expenditure expansion, then the combination of tax cuts, and finally the loose monetary policy. Policy combinations aim to better balance the multiple objectives of stabilizing economic growth, carbon emission reduction, and the maximization of social welfare, thereby ensuring that overall societal welfare is maintained while advancing green transformation.
7 Discussions and conclusions
7.1 Discussions
China’s strategy for green, high-quality development requires the coordinated advancement of economic growth and ecological environmental protection. As the central driving force for achieving this strategic goal, the importance of green technology innovation is becoming increasingly prominent. Against the dual constraints of the “dual carbon” goals (carbon peak and carbon neutrality) and the requirements of stabilizing economic growth, how to innovate policy instruments to build enabling mechanisms—ensuring sustained economic growth momentum while meeting carbon reduction targets—has emerged as a critical strategic task urgently needing to be addressed in the new era of ecological civilization advancement.
To precisely align with national strategic objectives, this paper constructs an E-DSGE model analytical framework incorporating dual-track policy instruments. It innovatively integrates traditional carbon pricing mechanisms (carbon tax) with novel green finance tools (carbon reduction credit) into a unified research system. This framework systematically examines the differential incentive effects of these two policy instruments on green technology innovation, as well as their divergent impacts—mediated through innovation transmission mechanisms—on carbon reduction targets and stable economic growth. The study aims to provide micro-level mechanistic support and macro-level decision-making references for building a carbon peak and carbon neutrality policy toolkit.
Research findings indicate that within an E-DSGE model endogenizing the process of green technology innovation, traditional carbon taxation—as a policy tool for emissions reduction—demonstrates limited effectiveness in curbing carbon emissions. This outcome diverges from the conclusions of Chan (2020a) and Chan (2020b). Theoretically, this discrepancy arises primarily because the relationship between carbon taxation and green technology innovation aligns more closely with the neoclassical “follow-the-cost” hypothesis than with the “Porter hypothesis”. The imposition of carbon taxes constrains the development of green technology innovation activities, thereby generating negative impacts on both carbon reduction and stable economic growth.
In contrast, the innovative carbon reduction instrument—carbon reduction credit—can significantly drive green technology innovation, thereby more effectively promoting carbon emission reduction and advancing the “dual carbon” goals. Although the implementation of carbon reduction loans may exert a certain crowding-out effect on short-term output, it is highly beneficial for long-term output growth. Furthermore, carbon reduction credit can form positive interactions with proactive fiscal policies and loose monetary policies. The coordination among these policies can simultaneously achieve multiple goals, including carbon emission reductions, sustained economic growth and improvements in social welfare.
This paper achieves two major methodological breakthroughs within an E-DSGE framework: First, by endogenizing the green technology innovation mechanism, it embeds this mechanism deeply into the production functions and carbon emission functions of the enterprise sector. This constructs a bidirectional dynamic linkage between technological progress and the economic-environmental system, more accurately reflecting the complex coupling characteristics of real economic systems compared to traditional exogenous settings. Second, it innovatively integrates carbon tax policies and the carbon reduction credit financial instrument within a unified analytical paradigm. This overcomes the limitation of existing studies that often focus on single-policy evaluation, ensuring both baseline consistency for policy comparison and providing a theoretical vehicle for exploring multidimensional policy synergies. This dual innovation not only enhances the model’s capacity to characterize real-world economic mechanisms but also significantly improves the explanatory power and decision-making relevance of policy simulations. Consequently, the research findings possess enhanced innovativeness and reliability compared to existing literature.
7.2 Conclusions and suggestions
This paper establishes an E-DSGE model framework incorporating dual-track policy instruments, innovatively integrating the traditional carbon pricing mechanism (carbon tax) with the novel green finance instrument (carbon reduction credit) into a unified research system. By utilizing quarterly macroeconomic data from China for precise calibration and estimation, we employ impulse response analysis to simulate the actual effects of the carbon tax and the carbon reduction loan. The main research findings are summarized below.
First, carbon reduction credit can unleash a triple dividend: incentivizing green technology innovation, strengthening carbon emission constraints, and empowering stable long-term economic growth. The effectiveness of this policy is influenced by the threshold carbon emission level and the interest rate reduction coefficient of carbon reduction credit. Research indicates that raising the threshold carbon emission level and the interest rate reduction coefficient of carbon reduction credit can achieve compound benefits, including accelerated output growth, expanded emission reduction, and diversified expansion of the green patent technology spectrum. However, vigilance is required against its potential short-term suppressive effect on output. Policy design must incorporate considerations for managing transitional adjustment periods.
Second, given that the carbon tax policy exhibits an inhibiting effect on green technology innovation, it has failed to effectively drive either the achievement of carbon reduction goals or the enhancement of economic growth stability. Even within a robustness testing framework involving adjustments to carbon tax rates, this core conclusion remains robust and significant.
Third, fiscal and monetary policies significantly moderate the effectiveness of carbon reduction credit. Specifically, reducing consumption taxes, capital taxes, and labor tax burdens, or implementing fiscal expenditure expansion, can markedly enhance the incentive effect of carbon reduction credit on green technology innovation. This accelerates breakthroughs in low-carbon technologies, thereby strengthening both carbon reduction efficacy and long-term economic growth momentum. On the monetary policy front, central bank policies such as lowering the statutory reserve requirement ratio and central bank lending rate produce effects similar to those of expansionary fiscal policies. However, reducing the central bank lending pledge ratio yields the opposite effect compared to expansionary fiscal policy. Furthermore, compared to implementing carbon reduction credit alone, combining them with macroeconomic policies generates a stronger technological advancement effect. This synergistic mechanism not only significantly increases the rate of green technology innovation but also amplifies carbon reduction outcomes through technological iteration. Ultimately, it establishes a dual virtuous cycle of environmental benefits and economic output.
Fourth, carbon reduction credit exerts a significant impact on social welfare. By scientifically setting the threshold carbon emission level and the interest rate reduction coefficient of carbon reduction credit, social welfare levels can be effectively enhanced. When this policy synergizes with expansionary macroeconomic policies, the welfare improvement effect is further amplified. To achieve the dual policy objectives of economic growth and carbon emission reduction, while ensuring social welfare undergoes “Pareto improvement”, it is recommended to appropriately align the carbon-reduction loan mechanism with proactive fiscal policies and loose monetary policies, thereby constructing a policy implementation framework.
Based on the above research conclusions, we have obtained the following policy recommendations.
First, China’s carbon reduction policy toolbox should establish a dual-core driving mechanism centered on carbon market trading and carbon reduction credit. The carbon market creates market-based constraints through carbon emission pricing, utilizing allowance allocation and trading mechanisms to optimize resource allocation and compel enterprises to upgrade their technologies. Carbon reduction credit, as a financial innovation tool, lower financing costs for low-carbon enterprises through differentiated credit policies, precisely incentivizing carbon reduction behaviors. The synergy between them can create a “market + finance” policy mix: the carbon market provides benchmark price signals, while carbon reduction credit channel funds directionally. Together with policies like environmental tax and green finance, they form a comprehensive policy toolbox. This framework not only leverages the decisive role of the market but also amplifies policy effectiveness through financial leverage, providing sustainable institutional safeguards for the low-carbon transition of the real economy.
Second, To effectively advance the implementation of carbon reduction credit, financial regulatory authorities should leverage corporate carbon account rating reports provided by regional credit reporting platforms and deeply integrate these reports into commercial banks’ credit approval, loan pricing, and risk management processes. For enterprises demonstrating outstanding performance in carbon emission reduction, commercial banks should offer significantly differentiated preferential policies, such as lower interest rates, extended loan terms, increased loan amounts, and flexible collateral options.
Third, under the multidimensional policy objectives of coordinating economic growth stabilization, carbon emission reduction, and social welfare enhancement, the government should focus on building a synergistic governance system combining “carbon reduction credit + macroeconomic policies”. Specifically, it is necessary to further expand the application scope of carbon reduction loans and deepen their operational mechanisms, using differentiated credit support to precisely guide industrial green transformation. Simultaneously, proactive fiscal policies should be steered toward low-carbon sectors, leveraging tools such as tax incentives and special subsidies to activate market entities’ motivation for emission reduction. This should be complemented by prudent monetary policies to maintain reasonably ample liquidity, providing low-cost funding guarantees for green projects. This trilateral coordination of fiscal-monetary-credit policies will consolidate the foundation for economic growth while ensuring carbon reduction targets progress steadily according to schedule.
Fourth, firms sector should proactively integrate into the national green transition strategy by deepening the effectiveness of carbon reduction credit through the following pathways: On one hand, leverage policy-backed low-interest loans to accelerate the deployment of clean energy, energy conservation, environmental protection, carbon capture technologies, and R&D, building a synergistic innovation ecosystem that integrates technology, finance, and industry. On the other hand, incorporate carbon reduction targets into corporate strategic planning. Achieve low-carbon restructuring of production processes through digital transformation, and enhance ESG performance by adopting green certification systems.
In future research, we propose to simultaneously incorporate carbon trading policies, carbon reduction credit, and multiple types of government carbon reduction subsidies within a unified framework, to further investigate the interactive and combined effects of these policy instruments.
Data availability statement
The original contributions presented in the study are included in the article/supplementary material, further inquiries can be directed to the corresponding author.
Author contributions
CB: Data curation, Formal Analysis, Methodology, Visualization, Writing – original draft, Writing – review and editing. ZC: Supervision, Writing – review and editing. ZF: Data curation, Writing – review and editing. YT: Data curation, Writing – review and editing.
Funding
The author(s) declare that no financial support was received for the research and/or publication of this article.
Conflict of interest
The authors declare that the research was conducted in the absence of any commercial or financial relationships that could be construed as a potential conflict of interest.
Generative AI statement
The author(s) declare that no Generative AI was used in the creation of this manuscript.
Publisher’s note
All claims expressed in this article are solely those of the authors and do not necessarily represent those of their affiliated organizations, or those of the publisher, the editors and the reviewers. Any product that may be evaluated in this article, or claim that may be made by its manufacturer, is not guaranteed or endorsed by the publisher.
References
Adanma, U. M., and Ogunbiyi, E. O. (2024). A comparative review of global environmental policies for promoting sustainable development and economic growth. Int. J. Appl. Res. Soc. Sci. 6 (5), 954–977. doi:10.51594/ijarss.v6i5.1147
Annicchiarico, B., and Di Dio, F. (2015). Environmental policy and macroeconomic dynamics in a new keynesian model. J. Environ. Econ. Manag. 69, 1–21. doi:10.1016/j.jeem.2014.10.002
Bian, C., Chu, Z. P., and Sun, Z. L. (2024). How to find a balance between “Dual Carbon” goals and macroeconomic goals? East China Econ. Manag. 38 (3), 58–73. doi:10.19629/j.cnki.34-1014/f.230822015
Bian, Z. C., Zhao, L., and Ding, H. (2019). Transformation of China's monetary policy regulatory Framework,Nonlinear change of fiscal multipliers and the choice of fiscal tools in china’s new era. Econ. Res. J. 54 (9), 56–72.
Chai, S., Zhang, K., Wei, W., Ma, W., and Abedin, M. Z. (2022). The impact of green credit policy on enterprises’ financing behavior: evidence from Chinese heavily-polluting listed companies. J. Clean. Prod. 363, 132458. doi:10.1016/j.jclepro.2022.132458
Chan, Y. T. (2020a). Collaborative optimal carbon tax rate under economic and energy price shocks: a dynamic stochastic general equilibrium model approach. J. Clean. Prod. 256, 120452. doi:10.1016/j.jclepro.2020.120452
Chan, Y. T. (2020b). Are macroeconomic policies better in curbing air pollution than environmental policies? A DSGE approach with carbon-dependent fiscal and monetary policies. Energy Policy 141, Article 111454. doi:10.1016/j.enpol.2020.111454
Chan, Y. T., Punzi, M. T., and Zhao, H. (2024). Green transition and financial stability: the role of green monetary and macroprudential policies and vouchers. Energy Econ. 132, 107449. doi:10.1016/j.eneco.2024.107449
Chen, L. F., Li, J. J., and Zhang, K. X. (2022b). Should monetary policy aim to support economic growth: a NK-DSGE framework with endogenous growth. J. Huazhong Univ. Sci. Technol. Sci. Ed. 36 (1), 84–93. doi:10.19648/j.cnki.jhustss1980.2022.01.10
Chen, Z. G., Zhang, Y. Q., Wang, H. S., Ouyang, X., and Xie, Y. X. (2022a). Can green credit policy promote low-carbon technology innovation? J. Clean. Prod. 359, 132061. doi:10.1016/j.jclepro.2022.132061
Cheng, G., Zhao, C., Iqbal, N., Gülmez, Ö., Işik, H., and Kirikkaleli, D. (2021). Does energy productivity and public-private investment in energy achieve carbon neutrality target of China? J. Environ. Manag. 298, 113464. doi:10.1016/j.jenvman.2021.113464
Christiano, L. J., Roberto, M., and Massimo, R. (2014). Risk shocks. Am. Econ. Rev. 104 (1), 27–65. doi:10.1257/aer.104.1.27
Christiano, L. J., Trabandt, M., and Walentin, K. (2010). DSGE models for monetary policy analysis. Handb. Monetary Econ. 3, 285–367. doi:10.1016/B978-0-444-53238-1.00007-7
Diaz, D., and Moore, F. (2017). Quantifying the economic risks of climate change. Nat. Clim. Change 7 (11), 774–782. doi:10.1038/NCLIMATE3411
Fan, H., Peng, Y., Wang, H., and Xu, Z. (2021). Greening through finance? J. Dev. Econ. 152, 102683. doi:10.1016/j.jdeveco.2021.102683
Fan, L., Peng, B. B., Lin, Z. G., Zou, H. Y., and Du, H. B. (2024). The effects of green finance on pollution and carbon reduction: evidence from China’s industrial firms. Int. Rev. Econ. Finance 95, 103490. doi:10.1016/j.iref.2024.103490
Fischer, C., and Springborn, M. (2011). Emissions targets and the real business cycle: intensity targets versus caps or taxes. J. Environ. Econ. Manag. 62 (3), 352–366. doi:10.1016/j.jeem.2011.04.005
Galí, J. (2008). Monetary policy, inflation, and the business cycle: an introduction to the new keynesian framework and its applications. Princeton University Press.
Ghosh, B., Gubareva, M., Zulfiqar, N., and Bossman, A. (2024). Is there a nexus between NFT, DeFi and carbon allowances during extreme events? China Finance Rev. Int. 14 (3), 456–479. doi:10.1108/cfri-03-2023-0057
Gu, B., Chen, F., and Zhang, K. (2021). The policy effect of green finance in promoting industrial transformation and upgrading efficiency in China: analysis from the perspective of government regulation and public environmental demands. Environ. Sci. Pollut. Res. 28 (34), 47474–47491. doi:10.1007/s11356-021-13944-0
Han, Y. W., and Li, J. (2022). Should investors include green bonds in their portfolios? Evidence for the USA and Europe. Int. Rev. Financial Analysis 80, 101998. doi:10.1016/j.irfa.2021.101998
Heutel, G. (2012). How should environmental policy respond to business cycles? Optimal policy under persistent productivity shocks. Rev. Econ. Dyn. 15 (2), 244–264. doi:10.1016/j.red.2011.05.002
Irfan, M., Razzaq, A., Sharif, A., and Yang, X. (2022). Influence mechanism between green finance and green innovation: exploring regional policy intervention effects in China. Technol. Forecast. Soc. Change 182, 121882. doi:10.1016/j.techfore.2022.121882
Jin, X., Wang, L., Xie, Q., Li, Y., and Liang, L. (2024). Taxing for a green future: how china’ s environmental protection tax law drives energy efficiency. Int. J. Environ. Res. 18 (2), 33. doi:10.1007/s41742-024-00584-8
Kung, H., and Schmid, L. (2015). Innovation, growth, and asset prices. J. Finance 70 (3), 1001–1037. doi:10.1111/jofi.12241
Lai, J. M., Liu, X., and Yuan, L. (2024). Can green credit policy increase corporate pollution abatement efforts? Evidence from China. Int. Rev. Econ. Finance 93, 797–813. doi:10.1016/j.iref.2024.05.026
Lee, C. C., and Lee, C. C. (2022). How does green finance affect green total factor productivity? Evidence from China. Energy Econ. 107, 105863. doi:10.1016/j.eneco.2022.105863
Lei, H., Gao, R. Y., Ning, C. T., and Sun, G. L. (2025). Green finance and corporate green innovation. Finance Res. Lett. 72, 106577. doi:10.1016/j.frl.2024.106577
Lester, R., Pries, M., and Sims, E. (2014). Volatility and welfare. J. Econ. Dyn. Control 38, 17–36. doi:10.1016/j.jedc.2013.08.012
Lin, B. Q., and Ma, R. Y. (2021). Green technology innovations, urban innovation environment and CO2 emission reduction in China: fresh evidence from a partially linear functional-coefficient panel model. Technol. Forecast. Soc. Change 176, 121434. doi:10.1016/j.techfore.2021.121434
Liu, F. Y., Xia, Z. M., and Lee, C. C. (2024). Does green credit benefit the clean energy technological innovation and how? The policy catering behavior of enterprises. J. Clean. Prod. 444, 141256. doi:10.1016/j.jclepro.2024.141256
Liu, H. Y., Liu, Z. X., Zhang, C. H., and Li, T. Y. (2023b). Transformational insurance and green credit incentive policies as financial mechanisms for green energy transitions and low-carbon economic development. Energy Econ. 126, 107016. doi:10.1016/j.eneco.2023.107016
Liu, L., and He, L. Y. (2021). Output and welfare effect of green credit in China: evidence from an estimated DSGE model. J. Clean. Prod. 294, 126326. doi:10.1016/j.jclepro.2021.126326
Liu, N., Yao, X., Wan, F., and Han, Y. (2023a). Are tax revenue recycling schemes based on industry-differentiated carbon tax conducive to realizing the “double dividend”. Energy Econ. 124, 106814. doi:10.1016/j.eneco.2023.106814
Lu, X., Cheng, L., and Niu, Y. (2025). Environmental protection tax and trade credit: evidence from China. Int. Rev. Finance 25. doi:10.1111/irfi.12460
Lv, C. C., Fan, J. F., and Lee, C. C. (2023). Can green credit policies improve corporate green production efficiency? J. Clean. Prod. 397, 136573. doi:10.1016/j.jclepro.2023.136573
Ma, L., and Li, D. N. (2024). Would macroeconomic policy promote green and low-carbon transformation of energy companies? Int. Rev. Financial Analysis 96, Article 103791. doi:10.1016/j.irfa.2024.103791
Ma, Z. Y., Wang, J. B., and Xiao, Z. H. (2024). Green credit, uncertainty and corporate pollution emissions. Appl. Econ. 56 (57), 7757–7776. doi:10.1080/00036846.2023.2288053
Mamun, M. A., Boubaker, S., and Nguyen, D. K. (2022). Green finance and decarbonization: evidence from around the world. Finance Res. Lett. 46, 102807. doi:10.1016/j.frl.2022.102807
Mohsin, M., Taghizadeh-Hesary, F., Panthamit, N., Anwar, S., Abbas, Q., and Vo, X. V. (2021). Developing low carbon finance index: evidence from developed and developing economies. Finance Res. Lett. 43, Article 101520. doi:10.1016/j.frl.2020.101520
Omri, H., Jarraya, B., and Kahia, M. (2025). Green finance for achieving environmental sustainability in G7 countries: effects and transmission channels. Res. Int. Bus. Finance 74, Article 102691. doi:10.1016/j.ribaf.2024.102691
Pei, Y., Hao, R. X., Cai, Z. F., Sun, Y. P., and Zhang, X. Y. (2022). Does emission trading system achieve the win-win of carbon emission reduction and financial performance improvement? —evidence from Chinese A-share listed enterprises in industrial sector. J. Clean. Prod. 333. doi:10.1016/j.jclepro.2021.130121
Sharif, A., Kocak, S., Khan, H. H. A., Uzuner, G., and Tiwari, S. (2023). Demystifying the links between green technology innovation, economic growth, and environmental tax in ASEAN-6 countries: the dynamic role of green energy and green investment. Gondwana Res. 115, 98–106. doi:10.1016/j.gr.2022.11.010
Wang, M. Y., Li, Y. M., Li, J. Q., and Wang, Z. T. (2021). Green process innovation, green product innovation and its economic performance improvement paths: a survey and structural model. J. Environ. Manag. 297, 113282. doi:10.1016/j.jenvman.2021.113282
Wang, W. F., Wang, Z. Q., and Guo, L. Y. (2020). Fiscal decentralization and china’s unbalanced economic structure. Econ. Res. J. 55 (5), 49–65.
Wang, X., Wang, S., Wu, K., Zhai, C., and Li, Y. (2024). Environmental protection tax and enterprises’ green technology innovation: evidence from China. Int. Rev. Econ. and Finance 96, 103617. doi:10.1016/j.iref.2024.103617
Wang, Y. (2025). Greenwashing or green evolution: can transition finance empower green innovation in carbon-intensive enterprise? Int. Rev. Financial Analysis 97, 103826. doi:10.1016/j.irfa.2024.103826
Wang, Y., Pan, D. Y., and Peng, Y. C. (2019). China’s incentive policies for green loans: a DSGE approach. J. Financial Res. 11, 1–18.
Xiao, B. W., Fan, Y., and Guo, X. D. (2018). Exploring the macroeconomic fluctuations under different environmental policies in China: a DSGE approach. Energy Econ. 76, 439–456. doi:10.1016/j.eneco.2018.10.028
Xiao, B. W., Fan, Y., and Guo, X. D. (2021). Dynamic interactive effect and co-design of SO2 emission tax and CO2 emission trading scheme. Energy Policy 152, 112212. doi:10.1016/j.enpol.2021.112212
Xiao, B. W., Guo, X. D., Yu, X., Jia, C., Chen, Z., and Geng, W. X. (2024). Evaluating and optimizing environmental tax, carbon trading scheme and renewable portfolio standard in China: an E-DSGE model. J. Environ. Manag. 370, 122727. doi:10.1016/j.jenvman.2024.122727
Xin, B. G., Jiang, K., and Gonzalez, E. D. R. S. (2024). The coevolution effect of central bank digital currency and green bonds on the net-zero economy. Energy Econ. 134, 107587. doi:10.1016/j.eneco.2024.107587
Xu, B., and Lin, B. Q. (2025). Green credit and green technology innovation: impact mechanism and nonlinear effect test. Environ. Impact Assess. Rev. 110, 107652. doi:10.1016/j.eiar.2024.107652
Xu, P., Ye, P. H., Jahanger, A., Huang, S. W., and Zhao, F. (2023). Can green credit policy reduce corporate carbon emission intensity: evidence from China's listed firms. Corp. Soc. Responsib. Environ. Manag. 30 (5), 2623–2638. doi:10.1002/csr.2506
Xu, X., and Li, J. (2020). Asymmetric impacts of the policy and development of green credit on the debt financing cost and maturity of different types of enterprises in China. J. Clean. Prod. 264, Article 121574. doi:10.1016/j.jclepro.2020.121574
Yu, M., Zhou, Q., Cheok, M. Y., Kubiczek, J., and Iqbal, N. (2022). Does green financeimprove energy efficiency? New evidence from developing and developed economies. Econ. Change Restruct. 55 (1), 485–509. doi:10.1007/s10644-021-09355-3
Zhang, S., Wu, Z., Wang, Y., and Hao, Y. (2021a). Fostering green development with green finance: an empirical study on the environmental effect of green credit policy in China. J. Environ. Manag. 296, 113159. doi:10.1016/J.JENVMAN.2021.113159
Zhang, S. L., Wu, Z. H., Wang, Y., and Hao, Y. (2021b). Fostering green development with green finance: an empirical study on the environmental effect of green credit policy in China. J. Environ. Manag. 296, 113159. doi:10.1016/j.jenvman.2021.113159
Keywords: carbon reduction credit, carbon tax, green technology innovation, stabilizing growth effect, carbon reduction effect
Citation: Bian C, Chen Z, Fan Z and Tan Y (2025) Can carbon reduction credit achieve the win-win of carbon emission reduction and stabilizing economic growth? E-DSGE simulation under the path of green technology innovation. Front. Environ. Sci. 13:1597027. doi: 10.3389/fenvs.2025.1597027
Received: 21 March 2025; Accepted: 16 June 2025;
Published: 30 June 2025.
Edited by:
Ibrahim Cutcu, Hasan Kalyoncu University, TürkiyeCopyright © 2025 Bian, Chen, Fan and Tan. This is an open-access article distributed under the terms of the Creative Commons Attribution License (CC BY). The use, distribution or reproduction in other forums is permitted, provided the original author(s) and the copyright owner(s) are credited and that the original publication in this journal is cited, in accordance with accepted academic practice. No use, distribution or reproduction is permitted which does not comply with these terms.
*Correspondence: Zongyi Chen, bWlsbHh1ZXNodUAxNjMuY29t