 Li Ma
Li Ma Tianzhi Huang1
- 1Engineering Research Center of Rural Environmental Protection and Green Low-carbon Development of Sichuan Province, Mianyang Normal University, Mianyang, China
- 2Yuexi ecological environment Bureau, Liangshan, China
Green development is key to promoting high-quality regional development. Chengdu Plain Economic Zone (CPEZ) stands as the primary area for the Chengdu-Chongqing twin-city economic circle. This study constructed an evaluation system for green development level, selecting 33 indicators from three dimensions: green environment, green lifestyle, and green economy. Through the application of the entropy-TOPSIS method, Pearson correlation analysis, and geographic detector, the green development level of the Chengdu Plain Economic Zone urban agglomeration from 2013 to 2022 was evaluated, as well as the coupling and coordination relationship of green development was analyzed, and the driving mechanism affecting the green development of the region was explored. The results show that: (1) The overall level of green development in the research area continues to improve from 2013 to 2022, with an average annual growth rate of 5.11%. There is spatial heterogeneity in the level of green development among cities. (2). The coupling coordinated development degree (CCD) has steadily improved, however, the overall region is still in a low-level stage of coupled coordinated development. Among them, Ziyang, Suining, Mianyang, and Ya’an exceeded the regional average level in 2015, 2017, 2018, and 2019 respectively, entering the stage of primary coupling and coordinated development. (3). The key driving factors for green development level include GDP electricity consumption, per capita length of water supply pipelines, percentage of added value of the secondary and tertiary industries to GDP, per capita water resources, and population density. The spatial differences in these indicators explain over 50% of the level of green development. To promote high-quality development of the CPEZ, three policy recommendations are proposed: Firstly, optimize green environmental governance. The second is to encourage the development of green technology innovation and circular economy. The third is to strengthen the coordinated development of regional economy, optimize the allocation of resource elements, enhance the radiation effect of urban agglomerations, and drive the integrated development of the CPEZ.
1 Introduction
Green development, as an economic growth model, emphasizes the importance of promoting economic progress while prioritizing environmental protection, resource efficiency, and social equity (Said and Dindar, 2024). Sustainability, as a core principle of the G20’s climate initiatives, emphasizes the need for integrated strategies that balance economic development, social inclusion, and environmental protection (Dadhich et al., 2025). As global economic growth patterns gradually transition, green development has become a core concept for achieving sustainable development in modern society (Deng et al., 2024).
In China, green development is a critical component of ecological civilization construction and an inevitable choice for achieving sustainable economic growth (Liang L. N. et al., 2023). Accelerate the comprehensive green transformation of economic and social development, improve the ecological governance system, promote ecological prioritization, resource conservation, and green low-carbon development, and foster harmonious coexistence between humans and nature. The country is committed to achieving high-quality, sustainable development through energy conservation, emission reduction, and enhanced environmental governance. The essence of green development lies in transforming and upgrading traditional industries into low-carbon, energy-efficient, and environmentally friendly economic systems (Zhao et al., 2020). Furthermore, the transition to green lifestyles and consumption patterns, along with advancements in green technologies, has played a crucial role in driving green development.
Foreign scholars have combined ecological footprint models with resource efficiency analysis in green development research, proposing a multidimensional evaluation system that covers resource consumption, environmental pollution, and social welfare (Gibbs and O' Neill, 2016). At the same time, it is emphasized that green finance promotes the implementation of green projects, improves the effective utilization of resources, and promotes the coordinated development of low-carbon technology innovation and green industries through the flow and allocation of funds (Amer and Kareem, 2025; Umar et al., 2024; Raman et al., 2025). Low-carbon development has become a crucial component of green development, with many studies incorporating indicators such as carbon emissions and energy structure into green development evaluation frameworks to promote green low-carbon transformation (Chen et al., 2024).
Domestic scholars often view green development from the perspective of ecological civilization, and have constructed a diversified evaluation system from multiple angles such as ecological environment, economic benefits, and social welfare (Liu Y. B. et al., 2022). Low-carbon development has become an important component of green development, and many studies have incorporated indicators such as carbon emissions, energy structure, and corporate green technology innovation into the green development assessment framework to promote green and low-carbon transformation (Chen et al., 2024). At the same time, environmental pollution control and optimizing industrial structure are also important foundations for achieving high-quality regional development (Liu Y. B. et al., 2022).
The research on measuring China’s green development level mainly focuses on the eastern coastal areas and the economically developed central regions (Yang et al., 2023; Li et al., 2021), with relatively less research on the western regions. Moreover, there are relatively few considerations for environmental quality, carbon emission indicators, and resource utilization efficiency in the existing evaluation system for green development. To supplement and improve the green development evaluation system, this study introduces the PM2.5 and excellent and good rate of AQI, CO2 emissions per unit GDP, and unit GDP water and electricity consumption. At the same time, previous studies have mainly focused on the spatiotemporal differences in green development level (He and Xu, 2022; Chen et al., 2021), and there is relatively little research on the coupling and coordination relationship between green development subsystems and the driving factors affecting green development.
The Chengdu Plain Economic Zone (CPEZ), one of the most economically dynamic regions in western China, includes key cities such as Chengdu and Mianyang. It plays a critical role in advancing the Yangtze River Economic Belt and the Chengdu-Chongqing Twin-City Economic Circle. Green development is key to ensuring long-term ecological balance and achieving high-quality economic growth in this region. The results of this study can provide scientific basis for promoting the transformation of green economy, improving resource utilization efficiency, enhancing environmental quality, and promoting coordinated regional economic development, which will contribute to the realization of the “Beautiful China” initiative.
2 Literature review
As research on green development theory deepens, regional green development evaluation has shifted from a single-indicator approach to a comprehensive assessment that considers multiple dimensions and the interaction of various factors. Green finance, low-carbon development, social benefits, and their coupling and coordinated development have become important areas of study.
2.1 Constructing a green development evaluation system
The construction of a green development evaluation system is fundamental to regional green development assessment. Many foreign countries focus on the impact of green environment, low-carbon technology, and green economic growth on regional social development (Sunita et al., 2023; Gunay et al., 2025). Domestic research focuses more on comprehensive evaluation of regional development, including multi-dimensional evaluation of resource utilization efficiency, environmental quality, economic development quality, and social benefits (Fang et al., 2020; Dong et al., 2021). Simultaneously, resource utilization efficiency, green technology innovation, low-carbon technology investment and the contribution of green industries to GDP are crucial for promoting sustained growth of the green economy (Li et al., 2023; Liu et al., 2024; Yuan et al., 2023).
Moreover, many scholars have integrated indicators such as carbon emissions and energy structure into green development evaluation systems, driving the transition to a green low-carbon economy (Chen et al., 2019; Yuan et al., 2020). Social benefits are a crucial dimension in the green development evaluation process. Currently, the improvement of the green development evaluation system still faces challenges. One of the critical areas for future research is how to reasonably balance various indicators and consider regional characteristics in the evaluation.
2.2 Regional coupling and coordinated development
The coupling coordination degree model can consider the dynamic characteristics of the system over time, better simulate the evolution process and trend of the system. This method has been applied in the coupling coordination development of ecosystem health and human activity intensity, digital economy and green economy (Wang et al., 2024), efficient utilization of water and soil resources (Zhang et al., 2025), green space quality and economic development (Pan and Zhao, 2025), innovation factor allocation and green economy (Geng et al., 2024) and other aspects. However, there is relatively little research on the coupling and coordinated development relationship between green development evaluation subsystems. This article studies the spatiotemporal trends of the coordinated development of three subsystems: green environment, green life, and green economy.
2.3 The spatiotemporal differentiation and driving factors of regional green development
There are significant temporal and spatial differences in regional green development, and its driving factors are complex and diverse. Many scholars have explored the spatial differentiation characteristics and evolution trends of green development in different regions through interdisciplinary methods, and proposed policy recommendations based on regional characteristics and influencing factors (Zhu et al., 2023). Zhou et al. (2020) evaluated the differences in green development among different regions of China by establishing a comprehensive index of green development. Zhu et al. (2024) synthesized the green development of the Chengdu Chongqing Economic Zone from the perspective of production and life ecology. The main driving factors affecting the green development of the region include the number of doctors per million people, the number of books in public libraries per 100 people, the per capita regional GDP, and the number of secondary schools per million people.
This study focuses on the Chengdu Plain Economic Zone (CPEZ), using the entropy method, coupling coordination model, geographic detector, and ArcGIS technology to explore the spatial and temporal differentiation characteristics of green development and its driving factors. The research specifically analyzes factors influencing green development in the region, including economic activities, population density, resource endowments, and policy measures. Additionally, the study will investigate the interactions among these factors and their impact on the spatial differences of green development levels. Through this research, the paper aims to provide a comprehensive understanding of the challenges and opportunities for green development in the Chengdu Plain urban agglomeration, offering valuable insights for deepening the cultivation of new productive forces, steadily achieving the “dual carbon” goals, and promoting high-quality development in the region. This study will also contribute to a broader understanding of how to promote green development in rapidly urbanizing areas, especially in the context of the economic and ecological challenges faced in western China.
3 Research methodology and data sources
3.1 Scope of research
The Chengdu Plain Economic Zone (CPEZ) is located in the western Sichuan Basin, covering a total area of 86,469.1 km2, and includes cities such as Chengdu, Ziyang, Deyang, Meishan, Suining, Mianyang, Leshan, and Ya’an (Figure 1). The region is characterized by a dense river network, efficient transportation infrastructure, and a robust economy. As such, it is an important component of the Yangtze River Economic Belt and the Chengdu-Chongqing Twin City Economic Circle. It is one of the most populous and economically developed areas in Southwest China and plays a critical role as a key agricultural production hub for grains, vegetables, and other crops in the Sichuan Basin. By the end of 2022, the CPEZ’s annual GDP reached 3.4671 trillion yuan, taking over 61.09% of the Sichuan province’s GDP, with a population of 39.991 million, or 44.10% of the provincial total.
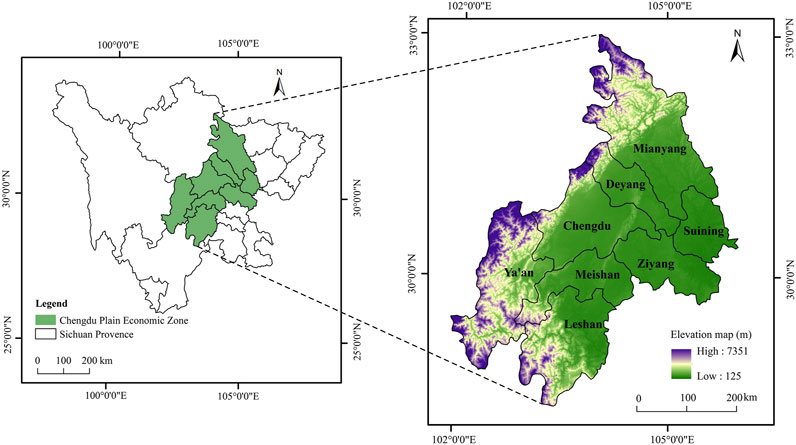
Figure 1. Overview of the Chengdu plain economic zone (CPEZ).
3.2 The green development evaluation index system
In order to effectively explore the green development level and driving factors in Chengdu Plain Economic Zone (CPEZ), it is of great importance to scientifically and systematically construct an evaluation index system (Li et al., 2024).
Based on the theoretical framework of the “three layers” of green development, and following the principles of scientific rigor, systematic structure, and accessibility, this paper constructs an evaluation index system for green development (Lu et al., 2023). The system consists of three subsystems: Green Environment, Green Lifestyle, and Green Economy. It includes 33 evaluation indicators at the indicator layer, with 19 positive indicators and 14 negative indicators (Lan et al., 2024).
(1) Green environment is essential for the coordinated development of the economy, society, and ecology. Environmental governance measures, such as carbon reduction and pollution control, are vital for improving environmental quality. These efforts alleviate environmental pressure and enhance sustainability, providing crucial support for green development. This study mainly selected the fine particulate matter (PM2.5) concentration, excellent and good rate of AQI, industrial smoke and dust emissions per unit GDP, industrial SO2 emissions per unit GDP, CO2 emissions per unit GDP, fertilizer application per unit cropland area, centralized sewage treatment rate, household waste treatment rate as evaluation indexes.
(2) Green Lifestyle promotes resource conservation and circular utilization, improving residents’ overall happiness and life satisfaction. This study selected indicators based on the impact of green development on wellbeing and residents’ livelihood, mainly including population density, number of beds in medical institutions, public library holdings per capita, green coverage rate in built-up areas, daily domestic water use per capita, per capita park green space area and other indicators.
(3) Green Economy emphasizes the efficient utilization of resources and low-carbon development, promoting the transformation and upgrading of urban economic structure. The main indicators selected for this study include gross regional product index, per capita GDP, disposable income per urban resident, value added of the secondary sector as a percentage of GDP, reduction in energy consumption per 10,000 GDP,water consumption per unit of GDP, electricity consumption per unit of GDP, per capita water resources, energy conservation and environmental protection as a percentage of general budget expenditure, etc. The specific index system is shown in Table 1.
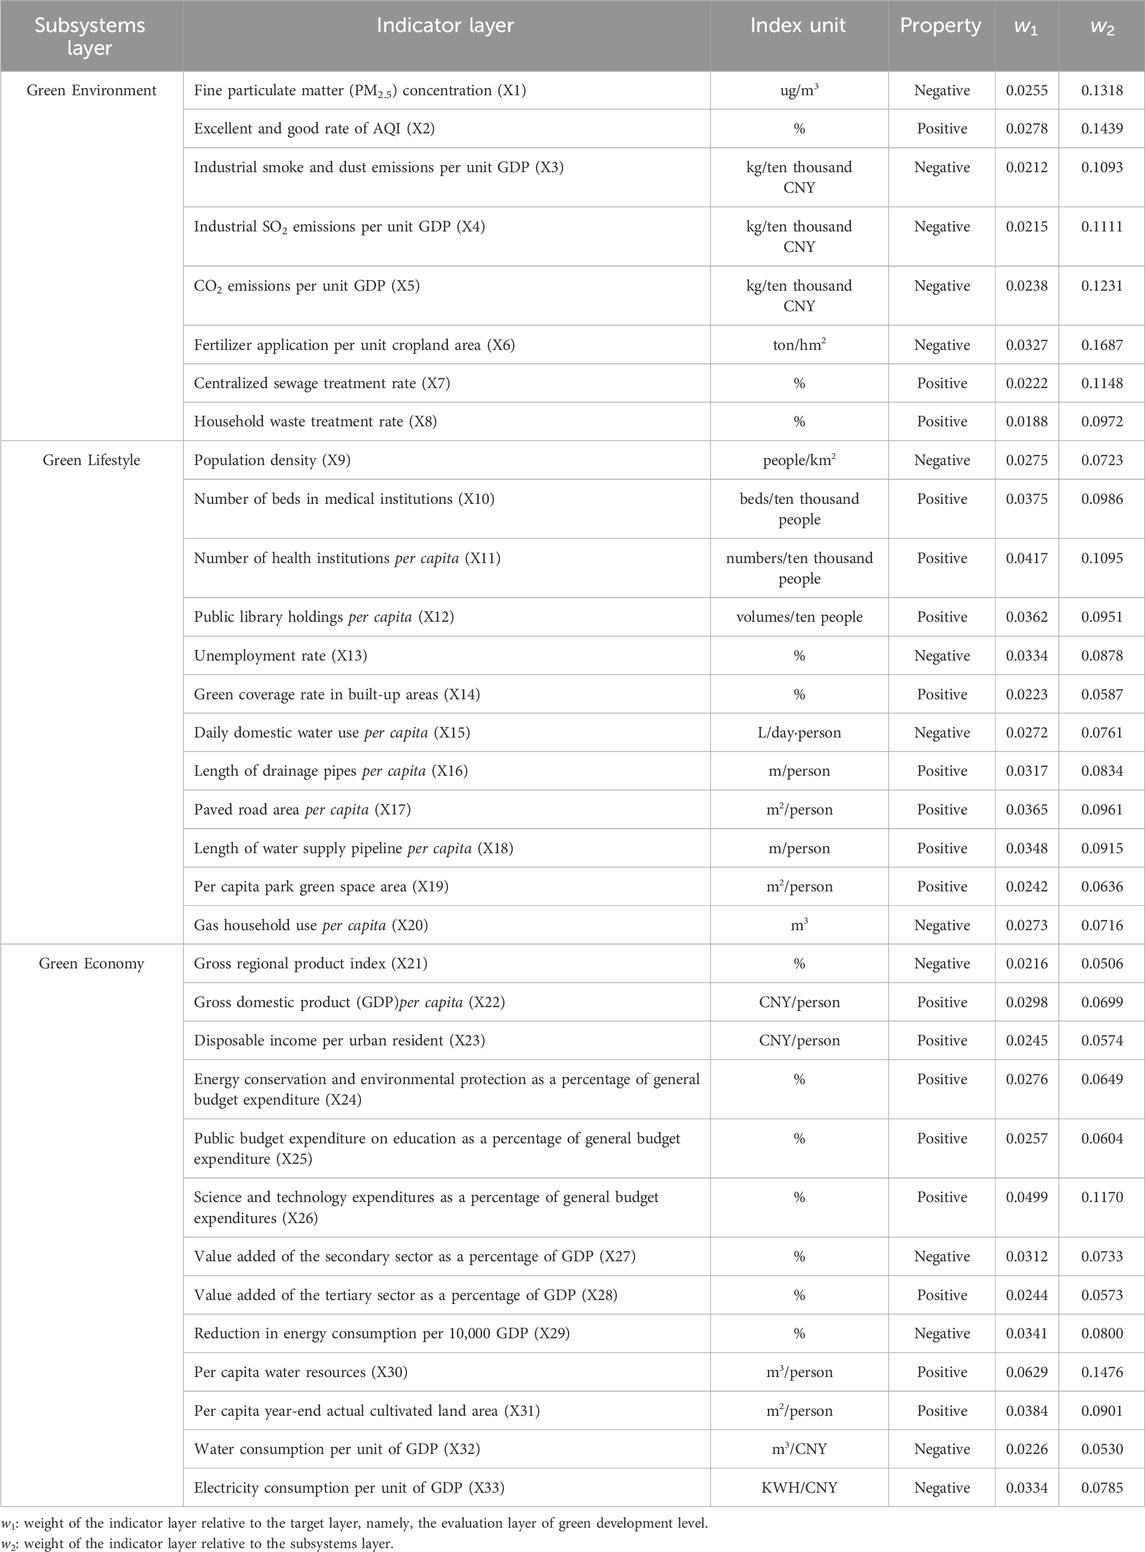
Table 1. Evaluation index system for green development.
In the following text, graphics, and tables, the abbreviation X1-X33 are used to represent different indicators, and X1-X33 represents the same content as in Table 1.
3.3 Comprehensive evaluation model
The entropy weight TOPSIS method is one of the most widely used objective weighting techniques. This method objectively determines the weight of each evaluation indicator based on the information provided by the indicators, which can effectively reduce subjective bias (Liang et al., 2022). This method can comprehensively consider multiple influencing factors, has strong interpretability (Almulhim, 2024), and is suitable for the comprehensive evaluation of various data indicators for green development in this study. It helps ensure the objectivity and rationality of the weights of each factor. The specific calculation process is as follows.
Step 1. Raw data standardization processing.
Where t reprensents different cities, t = 1,2,…,8; i represents the year, i = 1,2,…,10; j denotes evaluation indicators, j = 1,2,…,33; Atij indicates the standardized value of the indicator j in year i for city t; Xtij signifies the original data of the indicator j in year i for city t; Xjmax and Xjmin represent the maximum and minimum value of evaluation indicator j for city t, respectively.
Step 2. Calculate the information entropy of the jth indicator.
Where,
Step 3. Calculate the information entropy redundancy of the jth indicator.
Where, Ej is information entropy
Step 4. Calculate the weights of the jth indicator.
Where wj represents the weight of the jth indicator.
Step 5. Calculation the evaluation results.
Where
3.4 Coupling coordination degree model
The coupling coordination model is used to analyze the degree of coordination in the development of things and study the degree of correlation between various systems (Zhang et al., 2024a; Yang et al., 2024).
Where, CCD represents the coupling and coordinated development degree between green environment, green lifestyle, and green economy, CCD
3.5 Geographical detectors
The geographic detector, proposed by Wang Jinfeng et al., in 2017 (Zhang X. L. et al., 2024), is a statistical analysis method that can effectively identify spatial heterogeneity and nonlinear relationships between variables. In this study, this method helps identify spatial distribution differences of influencing factors in different regions, reveal spatial differentiation patterns, and explore driving forces.
In this study, 33 factors including PM2.5 concentration, population density, and per capita water resources were selected as independent variables in the model, with green development level as the dependent variable.
The factor detector is used to evaluate spatial heterogeneity of green development level and the q value is used to assess the explanatory power of each factor. The interaction factor detector primarily identifies interactions between different influencing factors, evaluating the driving factors that affect green development. The calculation formula is as follows:
Where, q∈[0,1], the closer the q value is to 1, the greater the variability of the driving factor in explaining the level of green development; h denotes the stratification of the variable or factor, representing its classification; L represents the number of categories of driving factors for green development level; Nh and N indicate the number of units in the stratum and the entire district, respectively;
3.6 Pearson correlation analysis
Pearson correlation coefficient method is a commonly used statistical method to measure the linear correlation between two variables. It is simple to calculate and easy to explain. Unlike Spearman rank correlation and Kendall rank correlation, Pearson is suitable for continuous data with normal distribution and has stronger detection ability for linear relationships. In this study, Pearson correlation analysis was chosen to more accurately and intuitively analyze the interaction relationship between different indicators and coordinated development degree (CCD).
Where, r is the correlation coefficient; xi and yi are two different variables; i represents different years;
3.7 Data sources
Taking 2013–2022 as the research period, the data of various indicators are sourced from Sichuan Statistical Yearbook (2013–2022), China Urban Statistical Yearbook (2013–2022) and Sichuan Water Resources Bulletin (2013–2022). Ambient air quality data are sourced from the Resource and Environmental Science Data Center of the Chinese Academy of Sciences.
Part of the missing data was supplemented by the statistical yearbook of each prefecture level city, the national economic and social development communique, the water resources communique, the government public information and other channels, and very few missing data were filled by linear interpolation method. The missing data in the article mainly refers to PM2.5 and industrial smoke emissions in individual years. Based on the assumption that PM2.5 mainly comes from industrial smoke emissions, we have performed linear interpolation according to the linear regression results between industrial smoke emissions and PM2.5. The amount of linearly interpolated data is less than 1% of the total data. This method ignores the potential volatility or more complex trends of the data, which may introduce bias.
4 Results and analysis
4.1 Characteristics of spatial and temporal evolution of green development in Chengdu plain economic zone (CPEZ)
Based on the index system outlined in Section 4.1, the green development of the CPEZ was assessed using the entropy weight method across three dimensions: green environment, green lifestyle, and green economy. The results were illustrated in Figure 2. The overall green development level of the CPEZ exhibited continuous improvement, rising from 0.221 in 2013 to 0.334 in 2022, reflecting a average annual growth rate of 5.11%.
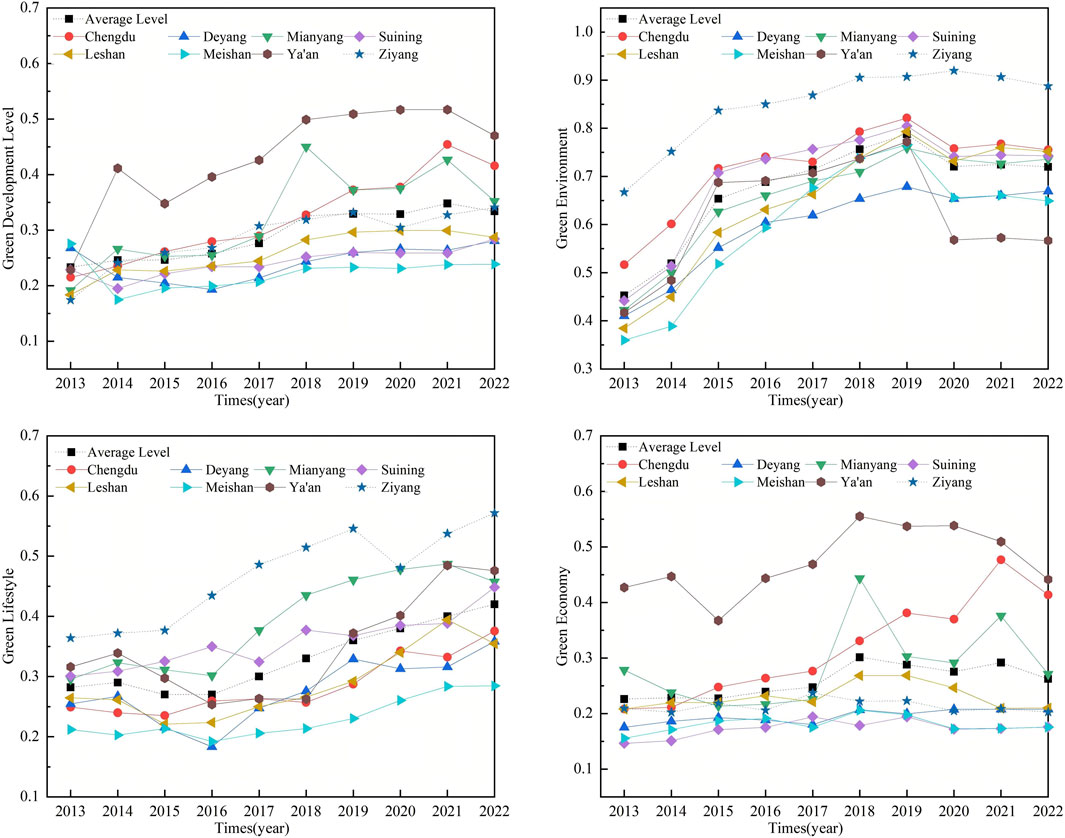
Figure 2. Evaluation results of green development in the Chengdu Plain Economic Zone (CPEZ) from 2013 to 2022.
Spatial heterogeneity was observed in the green development levels across cities. Ya’an consistently led the region, demonstrating a fluctuating yet upward trajectory, peaking at 0.517 in 2021. Chengdu and Mianyang followed closely, while Ziyang aligned with the regional average. In contrast, Leshan, Deyang, Suining and Meishan displayed slower progress in green development.
Regarding the green environment dimension, all cities exhibited a gradual upward trend from 2013 to 2019, followed by a slight decline from 2019 to 2022. Ziyang outperformed other cities in this aspect, with its green environment index increasing significantly from 0.667 to 0.888.
Over the past decade, cities within the CPEZ demonstrated a fluctuating but overall upward trend in green lifestyles. Mianyang, Ziyang, and Suining recorded the highest growth rates in this dimension. By 2022, their green lifestyle values had risen to 0.475, 0.572, and 0.448, respectively, with average annual growth rates of 6.10%, 5.71%, and 4.88%.
In terms of green economy, Ya’an maintained a leading position within the CPEZ, with its green economy values (0.427∼0.555) consistently exceeding the regional average (0.226∼0.301). Chengdu and Mianyang also made notable progress from 2013 to 2022, with Chengdu achieving an annual growth rate of 9.90%, followed by Mianyang at 3.53%. However, the green economy values of other cities remained below the regional average.
4.2 Coordination degree of green development and coordination types
The coupling and coordinated development degree (CCD) of green development subsystems in the CPEZ,as illustrated in Figure 3. The coupling coordination degree (C) of the green development subsystems in the CPEZ exhibited a gradual upward trend from 2013 to 2022, ranging between 0.863 and 0.906, indicating a relatively high level of coordination among the green environment, green lifestyle, and green economy dimensions within the region. Meanwhile, the CCD showed steady improvement, increasing from 0.326 in 2013 to 0.400 in 2022. However, the region remained in the low-level coupling coordination development stage throughout this period.
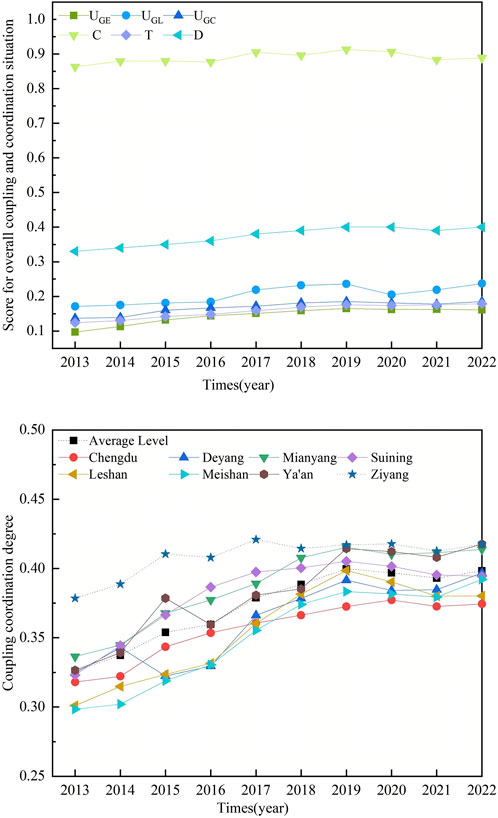
Figure 3. Coupling coordination development degree (CCD) of Green development in the CPEZ. Note: C, T and CCD represent the coupling degree, the comprehensive coordination index and the coupling and coordinated development degree, respectively; UGE, UGL and UGEC represent the comprehensive evaluation indexes of three subsystems: green environment, green lifestyle, green economy, respectively.
At the city level, the CCD of each city demonstrated a consistent upward trend over time, albeit with significant spatial heterogeneity (Figure 4). By 2022, the CCD of Chengdu, Deyang, Mianyang, Suining, Leshan, Meishan, Ya’an, and Ziyang had increased by 17.7%, 22.2%, 23.0%, 22.0%, 26.3%, 31.4%, 27.9%, and 10.3%, respectively. Notably, Ziyang, Suining, Mianyang and Ya’an surpassed the regional average and transitioned into the primary coupling coordination development stage in 2015, 2017, 2018, and 2019, respectively.

Figure 4. Coordination types of green development in the CPEZ.
Based on Pearson correlation analysis, the correlation between different indicators and coupling coordination development degree (CCD) was analyzed from three dimensions: green environment, green lifestyle, and green economy.
In the dimension of green environment, there were differences in the coupling and coordination mechanisms of various subsystems in different cities during the green development process of the CPEZ, showing obvious spatial differentiation characteristics (Table 2). Studies indicated that, except for Ziyang, the CCD of other cities had shown a significant negative correlation with indicators X1 (p < 0.01), X3 (p < 0.05), X4 (p < 0.001), and X5 (p < 0.001). Meanwhile, except for Deyang, there was a significant positive correlation between the CCD of each city and indicator X2 (p < 0.01). Furthermore, CCD was significantly positively correlated with indicator X7 in cities located in the southwest (Leshan, p < 0.001; Meishan, p < 0.001; Ya’an, p < 0.001) and northeast (Deyang, p < 0.01; Mianyang, p < 0.001) of the urban agglomeration. For Ziyang, its coupling coordination development is primarily influenced by indicators X1 (p < 0.001), X2 (p < 0.01), and X6 (p < 0.001).

Table 2. The correlation between the CCD and different indicators in the green environment subsystem.
From the perspective of green lifestyles, Chengdu, as the core city of the CPEZ, exhibited a significant positive correlation between its coupling coordination development and indicators X14, X16, and X18 (p < 0.01), while showing a negative correlation with X15 (p < 0.01) (Table 3). Other indicators did not demonstrate significant relevance to its coupling coordination; In Deyang, Mianyang, Suining, and Leshan the coupling coordination development was primarily positively influenced by X10 (p < 0.001), X14 (p < 0.001), and X19 (p < 0.05), while a significant negative correlation was observed with X13 (p < 0.05); For Meishan and Ya’an, the CCD showed a significant positive correlation with X19 and X20 (p < 0.05), but a highly significant negative correlation with X11 (p < 0.01); For Ziyang, its CCD was mainly significantly positively correlated with X10 (p < 0.01), X16 (p < 0.01), and X19 (p < 0.001). This analysis reveals the differentiated development paths of various cities in the green lifestyle dimension, highlighting the varying impacts of different indicators on coupling coordination development.
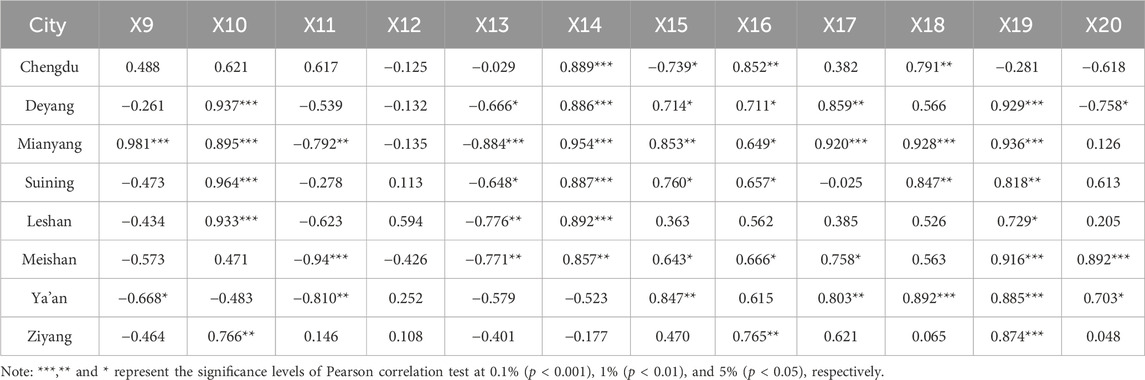
Table 3. The correlation between the CCD and different indicators in the green lifestyle subsystem.
In the green economy subsystem,all cities except Ziyang exhibited similar correlation patterns with the indicators (Table 4). Specifically, their CCD had showed varying degrees of significant positive correlation with indicators X22 (p < 0.05), X23 (p < 0.01), X28 (p < 0.01), and X33 (p < 0.05), while demonstrating a negative correlation with indicators X27 (p < 0.01) and X32 (p < 0.01).

Table 4. The correlation between the CCD and different indicators in the green economy subsystem.
4.3 Analysis of influencing factors on green development levels in CPEZ
To explore the influence of various driving factors on the green development of the CPEZ, factor detection and interaction detection from the Geographical detectors model were used to analyze 33 indicators from the green development evaluation System. Factor detection results showed that all 33 indicators for the CPEZ passed the significance test (p = 0.000) between 2013 and 2022, as shown in Figure 5. The top 10 indicators with q-values greater than 0.5, included electricity consumption per unit of GDP (X33), population density (X9), value added of the tertiary sector as a percentage of GDP (X28), per capita water resources (X30), length of water supply pipeline per capita (X18), and value added of the secondary sector as a percentage of GDP (X27). These results indicated that green economic indicators had stronger explanatory power for green development, positioning them as key drivers of green development levels.
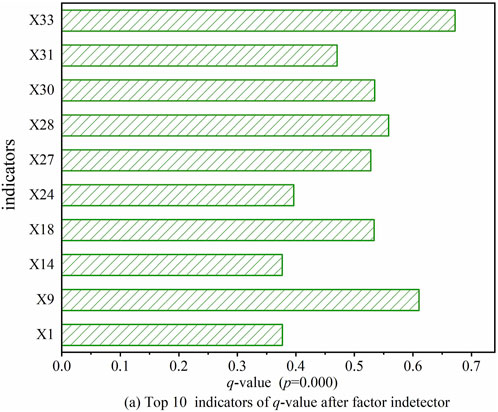
Figure 5. Top 10 indicators of q-value after factor detection.
The interaction factor detection revealed the synergistic effect of multiple factors on the green development process of CPEZ from three subsystems: green environment, green lifestyle, and green economy (Figure 6). Compared to single-factor detection, the interaction effects of evaluation indicators significantly enhanced the explanatory power of the three subsystems on green development.
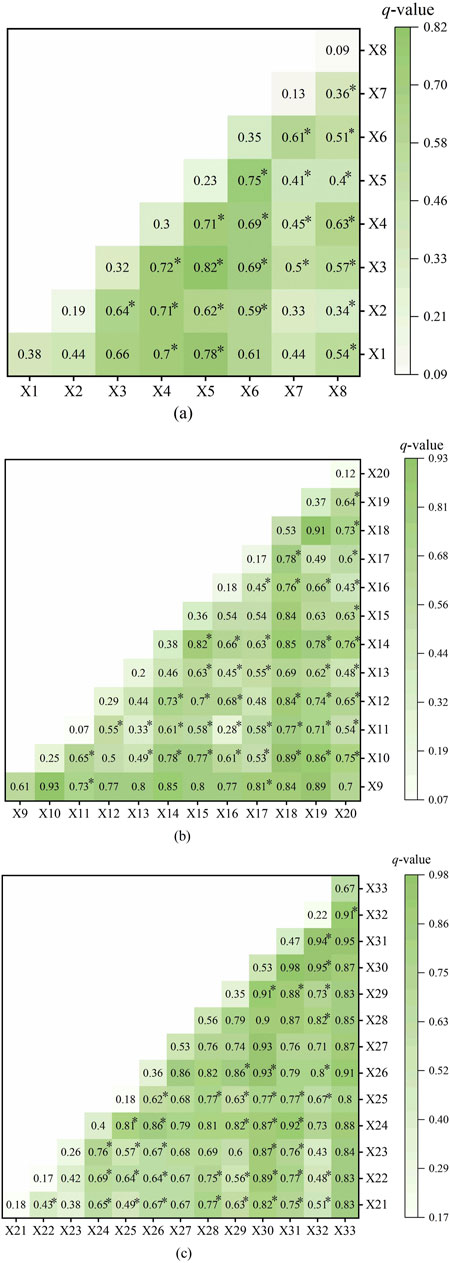
Figure 6. Interactive detection results of green development factors in CPEZ. Note: * indicates that Interaction indicators that are nonlinearly enhanced within each subsystem. (a) The indicators of green environment subsystem. (b) The indicators of green lifestyle subsystem. (c) The indicators of green economy subsystem.
Within the green environment system, strong interactions existed among various indicators. The interaction of indicators such as industrial smoke and dust emissions per unit GDP (X3), industrial SO2 emissions per unit GDP (X4), CO2 emissions per unit GDP (X5), fertilizer application per unit cropland area (X6) with others demonstrated the higher explanatory power, with q-values greater than 0.5. This suggested that promoting green environmental development should focus on advancing new productive forces, optimizing and upgrading traditional industries, increasing resource utilization efficiency, and implementing high-efficiency pollution control technologies. These efforts would contribute to the achievement of carbon peak targets.
In the green lifestyle subsystem, the factors with the most significant interaction effects included number of beds in medical institutions (X10), public library holdings per capita (X12), unemployment rate (X13), green coverage rate in built-up areas (X14),gas household use per capita (X20). The non-linear enhancement of the interaction between these factors and other factors accounts for 44% of the overall results of this subsystem. The findings suggested that enhancing public resources per capita and increasing urban greening coverage would be more beneficial for improving the green lifestyle in the CPEZ.
In the green economy subsystem, the interaction results showed consistently high q-values, with about 76% of the results had a q-value greater than 0.60. Additionally, 47% of the interaction results exhibited nonlinear enhancement. Specifically, the interactions between gross regional product index (X21), water consumption per unit of GDP (X32), gross domestic product (GDP) per capita (X22), and most economic factors showed varying degrees of nonlinear enhancement. Meanwhile, the interaction of per capita water resources (X30) with other factors had a q-value greater than 0.77. This indicated that increasing regional GDP, protecting water resources, and improving resource utilization efficiency would significantly promote the green economic development of the CPEZ.
5 Disclussion
5.1 Coordinated coupling development of green environment, green lifestyle, and green economy in CPEZ
The evaluation results based on the three dimensions of green environment, green lifestyle, and green economy revealed that although the overall green development level of the CPEZ continued to improve from 2013 to 2022, it remained relatively low (0.22–0.33) and exhibited significant spatial heterogeneity. This finding aligned with the research results of Lan et al. on the green development level of urban agglomerations in the Yangtze River Economic Belt (Lan et al., 2024), and The overall trend of green development level in eastern Chinese cities were significantly higher than that in western cities (Yang et al., 2023; Zou et al., 2024).
Among the three subsystems, the green environment achieved a relatively high development level (0.667–0.888), indicating significant progress in ecological environmental protection within the study area. This result was consistent with the findings of Xu et al. (2022). However, the development levels of green lifestyle (0.27–0.42) and green economy (0.226–0.301) were relatively low, which may explain why the coupling coordination degree (CCD) of the three subsystems in CPEZ remained at a low level (0.326–0.400). A similar phenomenon was observed in Chen et al.‘s study on the green development of the Three Gorges Reservoir area (Chen et al., 2023), suggesting that the coordination among ecological environmental protection, green economy, and social harmony needed further enhancement. Notably, except for Chengdu, Mianyang, and Ya’an, the green economy level of other cities is generally lower than the regional average, indicating that there is great room for improvement in industrial structure optimization and resource utilization efficiency.
Therefore, The green development of CPEZ requires greater attention to the coordinated coupling of green environment, green lifestyle, and green economy. Optimizing the allocation of public resources and increasing the coverage of urban parks and green spaces are crucial for improving the level of green lifestyle (Sunita et al., 2023; Pan et al., 2024); Secondly, cultivating emerging green industries to promote the development of green economy (Liu X. et al., 2022).
5.2 Strategies to enhance green development in urban agglomerations
5.2.1 Optimizing green environmental governance
The study found that indicators such as industrial smoke emissions per unit of GDP (X3), industrial sulfur dioxide emissions per unit of GDP (X4), and carbon dioxide emissions per unit of GDP (X5) had a significant impact on the green environment (q > 0.5). Zhang K. L. et al. (2024) discovered that air quality positively influenced the low-carbon green coupling coordination development of the Yangtze River Delta urban agglomeration. Xu and Hu (2020) found that water resources and wastewater discharge are key factors affecting the coupling and coordination of green development in Jiangsu Province. Peng and Yu (2024) found that ecological environmental protection directly impacted the green development efficiency of the Yangtze River Economic Belt. Almulhim (2024) found that carbon dioxide emissions, GDP, and renewable energy share indicators are the main determining factors of a country’s green development level in their assessment of the green development level of G20 countries. The increase in renewable energy, technological innovation, and forest coverage all contribute to improving environmental quality by reducing carbon dioxide emissions (Hasan et al., 2023). Therefore, it was essential to accelerate the development of new productive forces and optimize the industrial structure of traditional industries. Introducing efficient pollution control technologies and promoting clean energy were necessary to reduce industrial pollution emissions. Additionally, regional environmental collaborative governance should be strengthened by establishing cross-city environmental protection cooperation mechanisms to mitigate the external impact of environmental pollution.
5.2.2 Promoting green lifestyles
Indicators such as the number of hospital beds (X10), per capita public library collections (X12), and green coverage in built-up areas significantly influenced green lifestyles (q > 0.5). Urban green spaces have important ecosystem service functions in improving environmental quality, reducing rainwater runoff and urban floods, and play a crucial role in the wellbeing and sustainable development of cities (LaReaux and Watkins, 2025; Ganjirad et al., 2025). Therefore, increased investment in public facilities was needed to improve urban green coverage and the per capita availability of public resources. Meanwhile, public awareness of environmental protection should be enhanced through education, encouraging green consumption and low-carbon travel.
5.2.3 Driving green economic transformation
Indicators such as electricity consumption per unit of GDP (X33) and the proportion of tertiary industry value added to GDP (X28) had a significant impact on the green economy (q > 0.5). This aligned with the findings of Yuan et al. (2019), who demonstrated that optimizing the tertiary industry and regional planning contributed to improving regional green development. Green economy is the main driving force for achieving sustainable social and environmental development (Chaaben et al., 2024). Bilgaev et al. (2021) found that economic restructuring and the development of renewable resources are the foundation of green economy development, and Behera et al. (2024) found that renewable energy and green innovative technologies promote sustainable development in India.
Therefore, accelerating industrial restructuring was crucial for promoting the optimization, transformation, and upgrading of traditional industries. Meanwhile, emerging green industries such as new energy, green technology innovation, and the circular economy should be encouraged (Liang K. et al., 2023; Wang and Zhang, (2023a). Encourage the establishment of a national green finance system, such as green securities, green insurance, and green credit, to meet the demand for sustainable green financing in green transformation (Houssam et al., 2023). In addition, it was necessary to strengthen regional coordinated economic development, optimize resource allocation and efficient utilization.
5.2.4 Enhancing regional collaborative development
Significant spatial heterogeneity in green development levels was observed among cities within the CPEZ. Cities like Ya’an and Chengdu exhibited higher levels of green development, while Leshan and Deyang lagged behind. Wang and Li, (2023b) found that economic development was the primary driver of regional green development disparities, and the interaction of any two driving factors had a greater impact than individual factors. Liu et al. (2023) demonstrated that technological innovation played a mediating role in improving regional green development efficiency through industrial collaborative agglomeration development. Therefore, it was necessary to shift economic development perspectives and increase investment in green technologies (Yi et al., 2025). By facilitating resource sharing, technology transfer, and industrial collaboration, the linkage between the core city of Chengdu and its surrounding cities could be strengthened, narrowing regional development gaps and promoting the green coupling coordination development of the plain urban agglomeration.
6 Conclusion
To promote regional green and high-quality development, this study adopted entropy weight method and geographic detector model to investigate the spatiotemporal differentiation and driving mechanism of green development level in Chengdu Plain Economic Zone (CPEZ). The results relieved the following conclusions:
From 2013 to 2022, the overall level of green development in CPEZ district showed an upward trend, with an average annual growth rate of 5.11%.
Coupling and coordinated development between green development assessment subsystems in CPEZ is steadily improving, but overall it is still at a low level. However, Ziyang, Suining, Mianyang, and Ya’an have entered the initial stage of coupled and coordinated development.
Electricity consumption per unit of GDP, per capita length of water supply pipelines, percentage of added value of the secondary and tertiary industries to GDP, per capita water resources, and population density were the main driving factors affecting green development in CPEZ.
7 Limitations and future scope
7.1 Limitations
This study systematically analyzed the spatiotemporal evolution characteristics and driving factors of green development in CPEZ using entropy weight method and geographic detector model, providing scientific basis for regional green development. However, the impact of green finance, digital economy, and public environmental awareness on green development was not fully considered in this study. With the rapid development of social economy, future research can explore the impact mechanism of these factors on green development from green financial indicators such as green securities, green insurance and green credit, digital economic indicators such as internet penetration, relevant practitioners and mobile phone penetration rate, and public environmental awareness indicators such as investment in science and technology education, number of green invention patent authorizations and applications.
7.2 Future scope
Regional green development is a complex system engineering. By optimizing the industrial structure, encouraging green technology innovation in enterprises, vigorously developing renewable energy, promoting green economic transformation, while enhancing public participation awareness, vigorously promoting green lifestyles, and strengthening regional coordinated development, the goal of high-quality and sustainable green development in the region can be achieved.
Data availability statement
The original contributions presented in the study are included in the article/Supplementary Material, further inquiries can be directed to the corresponding author.
Author contributions
LM: Writing – review and editing, Writing – original draft, Conceptualization, Methodology. TH: Supervision, Writing – review and editing, Formal Analysis. HC: Writing – original draft, Formal Analysis, Supervision. JM: Supervision, Formal Analysis, Writing – original draft. ZC: Conceptualization, Writing – original draft. YW: Writing – original draft, Software, Writing – review and editing.
Funding
The author(s) declare that financial support was received for the research and/or publication of this article. This research was supported by the Sichuan Science and Technology Program (No. 2024NSFSC1988 and No. 2025ZNSFSC0257), Mianyang Normal University Scientific Research startup project (QD2021A35).
Conflict of interest
The authors declare that the research was conducted in the absence of any commercial or financial relationships that could be construed as a potential conflict of interest.
Generative AI statement
The authors declare that no Generative AI was used in the creation of this manuscript.
Publisher’s note
All claims expressed in this article are solely those of the authors and do not necessarily represent those of their affiliated organizations, or those of the publisher, the editors and the reviewers. Any product that may be evaluated in this article, or claim that may be made by its manufacturer, is not guaranteed or endorsed by the publisher.
Supplementary material
The Supplementary Material for this article can be found online at: https://www.frontiersin.org/articles/10.3389/fenvs.2025.1598148/full#supplementary-material
References
Almulhim, T. (2024). Assessment of green development level performance in G20 countries: a dynamic evaluation framework. Heliyon 10, e37622. doi:10.1016/j.heliyon.2024.e37622
Amer, A. S. R., and Kareem, P. H. (2025). Advancing sustainable development: empirical insights on energy poverty in ECOWAS through green financing, technological innovation and economic empowerment. Sustainability 17, 1333. doi:10.3390/su17031333
Behera, P., Sethi, L., and Sethi, N. (2024). Balancing India's energy trilemma: assessing the role of renewable energy and green technology innovation for sustainable development. Energy 308, 132842. doi:10.1016/j.energy.2024.132842
Bilgaev, A., Sadykova, E., Li, F. J., Mikheeva, A., and Dong, S. C. (2021). Socio-economic factor Impact on the republic of Buryatia (Russia) green economic development transition. Int. J. Environ. Res. Public Health 18, 10984. doi:10.3390/ijerph182010984
Chaaben, N., Elleuch, Z., Hamdi, B., and Kahouli, B. (2024). Green economy performance and sustainable development achievement: empirical evidence from Saudi Arabia. Environ. Dev. Sustain. 26, 549–564. doi:10.1007/s10668-022-02722-8
Chen, L. L., Zhang, X. D., He, F., and Yuan, R. S. (2019). Regional green development level and its spatial relationship under the constraints of haze in China. J. Clean. Prod. 210, 376–387. doi:10.1016/j.jclepro.2018.11.037
Chen, Y., Liao, Y., and Wen, C. H. (2023). A novel evaluation system of green development level in the Three Gorges Reservoir Area and its spatial–temporal pattern. Environ. Sci. Pollut. Res. 30, 110744–110763. doi:10.1007/s11356-023-29591-6
Chen, Y. Z., Yang, L. Z., Peng, H., Zhang, X. C., Zhang, S. S., Lu, H. W., et al. (2024). Relevance evaluation and spatial differentiation analysis between green development and environmental footprint in China's three typical mega-urban agglomerations. J. Clean. Prod. 436, 140644. doi:10.1016/j.jclepro.2024.140644
Chen, Z., Li, X. J., and Xia, X. L. (2021). Measurement and spatial convergence analysis of China's agricultural green development index. Environ. Sci. Pollut. Res. 28, 19694–19709. doi:10.1007/s11356-020-11953-z
Dadhich, M., Bhati, S., Bhaskar, A. A., Kumar, S. R., and Gupta, V. (2025). “Climate Change initiatives of G20: analysis of global governance and sustainability,” in Community resilience and climate change challenges: pursuit of sustainable development goals (SDGs). Editors A. Bhaumik, S. Poddar, M. Dadhich, K. Hiran, and R. Doshi (IGI Global Scientific Publishing), 1–12. doi:10.4018/979-8-3693-6522-9.ch001
Deng, Y. S., Li, F. F., and Lu, Q. (2024). Spatial disparities and internal subsystems' coupling coordination analysis of green development in Chinese animal husbandry. Environ. Sci. Pollut. Res. 31, 18916–18931. doi:10.1007/s11356-024-32394-y
Dong, F., Li, Y. F., Qin, C., and Sun, J. J. (2021). How industrial convergence affects regional green development efficiency: a spatial conditional process analysis. J. Environ. Manag. 300, 113738. doi:10.1016/j.jenvman.2021.113738
Fang, G. C., Wang, Q. L., and Tian, L. X. (2020). Green development of Yangtze River Delta in China under population-resources-environment-development-satisfaction perspective. Sci. Total Environ. 727, 138710. doi:10.1016/j.scitotenv.2020.138710
Ganjirad, M., Delavar, M. R., Bagheri, H., and Azizi, M. M. (2025). Optimizing urban critical green space development using machine learning. Sustain. Cities Soc. 120, 106158. doi:10.1016/j.scs.2025.106158
Geng, K. S., Zhang, X. T., Jiang, H., and Zhuang, Z. X. (2024). The spatio-temporal characteristics and dynamic evolution of coupling and coordinated development of innovation factor allocation and green economy in China. Front. Environ. Sci. 12, 1475508. doi:10.3389/fenvs.2024.1475508
Gibbs, D., and O' Neill, K. (2016). Future green economies and regional development: a research agenda. Reg. Stud. 51 (1), 161–173. doi:10.1080/00343404.2016.1255719
Gunay, S., Kirimhan, D., and Demiralay, S. (2025). Regional green economies and Bitcoin's electricity consumption: paving the way for global sustainability. J. Environ. Manag. 374, 123997. doi:10.1016/j.jenvman.2024.123997
Hasan, M., Mahjabin, T., Hossain, M., Kibria, M., Haseeb, M., and Hossain, M. (2023). Towards green economy and sustainable development in Bangladesh: assessing the role of social and environmental indicators. Environ. Sci. Pollut. Res. 30, 110324–110339. doi:10.1007/s11356-023-30060-3
He, J. X., and Hu, S. (2022). Ecological efficiency and its determining factors in an urban agglomeration in China: the Chengdu-Chongqing urban agglomeration. Urban Clim. 41, 101071. doi:10.1016/j.uclim.2021.101071
Houssam, N., Ibrahiem, D. M., Sucharita, S., El-Aasar, K. M., Esily, R. R., and Sethi, N. (2023). Assessing the role of green economy on sustainable development in developing countries. Heliyon 9 (6), 17306. doi:10.1016/j.heliyon.2023.e17306
Lan, G., Xiao, Y., Ci, X. H., Zhang, Y. J., and Xia, J. (2024). Spatial and temporal differentiation characteristics of green development levels in urban agglomerations within the Yangtze River economic Belt and analysis of influencing factors. Ecol. Indic. 166, 112552. doi:10.1016/j.ecolind.2024.112552
LaReaux, J., and Watkins, D. (2025). Geospatial analysis for promoting urban green space equity: case study of Detroit, Michigan, USA. Urban For. Urban Green. 105, 128716. doi:10.1016/j.ufug.2025.128716
Li, G., Zhou, Y., Liu, F., and Wang, T. (2021). Regional differences of manufacturing green development efficiency considering undesirable outputs in the Yangtze River Economic Belt based on Super-SBM and WSR system methodology. Front. Environ. Sci. 8, 631911. doi:10.3389/fenvs.2020.631911
Li, W. J., Hu, D. C., Xu, Z. Q., Guo, J., Liu, J. N., and Zhou, Y. (2024). Pathways and enhanced evaluation system for green low-carbon development across diverse Chinese regions. Front. Public Health 12, 1465896. doi:10.3389/fpubh.2024.1465896
Li, W. M., Cai, Z. Y., and Jin, L. S. (2023). A spatial-temporal analysis on green development in China’s Yellow River Basin: model-based efficiency evaluation and influencing factors identification. Stoch. Environ. Res. Risk Assess. 37, 4431–4444. doi:10.1007/s00477-023-02516-y
Liang, K., Li, Z. F., and Luo, L. (2023b). Measurement, dynamic evolution and influencing factors of green development efficiency in western China: based on ecological-economic-social system. PLOS PLoS One 18, e0290472. doi:10.1371/journal.pone.0290472
Liang, L. N., Huai, H. J., and Tang, X. M. (2023a). Evaluation and driving factors analysis of agricultural green development level in Beijing from 1978 to 2022. Front. Ecol. Evol. 11, 1233388. doi:10.3389/fevo.2023.1233388
Liang, Y. X., Zhang, L. P., Leng, M. S., Xiao, Y., and Xia, J. (2022). System simulation and prediction of the green development level of the Chengdu-Chongqing city group. Water 14 (23), 3947. doi:10.3390/w14233947
Liu, B. L., Zheng, K. C., Zhu, M. J., Wu, F., and Zhao, X. F. (2023). Correction to: towards sustainability: the impact of industrial synergistic agglomeration on the efficiency of regional green development. Environ. Sci. Pollut. Res. 30, 85428. doi:10.1007/s11356-023-28796-z
Liu, X., He, Z., Deng, Z. X., and Poddar, S. (2024). Analysis of spatiotemporal disparities and spatial spillover effect of a low-carbon economy in Chinese provinces under green technology innovation. Sustainability 16 (21), 9434. doi:10.3390/su16219434
Liu, X., Zhang, J., Liu, T. H., and Zhang, X. J. (2022b). Can the special economic zones promote the green technology innovation of enterprises ? An evidence from China. Front. Environ. Sci. 10, 870019. doi:10.3389/fenvs.2022.870019
Liu, Y. B., Liu, W., Yan, Y. N., and Liu, C. Y. (2022a). A perspective of ecological civilization: research on the spatial coupling and coordination of the energy-economy-environment system in the Yangtze River Economic Belt. Environ. Monit. Assess. 194, 403. doi:10.1007/s10661-022-10065-0
Lu, J. C., Zhou, S. Q., Xiao, X. H., Zhong, M., and Zhao, Y. F. (2023). The dynamic evolution of the digital economy and its impact on the urban green innovation development from the perspective of driving force—taking China’s Yangtze River Economic Belt cities as an example. Sustainability 15, 6989. doi:10.3390/su15086989
Pan, X. T., and Zhao, J. L. (2025). Coupling coordination analysis and spatiotemporal heterogeneity between green space quality and economic development: a case study of the Yangtze River Delta in China. Sustainability 17 (5), 1778. doi:10.3390/su17051778
Pan, Y. J., Teng, T. W., Wang, S. P., and Wang, T. T. (2024). Impact and mechanism of urbanization on urban green development in the Yangtze River Economic Belt. Ecol. Indic. 158, 111612. doi:10.1016/j.ecolind.2024.111612
Peng, S. Y., and Yu, Y. J. (2024). Green development efficiency measurement and influencing factors analysis in the Yangtze River economic Belt, China. Ecol. Indic. 162, 112025. doi:10.1016/j.ecolind.2024.112025
Raman, R., Ray, S., Das, D., and Nedungadi, P. (2025). Innovations and barriers in sustainable and green finance for advancing sustainable development goals. Front. Environ. Sci. 12, 1513204. doi:10.3389/fenvs.2024.1513204
Said, Z. M., and Dindar, S. (2024). Key challenges and strategies in the evaluation of sustainable urban regeneration projects: insights from a systematic literature review. Sustainability 16 (22), 9903. doi:10.3390/su16229903
Sunita, S., Shahnawaz, S., Shekhar, S., and Kumar, D. (2023). Evaluating urban green and blue spaces with space-based multi-sensor datasets for sustainable development. Comput. Urban Sci. 3, 12. doi:10.1007/s43762-023-00091-0
Umar, M., Mirza, N., Umar, Z., and Sokolova, T. (2024). Green recovery in BRICS economies: the role of mineral resources, energy productivity, and green innovation in sustainable development. Resour. Policy 98, 105353. doi:10.1016/j.resourpol.2024.105353
Wang, H. J., and Zhang, J. X. (2023a). Spatio-temporal patterns and driving factors of green development level of urban agglomerations in the Yellow River Basin. Emerg. Mark. Financ. TR. 60 (4), 724–743. doi:10.1080/1540496X.2023.2253979
Wang, Q. J., Li, W. Z., Gong, Z. Y., and Fu, J. Y. (2024). The Coupling and coordination between digital economy and green economy: evidence from China. Emerg. Mark. Financ. TR. 61 (3), 562–578. doi:10.1080/1540496X.2024.2399555
Wang, S., and Li, J. Y. (2023b). Does digital transformation promote green and low-carbon synergistic development in enterprises? A dynamic analysis based on the perspective of Chinese listed enterprises in the heavy pollution industry. Sustainability 15, 15600. doi:10.3390/su152115600
Xu, G. Y., Chang, H. Y., Meng, L. Q., and Marma, K. J. S. (2022). Green development level, resource utilization, and ecological protection across China from 2006 to 2017: based on the national standard indicator system. Environ. Dev. 44, 100776. doi:10.1016/j.envdev.2022.100776
Xu, M. X., and Hu, W. Q. (2020). A research on coordination between economy, society and environment in China: a case study of Jiangsu. J. Clean. Prod. 258, 120641. doi:10.1016/j.jclepro.2020.120641
Yang, L., Xu, Y., Zhu, J. Q., and Sun, K. Y. (2024). Spatiotemporal evolution and influencing factors of the coupling coordination of urban ecological resilience and new quality productivity at the provincial scale in China. Land 13, 1998. doi:10.3390/land13121998
Yang, W. X., Hu, Y., Ding, Q. Y., Gao, H., and Li, L. G. (2023). Comprehensive evaluation and comparative analysis of the green development level of provinces in Eastern and Western China. Sustainability 15, 3965. doi:10.3390/su15053965
Yi, M., Xu, L. Y., Zhang, T., Ao, L., and Sun, M. (2025). The impact of foreign direct investment on green technology progress in China on two-carbon background: taking trade openness into consideration. Front. Environ. Sci. 12, 1533146. doi:10.3389/fenvs.2024.1533146
Yuan, H. X., Feng, Y. D., Lee, C. C., and Cen, Y. (2020). How does manufacturing agglomeration affect green economic efficiency. Energ. Econ. 92, 104944. doi:10.1016/j.eneco.2020.104944
Yuan, L., Li, R. Y., Wu, X., He, W. J., Kong, Y., Ramsey, T. S., et al. (2023). Decoupling of economic growth and resources-environmental pressure in the Yangtze River Economic Belt, China. Ecol. Indic. 153, 110399. doi:10.1016/j.ecolind.2023.110399
Yuan, W. H., Li, J. C., Meng, L., Qin, X. N., and Qi, X. X. (2019). Measuring the area green efficiency and the influencing factors in urban agglomeration. J. Clean. Prod. 241, 118092. doi:10.1016/j.jclepro.2019.118092
Zhang, K. L., Yang, Y. R., Wan, J. J., Wei, J. C., and Zhang, X. K. (2024c). Coupling synergy level and interaction effect between the ecological environment and low-carbon development in the Yangtze River Delta urban agglomeration: characteristics of spatial and temporal heterogeneity. Ecol. Indic. 166, 112535. doi:10.1016/j.ecolind.2024.112535
Zhang, L., Li, W. P., Chen, Z. S., Yin, Z. Q., Hu, R. L., Qin, C. R., et al. (2024a). Coupling coordination measurement and obstacle diagnosis of new urbanization and rural revitalization in the basin area of Sichuan province, China. Sustainability 16, 9209. doi:10.3390/su16219209
Zhang, L. J., Aihemaitijiang, G., Wan, Z. H., Li, M. T., Zhang, J. Q., Zhang, F., et al. (2025). Exploring spatio-temporal variations in water and land resources and their driving mechanism based on the coupling coordination model: a case study in Western Jilin province, China. Agriculture 15, 98. doi:10.3390/agriculture15010098
Zhang, X. L., Ding, R. Z., and Yang, W. (2024b). Study on spatial differentiation of digital economy and it’s driving factors in China: based on geodetector. Sustainability 16 (23), 10472. doi:10.3390/su162310472
Zhao, P. J., Zeng, L. E., Lu, H. Y., Zhou, Y., Hu, H. Y., and Wei, X. Y. (2020). Green economic efficiency and its influencing factors in China from 2008 to 2017: based on the super-SBM model with undesirable outputs and spatial Dubin model. Sci. Total Environ. 741, 140026. doi:10.1016/j.scitotenv.2020.140026
Zhou, L., Zhou, C. H., Che, L., and Bao, W. (2020). Spatio-temporal evolution and influencing factors of urban green development efficiency in China. J. Geogr. Sci. 30, 724–742. doi:10.1007/s11442-020-1752-5
Zhu, K. W., Song, D., Zhang, L. X., He, Y., Zhang, S., Liu, Y. Q., et al. (2023). Evolving trends and influencing factors of the rural green development level in Chongqing. Land 12, 1333. doi:10.3390/land12071333
Zhu, K. W., Wang, T. Y., He, J., Song, D., Wu, L. J., Wu, D., et al. (2024). Green development in the Chengdu-Chongqing economic zone: evolution and drivers from a “production-living-ecology” perspective. Front. Environ. Sci. 12, 1506618. doi:10.3389/fenvs.2024.1506618
Keywords: green development, entropy-topsis method, geographical detectors, spatio-temporal variation, driving factors
Citation: Ma L, Huang T, Chen H, Mao J, Cheng Z and Wang Y (2025) Evolving trends and driving factors analysis of green development level in Chengdu plain economic zone . Front. Environ. Sci. 13:1598148. doi: 10.3389/fenvs.2025.1598148
Received: 22 March 2025; Accepted: 23 April 2025;
Published: 09 May 2025.
Edited by:
Otilia Manta, Romanian Academy, RomaniaReviewed by:
Serdar Dindar, Yıldırım Beyazıt University, TürkiyeSandeep Poddar, Lincoln University College, Malaysia
Copyright © 2025 Ma, Huang, Chen, Mao, Cheng and Wang. This is an open-access article distributed under the terms of the Creative Commons Attribution License (CC BY). The use, distribution or reproduction in other forums is permitted, provided the original author(s) and the copyright owner(s) are credited and that the original publication in this journal is cited, in accordance with accepted academic practice. No use, distribution or reproduction is permitted which does not comply with these terms.
*Correspondence: Hao Chen, NjkwNzcyNjIwQHFxLmNvbQ==