 Yazhou Shao
 Yunxia Ma1,2*
- 1College of Desert Control Science and Engineering, Inner Mongolia Agricultural University, Hohhot, China
- 2State Key Laboratory of Water Engineering Ecology and Environment in Arid Area, Inner Mongolia Agricultural University, Hohhot, China
This study aims to investigate the impact of Pennisetum giganteum cultivation on soil stoichiometric ratios in different regions of Inner Mongolia (Naiman Banner, Ulan Buh Desert, and Tumd Left Banner), clarifying the relationship between years of cultivation and changes in soil nutrient contents as well as stoichiometric ratios, thereby providing a scientific basis for regional ecological restoration. The experimental design used Pennisetum giganteum as the research subject, establishing experimental plots in three regions. Soil samples from 0 to 100 cm at different depths were collected before planting (CK), after the first-year harvest (YK), and after the second-year harvest (EK). The contents of soil SOC, TN, and TP were measured, and the ratios of C/N, C/P, and N/P were calculated. Through one-way ANOVA and Pearson correlation analysis, the relationships among cultivation years, soil depth, and soil nutrients as well as stoichiometric ratios were evaluated. The results indicate that Pennisetum giganteum cultivation significantly increased soil nutrient contents. For example, in Naiman Banner, the soil layer of 0–10 cm showed an increase in C from 1.41 g/kg to 2.06 g/kg, N from 1.47 g/kg to 1.74 g/kg, and P from 1.27 g/kg to 1.85 g/kg. Changes in soil stoichiometric ratios varied with region and soil depth: in Tumd Left Banner, the C/N ratio generally decreased (e.g., from 1.48 to 0.77 in the 0–10 cm soil layer), indicating an accelerated rate of N accumulation; whereas in the Ulan Buh Desert, the C/N ratio exhibited an increasing trend, possibly due to more pronounced C accumulation under arid conditions. The C/P and N/P ratios decreased in most regions, reflecting an improvement in P availability. Correlation analysis revealed that cultivation years were significantly positively correlated with soil C, N, and P contents, while they were mostly negatively correlated with the C/P and N/P ratios.
1 Introduction
China’s land desertification problem is extremely severe, manifesting in multiple ways such as a decline in productivity, reduced surface vegetation cover, and diminished biodiversity (Lu et al., 2024). Desertification not only leads to a reduction in available land area but also triggers a series of disasters—including frequent sandstorms and widespread flooding—that have profound impacts on the economy, society, and ecological environment (Li et al., 2024). The deterioration of the ecosystem accompanied by economic impoverishment has become one of the major factors hindering China’s sustainable development. Inner Mongolia is among the provinces with the most concentrated and severe desertification; its desertified area ranks second in the country, only trailing Xinjiang, and its trend of desertification is particularly notable nationwide, making it a key region for national desertification monitoring and remediation (Zhao et al., 2022; Liao et al., 2020; Ren et al., 2023). Based on this, the present study selected three experimental sites: Ulan Buh Desert, Tumd Left Banner in Hohhot, and Naiman Banner in Tongliao. The causes of land desertification in Inner Mongolia are mainly attributed to both natural and anthropogenic factors. Among the natural factors, insufficient precipitation is one of the key reasons for desertification; the combination of scarce rainfall and high evaporation accelerates vegetation degradation and land desertification processes (Li and Narisu, 2011; Yao, 2018). As for anthropogenic factors, the combined effects of overgrazing, excessive logging, and other human activities, together with climatic changes, have disrupted the ecological balance of grasslands, leading to increasingly severe grassland and land desertification that significantly constrain regional economic and social development (Li, 2001; Wang et al., 2006; Nie et al., 2008). Therefore, it is particularly urgent to introduce a plant species that can not only effectively stabilize the wind and fix the sand but also yield certain economic benefits.
Pennisetum giganteum, a member of the genus Pennisetum within the Poaceae family, is a perennial, erect, clump-forming plant whose distribution extends from Hainan in southern China to the northern region of Inner Mongolia (Zhou et al., 2020). This plant primarily relies on asexual reproduction, with its root system being exceptionally well-developed; it possesses a large number of adventitious and lateral roots that enable it to maintain robust vitality even in deep soil layers (Ma et al., 2023). These characteristics make Pennisetum giganteum an optimal choice for combating soil erosion. It not only enhances soil quality by optimizing soil structure, increasing organic matter content, and activating microbial activity, but also effectively prevents land degradation and desertification (Li et al., 2020; Sheng, 2023). In addition to its tall stature, Pennisetum giganteum yields impressive biomass that is rich in crude protein and crude fiber, allowing for multiple harvests annually. Its nutritional value is particularly high during the seedling stage, and its palatable taste renders it a superior forage resource. The three primary nutrients essential for plant growth—carbon (C), nitrogen (N), and phosphorus (P)—play crucial roles in plant physiological processes and are closely interrelated [15–16]. The ratios of C/N, C/P, and N/P in soil are key indicators of the composition and quality of soil organic matter, revealing the efficiency of nutrient utilization by plants and the extent of nutrient limitations(Cheng et al., 2010). Specifically, the soil C/N ratio reflects the mineralization rate of organic matter (Wang and Yu, 2008): a ratio exceeding 25 indicates that the accumulation of organic matter surpasses its decomposition rate, while a ratio between 12 and 16 suggests active decomposition of organic matter (Bui and Henderson, 2013). The soil C/P ratio demonstrates the capacity of soil microorganisms to mineralize organic matter and release phosphorus(Tao et al., 2017), whereas the soil N/P ratio serves as a diagnostic indicator for nitrogen saturation, helping to determine the critical point of nutrient limitation (Huang and Yuan, 2020).
Based on the aforementioned background, this study poses the following specific research questions: First, under varying planting durations, how does Pennisetum giganteum affect the contents of C, N, and P in soils at different vertical depths (0–100 cm) across Ulan Buh Desert, Tumd Left Banner, and Naiman Banner? Second, what changes occur in the stoichiometric ratios (C/N, C/P, and N/P) of soils in these three regions as a result of Pennisetum giganteum plantation over different planting years? Third, what is the relationship between soil nutrient contents, their stoichiometric ratios, and the duration of planting?
This study focuses on Pennisetum giganteum and conducted planting experiments in the Ulan Buh Desert, Tumd Left Banner, and Naiman Banner. Soil samples were collected at various vertical depths (0–10 cm, 10–20 cm, 20–40 cm, 40–60 cm, 60–80 cm, and 80–100 cm) to determine the content of C, N, and P in the soil after 2 years of cultivation. Subsequently, the soil C/N, C/P, and N/P ratios were calculated to analyze the influence of different planting durations on the stoichiometric characteristics of soils at varying depths. The results are intended to provide data support for the formulation of scientifically sound ecological restoration strategies and to serve as a reference for preventing land desertification in Inner Mongolia and maintaining regional ecological security.
2 Materials and methods
2.1 Overview of the study area
This experiment selected the Ulan Buh Desert, Tumd Left Banner, and Naiman Banner in Inner Mongolia as the research areas.
The Ulan Buh Desert study area is located in the northeastern part, with geographic coordinates ranging from 106°35′ to 106°59′ in longitude and 40°17′ to 40°29′ in latitude. This region is adjacent to the Yellow River and lies in a transitional zone between desert and desert grassland, characterized by an Asian temperate desert climate. The climate is notably arid with limited rainfall, a significant diurnal temperature range, an annual mean temperature of 7.5°C, and a frost-free period of approximately 160–170 days.
The Tumd Left Banner is situated between 110°46′ and 112°10′ in longitude and 40°51′ and 41°8′ in latitude, positioned on the Inner Mongolian Plateau within the middle section of the Yinshan Mountains, specifically in the central area of the Daqing Mountains. This area features a temperate continental climate, characterized by dryness, scarce precipitation, a short frost-free period, and an annual mean temperature of 7.3°C.
The Naiman Banner study area is located in the southeastern part of the Horqin Sandy Land, with geographic coordinates ranging from 120°19′ to 121°35′ in longitude and 42°14′ to 43°32′ in latitude (Figure 1). This region exhibits a temperate semi-arid climate, with a pronounced diurnal temperature variation, extreme low temperatures reaching as low as −29.3°C, extreme high temperatures up to 39°C, and a frost-free period of 135–140 days.
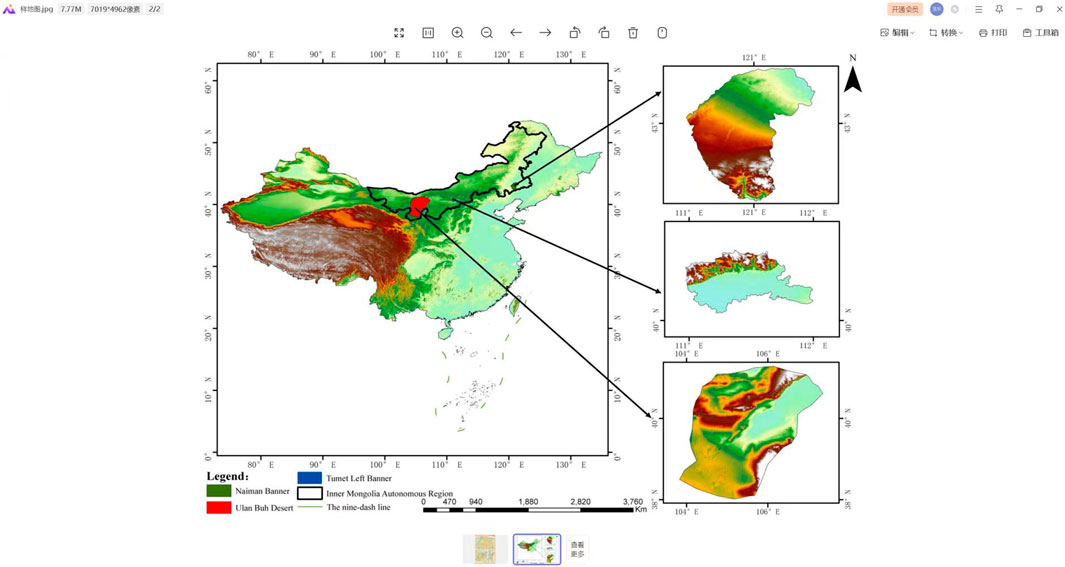
Figure 1. Overview of the study area.
2.2 Experimental design
This study selected experimental sites in the eastern Ulan Buh Desert Pennisetum giganteum plantation area, the Hailutuo plantation area in Tumd Left Banner, and the Pennisetum giganteum plantation area in the western Khorchin sandy land of Naiman Banner, Inner Mongolia. All three sites began the introduction trials in 2018. Due to the relatively weak cold tolerance of Pennisetum giganteum, which makes natural overwintering in northern regions difficult, the harvest was scheduled during the autumn and winter seasons while retaining the root systems in the soil. In the following spring, the land was tilled and Pennisetum giganteum was replanted in the original plots. During the experiment, soil samples were collected at three stages: before planting (CK), after the first year’s harvest (YK), and after the second year’s harvest (EK), with the specific sampling times occurring in mid-October of 2018, 2019, and 2020, respectively.
Each study plot was a rectangle measuring 40 × 50 m. In terms of irrigation, water was applied during the growing season based on local climatic conditions and soil moisture status. During the experimental period from 2018 to 2020, the irrigation period each year commenced after the spring planting of Pennisetum giganteum and concluded before the autumn harvest. In 2018, during the vigorous growth phase of Pennisetum giganteum (June to August), irrigation was conducted three times per month, with an application rate of approximately 0.06 m3 per square meter per event; during the other months, irrigation was applied one to two times per month at approximately 0.03 m3 per square meter per event, resulting in a total annual irrigation of about 0.78 m3 per square meter. The irrigation patterns in 2019 and 2020 were essentially the same as in 2018; however, due to slight climatic variations, the total annual irrigation was approximately 0.75 m3 per square meter in 2019 and 0.80 m3 per square meter in 2020. In terms of fertilization, a compound fertilizer containing nitrogen, phosphorus, and potassium (N:P:K = 15:15:15) was used. Prior to spring planting each year, 0.075 kg of base fertilizer was applied per square meter, and during the growth of Pennisetum giganteum, top-dressing was carried out in June and August, with 0.03 kg applied per square meter at each occasion. Additionally, for comparative analysis, soil samples were collected from adjacent bare sandy areas to serve as controls. In each study plot, soil samples were collected three times using an S-shaped sampling design. For sampling, soil profiles were first excavated, and then soil samples were collected in layers along the vertical profile (0–100 cm). Nutrient analyses conducted on the collected soil samples further evaluated the ameliorative effect of Pennisetum giganteum on the spatial distribution of soil nutrients and its ecological restoration function.
2.3 Determination of indicators and calculation of stoichiometric ratios
After natural air-drying and sieving through a 0.25 mm mesh, the soil samples were first subjected to the determination of C, N, and P contents. Carbon was measured using the potassium dichromate oxidation method with heating, nitrogen by the Kjeldahl method, and phosphorus by the molybdenum-antimony colorimetric method (Li, 2000). Based on the measured contents of C, N, and P, the ratios of C/N, C/P, and N/P were subsequently calculated (Dong et al., 2019). The determination and calculation of these indices provide an important basis for assessing soil nutrient status and its stoichiometric characteristics.
2.4 Data processing
2.4.1 Data organization and preliminary statistics
The original data were organized using Excel 2019, including the computation of the mean, standard deviation, and 95% confidence interval (CI) for soil C, N, and P contents. Data were standardized to ensure the accuracy of subsequent analyses.
2.4.2 One-way analysis of variance (ANOVA)
One-way ANOVA was conducted using SPSS 26.0 to compare the significant differences in soil C, N, and P contents and stoichiometric ratios (C/N, C/P, N/P) under different planting durations (CK, YK, EK) and soil layer depths (0–100 cm stratification). The significance level was set at p < 0.05. If the results were significant, further multiple comparisons (e.g., Tukey HSD test) were performed to clarify specific differences among the groups.
2.4.3 Correlation analysis
Pearson correlation coefficients were used to analyze the relationships between planting duration, soil layer depth, and soil C, N, and P contents as well as stoichiometric ratios. The strength of the correlations was assessed based on significance levels (p ≤ 0.05, p ≤ 0.01, p ≤ 0.001), and a heatmap (e.g., Figures 5–7) was generated to visually illustrate the trends in correlation.
2.4.4 Data visualization
Charts were created using Origin 2021, including bar charts (Figures 2–4) that display the variations in C, N, and P contents across different soil layers and planting durations, as well as tables (Tables 1–3) summarizing the patterns in stoichiometric ratios. The charts were annotated with Mean ± SD and the 95% CI to ensure the completeness of data representation.
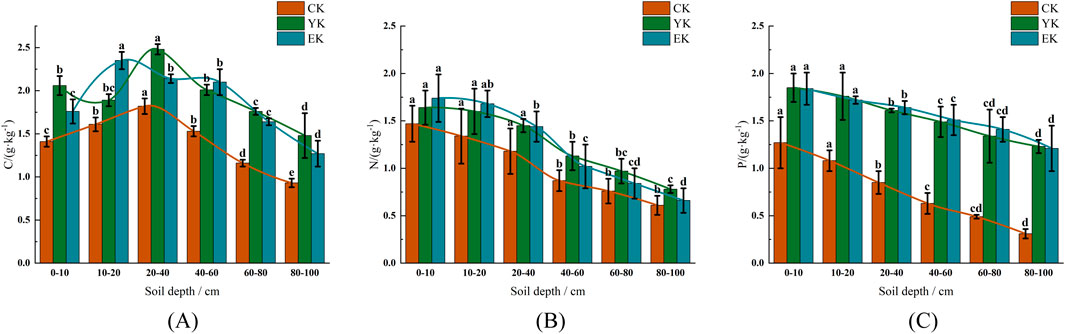
Figure 2. Contents of C, N and P in soil under different planting years of Naiman Banner Pennisetum giganteum. (A) C; (B) N; (C) P.Note: Different letters indicate significant differences at P < 0.05.
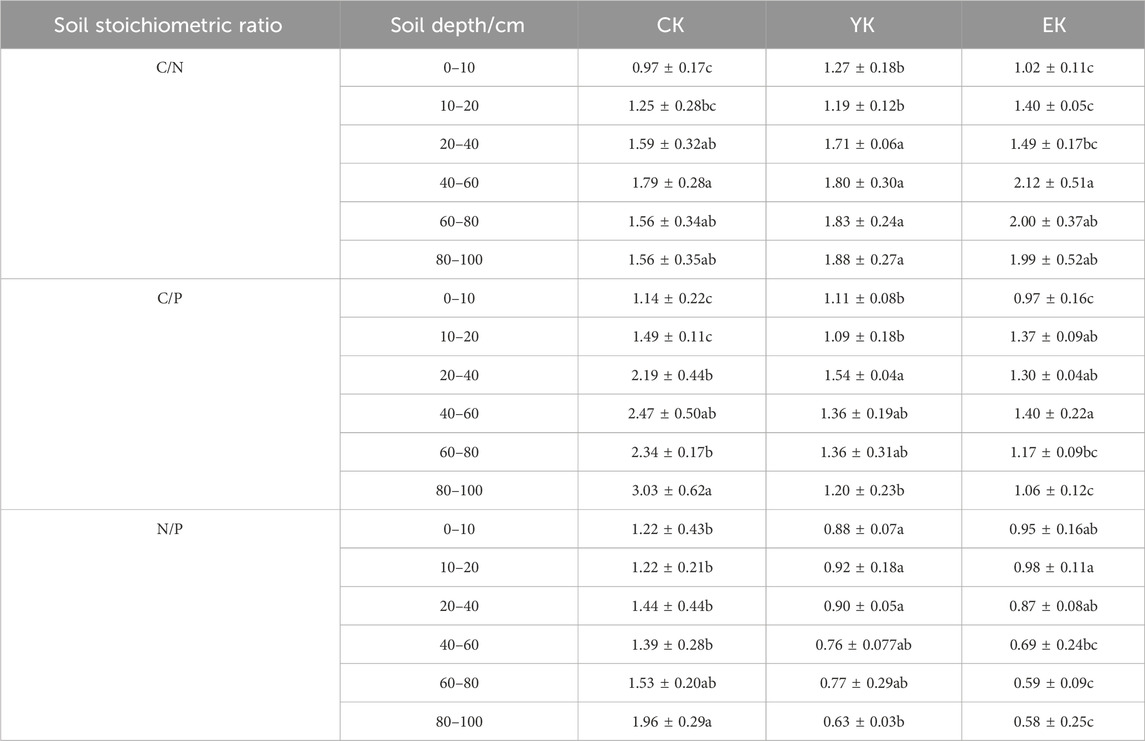
Table 1. Soil stoichiometry under different planting years of Pennisetum giganteum in Naiman Banner.
3 Results
3.1 Changes in C, N, and P contents in soil under different planting years of Pennisetum giganteum in inner Mongolia
3.1.1 Changes in soil C, N, and P contents under different planting years of Pennisetum giganteum in Naiman Banner
In the Naiman Banner experimental area, Pennisetum giganteum planting significantly increased soil C content (Figure 2A). Before planting (CK), the C content in 0–10 cm soil layer was 1.41 ± 0.06 g/kg (95% CI: 1.31–1.51 g/kg), which decreased significantly with the deepening of soil layer (P < 0.05), and it was only 0.93 ± 0.05 g/kg (95% CI: 0.84–1.02 g/kg) in 80–100 cm soil layer. After harvest in the first year (YK), the C content in 0–10 cm soil layer increased significantly to 2.06 ± 0.11 g/kg (95% CI: 1.87–2.25 g/kg, P < 0.05), and reached the peak of 2.48 ± 0.06 g/kg (95% CI: 2.39–2.58 g/kg) in 20–40 cm soil layer. After harvest in the second year (EK), the surface C content decreased slightly (1.76 ± 0.14 g/kg, 95% CI: 1.53–2.00 g/kg), but the 10–20 cm soil layer increased significantly to 2.35 ± 0.10 g/kg (95% CI: 2.19–2.52 g/kg, P < 0.05), indicating that Pennisetum giganteum had a more lasting effect on the improvement of middle soil.
Soil N content increased significantly with the increase of planting years (Figure 2B). In the CK stage, the N content in the 0–10 cm soil layer was 1.47 ± 0.19 g/kg (95% CI: 1.17–1.78 g/kg), and the deep layer (80–100 cm) decreased to 0.61 ± 0.10 g/kg (95% CI: 0.44–0.78 g/kg). In the YK stage, the surface N content increased to 1.64 ± 0.18 g/kg (95% CI: 1.35–1.93 g/kg, P < 0.05), and the 20–40 cm soil layer maintained a high level (1.45 ± 0.07 g/kg). At the EK stage, the N content in the 0–10 cm soil layer further increased to 1.74 ± 0.25 g/kg (95% CI: 1.35–2.15 g/kg), but the increase in the deep layer (80–100 cm) was small (0.66 ± 0.13 g/kg), indicating that N accumulation was mainly concentrated in the surface layer.
Pennisetum giganteum planting significantly increased soil P content (Figure 2C). In the CK stage, the P content in the 0–10 cm soil layer was 1.27 ± 0.27 g/kg (95% CI: 0.84–1.70 g/kg), and the deep layer (80–100 cm) was significantly reduced to 0.31 ± 0.05 g/kg (P < 0.05). In the YK stage, the P content in the surface layer reached 1.85 ± 0.15 g/kg (95% CI: 1.62–2.09 g/kg, P < 0.05), and the P content in each soil layer increased significantly. In the EK stage, P content remained stable, 1.84 ± 0.17 g/kg (95% CI: 1.57–2.12 g/kg) in the 0–10 cm soil layer, but the increase in the deep layer (80–100 cm) slowed down (1.21 ± 0.24 g/kg), indicating that the improvement effect of P decreased with depth.
3.1.2 Changes in soil C, N, and P contents under Pennisetum giganteum of different planting years in Tumed Left Banner
In the Tumd Left Banner test area, Pennisetum giganteum planting significantly affected the content of soil C, N and P, and the response of different soil depths was different. As shown in Figure 3A, before planting (CK), soil C content decreased significantly with the increase of soil depth (P < 0.05), which was 1.54 ± 0.01 g/kg (95% CI: 1.53–1.57 g/kg) in 0–10 cm soil layer and 0.63 ± 0.13 g/kg (95% CI: 0.42–0.85 g/kg) in 80–100 cm soil layer. After the first year of harvest (YK), the C content of each soil layer increased significantly (P < 0.05), the 0–10 cm soil layer increased to 1.84 ± 0.15 g/kg (95% CI: 1.59–2.09 g/kg), and the 20–40 cm soil layer reached the peak (2.33 ± 0.19 g/kg, 95% CI: 2.01–2.65 g/kg). After harvest in the second year (EK), the C content in the surface layer (0–10 cm) further increased to 1.98 ± 0.04 g/kg (95% CI: 1.91–2.05 g/kg), while that in the deep layer (80–100 cm) decreased slightly (1.36 ± 0.27 g/kg, 95% CI: 0.93–1.79 g/kg), but was still significantly higher than that of CK (P < 0.05).
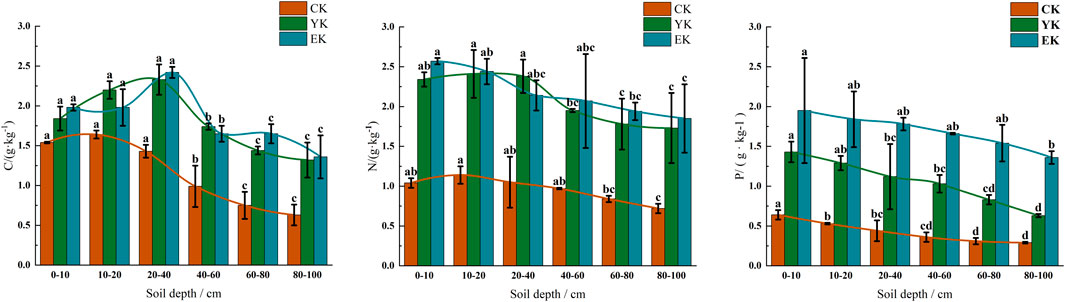
Figure 3. The contents of C, N and P in soil under different planting years of Tumd Left Banner Pennisetum giganteum. (A) C; (B) N; (C) P. Note: Different letters indicate significant differences at P < 0.05.
It can be seen from Figure 3B that in CK stage, N content decreased with depth (0–10 cm: 1.04 ± 0.06 g/kg, 95% CI: 0.94–1.14 g/kg; 80–100 cm: 0.72 ± 0.06 g/kg, 95% CI: 0.61–0.83 g/kg). In the YK stage, N content increased significantly (P < 0.05), reaching 2.34 ± 0.09 g/kg (95% CI: 2.18–2.50 g/kg) in the 0–10 cm soil layer and 2.41 ± 0.30 g/kg (95% CI: 1.93–2.90 g/kg) in the 10–20 cm soil layer. In the EK stage, the surface N content continued to increase to 2.57 ± 0.04 g/kg (95% CI: 2.51–2.63 g/kg), but the content of some deep layers (80–100 cm) fluctuated slightly (1.85 ± 0.43 g/kg, 95% CI: 1.15–2.55 g/kg), which was still significantly higher than that of CK (P < 0.05).
As shown in Figure 3C, in the CK stage, P content decreased significantly from the surface layer (0–10 cm: 0.64 ± 0.06 g/kg, 95% CI: 0.55–0.75 g/kg) to the deep layer (80–100 cm: 0.29 ± 0.01 g/kg, 95% CI: 0.27–0.32 g/kg) (P < 0.05). In the YK stage, the P content increased significantly (P < 0.05), reaching 1.43 ± 0.13 g/kg (95% CI: 1.23–1.64 g/kg) in the 0–10 cm soil layer. In the EK stage, the P content increased further, with 1.95 ± 0.66 g/kg (95% CI: 0.90–3.01 g/kg) in the 0–10 cm soil layer, but the increase in the deep layer (80–100 cm) slowed down (1.36 ± 0.08 g/kg, 95% CI: 1.24–1.50 g/kg).
3.1.3 Changes in C, N, and P contents in soil under different planting years of Pennisetum giganteum in Ulan Buh Desert
In the Ulan Buh Desert experimental area, Pennisetum giganteum planting significantly affected the content of soil C, N and P, and the response of different soil depths was significantly different. As shown in Figure 4A, before planting (CK), soil C content decreased significantly with the increase of soil depth (P < 0.05), 0.87 ± 0.08 g/kg (95% CI: 0.74–1.01 g/kg) in 0–10 cm soil layer and 0.27 ± 0.01 g/kg (95% CI: 0.26–0.28 g/kg) in 80–100 cm soil layer. After the first year of harvest (YK), the C content in each soil layer increased significantly (P < 0.05), and the 10–20 cm soil layer reached the peak (1.58 ± 0.10 g/kg, 95% CI: 1.42–1.76 g/kg), while the 80–100 cm soil layer had the lowest content due to weak root activity (0.06 ± 0.017 g/kg, 95% CI: 0.04–0.09 g/kg). After the second year of harvest (EK), the C content in the surface layer (0–10 cm) further increased to 1.58 ± 0.12 g/kg (95% CI: 1.39–1.78 g/kg), and the deep layer (80–100 cm) significantly recovered to 0.61 ± 0.01 g/kg (95% CI: 0.58–0.64 g/kg), but it was still lower than the shallow level (P < 0.05).
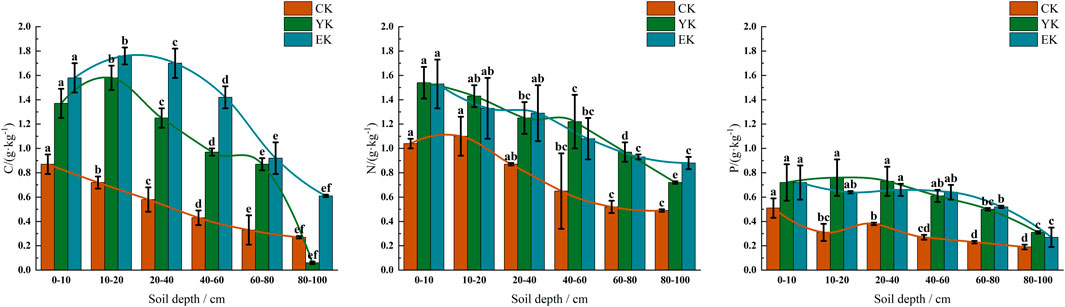
Figure 4. Contents of C, N and P in soil under different planting years of Ulan Buh Desert Pennisetum giganteum. (A) C; (B) N; (C) P. Note: Different letters indicate significant differences at P < 0.05.
As shown in Figure 4B, in the CK stage, the N content was the highest in the 0–10 cm soil layer (1.04 ± 0.04 g/kg, 95% CI: 0.96–1.12 g/kg), and decreased with depth to 80–100 cm (0.49 ± 0.01 g/kg, 95% CI: 0.47–0.51 g/kg). In the YK stage, N content increased significantly (P < 0.05), reaching 1.54 ± 0.13 g/kg (95% CI: 1.33–1.75 g/kg) in the 0–10 cm soil layer, but the increase in the deep layer (80–100 cm) was small (0.72 ± 0.01 g/kg, 95% CI: 0.70–0.75 g/kg). At the EK stage, the surface N content remained stable (1.53 ± 0.20 g/kg, 95% CI: 1.21–1.85 g/kg), while the deep layer (80–100 cm) increased significantly to 0.88 ± 0.05 g/kg (95% CI: 0.79–0.97 g/kg), indicating that the improvement of Pennisetum giganteum on deep soil was lagging.
As shown in Figure 4C, in the CK stage, P content decreased significantly from the surface layer (0–10 cm: 0.51 ± 0.08 g/kg, 95% CI: 0.38–0.64 g/kg) to the deep layer (80–100 cm: 0.19 ± 0.02 g/kg, 95% CI: 0.16–0.23 g/kg) (P < 0.05). At YK stage, P content increased significantly in 0–40 cm soil layer (P < 0.05), and reached 0.76 ± 0.15 g/kg (95% CI: 0.53–1.01 g/kg) in 10–20 cm soil layer. In the EK stage, P content remained stable in the surface layer (0–10 cm) (0.72 ± 0.14 g/kg, 95% CI: 0.49–0.96 g/kg), but decreased to 0.27 ± 0.08 g/kg (95% CI: 0.13–0.41 g/kg) in the deep layer (80–100 cm).
3.2 Soil stoichiometric ratio of Pennisetum giganteum under different planting years in inner Mongolia
3.2.1 Changes in soil stoichiometric ratio under different planting years of Pennisetum giganteum in Naiman Banner
As shown in Table 1, there are differences in the variation of C/N ratio across each soil layer. Some soil layers showed an upward trend after harvest in the first year, but decreased after harvest in the second year, while others showed continuous growth. Specifically, the C/N ratio in the 0–10 cm soil layer increased from the initial 0.97 to 1.27 (an increase of 0.30) after the first year of harvest, but fell back to 1.02 (a decrease of 0.25) after the second year of harvest. The C/N ratio of the 10–20 cm soil layer decreased slightly from 1.25 to 1.19 (a decrease of 0.06), and then increased to 1.40 (an increase of 0.21) in the second year. The C/N ratio of the 20–40 cm soil layer increased from 1.59 to 1.71 (an increase of 0.12), but decreased to 1.49 (a decrease of 0.22) in the second year. The C/N ratio of the 40–60 cm soil layer increased slightly from 1.79 to 1.80 (an increase of 0.01), and further increased to 2.12 (an increase of 0.32) in the second year. The C/N ratio of the 60–80 cm soil layer increased from 1.56 to 1.83 (an increase of 0.27) in the first year, and continued to increase to 2.00 (an increase of 0.17) in the second year. The C/N ratio of the 80–100 cm soil layer increased from 1.56 to 1.88 (an increase of 0.32) in the first year, and further increased to 1.99 (an increase of 0.11) in the second year.
The C/P ratio generally showed a downward trend in each soil layer, particularly in the deep soil. The C/P ratio in the 0–10 cm soil layer decreased from 1.14 at the beginning to 1.11 after the first year of harvest (a decrease of 0.03), and further decreased to 0.97 (a decrease of 0.14) in the second year. The C/P ratio of the 10–20 cm soil layer decreased from 1.49 to 1.09 (a decrease of 0.40), and increased to 1.37 (an increase of 0.28) in the second year. The C/P ratio of the 20–40 cm soil layer decreased from 2.19 to 1.54 (a decrease of 0.65) in the first year, and continued to decrease to 1.30 (a decrease of 0.24) in the second year. The C/P ratio of the 40–60 cm soil layer decreased significantly from 2.47 to 1.36 (a decrease of 1.11), and increased slightly to 1.40 (an increase of 0.04) in the second year. The C/P ratio of the 60–80 cm soil layer decreased from 2.34 to 1.36 (a decrease of 0.98) in the first year, and continued to decrease to 1.17 (a decrease of 0.19) in the second year. The C/P ratio of the 80–100 cm soil layer decreased significantly from 3.03 to 1.20 (1.83), and further decreased to 1.06 (0.14) in the second year.
The N/P ratio generally showed a downward trend in each soil layer. The N/P ratio of the 0–10 cm soil layer decreased from 1.22 at the beginning to 0.88 after the first year of harvest (a decrease of 0.34), and increased slightly to 0.95 in the second year (an increase of 0.07). The N/P ratio in the 10–20 cm soil layer decreased from 1.22 to 0.92 (a decrease of 0.30), and increased to 0.98 (an increase of 0.06) in the second year. The N/P ratio in the 20–40 cm soil layer decreased from 1.44 to 0.90 (a decrease of 0.54), and continued to decrease to 0.87 (a decrease of 0.03) in the second year. The N/P ratio of the 40–60 cm soil layer decreased significantly from 1.39 to 0.76 (a decrease of 0.63), and further decreased to 0.69 (a decrease of 0.07) in the second year. The N/P ratio in the 60–80 cm soil layer decreased from 1.53 to 0.77 (a decrease of 0.76) in the first year, and continued to decrease to 0.59 (a decrease of 0.18) in the second year. The N/P ratio in the 80–100 cm soil layer decreased significantly from 1.96 to 0.63 (1.33) in the first year, and decreased slightly to 0.58 (0.05) in the second year.
3.2.2 Soil stoichiometric ratio changes under different planting years of Pennisetum giganteum in Tumd Left Banner
Table 2 reveals that the C/N generally decreases with depth in different soil layers. In the 0–10 cm soil layer, the C/N ratio decreased significantly from 1.48 before planting to 0.78 (a decrease of 0.70) after the first year of harvest, and slightly decreased to 0.77 (a decrease of 0.01) in the second year. In the 10–20 cm soil layer, the C/N ratio decreased from 1.45 to 0.92 (a decrease of 0.53), and continued to decrease to 0.82 (a further decrease of 0.10) in the second year. In the 20–40 cm soil layer, the C/N ratio decreased from 1.45 to 0.98 (a decrease of 0.47), and increased to 1.14 (an increase of 0.16) in the second year. In the 40–60 cm soil layer, the C/N ratio decreased from 1.02 to 0.88, a 0.14 decrease, and continued to decrease to 0.85, a further 0.03 decrease, in the second year. In the 60–80 cm soil layer, the C/N ratio decreased from 0.88 to 0.83 (a decrease of 0.05), and increased slightly to 0.85 (an increase of 0.02) in the second year. In the 80–100 cm soil layer, the C/N ratio decreased from 0.88 to 0.77 (a decrease of 0.11), and continued to decrease to 0.75 (a further decrease of 0.02) in the second year.
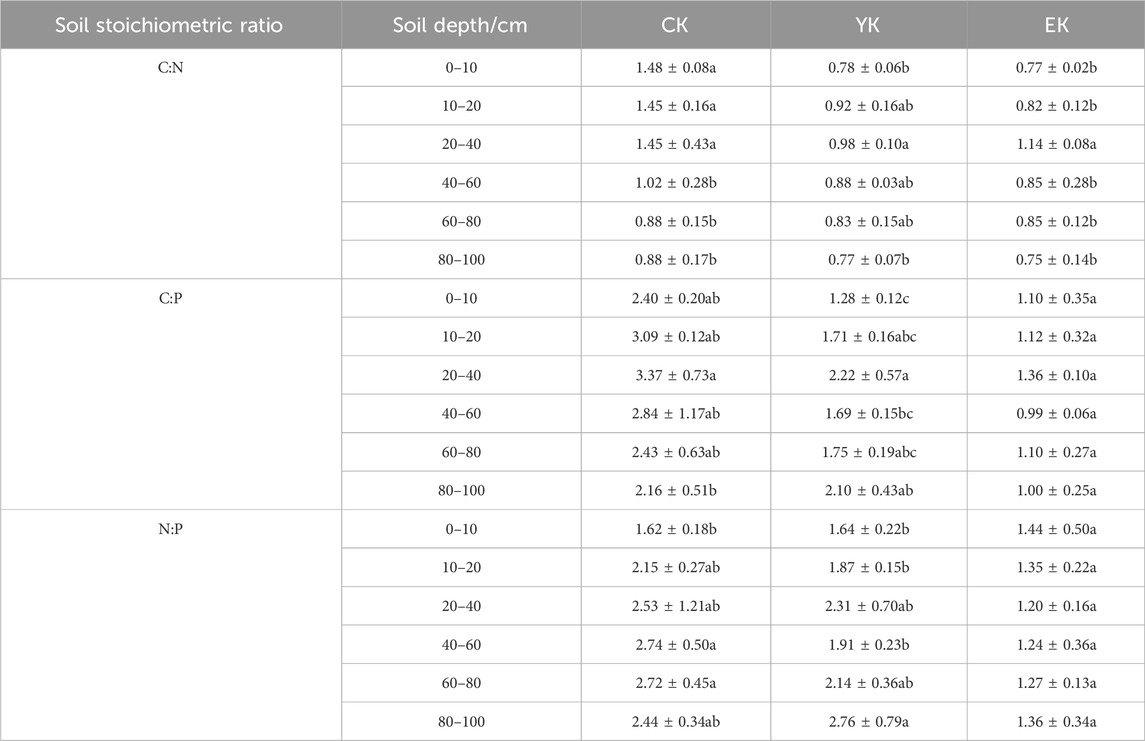
Table 2. Soil stoichiometric ratio of Pennisetum giganteum under different planting years in Tumed Left Banner.
The C/P generally exhibited a downward trend across different soil layers. In the 0–10 cm soil layer, the C/P ratio decreased from 2.40 before planting to 1.28 (a decrease of 1.12) after harvest in the first year, and continued to decrease to 1.10 (a further decrease of 0.18) in the second year. In the 10–20 cm soil layer, the C/P ratio decreased from 3.09 to 1.71 (a decrease of 1.38), and further decreased to 1.12 (a decrease of 0.59) in the second year. In the 20–40 cm soil layer, the C/P ratio decreased from 3.37 to 2.22 (a decrease of 1.15), and continued to decrease to 1.36 (a decrease of 0.86) in the second year. In the 40–60 cm soil layer, the C/P ratio decreased from 2.84 to 1.69 (a decrease of 1.15), and further decreased to 0.99 (a decrease of 0.70) in the second year. In the 60–80 cm soil layer, the C/P ratio decreased from 2.43 to 1.75 (a decrease of 0.68), and continued to decrease to 1.10 (a further decrease of 0.65) in the second year. In the 80–100 cm soil layer, the C/P ratio decreased slightly from 2.16 to 2.10 (a decrease of 0.06), and decreased significantly to 1.00 (a decrease of 1.10) in the second year.
The change trend of nitrogen and phosphorus ratio (N/P) in different soil layers is more complex. In the 0–10 cm soil layer, the N/P ratio increased slightly from 1.62 before planting to 1.64 after harvest in the first year (an increase of 0.02), and decreased to 1.44 in the second year (a decrease of 0.20). In the 10–20 cm soil layer, the N/P ratio decreased from 2.15 to 1.87 (a decrease of 0.28), and continued to decrease to 1.35 (a further decrease of 0.52) in the second year. In the 20–40 cm soil layer, the N/P ratio decreased from 2.53 to 2.31 (a decrease of 0.22), and decreased significantly to 1.20 (a decrease of 1.11) in the second year. In the 40–60 cm soil layer, the N/P ratio decreased from 2.74 to 1.91 (a decrease of 0.83), and continued to decrease to 1.24 (a further decrease of 0.67) in the second year. In the 60–80 cm soil layer, the N/P ratio decreased from 2.72 to 2.14 (a decrease of 0.58), and further decreased to 1.27 (a decrease of 0.87) in the second year. In the 80–100 cm soil layer, the N/P ratio increased from 2.44 to 2.76 (an increase of 0.32), and decreased significantly to 1.36 (a decrease of 1.40) in the second year.
3.2.3 Changes in soil stoichiometric ratio under different planting years of Pennisetum giganteum in Ulan Buh Desert
As shown in Table 3, the C/N generally exhibited an increasing trend across different soil layers. In the 0–10 cm soil layer, the C/N ratio increased from 0.84 before planting to 0.89 after the first year of harvest (an increase of 0.05), and continued to increase to 1.04 (an increase of 0.15) in the second year. In the 10–20 cm soil layer, the C/N ratio significantly increased from 0.67 to 1.11 (a 0.44 increase), and further increased to 1.35 (a 0.24 increase) in the second year. In the 20–40 cm soil layer, the C/N ratio increased from 0.66 to 1.01 (an increase of 0.35), and continued to increase to 1.34 (a further increase of 0.33) in the second year. In the 40–60 cm soil layer, the C/N ratio increased slightly from 0.79 to 0.82 (an increase of 0.03), and increased significantly to 1.33 (an increase of 0.51) in the second year. In the 60–80 cm soil layer, the C/N ratio increased from 0.64 to 0.90 (an increase of 0.26), and continued to increase to 0.99 (an additional increase of 0.09) in the second year. In the 80–100 cm soil layer, the C/N ratio decreased significantly from 0.55 to 0.08 (a decrease of 0.47), and increased to 0.69 (an increase of 0.61) in the second year.
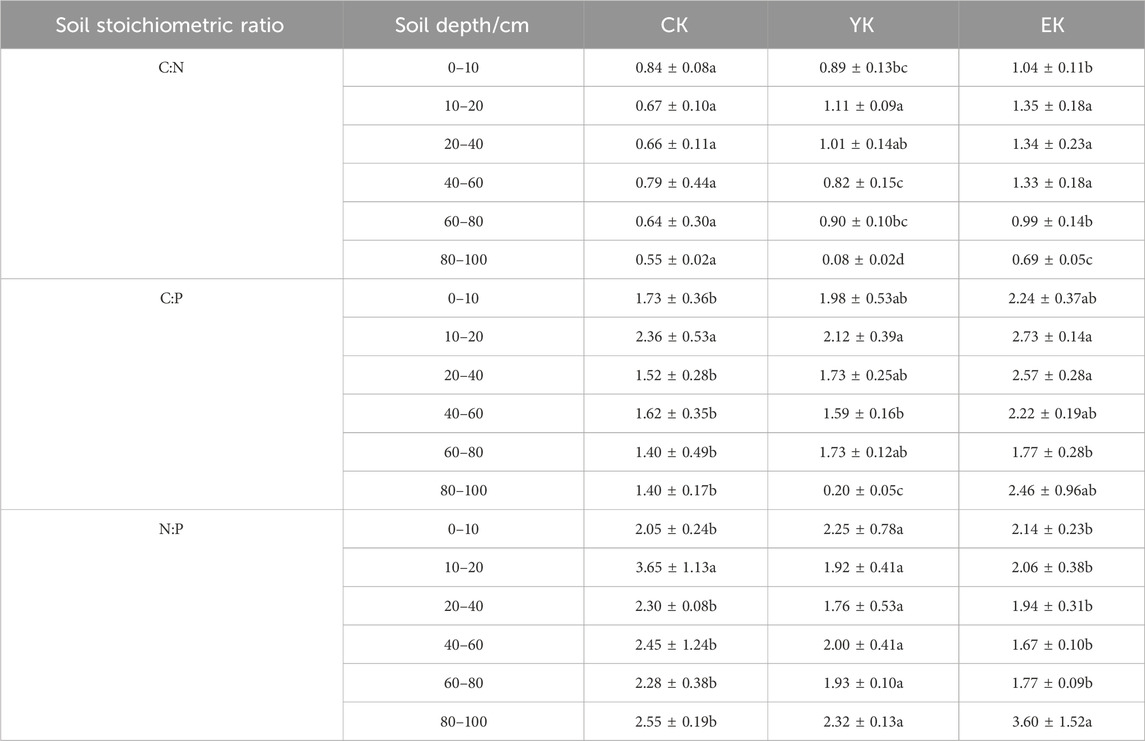
Table 3. Soil stoichiometric ratio under different planting years of Pennisetum giganteum in Ulan Buh Desert.
The C/P fluctuated across different soil layers. In the 0–10 cm soil layer, the C/P ratio increased from 1.73 before planting to 1.98 after harvest in the first year (an increase of 0.25), and continued to increase to 2.24 in the second year (an increase of 0.26). In the 10–20 cm soil layer, the C/P ratio decreased from 2.36 to 2.12 (a decrease of 0.24), and increased to 2.73 (an increase of 0.61) in the second year. In the 20–40 cm soil layer, the C/P ratio increased from 1.52 to 1.73 (an increase of 0.21), and significantly increased to 2.57 (an increase of 0.84) in the second year. In the 40–60 cm soil layer, the C/P ratio decreased slightly from 1.62 to 1.59 (a decrease of 0.03), and increased significantly to 2.22 (an increase of 0.63) in the second year. In the 60–80 cm soil layer, the C/P ratio increased from 1.40 to 1.73, an increase of 0.33, and continued to increase to 1.77, a further increase of 0.04, in the second year. In the 80–100 cm soil layer, the C/P ratio decreased significantly from 1.40 to 0.20 (a decrease of 1.20), and increased significantly to 2.46 (an increase of 2.26) in the second year.
The N/P ratio fluctuated in different soil layers. In the 0–10 cm soil layer, the N/P ratio increased from 2.05 before planting to 2.25 after harvest in the first year (an increase of 0.20), and decreased to 2.14 in the second year (a decrease of 0.11). In the 10–20 cm soil layer, the N/P ratio decreased significantly from 3.65 to 1.92 (a 1.73 decrease), and increased to 2.06 (+0.14) in the second year. In the 20–40 cm soil layer, the N/P ratio decreased from 2.30 to 1.76 (a 0.54 decrease), and increased to 1.94 (a 0.18 increase) in the second year. In the 40–60 cm soil layer, the N/P ratio decreased from 2.45 to 2.00 (a decrease of 0.45), and continued to decrease to 1.67 (a further decrease of 0.33) in the second year. In the 60–80 cm soil layer, the N/P ratio decreased from 2.28 to 1.93 (a decrease of 0.35), and continued to decrease to 1.77 (a further decrease of 0.16) in the second year. In the 80–100 cm soil layer, the N/P ratio decreased from 2.55 to 2.32 (a decrease of 0.23), and increased significantly to 3.60 (an increase of 1.28) in the second year.
3.3 Correlation of Pennisetum giganteum planting years with soil C, N, P and their stoichiometric ratios
3.3.1 Correlation between planting years of Naiman Banner Pennisetum giganteum and soil C, N, P and their stoichiometric ratios
Figure 5 illustrates that there is a positive correlation between the number of cultivation years and the contents of soil carbon (C), nitrogen (N), and phosphorus (P), with these correlations reaching statistical significance at various levels. This indicates that as the cultivation period of Pennisetum giganteum increases, the contents of C, N, and P in the soil also increase. The extensive root system of Pennisetum giganteum continuously grows and decomposes in the soil, supplying additional organic matter that promotes the accumulation of soil nutrients, thereby progressively enhancing the contents of C, N, and P. The relationship between the C/N ratio and cultivation age is more complex. In some cases, the C/N ratio initially increases and then decreases, reflecting that during the early stages of cultivation, the growth of Pennisetum giganteum leads to a relative accumulation of C in the soil, which elevates the C/N ratio; however, as cultivation years increase, enhanced microbial decomposition of C or a faster rate of N accumulation causes the C/N ratio to decline. In contrast, the C/P and N/P ratios exhibit a negative correlation with cultivation years. This suggests that as the years of cultivation increase, the relative proportions of C to P and N to P in the soil undergo continuous changes, with either an increase in the relative content of P or a decrease in the relative contents of C and N. This may be due to shifts in the absorption and utilization patterns of P by Pennisetum giganteum over time, or alterations in the release and migration processes of P in the soil, ultimately leading to decreases in both the C/P and N/P ratios.
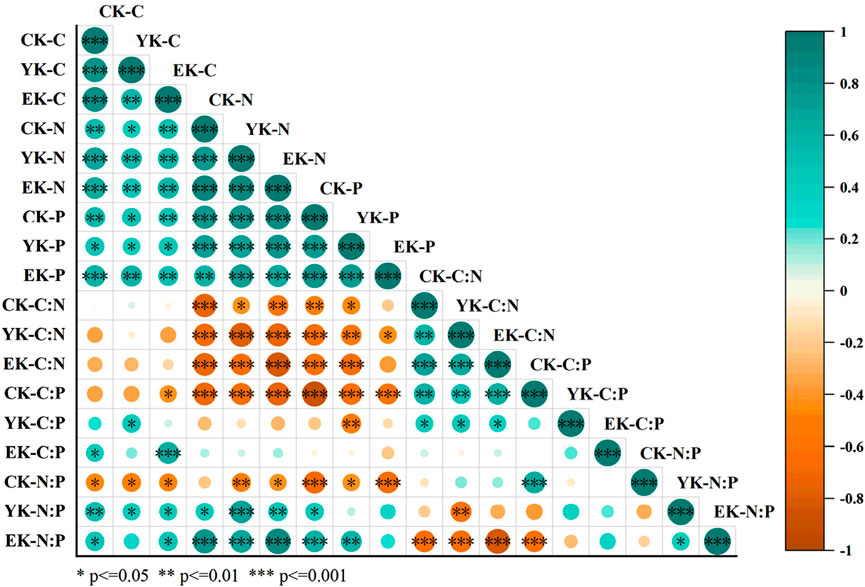
Figure 5. Correlation of Naiman Banner Pennisetum giganteum planting years-soil depth-soil C, N, P and their stoichiometric ratios.
3.3.2 Correlation between Tumd Left Banner Pennisetum giganteum planting years and soil C, N, P and their stoichiometric ratios
It can be seen from Figure 6 that there is an extremely significant positive correlation between the duration of cultivation and soil C content (p ≤ 0.001). As the cultivation period increases, the soil C content rises, indicating that the cultivation of Pennisetum giganteum has a marked facilitative effect on soil C accumulation. For instance, in the 0–10 cm soil layer, the C content increased from 1.54 ± 0.01 g/kg before cultivation (CK) to 1.98 ± 0.04 g/kg after the second-year harvest (EK). This increase is attributed to the continuous input of organic substances into the soil via root exudates and plant residues from Pennisetum giganteum, which are decomposed and transformed by microorganisms, thereby enhancing the soil’s C reserves. Furthermore, there is a significant positive correlation between the cultivation period and soil N content (*p ≤ 0.01, p ≤ 0.05). The longer Pennisetum giganteum is grown, the higher the soil N content becomes. For example, in the 0–10 cm soil layer, the soil N content increased from 1.04 ± 0.06 g/kg in the CK stage to 2.57 ± 0.04 g/kg in the EK stage. This increase may be due to the nitrogen-fixing ability of Pennisetum giganteum and its capacity to improve the soil environment, thereby promoting the activity of nitrogen-fixing microorganisms in the soil. Additionally, there is a positive correlation between the duration of cultivation and soil P content (p ≤ 0.05). With the passage of time, the soil P content gradually increases. For instance, in the 0–10 cm soil layer, the soil P content rose from 0.64 ± 0.06 g/kg in the CK stage to 1.95 ± 0.66 g/kg in the EK stage. This is because Pennisetum giganteum absorbs and accumulates P during its growth, and after its death and decomposition, the P is returned to the soil, thereby enhancing the soil P content.

Figure 6. Tumd Left Banner Pennisetum giganteum planting years-soil depth-soil C, N, P and their stoichiometric correlations.
The planting duration is significantly negatively correlated with the C/N ratio (p ≤ 0.05). As the planting duration increases, the C/N ratio decreases, indicating that the accumulation rate of nitrogen in the soil is relatively faster than that of organic carbon, thereby enhancing the decomposition of soil organic matter. For example, in the 0–10 cm soil layer, the C/N ratio declined from 1.48 before planting to 0.77 after the second-year harvest, demonstrating that the cultivation of Pennisetum giganteum improved the nitrogen supply in the soil. This improvement favorably facilitates microbial decomposition and transformation of organic matter, thereby increasing the effectiveness of soil nutrients.
Additionally, the planting duration is extremely significantly negatively correlated with the C/P ratio (p ≤ 0.001). With increased planting time, the C/P ratio sharply decreases, indicating a relatively more pronounced accumulation of phosphorus in the soil compared to organic carbon. In the 10–20 cm soil layer, the C/P ratio dropped from 3.09 before planting to 1.12 after the second-year harvest, reflecting that the cultivation of Pennisetum giganteum markedly increased soil phosphorus content. This alteration in the relative proportions of carbon and phosphorus in the soil has important implications for the soil phosphorus cycle and plant phosphorus utilization.
Moreover, the planting duration is also significantly negatively correlated with the N/P ratio (*p ≤ 0.01). As the planting duration increases, the N/P ratio decreases, indicating a shift in the relative contents of nitrogen and phosphorus in the soil, with phosphorus accumulating at a faster rate than nitrogen. In the 20–40 cm soil layer, the N/P ratio declined from 2.53 before planting to 1.20 after the second-year harvest, thereby affecting the balance of nitrogen and phosphorus uptake by plants and ultimately influencing plant growth and the functioning of the soil ecosystem.
3.3.3 Correlation between planting years of Ulan Buh Desert Pennisetum giganteum and soil C, N, P and their stoichiometric ratios
As shown in Figure 7, soil carbon content is highly significantly and positively correlated with the duration of Pennisetum giganteum cultivation (p ≤ 0.001), indicating that soil carbon accumulates substantially as cultivation time increases. For example, the carbon content in the 0–10 cm soil layer increased from 0.87 ± 0.08 g/kg before planting to 1.58 ± 0.12 g/kg after the second harvest. Moreover, soil nitrogen content demonstrated a significant positive correlation with cultivation duration (p ≤ 0.01), suggesting that longer cultivation periods lead to greater nitrogen accumulation; for instance, nitrogen content in deeper soil layers gradually increased during the cultivation process. In contrast, soil phosphorus content showed a weak correlation with cultivation duration, with variations observed in the topsoil and at certain stages, yet overall the association remained tenuous—exemplified by fluctuations in topsoil phosphorus content across different cultivation stages and complex changes at greater depths.
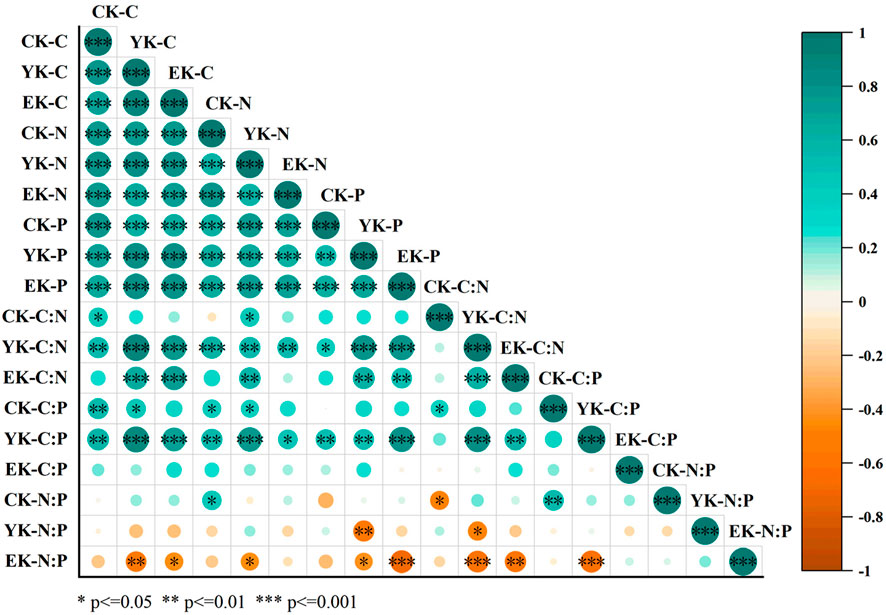
Figure 7. Correlation of Ulan Buh Desert Pennisetum giganteum planting years-soil depth-soil C, N, P and their stoichiometric ratios.
The C/N ratio was significantly and positively correlated with cultivation duration (p ≤ 0.05), reflecting that as cultivation time increases, the rate of carbon accumulation in the soil exceeds that of nitrogen, thereby altering soil organic matter mineralization and nutrient cycling, with a general increase in the C/N ratio across different soil layers. The correlation between the C/P ratio and cultivation duration was complex; although no clear unified trend emerged, variations across different stages and soil depths were evident. This suggests that the capacity of soil microorganisms to mineralize organic matter and release phosphorus is influenced by the duration of cultivation, with responses varying across soil depths. Similarly, the N/P ratio exhibited a relatively complex correlation with cultivation duration, fluctuating across different soil layers, which indicates that the relative abundances of nitrogen and phosphorus in the soil are affected by cultivation duration, thereby altering the nutrient supply to plants and the conditions of growth limitation.
4 Discussion
Studies on soil element dynamics have revealed that, following the cultivation of Pennisetum giganteum in the experimental areas of Naiman Banner, Tumd Left Banner, and Ulan Buh Desert, the overall contents of soil carbon (C), nitrogen (N), and phosphorus (P) tend to increase (Liu, 2019). This trend is primarily attributable to the well-developed root system of Pennisetum giganteum, whose root exudates and litter provide an abundant source of organic matter, thereby promoting the growth and activity of soil microorganisms and consequently accelerating the accumulation of soil nutrients (Zhou, 2019). In certain soil layers, nutrient content fluctuations observed after the second-year harvest may result from substantial nutrient uptake during the later growth stages of Pennisetum giganteum, as well as seasonal influences on soil microbial activity that alter the dynamic balance between nutrient release and immobilization (Yang, 2019).
Soil stoichiometric ratios reflect the relative proportions and interrelationships of elements in the soil and serve as critical indicators of soil ecosystem functions. In Naiman Banner, the C/N ratio in some soil layers initially increased and then decreased, while in others it continuously rose. This pattern suggests that the early stages of Pennisetum giganteum cultivation may have promoted the accumulation of soil organic matter, followed by an enhancement of decomposition processes in later stages; meanwhile, both the C/P and N/P ratios generally declined, indicating an enhanced mineralization of phosphorus by soil microorganisms and an increased availability of soil phosphorus (Bi, 2019). In Tumd Left Banner, the C/N and C/P ratios generally decreased, and the N/P ratio exhibited complex variations, reflecting that soil nutrient cycling was significantly influenced by the cultivation of Pennisetum giganteum, with the transformation relationships among C, N, and P changing over the years of cultivation (Mei, 2018). In the Ulan Buh Desert, the C/N ratio generally increased while the C/P and N/P ratios fluctuated, a pattern closely related to the unique soil texture and moisture conditions characteristic of desert regions. The cultivation of Pennisetum giganteum improved soil structure, thereby affecting the retention and release of soil nutrients (Wu, 2018).
Regional distribution differences have had a significant impact on the soil chemical stoichiometry under the cultivation of Pennisetum giganteum. Naiman Banner experiences a temperate semi-arid climate, Tumd Left Banner a temperate continental climate, and Ulan Buh Desert a temperate desert climate; these varying hydrological conditions directly affect the growth rate, biomass, and the structure and activity of soil microbial communities associated with Pennisetum giganteum (Huang, 2011). For instance, under the arid and low-precipitation conditions in Ulan Buh Desert, the growth of Pennisetum giganteum may rely more on deep soil moisture and nutrients, thereby exerting a greater influence on the chemical stoichiometry of deeper soil layers; in contrast, the relatively milder climatic conditions in Tumd Left Banner may be more conducive to soil microbial activity, promoting the transformation and cycling of soil nutrients (Song et al., 2023).
From the perspective of spatial distribution, as soil depth increases, soil nutrient content and stoichiometric ratios exhibit various trends. The surface soil is strongly influenced by the exudates and litter of Pennisetum giganteum roots, resulting in more dynamic nutrient changes and notable fluctuations in stoichiometric ratios; whereas the nutrient variations in deeper soils are relatively minor. However, in the long term, the extension of Pennisetum giganteum roots can gradually improve the quality of the deeper soil layers (Wang et al., 2023). This suggests that in ecological restoration practices, it is important to fully consider the characteristics of different soil layers and develop targeted planting and management strategies in order to achieve overall optimization of the soil ecosystem.
5 Conclusion
(1) Pennisetum giganteum planting significantly increased soil nutrient content: Pennisetum giganteum planting significantly increased soil C, N and P content, especially in the surface soil (0–20 cm), nutrient accumulation was more significant. For example, Naiman Banner increased C from 1.41 g/kg to 2.06 g/kg, N from 1.47 g/kg to 1.74 g/kg, and P from 1.27 g/kg to 1.85 g/kg in the 0–10 cm soil layer.
(2) The change of soil stoichiometric ratio reflects the dynamics of nutrient cycling: After Pennisetum giganteum was planted, the soil C/N, C/P and N/P changed significantly. The change of C/N ratio indicates that the decomposition rate of soil organic matter is accelerated, and the decrease of C/P ratio and N/P ratio indicates that the mineralization of phosphorus by soil microorganisms is enhanced, and the effectiveness of soil P is improved.
(3) Regional differences significantly affected soil nutrient transformation: The climatic conditions and soil texture in different regions affected the growth of Pennisetum giganteum and the transformation of soil nutrients. The drought conditions of Ulan Buh Desert make Pennisetum giganteum more dependent on the nutrient absorption of deep soil, while the mild climate of Tumd Left Banner is more conducive to the activity of soil microorganisms and promotes the rapid transformation of nutrients.
Data availability statement
The original contributions presented in the study are included in the article/supplementary material, further inquiries can be directed to the corresponding author.
Author contributions
YS: Data curation, Formal Analysis, Investigation, Software, Writing – original draft. YM: Writing – review and editing, Project administration, Methodology. GL: Funding acquisition, Supervision, Writing – review and editing. XM: Investigation, Data curation, Writing – original draft.
Funding
The author(s) declare that financial support was received for the research and/or publication of this article. This work was financially supported by the Inner Mongolia Autonomous Region “Unveiling the List and Leading the Way” Project (2024JBGS0023), Technology Special Project of Erdos City (2022EEDSKJZDZX012) and the High-level/excellent Doctor Introduction Project of Inner Mongolia Agricultural University (NDYB 2021-9).
Conflict of interest
The authors declare that the research was conducted in the absence of any commercial or financial relationships that could be construed as a potential conflict of interest.
Generative AI statement
The author(s) declare that no Generative AI was used in the creation of this manuscript.
Publisher’s note
All claims expressed in this article are solely those of the authors and do not necessarily represent those of their affiliated organizations, or those of the publisher, the editors and the reviewers. Any product that may be evaluated in this article, or claim that may be made by its manufacturer, is not guaranteed or endorsed by the publisher.
References
Bi, L. L. (2019). Preliminary study on the remediation of cadmium - contaminated soil by modified Pennisetum giganteum biochar. Guangdong University of Technology.
Bui, E. N., and Henderson, B. L. (2013). C:N:P stoichiometry in Australian soils with respect to vegetation and environmental factors. Plant Soil 373 (1), 553–568. doi:10.1007/s11104-013-1823-9
Cheng, B., Zhao, Y. J., and Zhang, W. G. (2010). Research progress of ecological stoichiometry. Acta Ecol. Sin. 30 (06), 1628–1637.
Dong, X., Hao, Y. G., and Xin, Z. M. (2019). Stoichiometric characteristics of soil carbon, nitrogen and phosphorus under four typical shrubs in horqin sandy land. Acta Bot. Boreali - Occident. Sin. 39 (1), 164–172.
Gou, B. W., Wei, B., and Ma, S. M. (2020). Study on the distribution characteristics of soil nutrients in the root zone of Haloxylon ammodendron on the Southern edge of the gurbantunggut desert. Southwest China J. Agric. Sci. 33 (6), 1229–1234.
Huang, G. Y. (2011). Research and prospect on the application of Juncao Technology in the treatment of desertified land in Ningxia. Prot. For. Sci. Technol. (2), 46–48.
Huang, J., and Yuan, Z. N. (2020). Overview of ecological stoichiometric characteristics and influencing factors of soil carbon, nitrogen and phosphorus. Mod. Agric. Res. 49 (01), 73–76.
Li, W. C. (2001). The situation, causes and countermeasures of land desertification in Inner Mongolia. North. Econ. (10), 4–8.
Li, Y., Li, Y., Zhang, Q., Xu, G., Liang, G., and Kim, D. G. (2024). Enhancing soil carbon and nitrogen through grassland conversion from degraded croplands in China: assessing magnitudes and identifying key drivers of phosphorus reduction. Soil Tillage Res. 236, 105943. doi:10.1016/j.still.2023.105943
Li, Y. K. (2000). Correct expression of calculation formulas for soil agrochemical analysis results. Chin. J. Soil Sci. (06), 275–272.
Li, Y. P., and Narisu, W. (2011). Remote sensing monitoring and analysis of grassland desertification in Inner Mongolia. Chin. J. Grassl. 33 (3), 79–86.
Li, Y. S., Zhao, X. D., and Chen, T. D. (2020). Application of Pennisetum giganteum in ecological restoration and governance. Rural. Sci. Exp. (4), 63–64.
Liao, X. L., Zhang, T., and Xu, Y. (2020). Research on the evolution trend of desertification in semi - arid areas: a case study of horqin left rear banner. Chin. J. Agric. Resour. Regional Planning 41 (4), 299–307.
Liu, Z. G. (2019). Characteristics of soil microbial community structure of Pennisetum giganteum in the dry - hot valley of Panzhihua. Sichuan Agricultural University.
Lu, Z. Q., Dou, Y. Y., and Wang, J. Z. (2024). Impact of ecosystem type conversion on soil wind erosion in key ecological function areas of Inner Mongolia autonomous region. Bull. Soil Water Conservation 44 (04), 247–256.
Ma, Y. J., Yang, G. Z., and Duan, R. J. (2023). Biological characteristics and application of artificial cultivation techniques of Pennisetum giganteum. Hebei Agricultural Machinery, 85–87.
Mei, L. (2018). Dynamic changes of soil enzyme activity and microorganisms of Pennisetum giganteum at different stages in the Pisha sandstone area. Fujian Agriculture and Forestry University.
Nie, H. G., Li, Z. P., and Yue, L. P. (2008). Development trend and causes of land desertification in the ejina basin, Western Inner Mongolia. Geol. Bull. China (08), 1335–1343.
Ren, Y., Zhang, B., and Chen, X. D. (2023). Assessment of land desertification sensitivity in horqin sandy land. J. Desert Res. 43 (02), 159–169.
Sheng, L. (2023). Discussion on the application of Pennisetum giganteum in the ecological governance of the Ulan Buh desert. Inn. Mong. For. (05), 34–35.
Song, S. M., Lin, D. M., and Zhou, H. Y. (2023). Effects of planting Pennisetum giganteum on plant species diversity and soil physical and chemical properties in the Ulan Buh desert. Ecol. Environ. Sci. 32 (09), 1595–1605.
Tao, Y., Wu, G. L., and Liu, Y. B. (2017). Soil stoichiometric characteristics and their influencing factors of typical shrub communities in the gurbantunggut desert. J. Desert Res. 37 (02), 305–314.
Wang, L., Liu, W. C., and He, H. X. (2006). Remote sensing investigation of land desertification and environmental quality assessment in central Inner Mongolia. Geoscience (03), 505–512.
Wang, L. M., Li, G. T., and Zhang, B. (2023). Effects of Pennisetum giganteum on soil physical and chemical properties in the introduction area of Inner Mongolia. J. Anhui Agric. Sci. 51 (04), 58–60+67.
Wang, S. Q., and Yu, G. R. (2008). Ecological stoichiometric characteristics of carbon, nitrogen and phosphorus elements in ecosystems. Acta Ecol. Sin. (08), 3937–3947.
Wu, Q. (2018). Study on the growth characteristics and wind - proof and sand - fixing effects of Pennisetum giganteum in the yellow River section of the Ulan Buh Desert. Inner Mongolia Agricultural University.
Yang, S. L. (2019). Root growth and nutrient dynamics of Pennisetum giganteum in the dry - hot Valley of panxi. Sichuan Agricultural University.
Yao, Y. Z. (2018). Research on the driving forces of desertification and soil and water conservation in Inner Mongolia. Chin. J. Agric. Resour. Regional Planning 39 (02), 13–17+87.
Zhao, K., Yue, Y. J., and He, R. (2022). Research on the spatial distribution of land desertification sensitivity in naiman banner. For. Resour. Manag. (01), 52–60.
Zhou, J., Lin, X. S., and Lin, H. (2020). Research and application progress of Juncao. J. Fujian Agric. For. Univ. Nat. Sci. Ed. 49 (02), 145–152.
Zhou, Y. (2019). Study on the improvement effect of Pennisetum giganteum on soil physical and chemical properties in the dry - hot Valley of panxi. Sichuan Agricultural University.
Keywords: Pennisetum giganteum, soil elements, stoichiometric ratio, planting year, soil depth
Citation: Shao Y, Ma Y, Li G and Ma X (2025) Analysis of changes in soil chemical stoichiometric ratios under different cultivation durations of Pennisetum giganteum in inner Mongolia, China. Front. Environ. Sci. 13:1599278. doi: 10.3389/fenvs.2025.1599278
Received: 24 March 2025; Accepted: 23 June 2025;
Published: 08 July 2025.
Edited by:
Tianjiao Feng, Beijing Forestry University, ChinaReviewed by:
Yi Wang, Chinese Academy of Sciences (CAS), ChinaYuan Li, Natural Resources Institute Finland (Luke), Finland
Copyright © 2025 Shao, Ma, Li and Ma. This is an open-access article distributed under the terms of the Creative Commons Attribution License (CC BY). The use, distribution or reproduction in other forums is permitted, provided the original author(s) and the copyright owner(s) are credited and that the original publication in this journal is cited, in accordance with accepted academic practice. No use, distribution or reproduction is permitted which does not comply with these terms.
*Correspondence: Yunxia Ma, MTU3MjY2Njk3NUBxcS5jb20=