 Manuel Viñes1*
 Agustín Sánchez-Arcilla Jr.1Irati Epelde2
 César Mösso1
 Javier Franco2Joaquim Sospedra1Aritz Abalia2Pedro Líria2
 Manel Grifoll1Alberto Ojanguren3Mario Hernáez4Manuel González2
 Agustín Sánchez-Arcilla1
- 1Universitat Politècnica de Catalunya – BarcelonaTech (UPC), Laboratori d’Enginyeria Marítima (LIM), Barcelona, Spain
- 2AZTI Marine Research, Basque Research and Technology Alliance (BRTA), Gipuzkoa, Spain
- 3Departamento de Salud, Seguridad y Medio Ambiente de la Autoridad, Autoridad Portuaria de Bilbao, APB, Santurtzi, Spain
- 4Departamento de Planificación, Proyectos y Construccíón, Autoridad Portuaria de Bilbao, APB, Santurtzi, Spain
Predicting the morphodynamic behaviour of pocket beaches exposed to energetic waves and meso-tidal ranges—particularly under strong seasonal variability and the influence of climate change—requires a robust characterization of coastal morphodynamics across a wide range of temporal and spatial scales. This study introduces a data-driven modelling approach using Machine Learning (ML), specifically the Gradient Boosting Regressor (GBR), a powerful ensemble technique capable of iteratively improving predictions from limited datasets. The GBR model is applied to forecast beach evolution in complex coastal settings, where physical understanding is limited, specifically targeting a set of pocket beaches in the Bay of Biscay (North Atlantic). The methodology combines wave time series and morphodynamic variables obtained through videometry stations (KOSTASystem technology). This ML framework is then implemented to improve the current understanding of hydro-morphological interactions and establish criteria to enhance the reliability of erosion and flood predictions. The obtained predictions can steer the design and implementation of protection measures to increase beach resilience under climate change drivers, such as sea-level rise and wave storminess, leading to improved adaptation strategies. This approach, which also demonstrates the advantages of ML over conventional statistics, is developed from a set of extreme meteo-oceanographic events acting on pocket beaches adjacent to and within the Nervión estuary and Bilbao port. The application of conventional statistics and ML techniques to this dataset begins with an extreme analysis of offshore wave data, from which a set of 32 wave storms has been propagated towards the coast using the Simulated WAves Nearshore (SWAN) model. This dataset serves to evaluate predictive formulations derived from statistical and ML tools, based on monthly values, which filter out short-term variability and focus on medium- to long-term (annual to decadal) beach behaviour—scales that are critical for sustainable coastal management. Results demonstrate that ML-based predictions using GBR outperform traditional statistical methods, where validation metrics confirm the improved predictive accuracy, with R2 values exceeding 0.7 in several cases, without any evidence of overfitting. These predictions contribute to understanding hydro-morphological interactions and support the design of adaptive beach protection strategies.
1 Introduction
A reliable characterization of key hydro-morphodynamic factors, driving beach evolution at various spatio-temporal scales, is essential for accurately forecasting beach behaviour under present and future climate conditions. Waves are the main hydrodynamic driver for the behaviour of pocket beaches, where hydro-morphodynamic interactions are also controlled by boundary conditions such as possible land discharges and outer coast transport processes (e.g., Risandi et al., 2020). To ensure effective beach protection, maintenance, and risk management, it is crucial to establish robust predictive relationships that integrate the combined effects of waves, currents, and sea-level fluctuations—including astronomical tides, meteorologically driven surges, and long-term climatic trends (e.g., Alfaro Chavarría et al., 2017; Pau Sierra et al., 2005).
In addition to classical hydrodynamic drivers, geological and morphological factors play a critical role in shaping coastal evolution and must also be considered. The lithological composition and erosion resistance of coastal promontories significantly influence sediment availability and long-term shoreline stability (Gallop et al., 2020). Furthermore, the orientation, length, and configuration of these promontories—as well as the angle at which prevailing waves interact with them—determine the extent of wave energy dissipation and the degree of sheltering experienced by pocket beaches (Fellowes et al., 2022). The rocky nature of the shoreface in the study area exacerbates their effects on wave propagation and energy dissipation, thereby reinforcing spatial gradients in sediment transport and beach response. Due to the nonlinear nature of sand transport under these interactions and sediment erosion, beach morphodynamics are highly sensitive to extreme events (Section 3.1). Therefore, accurately characterizing extreme wave storms—including their transformation from offshore to nearshore—is essential to understanding and predicting coastal responses (e.g., Mosso et al., 2009). Extreme distribution functions for areas with energetic waves and high tidal ranges, such as the Cantabrian Sea in the Bay of Biscay, require addressing the sequences of wave storms, whose combined effect, amplified by tides and river discharges, controls the morphodynamic evolution of pocket beaches (e.g., Monge-Ganuzas et al., 2017; Ortiz Berenguer et al., 2004).
Previous studies (e.g., Sánchez-Arcilla et al., 2006) highlight the importance of accurately analysing erosion and accretion processes, since their prediction is fundamental for beach maintenance and sustainability, which supports in this area a range of important socio-economic activities. Based on these predictions, erosion and flooding risks can be curbed with solutions adapted to prevailing biophysical and socioeconomic conditions on each beach. These conditions depend on the considered beach archetype, here classified as: a) urban; b) semi-urban; and c) rural-natural (e.g., Machado et al., 2020). The four analysed pocket beaches near or inside the Nervión estuary (Figure 1) are predominantly semi-urban, with significant socio-economic relevance, and where leisure activities have a fundamental role.
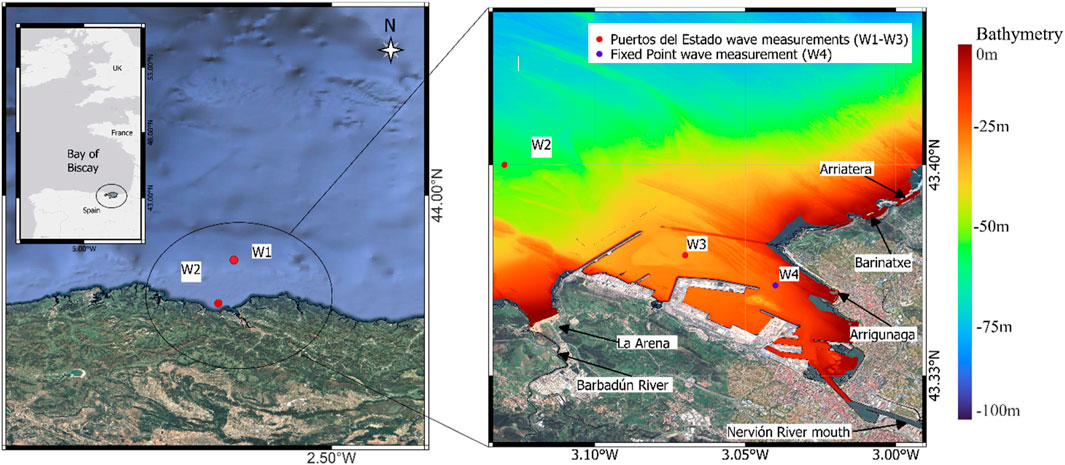
Figure 1. Study area, showing on the left panel the regional location with the wave measurement stations (W1–W3, red circles) and the fixed measurement point (W4, blue circle). The right panel offers a detailed view of the coastal zone adjacent to the Nervión estuary, including bathymetry contours, the identified pocket beaches (La Arena, Arrigunaga, Barinatxe, and Arriatera), and the mouths of the Barbadún and Nervión rivers.
The main key variables that can be considered to analyse beach hydro-morphodynamic processes can be structured in five blocks:
a) Wave characteristics near the breaker zone, including significant wave height (Hs), peak period (Tp), mean propagation direction (Θm), wave steepness (S), and wave storm duration (Dur)
b) Wind speed (Uwind), direction (Dir_Wi), and wind event duration (Dur_Wi)
c) Circulation patterns linked to general circulation, local wind circulation, and tidal currents, with emphasis on net transport patterns, bed shear stresses, and turbulence levels
d) Sediment transport patterns, with a focus on the sand-size fraction and distinguishing between alongshore and cross-shore fluxes
e) Longshore and cross-shore beach evolution, accounting for the distribution of sediment volumes across the subtidal, intertidal, and supratidal zones.
Incoming wave energy is the dominant driver for beach morphodynamics in the study area, particularly at monthly timescales where astronomical tide effects have been filtered out. As such, wave parameters can also serve as effective proxies for meteorological influences, including atmospheric pressure. Due to the limited availability of long and accurate local time series for some of these atmospheric variables, wave-driven parameters -such as significant wave height (Hs) and peak period (Tp)- are adopted in this study as the primary forcing terms, effectively capturing the influence of broader metocean conditions (Ibaceta and Harley, 2024).
To address the challenges posed by nonlinearity and data scarcity in coastal environments, recent research has increasingly focused on the application of Machine Learning (ML) techniques in morphodynamic studies. These approaches have demonstrated strong capabilities in capturing complex interactions even under data-limited settings (e.g., Al-Ghosoun et al., 2025; Kumar and Leonardi, 2023; Mokarram et al., 2023). ML models offer a promising alternative to traditional statistical and process-based approaches, particularly in regions lacking high-resolution datasets for the key hydro-morphodynamic variables. Building on this, the present study develops and validates a tailored Gradient Boosting Regressor (GBR) model for predicting morphodynamic changes in semi-urban pocket beaches characterized by sparse observational data. The proposed methodology integrates hydro-morphodynamic variables derived from videometry and wave propagation modelling, offering a robust and objective enhancement over conventional statistical techniques. By focusing on topographically complex and sheltered settings—such as beaches influenced by river mouths and bathymetries dominated by rocky shoals—this study advances the predictive capacity of ensemble ML models under real-world constraints, contributing to improved operational forecasting of beach behaviour in the face of ongoing climatic changes.
2 Study area and data characterization
2.1 Study area
The beaches analysed in this study (Figure 1) are located within the meso-tidal region of the Nervión estuary, in the vicinity of the Port of Bilbao (43° 20′ N, 3° 01′ W), and include adjacent open-coast sites to the west (La Arena beach) and east (Barinatxe and Arriatera-Sopelana beaches) (e.g., Grifoll et al., 2009). This area has been the subject of extensive hydrodynamic and geomorphological research, providing a robust foundation for the development of site-specific morphodynamic prediction models (e.g., de Santiago et al., 2021). Among the selected sites, Arrigunaga beach is partially sheltered due to its estuarine location and limited exposure to wave action. In contrast, the other three beaches are fully exposed to high-energy wave conditions, each of them exhibiting unique sedimentary properties and varying degrees of bathymetric protection (Gorostiaga and Díez, 1996).
La Arena beach, located between the municipalities of Muskiz and Zierbena, extends approximately 966 m in length and 85 m in width. It is partially influenced by the Barbadún inlet, a river mouth system embedded within the pocket beach configuration. The spacing and orientation of the bounding headlands influence the geomorphological expression of the inlet and regulate the dynamics of the supratidal beach zone. According to the Udden–Wentworth grain-size classification, the sediment at the studied beaches is composed predominantly of medium sand, with median grain size (d50) values ranging between 250 and 500 µm. In La Arena, the d50 is approximately 310 µm (e.g., An et al., 2025). Arrigunaga beach, situated within the estuarine domain (Abra) in the municipality of Getxo, has a total length of nearly 658 m, a width of about 68 m, and a d50 of 460 µm (Abalia et al., 2024; de Santiago et al., 2021). Barinatxe beach, located on the eastern side of the estuary and extending across the municipalities of Getxo and Sopelana, measures approximately 752 m in length and 80 m in width, with a d50 of around 270 µm. The fourth site, Arriatera beach—further east in the municipality of Sopelana—is approximately 826 m long and 43 m wide, with slightly coarser sediment characterized by a d50 of around 320 µm.
2.1.1 Morphodynamic characterisation
The proposed methodology, combining statistical analyses with physical processes, links the morphodynamic response with key hydrodynamic forcing factors, based on morphological data from the videometry stations deployed at La Arena (since 2012), Arrigunaga (since 2017), Barinatxe and Arrietara/Atxabiribil (since 2018) beaches. The videometry is provided by the KOSTASystem, which is based on TIMEX-type images (Epelde et al., 2021). Two main morphological indicators have been analysed for each beach: i) intertidal area, defined as the beach area between the average high and low tide, which corresponds on average to the levels +4.0 and +1.0 m respectively (above the Bilbao port 0 reference level), ii) supratidal area, defined as the beach surface above the average high tide level (Figure 2).
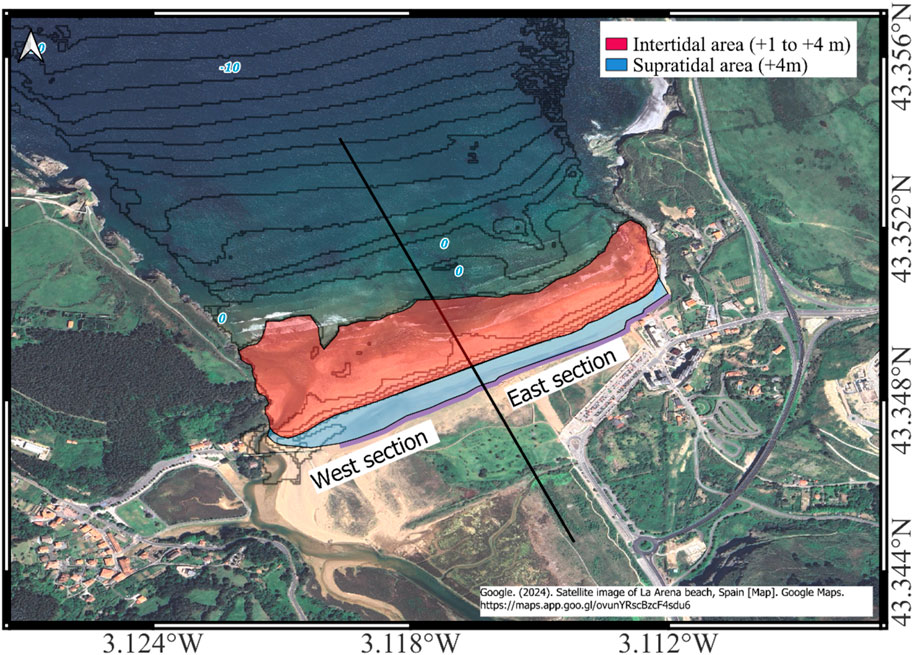
Figure 2. Spatial variation of morphological indicators for La Arena beach, showing supratidal and intertidal area subdomains with differentiated behaviour (west and east sectors of the beach) and the upper active profile limit is indicated by a purple line.
These morphodynamic variables are characterised from the rectification of images captured using photogrammetry techniques, where the coastline is identified as the more stable, landward boundary of the active beach system—typically corresponding to the upper limit of the supratidal zone—and is delineated accordingly (Holland et al., 1997). To achieve this, TIMEX-type images were generated by averaging 1-s frames over a 10-min period (600 frames generating 1 final image), followed by a smoothing to filter out wave fluctuations, which facilitates the identification of the mean sea level contour, associated with the shoreline position during the time interval considered.
Due to the semidiurnal tidal pattern at the study area, the maximum feasible sampling resolution for the supratidal area is 14 days, as the mean high tide level only occurs during two spring tide cycles per month. However, this resolution is often not viable because it also requires daylight, low wave height (Hs), and fair-weather conditions, which are uncommon, mainly during high-energy periods throughout the year. Therefore, a 30-day sampling resolution is adopted to effectively capture seasonal beach variability (Abalia et al., 2024; De Santiago et al., 2013; Splinter et al., 2013). Morphodynamic analyses begin with the mid-term behaviour of the beach, consisting of the evolving shoreline position and elevation, extracted from the available images, from which the combined effect of tides and waves can be inferred. La Arena beach, where important differences in behaviour between its eastern and western sectors have been observed, requires characterising the effects due to the small inlet in the Barbadún estuary. This estuary features a low-tide sandbar, which, depending on its location, directly affects hydro-morphodynamic processes in the more concave zone of the coastline in that area. Considering the different relative weight of physical processes for the western and eastern sectors of the beach, due to the river mouth inlet and submerged bars but also to the different level of hydrodynamic sheltering by rocky features, has led to split the beach in two sectors (Figure 2), corresponding roughly to the two beach halves, which exhibit different wave exposure, submerged bars and presence/absence of river inlet. The obtained correlations for each sector yield significantly better values and confirm the expected differential behaviour, supporting the decision to treat both beach sectors separately. The Eastern sector is more directly exposed to wave action due to its orientation and limited sheltering from rocky headlands, while the Western sector is more sheltered, with a higher level of hydrodynamic filtering and with the influence of the Barbadún river inlet and submerged bars. The longshore wave height gradient leads to a recirculating longshore current that flows from the Eastern to the Western sector and promotes sediment accretion near the river mouth inlet. Such a morphodynamic differentiation, due to geomorphic controls, is consistent with previous findings in marine-dominated estuaries, where headlands, shoals and inlet morphology significantly modulate sediment transport and, in general, estuarine dynamics (e.g., Jenkins et al., 2023).
On the other hand, the beach of Arriatera presents the highest values of supratidal and intertidal area, with averaged values around 12 and 32 ha, ranging between +-4 and +-5 ha, respectively. The beach of Barinatxe has lower supratidal and intertidal values than Barinatxe, but with a similar variability. Finally, the beach of Arrigunaga exhibits a decrease in supratidal and intertidal values, and so their variability is also smaller than for the former two.
The analysed morphodynamic time series include data on supratidal (Figure 3 top) and intertidal areas (Figure 3 bottom). For a comprehensive characterization of local hydro-morphodynamics, it is important to consider that the data collected for each beach do not cover the same interval. Therefore, any intercomparison must explicitly consider the time interval and spatial domain that the data represents.
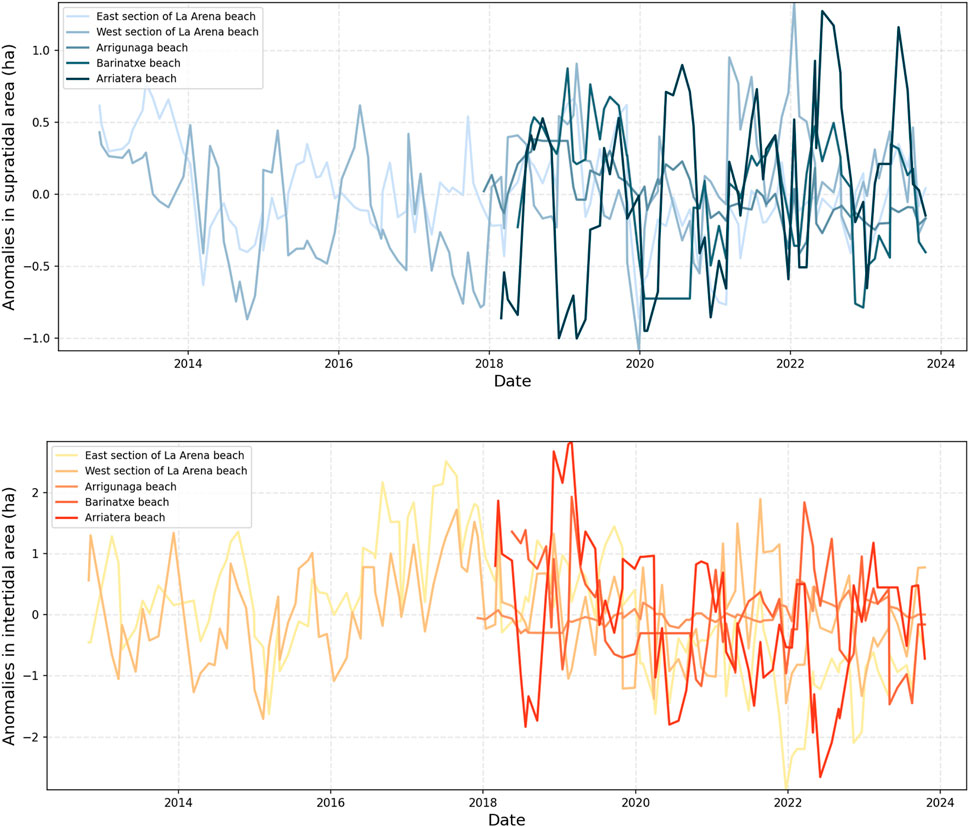
Figure 3. Evolution of the supratidal area (upper panel) and intertidal area (lower panel) anomalies for La Arena beach, distinguishing between its east and west subdomains, Arrigunaga beach, Barinatxe beach and Arriatera beach.
2.1.2 Hydrodynamic characterisation
The hydrodynamic characterisation begins with data from the incoming waves, as the primary forcing factor, whose records have been analysed for the three oceanographic (W1, W2, and W3, respectively). Offshore stations, supplemented by a fixed measurement point (W4) inside the estuary, where an acoustic Doppler profiler was deployed (Figure 1). The deepest wave data recording corresponds to a buoy of the REDEXT (External wave buoy Network) system of PdE. This buoy, known as Bilbao-Vizcaya (W1), is located in deep waters (coordinates 43.64° N, 3.04° W) and moored at a depth of 600 m, providing a time series that goes from 1990 to 2022, with 32 years of valid wave data (Conjunto de datos_REDEXT, 2015).
The intermediate-depth wave records correspond to the coastal buoy called Bilbao II (W2) located at coordinates 43.40° N and 3.13°W, known as Castro’s buoy (Figure 1), and moored at a depth of 53 m. This buoy provided a time series of good-quality wave data spanning from 2004 to 2023.
The remaining wave stations (W3 and W4) are located within the Nervión estuary, inside the port domain. The outermost is the Abra-Zierbena buoy (W3), located at 43.37° N, 3.07° W at a depth of 22 m (Figure 1), which is part of the REDCOS (Coastal Network) system of PdE and provides wave data from 2001 to 2023. The W4 station is a Doppler profiler (NORTEK), located at 43.36° N, 3.04° W, at a depth of 21 m in an inner (inland) section of the estuary. It has been recording continuous wave time series from 2016 to 2023. To ensure its high-quality performance, the station operates with hourly wave bursts consisting of 2,048 samples recorded at a sampling frequency of 2 Hz.
The local wave conditions in front of each studied beach are obtained through a robust wave propagation, based on Snell’s law and linear theory. Waves are propagated from deep waters recorded at the W1 station up to the outer breaking zone around 8 m depth, where the measurements for validation are available. The key wave parameters considered are the significant wave height (Hs), peak period (Tp) and wave direction (Θm). In the case of Arrigunaga beach, as it is slightly sheltered by a submerged dike, the propagation was performed in two steps. First, the waves were propagated from deep water up to 30 m depth, considering the direction of propagation perpendicular to the dike. Then, the waves were propagated from 30 m up to 8 m depth, considering the direction of propagation perpendicular to the beach. These target depths were chosen due to the absence of permanent in situ wave measurements directly offshore of the studied beaches.
The monthly time series derived from these linearly propagated wave conditions has been employed in subsequent correlation and prediction analyses, involving all key hydro-morphodynamic variables, which enable a classification of incident waves into predominant wind sea or swell classes. Swell waves, which typically exhibit periods between 7 and 12 s, induce a significantly different morphodynamic response compared to sea-type waves (Sánchez-Arcilla et al., 2008).
Locally generated sea waves, characterized by short periods and high directional variability, are commonly associated with erosive processes, whereas swell waves—longer and more regular—are often linked to beach accretion and natural recovery processes (e.g., Sánchez Arcilla and Jiménez, 1995).
To distinguish between sea and swell wave conditions, the methodology employs the mean wave period (Tm) derived from the time series, as it offers more stability than the spectral width parameter (e.g., Carevic et al., 2012). The following empirical relationship is used (Equation 1):
Based on this, Equation 2 is applied to classify a wave record as either swell or sea according to the criterion:
3 Methodological framework
The proposed methodology is based on key hydro-morphodynamic variables that control the response of pocket beaches under energetic hydrodynamic conditions. Their identification and selection is structured (Figure 4) in the following steps:
Step 1: Identification of key hydrodynamic drivers. Assessment of the offshore wave climate and its propagation toward the breaking zones of the four studied beaches, where sufficient videometry data are available to characterize dominant morphodynamic behaviour patterns.
Step 2: Extreme event characterization. Use of offshore wave buoy data and the SWAN model to simulate the propagation of 32 annual maximum storm events. These simulations provide a characterisation of extreme wave conditions for each studied beach.
Step 3: Analysis of mid-to long-term hydro-morphodynamic relations. Investigation of seasonal to multi-year variability in the intertidal and supratidal zones across the four pocket beaches through cross-correlation analyses of the available data.
Step 4: Development of ML-based predictive models. Formulation of machine learning models to predict the behaviour of both emerged and submerged beach areas, incorporating the most relevant temporal scales and prevailing hydrodynamic conditions.
Step 5: Operational integration. Recommendations and suggestions for the implementation and optimization of the developed algorithms to enhance automated decision-making for efficient and proactive beach maintenance.
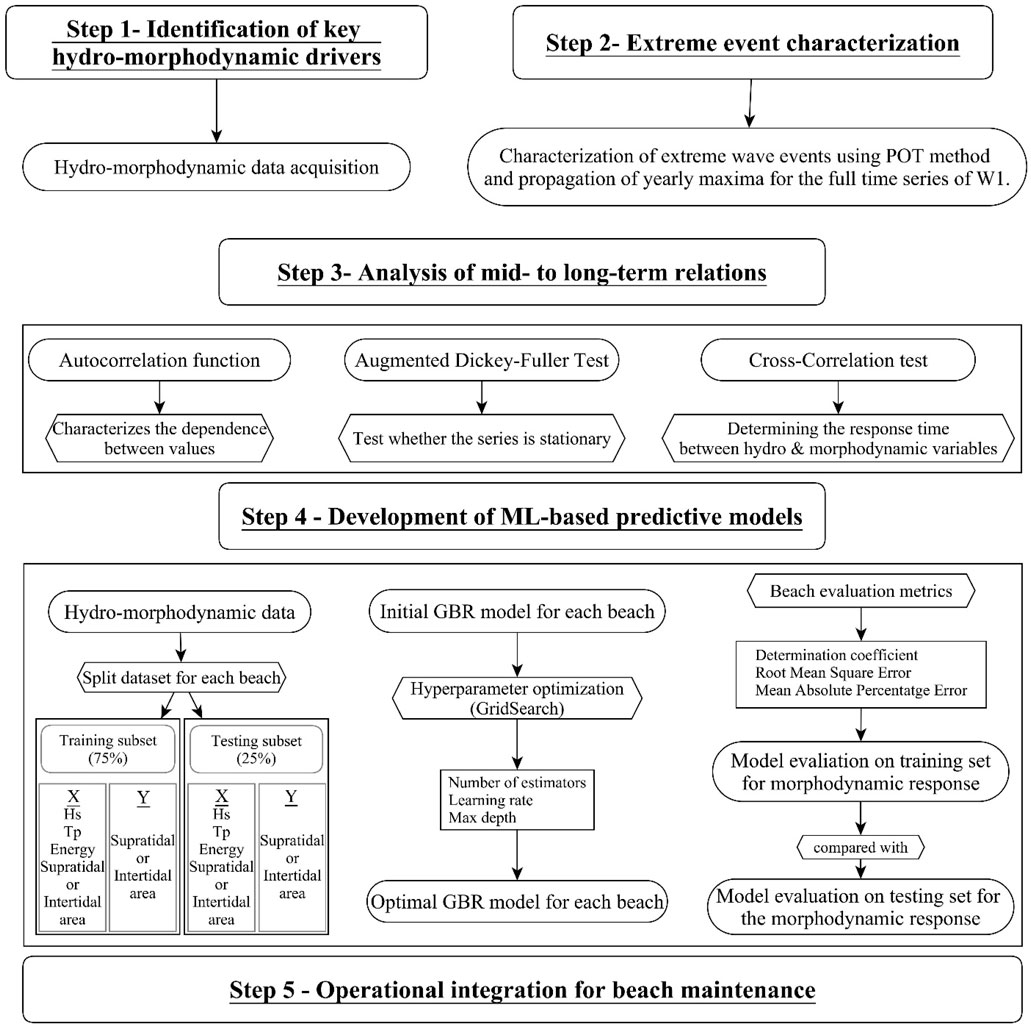
Figure 4. Diagram illustrating the proposed methodological framework, detailing the sequential steps and key components involved in developing a robust predictive tool for proactive beach management and maintenance.
3.1 Assessment under extreme events
The methodology for characterizing extreme events (Step 2) is based on data collected from fixed measurement stations, which are particularly well-suited for this type of analysis. In this study, extreme events are identified using significant wave height (Hs) and storm duration as the primary criteria. Specifically, an event is classified as extreme when wave height exceeds a predefined threshold for a sustained period. This methodology, known as Peak Over Threshold (POT), enables a more accurate characterization of extreme events for relatively short time series, as it yields a larger extreme sample compared to alternative methods such as annual maxima (e.g., de Alfonso et al., 2021).
The selection of thresholds to characterize extreme events follows the recommendations of PdE (Estado, 2024; Estado, 2020; Estado, 2023), which integrates knowledge from numerous extreme event analyses along the Spanish coast. The proposed approach standardizes the definition of extreme events and minimizes sources of error (Hawkes et al., 2008; Sánchez-Arcilla et al., 2008). For the study zone (Bay of Biscay) the proposed methodology defines thus the concept of extreme event following two basic criteria: i) Event duration, with a Hs above a threshold lasting more than 5 h; ii) Event independence, with a minimum gap of 5 days between two storm events to ensure that two consecutive (not continuous) events are statistically and physically independent (Bonta and Rao, 1988).
This methodology has been applied to select a sample of extreme events, where the relative frequency of their peaks has been fitted to a three-parameter Weibull distribution function (Fw), defined by Equation 3 the expression below, which is used to model the statistical behaviour of extreme wave heights. The distribution parameters are estimated using the Pyextremes library, a Python-based tool specifically developed for extreme value analysis, which ensures a statistically robust and reproducible estimation of distribution parameters:
where Ha is the significant wave height with a certain value, α is the location parameter, β is the scale parameter, and γ is the shape parameter (e.g., González-Marco et al., 2007).
3.2 Propagation of extreme events
Step 2 (Figure 4) continues with a local characterization of extremes at each beach, which requires propagating the incident waves from the measurement point to the outer breaker zone. Wave propagation has been simulated using the SWAN code, a numerical model recognized for its low computational cost and ease of validation, accurately reproducing the main processes (refraction, numerical diffraction, bottom friction, and bottom-induced breaking) governing wave propagation towards the surf zone (e.g., Booij et al., 1997; Lei et al., 2023). Given the distances involved, local wave generation and wave-wave interactions should play a minor role and have not been explicitly addressed.
Relative frequencies of storm peaks have been estimated from the Peak Over Threshold (POT) and annual maximum methods (e.g., González-Marco et al., 2008). The latter method relies on the maximum significant wave height peak yearly recorded, which provides a sample of annual maxima (e.g., Jarušková and Hanek, 2006). The performed analysis reveals that, for long enough time series like the ones here treated, both methods yield similar results, with differences of less than 0.2 m (under 5% error on Basque beaches) for 100-year return periods (see also Kapelonis et al., 2015). Using annual maxima is computationally more efficient than propagating a larger number of storms defined by the POT method, and because of that, the proposed methodology starts utilizing annual maximum values derived by partitioning the time series into yearly intervals (e.g., Faranda et al., 2011) and fitting the sample frequencies to an extreme value theory (EVT). For the Nervión estuary case, the 32-year time series from the W1 buoy yielded 32 storms, each characterised by its significant wave height at the peak, associated peak period and mean direction. These extreme storm events provide the boundary conditions for the various analysed scenarios (e.g., Allard and Rogers, 2002). The wave propagation model operates in Cartesian coordinates, with distances measured in meters along the X and Y-axes, covering latitudes 43.47° N to 43.32° N and longitudes −2.97° W to −3.16° W, as suggested in previous studies (Altomare et al., 2024). A specific bathymetry averaged over 15 × 15 m cells has been employed for wave propagation, based on two-dimensional, steady-state simulations with spectra discretized into 74 equidistant directional bands and 75 frequency bands spanning from 0.0521 Hz to 0.5 Hz to include the main wave train components. The 32 selected storm events were propagated using default model coefficients, with minor local adjustments to account for site-specific seabed characteristics. The bottom friction coefficient was adapted based on sediment grain size; however, the model did not explicitly account for the presence of loose sediment layers or rocky shoal bedforms. To capture pre-breaking wave conditions under extreme storm scenarios as accurately as possible, four representative points -each located offshore of one of the studied beaches at a depth of 15 m-were selected for analysis.
3.3 Stationarity and homogeneity requirements
To detect correlations between parameters or changes in wave regimes, whether due to port structures, bathymetric modifications, or other factors (Step 3), it is important to verify that the time series do not exhibit significant autocorrelation and are stationary (e.g., Guevara Díaz, 2014). To address these points, monthly data have been selected, since it helps mitigate short-term autocorrelation effects, thereby enhancing the statistical robustness of the cross-correlation analysis. Accordingly, the proposed methodology (Figure 4) includes the application of both the Autocorrelation Function (ACF) and the Augmented Dickey-Fuller (ADF) test to verify that the time series maintains constant mean and variance over time, a key condition for a meaningful correlation analysis (e.g., Choi et al., 2021).
The ACF technique explores how the correlation between two values of a signal (the wave time series in this case) changes as the time interval between them varies (e.g., Hunt, 2016). Previous studies have demonstrated an annual periodicity, reflecting the seasonal nature of offshore wave conditions, which are generally more energetic during winter (Coe et al., 2022). The proposed methodology involves conducting several statistical tests to assess stationarity as a function of time lag (delay). Specifically, if a series is non-stationary, the ACF will show high and significant autocorrelation coefficients along several lags that gradually decrease towards zero. Conversely, if serial correlation has been effectively removed, after lag 0, the correlation coefficient will rapidly decline in subsequent lags.
The autocorrelation coefficient is obtained from the time series x(t) using Equation 4 the following expression, where subscripts indicate the time instant (e.g., Hawkes et al., 2008; Nounou and Bakshi, 2000)
Once the ACF is computed, any serial correlation detected in the series must be removed to ensure robust cross-correlation analyses. To achieve this, the methodology proposes two well-established techniques: i) data resampling and ii) data averaging. In this study, for the hydrodynamic data, the second technique is initially chosen at a monthly scale, because the morphodynamic time series are based on monthly data. This approach not only facilitates the stationarization of the series but also preserves the seasonality inherent in the data.
To determine whether the series has a unit root, the proposed methodology employs the ADF test (e.g., Livieris et al., 2021). This widely used statistical test evaluates the null hypothesis (the time series has a unit root, indicating non-stationarity) versus the alternative hypothesis (the series is stationary) (Jebb et al., 2015; Siino et al., 2020). A significance level of 10% is used as the threshold for rejecting the null hypothesis, thereby confirming that the series does not have a unit root.
3.4 Assessment of cross-correlations
In the proposed methodology, once all necessary wave parameters are obtained, a cross-correlation analysis is performed to explore potential spatial and temporal relationships among the key hydro-morphodynamic variables. This process enables identifying predictive relationships between data series, determining both their similarity and the time lag between them (Jamshidi, 2024). Such correlations, derived from comparing hydro-morphodynamic signals, facilitate the prediction of key variables critical for beach protection and sustainability. For example, the morphodynamic response time—which can be understood as the period of beach erosion and subsequent recovery—can be estimated and applied within a proactive beach maintenance.
To compare any couple of time series (x1, x2 respectively) and characterize the dependency relationships between them as a function of the time lag (t), their correlation is defined by Equation 5:
where
It is important to note that the presence of correlations at lag = 0 does not imply correlations at other lags (e.g., Podobnik et al., 2010), where the time lag is expressed in the same units as the time scale of the analysed series. For instance, when using monthly averages, each lag corresponds to 1 month, thereby allowing a data-driven assessment of erosion and recovery periods for the studied beaches.
In a typical cross-correlation analysis, when the maximum correlation occurs at the first time-lag (lag = 0), this value is equivalent to Pearson’s correlation coefficient. Furthermore, if the maximum cross-correlation occurs at positive lags, it indicates that the independent series (x1) leads the dependent series (x2); conversely, a negative lag implies that x2 leads x1 (e.g., Guevara Díaz, 2014). Based on observed hydro-morphodynamic processes and knowledge, both local and generic, the developed methodology assumes that hydrodynamic variables always lead morphodynamic ones, so that the dependent series is consistently associated with the supratidal and intertidal beach areas and each time lag in the cross-correlation analysis corresponds to a 1-month interval, enabling a direct interpretation of the observed morphodynamic response.
3.5 Assessment of morphodynamic predictions
The prediction models are based on decision trees and machine learning, utilizing the Gradient Boosting Regressor (GBR), implemented with the Scikit-Learn library (Pedregosa et al., 2011) executed on a standard Intel i7-based machine with 32GB RAM. The core idea of decision trees is to subdivide the input data space into disjoint regions, ensuring that samples within each region belong to the same class (e.g., Alomari et al., 2023). This approach allows a complex system to be represented as a tree, simplifying the problem, particularly when the available dataset is not large enough for reliable multiple regression modelling (e.g., Bundy et al., 2010; Pourzangbar et al., 2023).
Given the typical constraints in coastal morphodynamic data already mentioned, the GBR algorithm is preferred over other ensemble models (such as C4.5 Decision Trees or Random Forests) because it reduces bias by revealing discrepancies between the exact result and the model’s average forecast, while controlling variance, thereby indicating any excessive model complexity (Raihan and Nahid, 2023). The performance of GBR on limited datasets, containing fewer than 3,000 observations (Otchere et al., 2022) shows that this ML tool outperforms alternatives such as Random Forest, in terms of predictive accuracy, demonstrating its suitability for small-to-medium-sized environmental datasets.
Boosting has been applied next to address these issues by combining multiple models to create a more robust predictor (e.g., Yaman and Subasi, 2019). The proposed methodology begins with training an initial (“weak”) model on the available data. Subsequently, additional models are trained to correct the errors not captured by the preceding model, continuing iteratively. In this study, the morphodynamic time series analysed -derived from TIMEX-type videometry (Section 2.1.1)- span approximately 5 years for the beaches of Arriatera, Barinatxe, and Arrigunaga, and 13 years for La Arena beach. These series have been aligned with the corresponding hydrodynamic predictors and subjected to stringent quality control procedures. However, due to the limited length of some time series, a degree of uncertainty remains. Because of that, ML models based on the boosting concept are designed to improve predictions by accounting for nonlinear interactions between the data (e.g., Dyer et al., 2022). In this way, GBR is well suited to limit uncertainty in the predictions, and a model with M trees has been generated and applied using the expression shown in Equation 6 (e.g., Otchere et al., 2022):
Where hm are the weak variables (those not providing a good predictor model) and ym are the corresponding scale factors. In regression problems where the response variable Y is continuous, it is common to use a loss function to quantify the discrepancy between predicted and observed values. In this study, the square-error loss function (L2 loss) has been chosen to give more weight to the high-energy morphodynamic responses. It is expressed in Equation 7 as:
The L2 loss function, selected for its simplicity and favourable analytical properties, as it strongly penalizes large deviations, is applied to encourage the model to correct significant errors during training (e.g., Natekin and Knoll, 2013). Following the selection of the loss function, the model is constructed according to the proposed methodology (Figure 4) using the Scikit-Learn library (e.g., Pedregosa et al., 2011) as summarised below.
The developed methodology organizes the modelling for each beach, starting by the morphodynamic response, specifically changes in supratidal and intertidal beach areas, predicted as a function of hydrodynamic forcing. Accordingly, the primary input variables (X) consist of the most relevant hydrodynamic drivers, while the dependent variables (y) are selected to characterize the beach morphodynamic evolution, focusing on the emerged (supratidal) and transitional (intertidal) zones of the active beach profile. Given the observed lack of a consistent dependency between the supratidal and intertidal zones, the model design incorporates a cross-dependency structure: the intertidal area is included as an input when predicting the supratidal area, and vice versa. This approach enhances the model’s ability to capture potential interactions between profile subzones. The dataset is randomly partitioned into training and testing subsets, comprising 75% and 25% of the data, respectively. This division is well aligned with standard machine learning practices, which commonly allocate 70% to 80% of the data for training purposes (e.g., Kirdeev et al., 2024; e.g., Alhakeem et al., 2022; Huang et al., 2022).
To determine the optimal hyperparameters for the GBR model, and due to the limited dataset size, no separate validation set was created. Instead, 5-fold cross-validation was implemented using the GridSearchCV. This technique systematically explores every possible combination of selected parameters. A total of 8 model configurations were tested for every beach (5 beaches x 2 areas = 80 models total), and the performance was assessed by comparing the model’s prediction across the validation folds (e.g., Belete and Huchaiah, 2022).
Among the various hyperparameters considered (Table 1), the following have been selected to frame the analysis (e.g., Xie et al., 2022):
a) Number of estimators: Defines the number of sequential decision trees, where although a higher number can improve the model accuracy, it also increases the risk of overfitting and computational costs.
b) Learning rate: Modulates the contribution of each tree to the final model, where a lower rate typically enhances the model’s generalizability.
c) Maximum depth of each tree: Allows the model to capture more complex interactions, where higher maxima can also lead to overfitting.
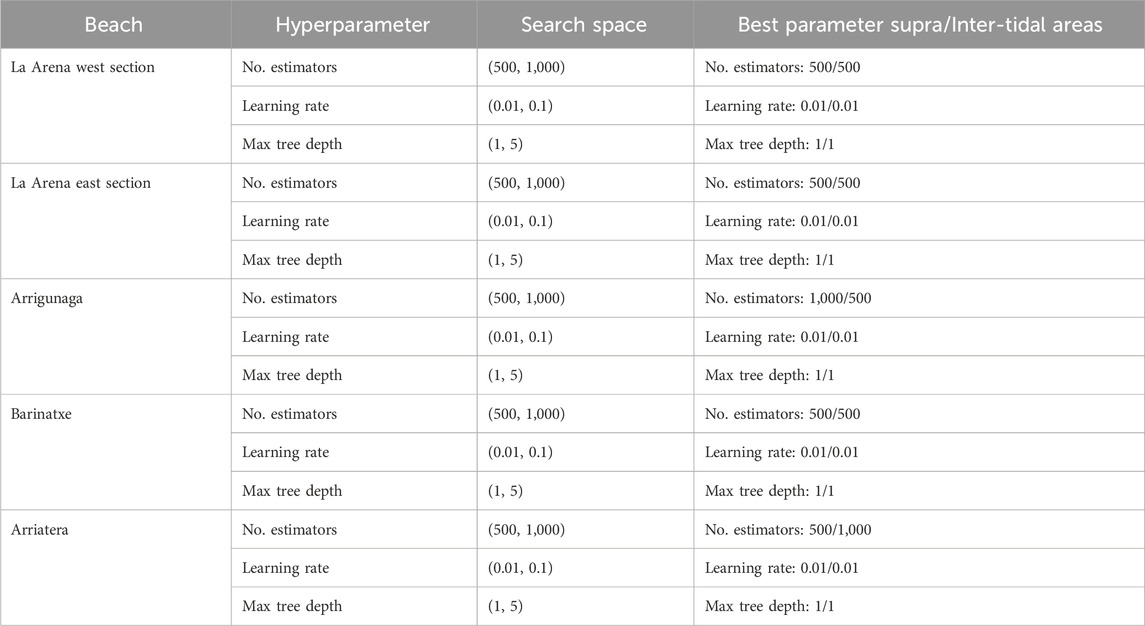
Table 1. Main characteristics of the set of selected hyperparameters to frame prediction models for both the supratidal and intertidal areas of the studied beaches.
Although the GBR was selected for its robustness under low-data conditions, once more data becomes available in the coming years, alternative machine learning models—such as Random Forest or Neural Networks—may offer different performances in other settings, not analysed here due to the current dataset size.
3.6 Metrics for validation
The developed methodology evaluates the performance of the various models and compares the selected ML-based tool with conventional statistical approaches. Three widely used metrics (Meng et al., 2024) are employed:
a) Coefficient of determination (R2), evaluating the model’s capacity to fit the data and is defined in Equation 8:
Where SSR is the sum of the squares of the regression values, and SS is the sum of squares.
b) Mean absolute percentage error (MAPE), evaluating the model’s accuracy to reproduce the data, comparing predicted values (
c) Root Mean Square Error (RMSE), providing a measure of the error between predicted and measured data according to Equation 10 (Wu et al., 2023).
4 Results and discussion
4.1 Wave predictions and uncertainty
The results begin with an extreme value analysis, using data from the W1 and W2 buoys (upper graph in Figure 5), both belonging to the PdE network. As explained earlier, this analysis enables wave climate predictions for beaches that are directly exposed to wave action, namely, La Arena, Barinatxe, and Arriatera. Data from buoy W4, located within the estuary (port) domain in front of Arrigunaga beach (lower panel in Figure 5), allows local predictions for this site. The full set of studied beaches facilitates a comparison of central trends and confidence intervals.
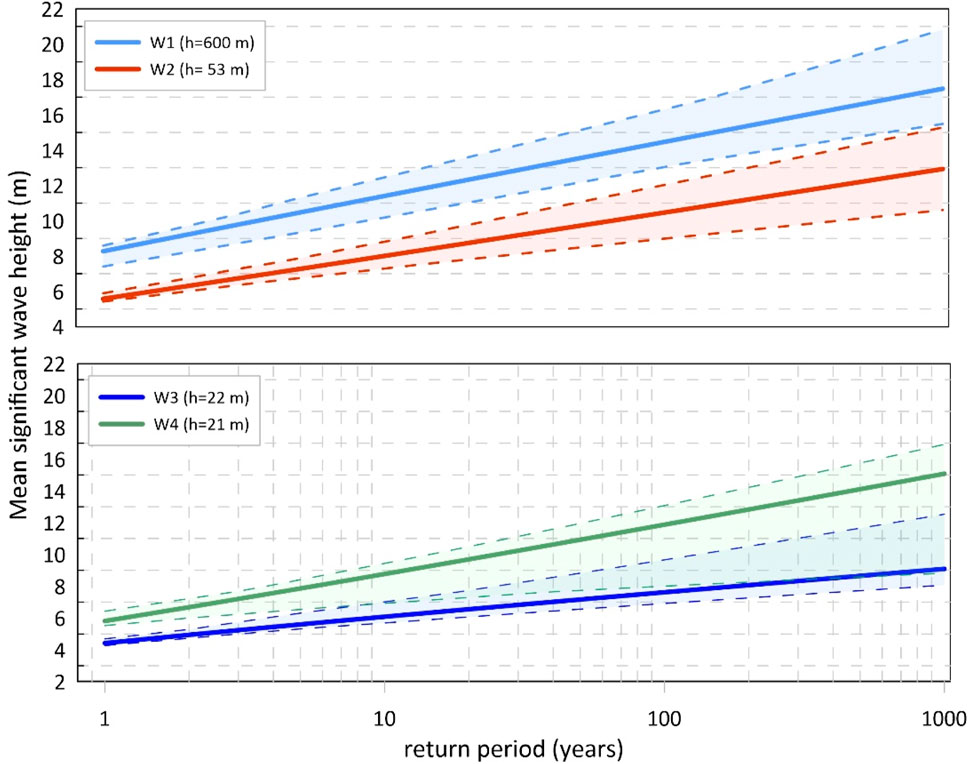
Figure 5. Comparison of extreme distributions of the significant wave height (Hs) against return periods (Tr) for W1 and W2 buoys (upper panel), both from the PdE network and W3 and W4 buoys (lower panel). All charts show the central trends and 90% confidence intervals, while the location of the wave stations appears in Figure 1.
Comparing extreme value distribution functions for Hs at two different depths and from various measuring stations reveals the influence of wave propagation and evolution processes. Notably, the Hs recorded at the W2 buoy are systematically lower than those at W1. This behaviour can be attributed to depth reduction, which increases bottom friction, and local effects such as shoaling, refraction, and diffraction (e.g., Bosboom and Stive, 2023). For a 1000-year return period, the uncertainty for W1 is 30.62%, whereas it rises to 36.16% for W2. These uncertainty levels are consistent but slightly different, due to several factors such as series length duration, where the W1 record spans 32 years, while W2 covers only 19 years. This, together with higher gradients and variability closer to the coast, explains the higher uncertainty at W2.
This analysis provides an initial view of the impact of extreme Hs on the most exposed beaches (La Arena, Barinatxe, and Arriatera-Sopelana, as shown in the upper part of Figure 5). Similarly, it characterizes extreme wave conditions at measurement points within the Nervión estuary (lower part of Figure 5), particularly in front of the Arrigunaga beach. Extreme value distributions from buoys W3 and W4, both located inside the estuary, exhibit similar characteristics because they are recorded at nearly identical depths and subject to similar wave propagation effects, namely, refraction, diffraction, and bottom friction. However, the uncertainty is here more pronounced due to differences in the time series length: W4 covers only 7 years (2016–2023) compared to 21 years for W3 (2001–2022). For a 1000-year return period, the uncertainty (e.g., the gap between the two 90% confidence limits) is 49.17% for W3 and 53.73% for W4. The shorter series at W4 leads to an overestimation of the central Hs value by 5.98 m between the two series for the same return period, highlighting the importance of having sufficiently long time series, where a threshold of 7 years appears to emerge from the so far available data.
4.2 Stationarity control
The methodology next examines potential serial correlations for key hydro-morphodynamic variables, using their monthly time series. From these data, auto-correlograms were generated (see Table 2), showing a decrease in correlation at the second time lag against the Hs parameter as the main driver for the considered beaches. This behaviour, consistent with the state of the art (e.g., Coe et al., 2022; Guevara Díaz, 2014) allows a first differentiation between beaches for eventual clustering:
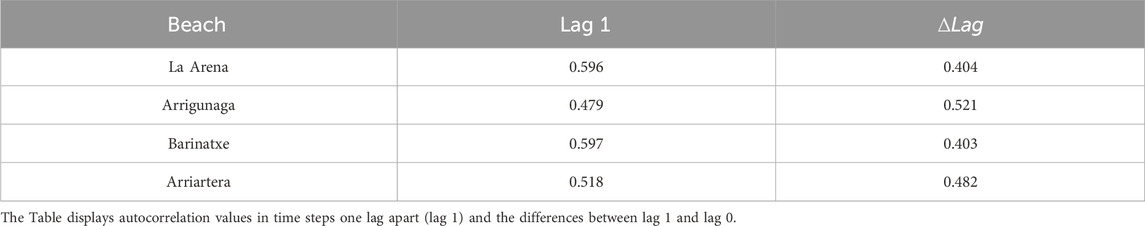
Table 2. Autocorrelations for the Hs time series, as the main driver for morphological evolution in each of the studied beaches.
Type A beaches, such as Arriatera, are characterised by relatively low autocorrelation values (0.518), which indicate reduced temporal persistence and higher short-term variability in the wave signal, probably due to the location (at the eastern sector of the study area as shown in Figure 1) which is more directly exposed to incoming wave energy and therefore less influenced by complex geomorphological constraints. As a result, the system exhibits higher sensitivity to external drivers, enhancing the interpretability of cross-correlation analyses by minimising the confounding effects of internal serial dependence.
Type B beaches, exemplified by Arrigunaga, are situated within the Nervión estuary and are partially shielded by port infrastructure. While this configuration provides substantial sheltering from direct wave action, the wave field is significantly modified by complex physical processes such as refraction and diffraction. These mechanisms redistribute energy spatially and dampen high-frequency variability, resulting in smoothed hydrodynamic signals and, consequently, lower autocorrelation values.
Type C beaches, including Barinatxe and La Arena, display higher autocorrelation values (0.597 and 0.596, respectively), though driven by distinct mechanisms. Barinatxe, despite being outside the estuary, is partially sheltered by offshore rocky shoals, which attenuate incident wave energy and reduce short-term variability in the wave forcing. La Arena, on the other hand, is located in the western part of the study area and is influenced by both geomorphological sheltering and the Barbadún river inlet. These features contribute to complex hydro-morphodynamic interactions that sustain more persistent beach states over time, thereby increasing temporal autocorrelation in the signal.
4.3 Bathymetric control
The derived prediction models, although not explicitly tackling wave propagation phenomena, consider the effects of propagation from process-based simulations using the SWAN code (Table 3), which accounts for key physical mechanisms related to bathymetric effects such as wave refraction, energy spreading around obstacles (diffraction approximation), and wave breaking. The obtained results allow characterizing local wave energy variations at each beach, thereby providing better data conditioning from combined physical and statistical criteria.
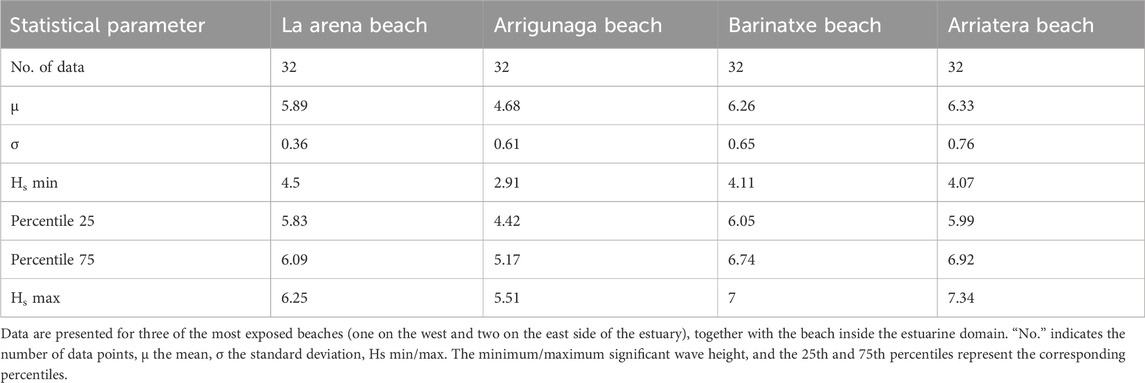
Table 3. Summary of statistical parameters from north-westerly wave storm propagation results using the SWAN model.
From these results, it is apparent that La Arena beach is more sheltered than the two eastern beaches, with a mean Hs of 5.89 m and a standard deviation of 0.36 m. Its minimum propagated storm is 4.50 m, with the 25th and 75th percentiles at 5.83 m and 6.09 m, respectively, and a maximum of 6.25 m. Arrigunaga beach, instead, located within the estuary and, thus, naturally more sheltered from direct wave action, exhibits the lowest values among the beaches, with an average Hs of 4.68 m, a standard deviation of 0.61 m, and extreme waves ranging from 2.91 m to 5.51 m. Barinatxe beach, on the more exposed east side, has a slightly higher average Hs of 6.26 m (σ = 0.65 m), with minimum and maximum values of 4.11 m and 7.00 m, respectively. Arriatera beach records the highest wave heights, indicating less local sheltering by bathymetric features, with an average Hs of 6.33 m, a standard deviation of 0.76 m, and a maximum of 7.34 m.
In summary, beaches protected by shoreline orientation and bathymetry exhibit lower incident wave energy in the near- and intermediate fields. When comparing standard deviations, beaches with more bathymetric sheltering and therefore hydrodynamic filtering display a more homogeneous behaviour, as the filtered waves show lower variability than the natural incident waves on unprotected beaches. This filtering effect is particularly pronounced at La Arena, which benefits from protective rocky shoals under NW storms (see Figure 5) and features a higher level of local protection. A similar, albeit less pronounced effect, is observed at Barinatxe and Arrigunaga.
These results validate the autocorrelation analysis (Table 2), supporting the fact that La Arena and Barinatxe present data series with higher correlations. This analysis confirms that the filtering effect of rocky shoals conditions incident waves, resulting in lower spatial variability on protected beaches. Conversely, beaches without such a rocky protection (e.g., Arriatera) exhibit greater variability. The filtering effect leads to a higher degree of self-correlation among incident waves, whose characteristics (Figure 6) reflect the control exerted by the domain geometry on wave propagation, as indicated by the wave directional roses, which show that waves at La Arena and in minor grade Barinatxe, are lower but more perpendicular compared to those at Arriatera.
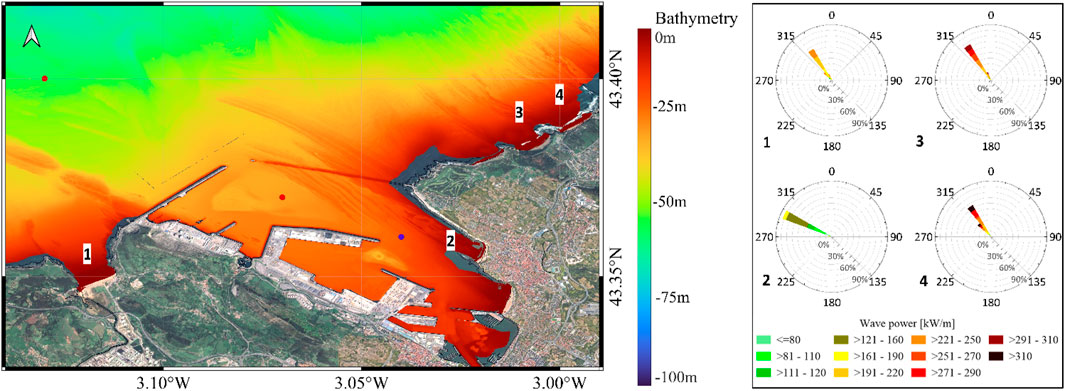
Figure 6. Plots of the digitised bottom bathymetry and shoreline used for simulating wave propagation. The nearshore directional distribution of wave power (wave roses) also demonstrates the different levels of bathymetric control for the propagated sample of 32 annual maxima storms.
From the joint analyses of key hydro-morphodynamic parameters used as predictors in the subsequent machine learning models, the maximum correlations (lag 0 for supratidal and lag 1 for intertidal areas in all cases) can be aggregated and compared, which allows evaluating (Figure 7) the intensity of maximum correlations for two key morphodynamic variables: a) supratidal area; b) intertidal area.
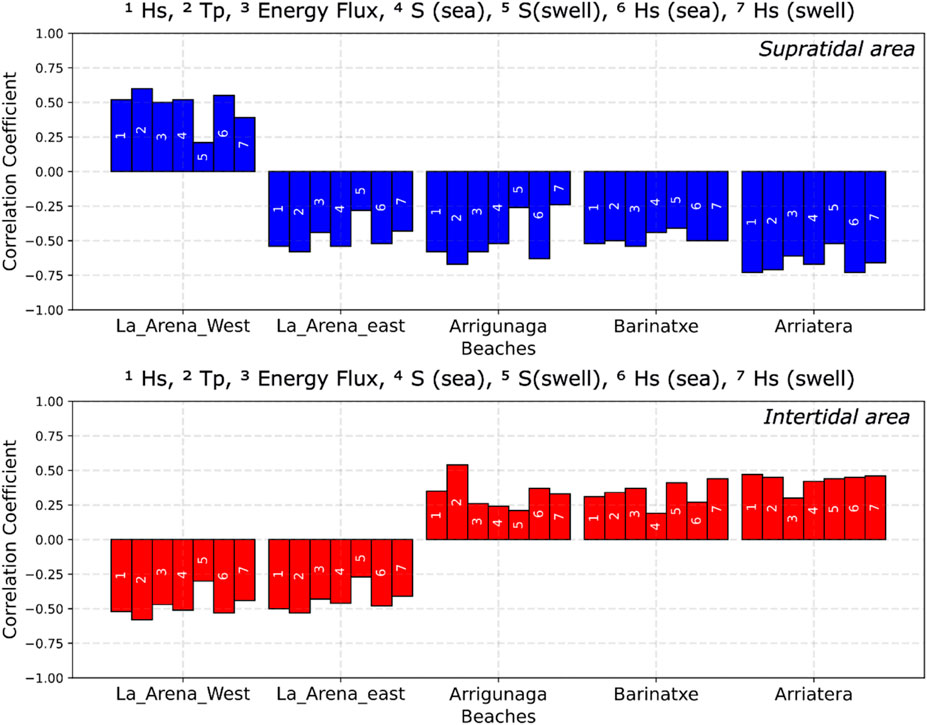
Figure 7. Results of maximum correlations between the key hydro-morphodynamic parameters [including wave steepness (S)], namely, the supratidal area at lag 0 (top image) and the intertidal area at lag 1 for the four studied beaches.
Due to the complex morphodynamics and bathymetry of the La Arena beach (Section 2), located within an embayment with the Barbadun river inlet (Figure 8), correlations for this case improve significantly when considering the differential behaviour of its eastern and western sectors (Figure 7). Such a splitting (Figure 2), allows a more robust analysis of the control exerted by river inlet bars on both the intertidal and supratidal zones. As is common for such pocket beaches, the western sector (influenced by the river) shows positive correlations, indicating that more energetic waves result in greater accretion in the supratidal area. This behaviour can be attributed to three processes (Figure 8): a) enhanced sediment input and hydraulic protection during storm-induced floods; b) protection and nourishment from river mouth bars in the western subdomain, which can merge with the beachfront during energetic wave events, leading to local accretion; c) recirculation within pocket beaches associated to alongshore varying wave heights, which are larger for the more exposed eastern sector (when compared to the more sheltered western sector).
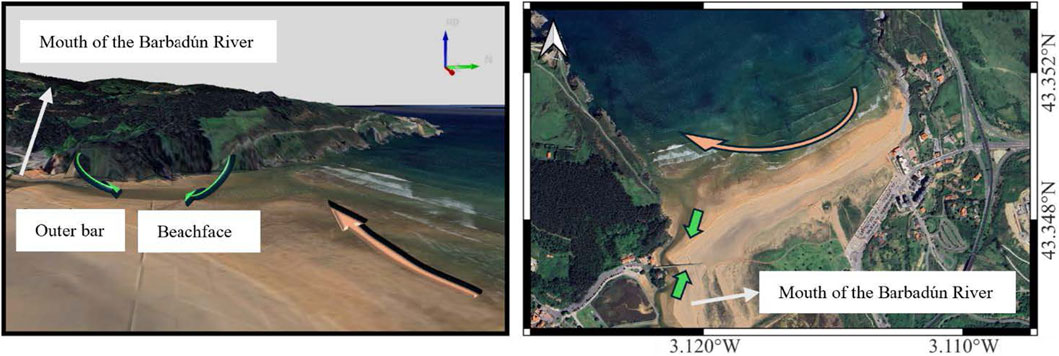
Figure 8. Schematic representation of the interactions (green arrows) between welding river mouth bars (submerged or external to the main beach body), the submerged and emerged beach subdomains and the resulting shoreline evolution (green arrows). The figure also indicates the role of a longitudinal current (beige arrow) due to surf zone gradients induced by wave propagation and differential sheltering from the bathymetry and shoreline orientation.
Furthermore, the steeper western cliff, when compared to the eastern one, can also control wave propagation, reflection and breaking for both sectors. This contributes to a greater longitudinal gradient in the breaker zone from west to east, enhancing the longshore current due to differential set-up. It is important to note that each transport mechanism (Figure 8) operates on its own local time and space scales, where longshore processes tend to dominate at a scale of months to years for the whole beach stretch, while transverse transport typically dominates during high-energy and river discharge events, controlling beach profile dynamics (e.g., Lim and Lee, 2023). The evolution of submerged bars and their effect on the emerged beach (supratidal) area occurs on a slower scale, requiring longer or cumulative storm events.
For the eastern sector of La Arena beach, less affected by river dynamics (Figure 8), a behaviour similar to that of the other beaches can be observed, presenting negative and moderate correlations between hydrodynamic and morphodynamic parameters, associated with an inverse relationship between wave energy and supratidal area. Comparative analyses of supratidal time series for the other beaches show how increasing wave energy leads to larger erosion and, consequently, a reduction in supratidal area. The spatial variability of the correlation between supratidal area and significant local wave height reveals that the near- and intermediate-field bathymetry controls the local incident Hs. This is especially evident at La Arena beach, particularly its eastern sector, less influenced by river discharges and more sheltered by rocky shoals (Table 3) and displaying moderate negative correlations, similar to those observed at Barinatxe beach (r = −0.52 for Hs). This pattern is consistent with the bathymetric filtering effect demonstrated by the SWAN model simulations, which indicate higher wave dissipation before reaching the outer surf zone of these sheltered beaches. The opposite pattern can be illustrated by Arriatera beach, with a gentler bathymetry and higher incident wave heights, which leads to the highest negative correlations (r = −0.73 for Hs), suggesting a strong wave control over its supratidal area, where increased wave energy results in supratidal erosion.
For the intertidal area, the differences in correlation coefficients across the studied beaches reflect again the influence of bathymetry, local geomorphological controls. Maximum correlations in the intertidal zone occur at lag 1, 1 month later than for the supratidal zone, indicating that the beach profile response is significantly delayed (Figure 7). The reaction time can be defined as the period between hydrodynamic forcing and beach response, where the relaxation time is the duration from the end of hydrodynamic forcing till the recovery of the beach modal state (Colin, 2007). All studied beaches are characterised by a mesotidal regime, which expands the active beach profile as the wave run-up zone shifts vertically across the intertidal range throughout the tidal cycle. This spatial and temporal variability distributes incident wave energy over a broader cross-shore area, thereby reducing the intensity of morphodynamic forcing at any specific point. As a result, sediment adjustment processes are more gradual and distributed, both spatially and temporally, leading to longer relaxation times (Poate et al., 2014).
The morphodynamic control of submerged bars, intertidal or river inlet, must also be considered since it contributes to explaining the complex set of observed morphodynamic responses (Colosimo et al., 2023; Masselink et al., 2006). La Arena beach, with low-amplitude and smoother bars, experiences higher mean sea levels during wave storms due to the bar control on wind and wave set-up. This leads to a reduced intertidal area, which explains the observed negative correlations. Beaches with steeper profiles tend to experience an enhanced bathymetric control, as illustrated by the Arriatera beach, where a high positive correlation (r = 0.65) between significant wave height and intertidal area indicates that the beach profile responds directly to variations in wave energy but with an opposite trend to that of the supratidal area. In this case, during energetic wave events, sediment is transported from the supratidal to the intertidal zone, a pattern also displayed, though less pronounced, by the Barinatxe and Arrigunaga beaches.
4.4 Morphodynamic predictions with GBR
The application of machine learning (ML) techniques has proven its effectiveness in many research fields, especially when handling large volumes of data and performing complex tasks such as prediction, image classification or natural language processing (e.g., Uc Castillo et al., 2025). The Gradient Boosting Regressor (GBR) technique offers improved predictive performance compared to conventional correlation-based statistics when working with limited time series and complex inter-variable relationships. By fine-tuning the hyperparameters of the GBR model for each beach, the predictive accuracy for the morphodynamic response (in terms of the evolving intertidal and supratidal areas) can be significantly improved.
The beaches analysed in this study are characterised by short time series for a limited set of key variables that do not fully capture the complexity of dominant hydro-morphodynamic interactions. As shown in previous sections, the spatial variability among beaches demonstrates that each case study is controlled by its own set of local processes and spatio-temporal scales, which ultimately determine the dominant hydro-morphodynamic patterns. For that reason, the model also includes variables that are strongly correlated, like Hs and Energy flux.
La Arena beach is highly influenced by its near-field bathymetry, embedded geometry and sheltering rocky shoals. This complexity is further increased by the differential effects produced by the inlet of the Barbadún river, which results in a spatially and temporally non-homogeneous behaviour, making analyses and predictions more challenging than for other beaches with a lower level of interactions, such as the Arriatera beach. In contrast, beaches in more sheltered areas, such as Arrigunaga (located within the estuary), exhibit hydro-morphodynamic patterns that are modulated by geomorphic controls, resulting in lower wave energy compared to more exposed beaches. Such spatial differences necessitate a high-resolution adjustment of key parameters, including the number of decision trees and learning rates, to properly capture local variability. Similarly, beaches like Barinatxe, which have the characteristics of semi-urban beaches without clearly defined morphological features, also require some local hyperparameter tuning, for instance, to tackle filtering effects by sandbars.
A summary of the main statistics that characterize the behaviour of the supratidal and intertidal areas for all studied beaches is presented in Table 4; Figure 9. These results reveal clear spatial differences in correlation coefficients, RMSE and MAPE values, which must be considered to qualify the predictions and to support beach maintenance decisions.
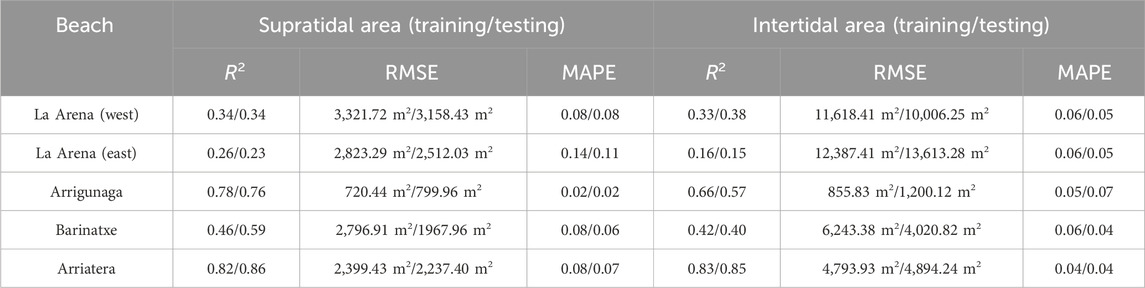
Table 4. Summary of main statistics from the GBR model to characterize the quality of morphodynamic predictions for each of the studied beaches, in terms of R2, RMSE and MAPE, distinguishing between results from the training and testing sets (training/testing).
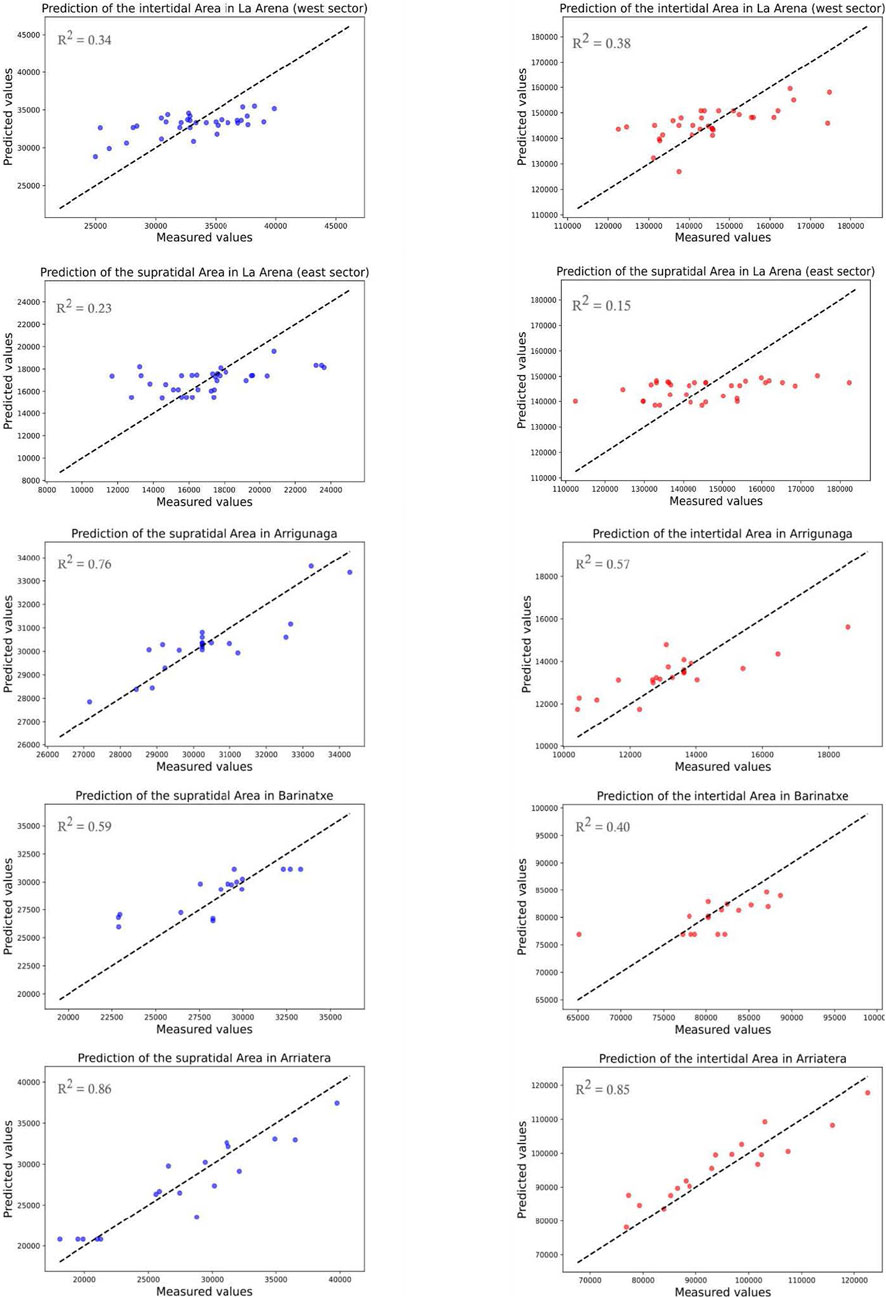
Figure 9. Scatter plots to assess morphodynamic prediction capabilities for the key selected variables at each of the studied beaches. Test sample results are shown, with supratidal areas [m2] in blue and intertidal areas [m2] in red.
For the western sector of La Arena beach, the GBR model predicts average area evolution well, although it struggles with the extremes. To illustrate that, the supratidal area yielded a MAPE of 0.08 and an R2 of 0.32 for both training and testing data, while the intertidal model produced a MAPE of 0.05 and an R2 of 0.38 on the testing results. These deviations reflect not only the limitations of the GBR model but, more importantly, the inherent morphodynamic complexity of this semi-enclosed coastal system. The site is characterized by highly non-linear sediment transport processes, episodic riverine inputs, and heterogeneous bathymetric controls, all of which introduce substantial variability. This variability is difficult to capture reliably using current modelling approaches, highlighting the challenges of accurately predicting morphodynamic behaviour in environments governed by complex and interacting physical drivers.
On the eastern sector of La Arena beach, the results differ between supratidal and intertidal zones. The supratidal area model shows a MAPE of 0.14 in the training set and 0.11 in the test set, with RMSE values of 2,823 m2 and 2,512 m2, respectively, and R2 values of 0.26 (training) and 0.23 (testing). In contrast, the intertidal area model exhibits a MAPE of 0.05 (test set) with an RMSE of 13,613 m2 and R2 values of 0.16 (training) and 0.15 (testing). This discrepancy may be due to the partial discrimination between East and West sectors, which continue interacting in the recorded intertidal area time series.
Despite those beaches’ relatively low R2 values, the MAPE remains low across both supra and intertidal areas. This seemingly contradictory result can be attributed to several factors. First, the absolute values of morphodynamic areas are large, meaning that even if the model exhibits a higher error, the relative error (MAPE) remains low due to the scale of the data. Additionally, because the real morphodynamic values exhibit low magnitude variability, the model may struggle to explain the observed variance, effectively leading to this low MAPE. Furthermore, MAPE is a relative error metric, meaning that large absolute values of morphodynamic data in m2 and the limited dataset may keep the error percentage low despite the RMSE and R2 values. This issue has been extensively discussed in model evaluation literature, where metrics such as RMSE are highly sensitive to variability and data scale, while MAPE often remains stable (e.g., Chai and Draxler, 2014; Willmott and Matsuura, 2005).
The GBR model for the Arrigunaga beach was adjusted by increasing the number of trees to 1,000, while maintaining a learning rate of 0.01. A low learning rate suggests slower convergence, requiring more iterations to reach a solution, and this explains the larger number of trees, which helps to reduce overfitting. The proposed configuration achieved a test R2 of 0.76, a MAPE of 0.02, and an RMSE of around 800 m2, representing a very good model performance for this beach.
At Barinatxe beach, the model achieved a MAPE of 0.09% in training and 0.04% in testing for the supratidal area, with RMSE values of 2,882 m2 (training) and 1,339 m2 (testing). The R2 values were 0.48 and 0.65, respectively, indicating a strong predictive capability. For the intertidal area, the model gave a MAPE of 0.06% in training and 0.04% in testing, with RMSE values of 6,243 m2 (training) and 4,021 m2 (testing), and R2 values of 0.42 (training) and 0.40 (testing). The scatter plots in Figure 9 demonstrate that the model captures most of the observed variability, both for average and extreme values.
Finally, at Arriatera beach, the GBR model delivered robust predictions for both supratidal and intertidal areas. The supratidal area model accomplished a MAPE of 0.08 for the training and 0.07 for the testing set, with RMSE values of 2,399 m2 and 2,237 m2, and R2 values of 0.82 and 0.86, respectively. Similarly, the intertidal area maintained a constant MAPE of 0.04 in both datasets, with RMSE values of 4,794 m2 and 4,894 for training and testing sets, and R2 values of 0.83 on the training and 0.85 on the testing, indicating a very reliable performance to predict beach morphodynamics.
4.5 GBR prediction improvement over conventional techniques
Despite the limited number of morphodynamic observations available, the proposed methodology demonstrates that it is possible to predict morphological changes on pocket beaches using ML techniques, taking into account that some key geomorphological parameters (e.g., d50) have not been considered. Coastal systems, featuring expensive measurements and a harsh environment, are usually characterised by smaller data sets than the ones available for ML in large-scale, data-driven models. This challenge emphasizes the need for advances in methodologies that yield predictions with an identifiable and controllable degree of uncertainty.
To provide a more conventional benchmark and assess the improvement achieved by the GBR model, a third-degree polynomial regression was implemented as a comparative baseline. This model incorporated dimensionality reduction using Principal Component Analysis (PCA), a computationally efficient approach commonly applied in morphodynamic modelling. However, despite its simplicity, this method struggles to capture the complex and nonlinear interactions that characterize beach morphodynamics, thereby limiting its predictive performance relative to ensemble-based ML techniques like GBR (e.g., Montaño et al., 2020). Moreover, this polynomial regression models face considerable limitations and exhibits serious signs of overfitting. This is primarily due to the limited data available, but also to the numerous nonlinear factors that influence beach morphodynamics. Although traditional regression models yield predictive equations that can inform beach management, they fail to capture the inherent complexity of these systems. As shown in Table 5, morphodynamic variables are affected by a wide range of processes and scales, leading to interdependent driving variables, such as wave direction, period, and height. Hydro-morphodynamic interactions also require the integration of additional variables, including wave energy and bathymetric changes during high-energy events or consecutive storms.
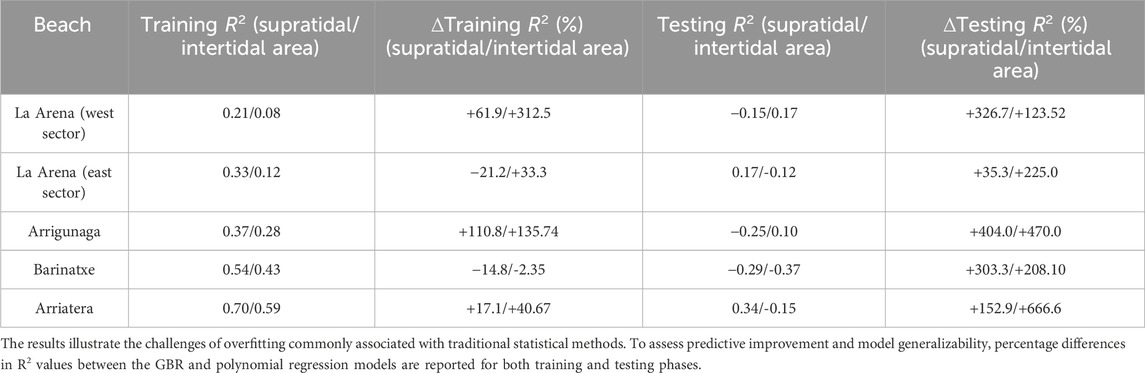
Table 5. Limitations of conventional morphodynamic predictions based on third-degree polynomial regression with dimensionality reduction via Principal Component Analysis (PCA) for both supratidal and intertidal areas.
Furthermore, nonlinear interactions and varying spatial and temporal scales among these variables make it challenging to build an accurate predictive model using conventional techniques. As a result, such methods often produce unacceptable error intervals for decision-making and can suffer from overfitting, leading to erroneous predictions under different conditions. For example, the case of Arriatera beach (Table 5) illustrates how conventional models may adjust reasonably well to training data but fail to predict the correct behaviour under new conditions or datasets.
In contrast, Machine Learning (ML) methods, such as the Gradient Boosting Regressor (GBR) (see Table 4), exhibit a more robust and generalizable predictive capacity, particularly under conditions of limited morphodynamic data and nonlinear system dynamics. Table 5 includes the percentage variation in R2 values between the GBR and conventional regression models for both training and testing datasets, offering a clearer evaluation of the performance improvements achieved.
Notably, although certain cases, such as Barinatxe and the eastern sector of La Arena, show slightly lower R2 values during training under the GBR approach, this should not be interpreted as a deterioration in model performance. Rather, it highlights the overfitting tendency of the polynomial regression model, which achieves artificially high accuracy on the training data but fails to generalize to unforeseen conditions, as evidenced by negative R2 values during testing. By contrast, GBR models demonstrate a more conservative yet stable predictive behaviour, better aligned with the inherent variability of real-world coastal systems. This consistency makes them better suited for forecasting in complex morphodynamic environments where physical processes are highly variable and data availability is constrained.
5 Concluding remarks and future work
The performed analysis demonstrates that ML models significantly enhance predictive capabilities for beach behaviour under variable constraints, which encompass Cantabrian beaches like the ones here analysed, but also other systems, like Mediterranean ones. Predictive performance depends on local constraints, yielding better results for more energetic metocean conditions like the ones here considered and for key morphodynamic variables like the supratidal area. Features such as rocky shoals act as natural coastal defences, exerting a hydrodynamic filtering effect that dissipates incoming wave energy. This results in a reduction in the intensity of the morphodynamic response, contributing to increased stability of the beach profile in sheltered areas (e.g., Huang et al., 2022; Morell et al., 2022).
The hydro-morphodynamic characterization of the four beaches has led to a knowledge-based selection of key variables and to identify dominant response patterns, paving the way for an improved characterization of beach responses under varying wave conditions. Beaches with higher autocorrelation (e.g., La Arena and Barinatxe) exhibit a stronger influence of morphological constraints, which reduces variability in the hydrodynamic forcing. This, in turn, affects the cross-correlation analysis, showing that local filtering (due to bathymetry, contours, and even fluvial inputs such as the Barbadún river inlet) strongly influences the morphodynamic response. Such a conclusion frames the potential to extrapolate this approach to other environments with different tidal ranges and wave energy, like the Mediterranean for the Spanish coast. Nevertheless, it is acknowledged that other relevant processes, such as sediment budget variability, erosion volumes, and overwash dynamics, should also play a critical role in shaping beach responses. Due to the inherent uncertainties associated with defining and quantifying these processes, they have not been incorporated in the present analysis. However, their potential influence on morphodynamic behaviour remains significant and will be addressed in future research.
Beaches inside and outside the Nervión estuary show significant negative correlations between wave drivers and supratidal area. This behaviour, illustrated by Arrigunaga and Arriatera beaches, demonstrates that as incident wave energy increases, the supratidal area tends to decrease. This trend may reflect a natural self-defence mechanism, wherein erosion of the supratidal zone is accompanied by a growth of the intertidal area, leading to a morphodynamic evolution toward more dissipative states. Furthermore, the observed spatial heterogeneity in correlation coefficients underscores the challenges faced by general statistical predictors and emphasizes the importance of local processes.
The performed analysis also highlights the critical role of seabed and coastal contours in modulating incoming wave energy and, consequently, in shaping the morphodynamic response of the beach. For example, La Arena beach exhibits a distinct behaviour due to the influence of the Barbadún river and the formation of submerged inlet bars, while Barinatxe beach, benefiting from the local protection of rocky shoals, demonstrates that bathymetric filtering can partially decouple the beach response from incident wave characteristics. In contrast, Arrigunaga and Arriatera beaches display a closer correspondence between incident wave properties and morphological responses.
Moreover, the limited length of the available time series emphasizes the advantage of ML-based methods over conventional statistical approaches. By overcoming the inherent limitations of traditional techniques, especially under extreme conditions or in areas with complex hydro-morphodynamic patterns, ML models can significantly improve the analysis and prediction of morphodynamic responses under a wide range of conditions.
While the present study has demonstrated the predictive capabilities of the GBR model to analyse coastal morphodynamics of pocket Atlantic beaches, several challenges remain open for further research and methodological improvements. One important aspect to explore is the model performance based on the percentage of data allocated for training and testing, which can be addressed with additional data and sensitivity analyses. The impact of different train-test split ratios on the GBR model’s predictive accuracy should be systematically examined to determine the optimal balance between training depth and generalization capacity.
Future research should also explore the potential integration of deep learning models, such as Long Short-Term Memory (LSTM) networks and Temporal Convolutional Networks (TCN) (e.g., Chambers et al., 2024; Lv et al., 2023). These architectures are specifically designed to capture complex, nonlinear relationships within time-dependent data, making them particularly suited for morphodynamic modelling of complex beaches under climate change and weaker driving factors, such as beach face slope, sediment grain size, embayment geometry and tidal range.
In summary, the results show that ML-based methods, specifically the GBR model, offer substantial improvements over conventional statistical techniques for predicting morphodynamic responses in pocket beaches. ML approaches reduce the risk of overfitting and provide more robust predictions, even under extreme events or in areas with complex hydro-morphodynamic patterns in other environments. As more data becomes available, the reliability of these predictions will further improve, ultimately resulting in a better protection and maintenance of vulnerable coastal systems.
Data availability statement
The datasets presented in this article are not readily available because they are part of a larger research project that is still ongoing, and their dissemination is subject to institutional restrictions. Requests to access the datasets should be directed to Manuel Viñes, bWFudWVsLnZpbmVzQHVwYy5lZHU=.
Author contributions
MV: Conceptualization, Data curation, Formal Analysis, Investigation, Methodology, Resources, Software, Validation, Visualization, Writing – original draft, Writing – review and editing. AS-A: Conceptualization, Investigation, Supervision, Validation, Visualization, Writing – review and editing. IE: Data curation, Supervision, Validation, Writing – original draft. CM: Conceptualization, Investigation, Methodology, Supervision, Validation, Visualization, Writing – review and editing. JF: Data curation, Supervision, Validation, Writing – review and editing. JS: Data curation, Supervision, Validation, Writing – review and editing. AA: Data curation, Supervision, Validation, Writing – review and editing. PL: Data curation, Supervision, Validation, Writing – review and editing. MG: Conceptualization, Investigation, Methodology, Supervision, Validation, Visualization, Writing – review and editing. AO: Supervision, Validation, Writing – review and editing. MH: Supervision, Validation, Writing – review and editing. MG: Data curation, Supervision, Validation, Writing – review and editing. AS-A: Conceptualization, Investigation, Methodology, Supervision, Validation, Writing – review and editing.
Funding
The author(s) declare that financial support was received for the research and/or publication of this article. This research is supported by the European Union’s Horizon 2020 Research and Innovation Action under Grant No. 101037097 (REST-COAST project). The authors also wish to acknowledge the Departament de Recerca i Universitats de la Generalitat de Catalunya (Ref. Convocatoria d’ajuts a Grups de Recerca Catalunya (SGR-Cat 2021) 2021SGR00600), who supported the research group and the technical assistance for the environmental monitoring of the sand extraction project in the northern sector of Zone II of the Port Authority of Bilbao, and of the central breakwater project for the extension of the Port of Bilbao in the Outer Abra (2022-2026).
Conflict of interest
The authors declare that the research was conducted in the absence of any commercial or financial relationships that could be construed as a potential conflict of interest.
The author(s) declared that they were an editorial board member of Frontiers, at the time of submission. This had no impact on the peer review process and the final decision.
Generative AI statement
The author(s) declare that no Generative AI was used in the creation of this manuscript.
Publisher’s note
All claims expressed in this article are solely those of the authors and do not necessarily represent those of their affiliated organizations, or those of the publisher, the editors and the reviewers. Any product that may be evaluated in this article, or claim that may be made by its manufacturer, is not guaranteed or endorsed by the publisher.
Supplementary material
The Supplementary Material for this article can be found online at: https://www.frontiersin.org/articles/10.3389/fenvs.2025.1600473/full#supplementary-material
References
Abalia, A., de Santiago, I., Liria, P., Garnier, R., Epelde, I., Nieto, A., et al. (2024). Analysis of the coastal flooding exposure of embayed beaches at a regional scale using a video monitoring network: basque Coast (Spain). Ocean Coast. Manag. 254, 107193. doi:10.1016/j.ocecoaman.2024.107193
Alfaro Chavarría, H., Díaz Hernández, G., and García Menéndez, M. (2017). Estudio de la dinámica del oleaje en el litoral pacífico de Costa Rica: metodologÍAS de regionalización Y avances en servicios relativos al clima marítimo. Cantabria: Universidad de Cantabria. Available online at: http://hdl.handle.net/10902/12118.
Al-Ghosoun, A., Gumus, V., Seaid, M., and Simsek, O. (2025). Predicting morphodynamics in dam-break flows using combined machine learning and numerical modelling. Model. Earth Syst. Environ. 11 (1), 74. doi:10.1007/s40808-024-02215-9
Allard, R., and Rogers, E. (2002). Software design description for the simulating WAves nearshore model (SWAN). Mississippi, EE UU: Naval Research Laboratory.
Alhakeem, Z. M., Jebur, Y. M., Henedy, S. N., Imran, H., Bernardo, L. F. A., and Hussein, H. M. (2022). Prediction of Ecofriendly Concrete Compressive Strength Using Gradient Boosting Regression Tree Combined with GridSearchCV Hyperparameter-Optimization Techniques. Materials, 15(21), 7432. doi:10.3390/ma15217432
Alomari, H. W., Al-Badarneh, A. F., Al-Alaj, A., and Khamaiseh, S. Y. (2023). Enhanced approach for agglomerative clustering using topological relations. IEEE Access 11, 21945–21967. doi:10.1109/ACCESS.2023.3252374
Altomare, C., Gironella, X., Marzeddu, A., Viñes Recasens, M., Mösso, C., and Sospedra, J. (2024). Impact of focused wave groups on pier structures: a case study of severe breaking waves at Pont del Petroli during storm Gloria. Front. Built Environ. 10. doi:10.3389/fbuil.2024.1372906
An, H., Zhao, F., Li, H., Meng, Z., Ding, H., Ding, Y., et al. (2025). The typical sand-fixing plants in the Ulan Buh desert-oasis area significantly changed the distribution pattern of surface sediments. Front. Environ. Sci. 13. doi:10.3389/fenvs.2025.1556083
Belete, D. M., and Huchaiah, M. D. (2022). Grid search in hyperparameter optimization of machine learning models for prediction of HIV/AIDS test results. Int. J. Comput. Appl. 44 (9), 875–886. doi:10.1080/1206212X.2021.1974663
Bonta, J. V., and Rao, A. R. (1988). Factors affecting the identification of independent storm events. J. Hydrology 98 (3–4), 275–293. doi:10.1016/0022-1694(88)90018-2
Booij, N., Holthuijsen, L. H., and Ris, R. C. (1997). The “Swan” wave model for shallow water. Coast. Eng. 1996, 668–676. doi:10.1061/9780784402429.053
Bosboom, J., and Stive, M. (2023). Coastal dynamics. Delft, The Netherlands: TU Delft OPEN Publishing. doi:10.5074/T.2021.001
Bundy, A., Shannon, L. J., Rochet, M.-J., Neira, S., Shin, Y.-J., Hill, L., et al. (2010). The good(ish), the bad, and the ugly: a tripartite classification of ecosystem trends. ICES J. Mar. Sci. 67 (4), 745–768. doi:10.1093/icesjms/fsp283
Carevic, D., Loncar, G., and Prsic, M. (2012). Transformation of statistical and spectral wave periods crossing a smooth low-crested structure. Oceanologia 54 (1), 39–58. doi:10.5697/oc.54-1.039
Chai, T., and Draxler, R. R. (2014). Root mean square error (RMSE) or mean absolute error (MAE)? – arguments against avoiding RMSE in the literature. Geosci. Model Dev. 7 (3), 1247–1250. doi:10.5194/gmd-7-1247-2014
Chambers, J. D., Cook, M. J., Burkitt, A. N., and Grayden, D. B. (2024). Using long short-Term Memory (LSTM) recurrent neural networks to classify unprocessed EEG for seizure prediction. Front. Neurosci. 18, 1472747. doi:10.3389/fnins.2024.1472747
Choi, K., Yi, J., Park, C., and Yoon, S. (2021). Deep learning for anomaly detection in time-series data: review, analysis, and guidelines. IEEE Access 9, 120043–120065. doi:10.1109/ACCESS.2021.3107975
Coe, R. G., Manuel, L., and Haselsteiner, A. F. (2022). On limiting the influence of serial correlation in metocean data for prediction of extreme return levels and environmental contours. Ocean. Eng. 266, 113032. doi:10.1016/j.oceaneng.2022.113032
Conjunto de datos_REDEXT (2015). Puertos Del Estado, 1–5. Available online at: https://bancodatos.puertos.es/BD/informes/INT_2.pdf.
Colosimo, I., van Maren, D. S., de Vet, P. L. M., Winterwerp, J. C., and van Prooijen, B. C. (2023). Winds of opportunity: The effects of wind on intertidal flat accretion. Geomorphology, 439, 108840. doi:10.1016/j.geomorph.2023.108840
Colin, W. (2007). The Natural Resilience of Coastal Systems: Primary Concepts. University of Wollongong. Chapter. Avalilable online at: https://hdl.handle.net/10779/uow.27691047.v1.
de Alfonso, M., Lin-Ye, J., García-Valdecasas, J. M., Pérez-Rubio, S., Luna, M. Y., Santos-Muñoz, D., et al. (2021). Storm gloria: Sea state evolution based on in situ measurements and modeled data and its impact on extreme values. Front. Mar. Sci. 8. doi:10.3389/fmars.2021.646873
de Santiago, I., Camus, P., González, M., Liria, P., Epelde, I., Chust, G., et al. (2021). Impact of climate change on beach erosion in the Basque Coast (NE Spain). Coast. Eng. 167, 103916. doi:10.1016/j.coastaleng.2021.103916
De Santiago, I., Morichon, D., Abadie, S., Castelle, B., Liria, P., and Epelde, I. (2013). Video monitoring nearshore sandbar morphodynamics on a partially engineered embayed beach. J. Coast. Res. 65, 458–463. doi:10.2112/SI65-078.1
Dyer, A. S., Zaengle, D., Nelson, J. R., Duran, R., Wenzlick, M., Wingo, P. C., et al. (2022). Applied machine learning model comparison: predicting offshore platform integrity with gradient boosting algorithms and neural networks. Mar. Struct. 83, 103152. doi:10.1016/j.marstruc.2021.103152
Epelde, I., Liria, P., de Santiago, I., Garnier, R., Uriarte, A., Picón, A., et al. (2021). Beach carrying capacity management under Covid-19 era on the Basque Coast by means of automated coastal videometry. Ocean & Coast. Manag. 208, 105588. doi:10.1016/j.ocecoaman.2021.105588
Estado, P. (2020). Maximum wave heights by direction (significant wave height): Bilbao buoy (2004–2020) [Technical report]. Madrid, Spain: Oceanographic Data Bank of Puertos del Estado.
Estado, P. (2023). Maximum wave heights by direction (significant wave height): Abra-Zierbena Coastal Buoy (2001–2023) [Technical report]. Madrid, Spain: Oceanographic Data Bank of Puertos del Estado.
Estado, P. (2024). Maximum wave heights by direction (significant wave height): Bilbao–Vizcaya buoy (1990–2024) [Technical report]. Madrid, Spain: Oceanographic Data Bank of Puertos del Estado.
Faranda, D., Lucarini, V., Turchetti, G., and Vaienti, S. (2011). Numerical convergence of the block-maxima approach to the generalized extreme value distribution. J. Stat. Phys. 145 (5), 1156–1180. doi:10.1007/s10955-011-0234-7
Fellowes, T. E., Vila-Concejo, A., Gallop, S. L., Harley, M. D., and Short, A. D. (2022). Wave shadow zones as a primary control of storm erosion and recovery on embayed beaches. Geomorphology 399, 108072. doi:10.1016/j.geomorph.2021.108072
Gallop, S. L., Kennedy, D. M., Loureiro, C., Naylor, L. A., Muñoz-Pérez, J. J., Jackson, D. W. T., et al. (2020). Geologically controlled sandy beaches: their geomorphology, morphodynamics and classification. Sci. Total Environ. 731, 139123. doi:10.1016/j.scitotenv.2020.139123
González-Marco, D., Sánchez-Arcilla, A., and Panagiotis, P. (2007). “Analysis of extremes for hazard assessment,” in Proceedings of the 32nd. Venice, Italy: IAHR World Congress.
González-Marco, D., Sierra, J. P., Fernández de Ybarra, O., and Sánchez-Arcilla, A. (2008). Implications of long waves in harbor management: the Gijón port case study. Ocean & Coast. Manag. 51 (2), 180–201. doi:10.1016/j.ocecoaman.2007.04.001
Gorostiaga, J., and Díez, I. (1996). Changes in the sublittoral benthic marine macroalgae in the polluted area of Abra de Bilbao and proximal coast (Northern Spain). Mar. Ecol. Prog. Ser. 130, 157–167. doi:10.3354/meps130157
Grifoll, M., Fontán, A., Ferrer, L., Mader, J., González, M., and Espino, M. (2009). 3D hydrodynamic characterisation of a meso-tidal harbour: the case of Bilbao (northern Spain). Coast. Eng. 56 (9), 907–918. doi:10.1016/j.coastaleng.2009.04.001
Guevara Díaz, J. M. (2014). “Uso correcto de la correlación cruzada en Climatología: el caso de la presión atmosférica entre Taití y Darwin.” Caracas, Venezuela: Terra. Nueva Etapa, 47, 79–102. Available online at: https://www.redalyc.org/articulo.oa?id=72132516006.
Hawkes, P. J., Gonzalez-Marco, D., Sánchez-Arcilla, A., and Prinos, P. (2008). Best practice for the estimation of extremes: a review. J. Hydraulic Res. 46 (Suppl. 2), 324–332. doi:10.1080/00221686.2008.9521965
Holland, K. T., Holman, R. A., Lippmann, T. C., Stanley, J., and Plant, N. (1997). Practical use of video imagery in nearshore oceanographic field studies. IEEE J. Ocean. Eng. 22 (1), 81–92. doi:10.1109/48.557542
Huang, D., Grifoll, M., Sanchez-Espigares, J. A., Zheng, P., and Feng, H. (2022). Hybrid approaches for container traffic forecasting in the context of anomalous events: the case of the Yangtze River Delta region in the COVID-19 pandemic. Transp. Policy 128, 1–12. doi:10.1016/j.tranpol.2022.08.019
Hunt, N. (2016). Chapter 8: autocorrelation function, mutual information, and correlation dimension. Omaha, Nebraska, USA: Department of Biomechanics.
Ibaceta, R., and Harley, M. D. (2024). Data-driven modelling of coastal storm erosion for real-time forecasting at a wave-dominated embayed beach. Coast. Eng. 193, 104596. doi:10.1016/j.coastaleng.2024.104596
Jamshidi, S. (2024). Flow measurement in the southern coast of the Caspian Sea. Front. Mar. Sci. 10. doi:10.3389/fmars.2023.1219658
Jarušková, D., and Hanek, M. (2006). Peaks over threshold methodin comparison with block-maxima method for estimating highreturn levels of several northern moravia precipitation and dis-charges series. J Hydrol Hydromech Vodohospodarsky Casopis. Bratislava, Slovakia. 54 (4), 309–319.
Jebb, A. T., Tay, L., Wang, W., and Huang, Q. (2015). Time series analysis for psychological research: examining and forecasting change. Front. Psychol. 6, 727. doi:10.3389/fpsyg.2015.00727
Jenkins, R. L., Passeri, D. L., Smith, C. G., Thompson, D. M., and Smith, K. E. L. (2023). Modeling the effects of interior headland restoration on estuarine sediment transport processes in a marine-dominant estuary. Front. Mar. Sci. 10. doi:10.3389/fmars.2023.1217830
Kapelonis, Z. G., Gavriliadis, P. N., and Athanassoulis, G. A. (2015). Extreme value analysis of dynamical wave climate projections in the Mediterranean Sea. Procedia Comput. Sci. 66, 210–219. doi:10.1016/j.procs.2015.11.025
Kirdeev, A., Burkin, K., Vorobev, A., Zbirovskaya, E., Lifshits, G., Nikolaev, K., et al. (2024). Machine learning models for predicting risks of MACEs for myocardial infarction patients with different VEGFR2 genotypes. Front. Med. 11, 1452239. doi:10.3389/fmed.2024.1452239
Kumar, P., and Leonardi, N. (2023). Coastal forecast through coupling of artificial intelligence and hydro-morphodynamical modelling. Coast. Eng. J. 65 (3), 450–469. doi:10.1080/21664250.2023.2233724
Lei, Z., Wu, W., Gu, Y., Zhai, F., and Li, P. (2023). A general method to determine the optimal whitecapping dissipation coefficient in the SWAN model. Front. Mar. Sci. 10. doi:10.3389/fmars.2023.1298727
Lim, C., and Lee, J.-L. (2023). Derivation of governing equation for short-term shoreline response due to episodic storm wave incidence: comparative verification in terms of longshore sediment transport. Front. Mar. Sci. 10. doi:10.3389/fmars.2023.1179598
Livieris, I. E., Stavroyiannis, S., Iliadis, L., and Pintelas, P. (2021). Smoothing and stationarity enforcement framework for deep learning time-series forecasting. Neural Comput. Appl. 33 (20), 14021–14035. doi:10.1007/s00521-021-06043-1
Lv, X., Xiong, X., and Geng, B. (2023). Increasing the prediction performance of temporal convolution network using multimodal combination input: evidence from the study on exchange rates. Front. Phys. 10. doi:10.3389/fphy.2022.1008445
Machado, M., de las Mercedes, M., Cedrón, S., Iranzu, S. B. G., Francisco, J., and Basterrechea, I. (2020). Interacción de los usuarios en las playas vascas en la época estival. Irun, Spain: UHINAK.
Masselink, G., Kroon, A., and Davidson-Arnott, R. G. D. (2006). Morphodynamics of intertidal bars in wave-dominated coastal settings — a review. Geomorphology 73 (1–2), 33–49. doi:10.1016/j.geomorph.2005.06.007
Meng, W., Meng, X., Wang, J., Li, G., Liu, B., Kan, G., et al. (2024). Prediction of the shear wave speed of seafloor sediments in the northern South China Sea based on an XGBoost algorithm. Front. Mar. Sci. 11. doi:10.3389/fmars.2024.1307768
Mokarram, M., Pourghasemi, H. R., and Tiefenbacher, J. P. (2023). Using machine learning to predict processes and morphometric features of watershed. Sci. Rep. 13 (1), 8498. doi:10.1038/s41598-023-35634-2
Monge-Ganuzas, M., Gainza, J., Liria, P., Epelde, I., Uriarte, A., Garnier, R., et al. (2017). Morphodynamic evolution of Laida beach (Oka estuary, Urdaibai Biosphere Reserve, southeastern Bay of Biscay) in response to supratidal beach nourishment actions. J. Sea Res., 130, 85–95. doi:10.1016/j.seares.2017.06.003
Montaño, J., Coco, G., Antolínez, J. A. A., Beuzen, T., Bryan, K. R., Cagigal, L., et al. (2020). Blind testing of shoreline evolution models. Sci. Rep. 10 (1), 2137. doi:10.1038/s41598-020-59018-y
Morell, M., Portau, P., Perelló, A., Espino, M., Grifoll, M., and Garau, C. (2022). Use of neural networks and computer vision for spill and waste detection in port waters: an application in the port of palma (MaJorca, Spain). Appl. Sci. 13 (1), 80. doi:10.3390/app13010080
Mosso, C., Mestres, M., Sierra, J. P., Sánchez-Arcilla, A., and Goodess, C. (2009). Waves and surges in the Valencia Gulf. Variability rather than climate change. J. Coast. Res., 243–247. Available online at: https://www.researchgate.net/publication/228951460_Waves_and_Surges_in_the_Valencia_Gulf_Variability_Rather_Than_Climate_Change.
Natekin, A., and Knoll, A. (2013). Gradient boosting machines, a tutorial. Front. Neurorobotics 7, 21. doi:10.3389/fnbot.2013.00021
Nauleau, P., Apostolakis, I., McGarry, M., and Konofagou, E. (2018). Cross-correlation analysis of pulse wave propagation in arteries: in vitro validation and in vivo feasibility. Phys. Med. & Biol. 63 (11), 115006. doi:10.1088/1361-6560/aabe57
Nounou, M. N., and Bakshi, B. R. (2000). Multiscale methods for denoising and compression. 119–150. doi:10.1016/S0922-3487(00)80030-1
Ortiz Berenguer, F. J., Arteche García, J. L., and Sanz Moral, P. (2004). “Caracterización del oleaje en las aguas costeras del cantábrico.” El Clima Entre El Mar y La Montaña. Asociación Española de Climatología y Universidad de Cantabria, Serie. https://aeclim.org/wp-content/uploads/2016/02/0009_PU-SA-IV-2004-FJ_ORTIZ.pdf.
Otchere, D. A., Ganat, T. O. A., Ojero, J. O., Tackie-Otoo, B. N., and Taki, M. Y. (2022). Application of gradient boosting regression model for the evaluation of feature selection techniques in improving reservoir characterisation predictions. J. Petroleum Sci. Eng. 208, 109244. doi:10.1016/j.petrol.2021.109244
Pau Sierra, J., Mosso, C., Alsina, J.-M., Sánchez-Arcilla, A., and Berdala, E. (2005). Modelado hidro-morfodinámico de una playa multibarrada longitudinalmente uniforme. Tecnología Y Ciencias Del Agua, 20 (2), 19–35. Available online at: https://revistatyca.org.mx/index.php/tyca/article/view/1035.
Pedregosa, F., Varoquaux, G., Gramfort, A., Michel, V., Thirion, B., Grisel, O., et al. (2011). Scikit-learn: machine learning in python. J. Mach. Learn. Res. 12.
Poate, T., Masselink, G., Russell, P., and Austin, M. (2014). Morphodynamic variability of high-energy macrotidal beaches, Cornwall, UK. Mar. Geol. 350, 97–111. doi:10.1016/j.margeo.2014.02.004
Podobnik, B., Wang, D., Horvatic, D., Grosse, I., and Stanley, H. E. (2010). Time-lag cross-correlations in collective phenomena. EPL Europhys. Lett. 90 (6), 68001. doi:10.1209/0295-5075/90/68001
Pourzangbar, A., Jalali, M., and Brocchini, M. (2023). Machine learning application in modelling marine and coastal phenomena: a critical review. Front. Environ. Eng. 2. doi:10.3389/fenve.2023.1235557
Raihan, Md. J., and Nahid, A.-A. (2023). Classification of histopathological colon cancer images using particle swarm optimization-based feature selection algorithm, in Diagnostic biomedical signal and image processing applications with deep learning methods (Elsevier), 61–82. doi:10.1016/B978-0-323-96129-5.00012-3
Risandi, J., Hansen, J. E., Lowe, R. J., and Rijnsdorp, D. P. (2020). Shoreline variability at a reef-fringed pocket beach. Front. Mar. Sci. 7. doi:10.3389/fmars.2020.00445
Sánchez-Arcilla, A., González-Marco, D., and Bolã Nos, R. (2008). A review of wave climate and prediction along the Spanish Mediterranean coast. Hazards Earth Syst. Sci. 8, 1217–1228. doi:10.5194/nhess-8-1217-2008
Sánchez Arcilla, A., and Jiménez, A. (1995). “Evolucion en planta/perfil de una playa. metodos predictivos.” J. Ing. Del. Agua. Num. 2. doi:10.4995/ia.1995.2662
Sánchez-Arcilla, A., Sierra, J. P., Cáceres, I., González, D., Alsina, J. M., Montoya, F., et al. (2006). “Beach dynamics in the presence of a low crested structure. The altafulla case,” in Proceedings of the 8th International Coastal Symposium (ICS 2004), J. Coast. Res. II. 39.
Siino, M., Scudero, S., and D’Alessandro, A. (2020). Stochastic models for radon daily time series: seasonality, stationarity, and long-range dependence detection. Front. Earth Sci. 8. doi:10.3389/feart.2020.575001
Splinter, K. D., Turner, I. L., and Davidson, M. A. (2013). How much data is enough? The importance of morphological sampling interval and duration for calibration of empirical shoreline models. Coast. Eng. 77, 14–27. doi:10.1016/j.coastaleng.2013.02.009
Uc Castillo, J. L., Marín Celestino, A. E., Martínez Cruz, D. A., Tuxpan Vargas, J., Ramos Leal, J. A., and Morán Ramírez, J. (2025). A systematic review of machine learning and deep learning approaches in Mexico: challenges and opportunities. Front. Artif. Intell. 7. doi:10.3389/frai.2024.1479855
Willmott, C., and Matsuura, K. (2005). Advantages of the mean absolute error (MAE) over the root mean square error (RMSE) in assessing average model performance. Clim. Res. 30, 79–82. doi:10.3354/cr030079
Wu, H., Cui, L., Wang, L., Sun, R., and Zheng, Z. (2023). A method for estimating particulate organic carbon at the sea surface based on geodetector and machine learning. Front. Mar. Sci. 10. doi:10.3389/fmars.2023.1295874
Xie, B., Zhu, C., Zhao, L., and Zhang, J. (2022). A gradient boosting machine-based framework for electricity energy knowledge discovery. Front. Environ. Sci. 10. doi:10.3389/fenvs.2022.1031095
Keywords: Machine Learning, Gradient Boosting Regressor, key hydro- and morphodynamic variables, cross-correlations, predictive formulations
Citation: Viñes M, Sánchez-Arcilla A Jr., Epelde I, Mösso C, Franco J, Sospedra J, Abalia A, Líria P, Grifoll M, Ojanguren A, Hernáez M, González M and Sánchez-Arcilla A (2025) Morphodynamic predictions based on Machine Learning. Performance and limits for pocket beaches near the Bilbao port. Front. Environ. Sci. 13:1600473. doi: 10.3389/fenvs.2025.1600473
Received: 26 March 2025; Accepted: 25 June 2025;
Published: 17 July 2025.
Edited by:
Giandomenico Foti, Mediterranea University of Reggio Calabria, ItalyReviewed by:
C. Bernardes, University of Aveiro, PortugalJosefa Varela Guerra, Rio de Janeiro State University, Brazil
Copyright © 2025 Viñes, Sánchez-Arcilla, Epelde, Mösso, Franco, Sospedra, Abalia, Líria, Grifoll, Ojanguren, Hernáez, González and Sánchez-Arcilla. This is an open-access article distributed under the terms of the Creative Commons Attribution License (CC BY). The use, distribution or reproduction in other forums is permitted, provided the original author(s) and the copyright owner(s) are credited and that the original publication in this journal is cited, in accordance with accepted academic practice. No use, distribution or reproduction is permitted which does not comply with these terms.
*Correspondence: Manuel Viñes, bWFudWVsLnZpbmVzQHVwYy5lZHU=