 Xiaokang Zheng1,2
 Fang Wan
- 1Yellow River Engineering Consulting Co., Ltd., ZhengZhou, China
- 2School of Civil Engineering, Tianjin University, Tianjin, China
- 3State Key Laboratory of Simulation and Regulation of Water Cycle in River Basin, China Institute of Water Resources and Hydropower Research, Beijing, China
- 4Key Laboratory of Water Safety for Beijing-Tianjin-Hebei Region of Ministry of Water Resources, Beijing, China
- 5Yellow River Conservancy Commission, ZhengZhou, China
- 6Key Laboratory of Water Management and Water Security for Yellow River Basin, Ministry of Water Resources (under construction), ZhengZhou, China
- 7School of Water Resources, North China University of Water Resources and Electric Power, ZhengZhou, China
The water supply of water resources allocation under extreme drought is insufficient, and the limited available water resources make it urgent to tap the potential of water supply. In this study, the Yellow River water supply area in Henan Province is taken as an example to study the multi-water source allocation under extreme drought. According to the Palmer Drought Severity Index (PDSI), the extreme drought years are selected, and the water supply and demand balance in the extreme drought years is analyzed, and the water shortage degree of each water supply area is obtained. In this study, unconventional water, flood resource utilization and elastic exploitation of groundwater are used as potential water sources. Different water supply scenarios are set up according to different potential tapping measures, and multi-scenario supply increase under extreme drought is explored. In the case of severe drought, the amount of potential tapping water has been significantly improved through different scenarios of potential tapping measures. The amount of potential tapping water in the three scenarios is 1.499 hundred million m3, 2.745 hundred million m3 and 3.991 hundred million m3. Under different water supply scenarios, the total water shortage has been reduced from 4.555 hundred million m3 to 3.054 hundred million m3, 1.808 hundred million m3 and 0.562 hundred million m3, respectively. The total water shortage rate decreased from 31.07% to 20.83%, 12.33% and 3.83%, respectively. A multi-water source allocation model with the goal of minimizing water shortage is constructed, and a multi-scenario supply increase allocation scheme is proposed, which provides a basis for the study of water supply increase allocation to alleviate the drought degree of the Yellow River Water Supply Area in Henan. Through the Multi-scenario potential tapping of multiple water sources, the existing potential water volume can be maximized, which is conducive to reducing the water supply pressure and water use restrictions of conventional water sources, improving the support capacity and guarantee capacity of water resources, and reducing the economic and social development bottlenecks caused by extreme drought.
1 Introduction
Drought is a common and complex natural disaster. In the past 50 years, 34% of the people affected by natural disasters in the world have been affected by drought (World Meteorological Organization WMO, 2021). The sixth assessment report of the Intergovernmental Panel on Climate Change (IPCC) (IPCC, 2021) pointed out: Climate change is exacerbating the contradiction between supply and demand of water resources. High temperatures and multiple types of drought events are frequent in parallel, causing varying degrees of drought in many regions. In recent years, the dry and wet imbalance in the Yellow River Water Supply Area in Henan with monsoon climate characteristics. According to the “China Drought Disaster Data Set”, the Yellow River Basin has staged 5∼6 extreme droughts in the past 50 years. The extreme drought events in the Yellow River Basin are staged every 10 years (Zhu et al., 2018; Zheng et al., 2022), which limits the development of industrial and agricultural production, life development, ecological environment and other aspects. With the development of social economy, the allocation of conventional water resources has been unable to meet the expected demand. The Ministry of Water Resources “Guidance on the Integration of Unconventional Water Resources into the Unified Allocation of Water Resources” (Zhou, 2017) emphasizes the importance of the potential research of unconventional water resources, so that it can play a guarantee role in the water resources allocation system, and requires the use of various means to expand the scope of allocation and increase the proportion of water distribution, at the same time, it is necessary to deepen the statistical research on unconventional water resources in order to improve the scientific management level of water resources and evaluate the sustainable utilization of water resources (Garcia and Islam, 2021; Helsel et al., 2020). Therefore, on the basis of the existing conventional water resources (which are widely used in daily life, easy to obtain, and can be directly used for human activities after appropriate treatment, such as surface water, groundwater, tap water), it will be an important measure to alleviate the drought in the Yellow River Water Supply Area in Henan by tapping the potential and increasing the supply, and integrating unconventional water (which refers to water resources other than conventional water resources such as surface water and groundwater in the traditional sense, such as reclaimed water, rainwater, seawater, mine water, brackish water, etc.), flood resources and elastic exploitation of groundwater into the water source system of water resources allocation.
The Yellow River Water Supply Area in Henan with monsoon climate characteristics has been dry and wet imbalance in recent years, the theory and technology of conventional water resources allocation have become more mature, and the research on optimal allocation of water resources has attracted attention at home and abroad. Wang Yu et al. (Wang et al., 2021) set the water diversion index in the river according to the science of the water situation, and consider the fairness and efficiency at the same time, and increase the saved water supply to the provinces and regions along the Yellow River; Yang et al. (2022) took social water use and natural hydrology as the research object, studied the feedback between social water use and natural hydrology, and developed a distributed allocation model based on water cycle; Tan and Zhang (2018) taking the single water benefit as the objective function, considering the fractional programming and robust optimization, the water resources optimization model is established to improve the utilization efficiency of agricultural water; Ren et al. (2017) giving full play to the advantages of multi-objective fuzzy programming, a multi-objective model of multiple benefits is constructed to rationally plan land use and irrigation water, and an effective and fair irrigation scheme is obtained; Zhang et al. (2023) aiming at the prediction of water supply and demand and its comprehensive value, the WRA model is used to study its coordinated and stable development, and the emergy analysis method is used for quantitative analysis. The base year and the planning year are reasonably calculated, and the sustainable water distribution scheme is proposed; Under uncertain conditions, Sperotto et al. (2019) discussed the application of multi-scenario analysis method based on Bayesian network in water quality sustainability assessment; Razavi et al. (2014) used a multi-scenario, multi-reservoir optimization me thod to evaluate these new control structures, and proposed an optimization model based on dynamic programming; Marques et al. (2015) proposed a new Real Options (ROs) method to deal with the uncertainty and two conflicting objectives throughout the planning scope, and defined some new possible expansion areas for different scenarios; Banadkooki et al. (2022) discussed the optimal allocation of water resources in arid basins, analyzed 13 scenarios, and determined the optimal solution by comparing the results of Genetic Algorithm (GA) and Non-dominated Sorting Genetic Algorithm II (NSGA-II) optimization techniques; Balla et al. (2020) established a Multi-scenario Model Predictive Control (MS-MPC) method to deal with the uncertainties of the expected inflow of urban drainage network (UDN). Ugural et al. (2024) examined the organisational, technological and infrastructural factors in four major provinces and uses fuzzy logic to solve the problem of uncertainty in adoption decisions. Practical recommendations for advancing sustainable development practices in the Iranian construction industry. Wu et al. (2024) developed a multi-objective optimisation model of crop cropping structure in an irrigated system using the Grey Wolf Optimization (GWO) algorithm to comprehensively consider the resource, economic and social objectives associated with agriculture, increased efficiency of agricultural production. Guo et al. (2025) proposed a method for calculating the rigid water demand and total water demand. Constructed the water resource optimization allocation model for Wu an City, and used the Non-dominated Sorting Genetic Algorithm III (NSGA-III). This study selected extreme drought years based on the Palmer Drought Severity Index (PDSI), analyses the degree of water scarcity in each area of Henan Yellow River Water Supply, and used unconventional water, flood resources, and elastic exploitation of groundwater as a source of water for potential tapping.
Constructed a multi-water source allocation model with the goal of minimizing water shortage and solved by genetic algorithm and proposed a multi-scenario incremental supply allocation scheme, and further applications of optimisation algorithms and methods such as multi-objective fuzzy programming will be carried out in future. Most of the above studies are focus only on conventional water sources. The allocation of water sources is relatively simple. The selection of scenarios lacks consideration of multiple water sources, and the allocation of water resources is less from the perspective of potential tapping and increasing supply. This study develops unconventional water, flood resources, and elastic exploitation of groundwater as alternative sources during extreme dry years. By creating multi-source and multi-scenario management strategies, the existing potential water volume is maximized. It increases the water supply of Henan Yellow River water supply area, alleviates the drought degree and improves the research on the allocation of water resources potential tapping and increasing supply.
At present, the utilization of rainwater and other unconventional water sources in the Yellow River Water Supply Area in Henan is only 465 million m3 (Wate r Resources Development and Management, 2022). Therefore, this study will start from the perspective of tapping potential and increasing supply, and take unconventional water, flood resources and elastic exploitation of groundwater as new water sources to study the allocation of water resources in the Yellow River Water Supply Area in Henan under extreme drought.
In this study, the water resources allocation under different potential tapping scenarios under extreme drought is taken as the research focus, and the Palmer Drought Severity Index (PDSI) is taken as the research index to study the drought structure distribution and water shortage in extreme drought years. Based on the multi-scenario mining potential of multi-water sources, a water resources allocation model with the goal of minimizing water shortage is constructed. According to the water demand level and allocation principle, a multi-scenario allocation scheme is proposed to provide a strong basis for future research on drought control measures. The methodological flow chart is shown in Figure 1.
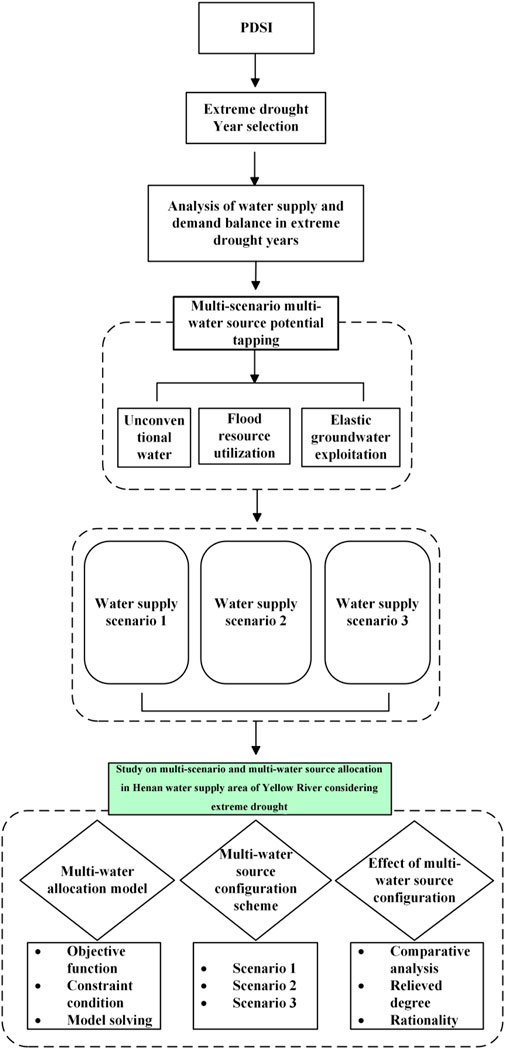
Figure 1. Methodological flow chart.
2 Overview of the study area
2.1 Watershed generalization
The Yellow River Water Supply Area in Henan is located along the Yellow River, located in the northern part of Henan Province (Figure 2), accounting for nearly half of the area of Henan Province, the specific regional reference Table 1. The Yellow River Water Supply Area in Henan contains 14 cities, some of which are not fully covered. At present, the total population of the Yellow River water supply area is about 69.8 million, and the urbanization rate is 54% (Du et al., 2020). The effective irrigation area in the water supply area is 53.6 million mu, and the actual irrigation area is 47.8 million mu. The total amount of water supply in the cities of the Yellow River water supply area is reduced, and the unbalanced spatial and temporal precipitation leads to a large water gap in the southwest region (Yao et al., 2018). The gap between flood season and non-flood season is prominent, and the proportion of flood season inflow is relatively large (about 60%∼70%) (Fang et al., 2019), and the runoff is mostly distributed in mountainous areas (Sun et al., 2021). In recent years, the total amount of water used in the Yellow River water supply area has been increasing, domestic water and ecological water use have increased, industrial water and agricultural water use have generally declined, and the overall drought situation in the region has continued.
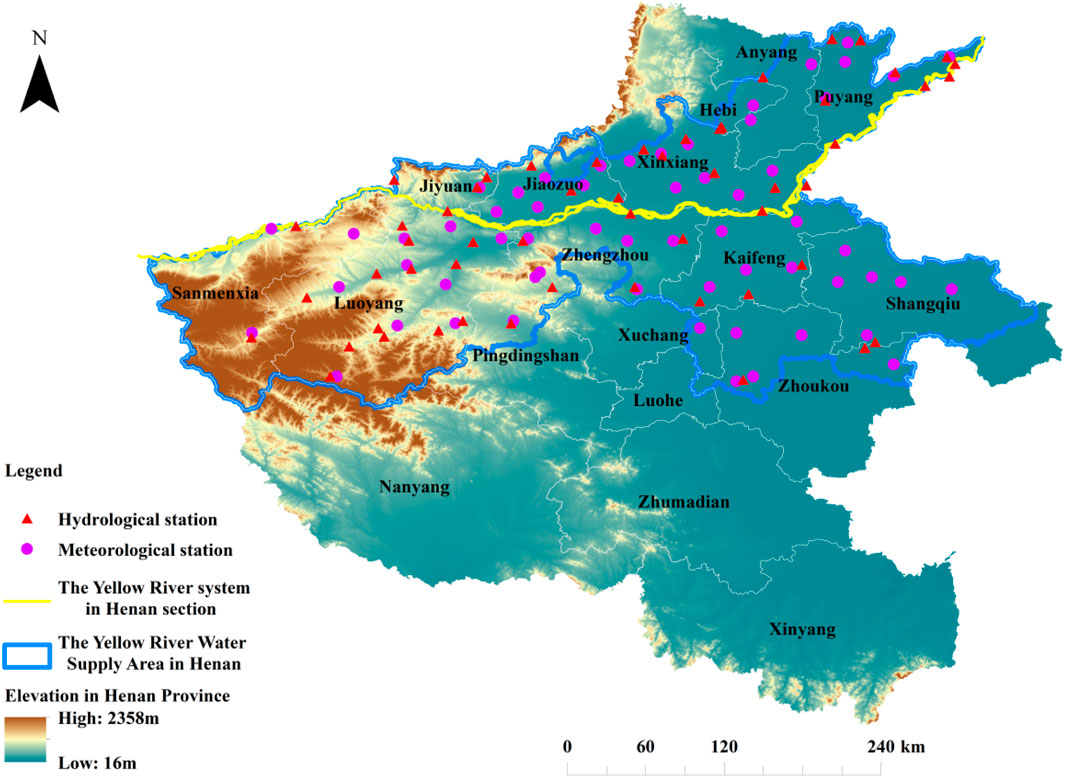
Figure 2. The administrative division of the Yellow River Water Supply Area in Henan and the map of meteorological and hydrological stations.
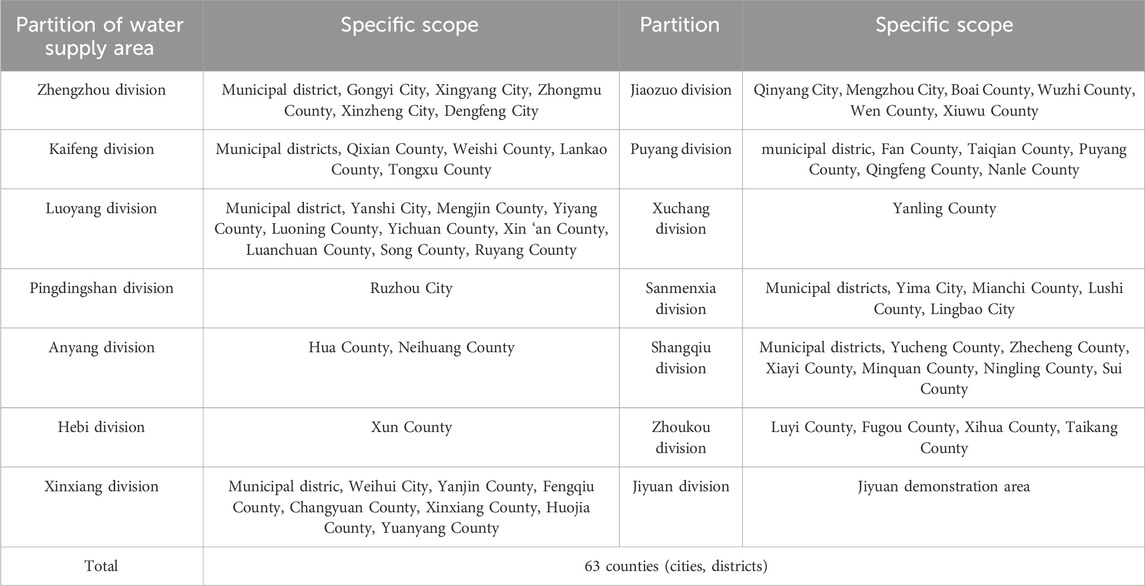
Table 1. The specific division scope of the Yellow River Water Supply Area in Henan.
2.2 Basic information
The data are from the Henan Statistical Yearbook and Data Center and the Henan Provincial Water Resources Bulletin. The data of 59 meteorological stations in the Yellow River Water Supply Area in Henan were collected. The data of precipitation, temperature and soil moisture (Table 2) based on 58 years (1961-2018) monthly data (Kang et al., 2022; Li et al., 2023; Zheng, 2018).
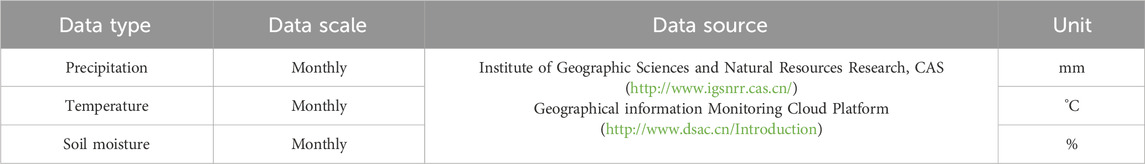
Table 2. Data type and data source statistics.
3 Selection of extreme drought years and setting of potential tapping scenarios
3.1 Selection of extreme drought years
In this study, the extreme drought years the Yellow River Water Supply Area in Henan are selected according to the Palmer Drought Severity Index (PDSI). Figure 3 is the PDSI histogram from 1961 to 2018, which reflects the drought change of the PDSI annual sequence in the Yellow River Water Supply Area in Henan. According to the size of the PDSI value, the drought grade is divided (Lu et al., 2022), as shown in Table 3.
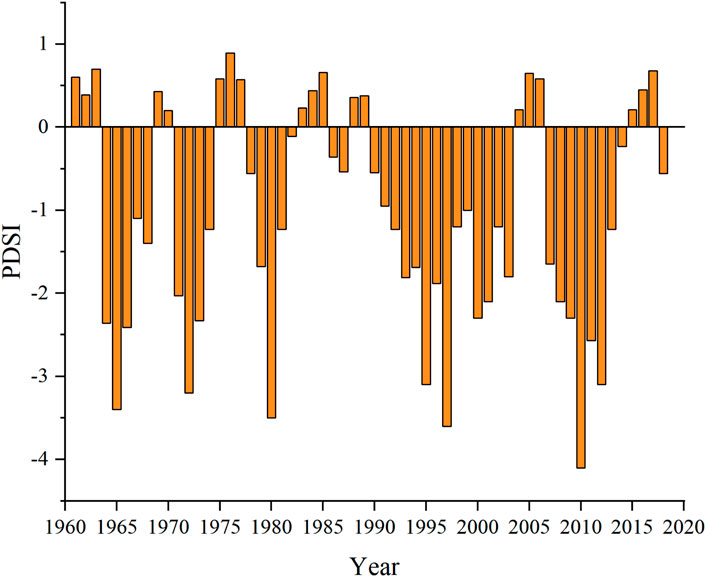
Figure 3. The overall PDSI annual sequence bar chart of the Yellow River Water Supply Area in Henan.
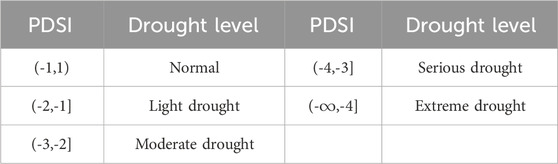
Table 3. PDSI drought classification standard table.
From the above Figure 3, it can be seen that from 1961 to 2018, there were many frequent drought years in the Yellow River Water Supply Area in Henan as a whole. Among them, serious droughts occurred in 1965, 1972, 1980, 1995, 1997, 2010 and 2012, and serious droughts were staged every 10 or so. The degree of drought in 2010 reached the level of extreme drought, and the other years were moderate drought or light drought or normal. Therefore, 2010 was selected as the extreme drought year. The distribution of drought grade in each district of the Yellow River Water Supply Area in Henan in 2010 is shown in Figure 4.
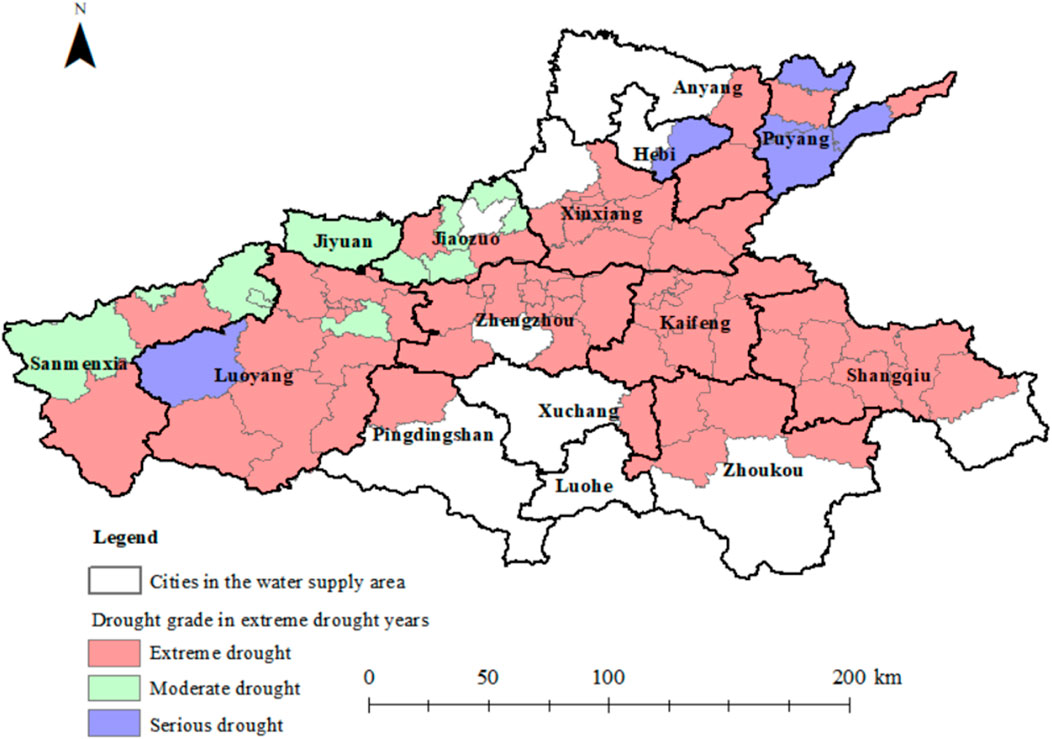
Figure 4. Distribution of drought grade in the Yellow River Water Supply Area in Henan in 2010.
It can be seen from Figure 4 that, on the whole, extreme drought occurred in 48 of the 63 districts and counties, and severe drought or moderate drought occurred in the remaining districts and counties (some districts and counties in Sanmenxia City, Jiyuan City, Jiaozuo City, Luoyang City, Puyang City and Hebi City).
According to the water resources bulletin of Henan Province in 2010 and the “Water Quota” (Qian, 2019), the supply and demand balance of the Yellow River Water Supply Area in Henan in 2010 was analyzed, as shown in Table 4.
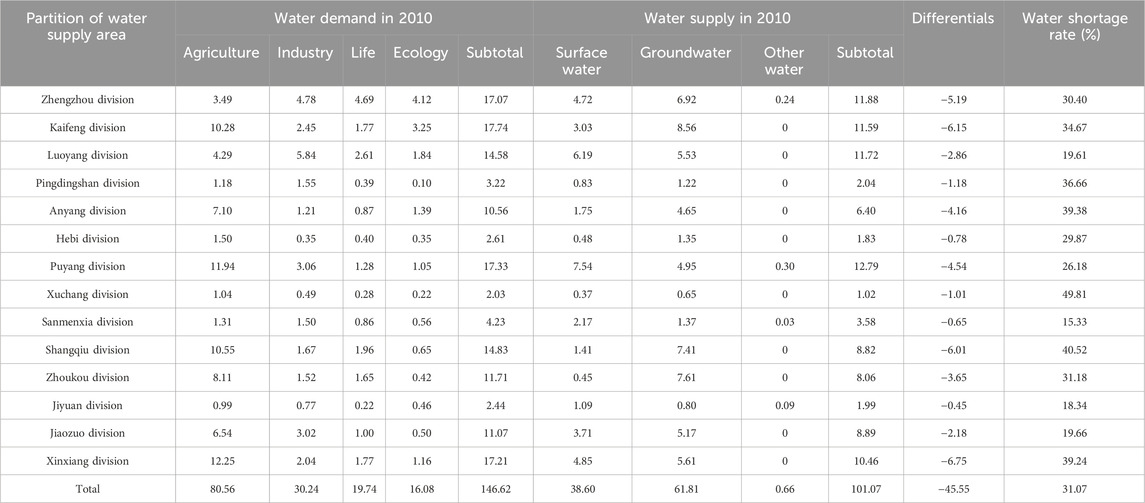
Table 4. The Yellow River Water Supply Area in Henan in 2010 supply and demand balance analysis table Unit: hundred million m3.
It can be seen from Table 4 that the total water demand the Yellow River Water Supply Area in Henan is 14.662 hundred million m3, the total water supply is 10.107 hundred million m3, the total water shortage is 4.555 hundred million m3, and the water shortage rate is 31.07%. In general, the supply and demand of the Yellow River Water Supply Area in Henan is unbalanced in extreme drought years, and the water shortage rate of 8 water supply areas exceeds 30%. In order to ensure the normal needs of residents and the good ecological environment, it is urgent to tap the water supply potential of unconventional water sources, flood water sources and elastic exploitation of groundwater.
3.2 Potential tapping scenario setting
On the basis of the structure of the original water supply source, the water source system is expanded and managed according to local conditions to maximize the supply capacity of water resources, such as expanding the construction of reclaimed water and rainwater harvesting projects, the appropriate adjustment of the flood limit water level of the reservoir, and improving the utilization rate of reclaimed water and sewage. The Multi-water sources allocation of different potential tapping scenarios is to study the potential of unconventional water sources, flood water resources and elastic exploitation of groundwater under extreme drought. According to different supply increase measures, it is divided into three water supply scenarios to study the multi-scenario supply increase under extreme drought, so as to realize the sustainability of water resources supply and the maintenance of ecological environment. Firstly, the spatial location and properties of water demand are determined in the model. Second, in the excavation of water sources, according to the spatial location of water demand, the increase in water supply of local water sources is excavated, such as groundwater potential tapping. Then tap the potential of non-local water sources to increase water supply, such as tapping the potential of reservoir water supply, using the existing water transmission network for water transmission and distribution, and increasing the water supply in the water demand area. Through the above local water and non-local water tapping and water distribution, the adaptation of water supply and water demand is realized. Due to the limited space, Table 5, 6 are expressed according to the overall excavation scenario of the Yellow River Water Supply Area in Henan.
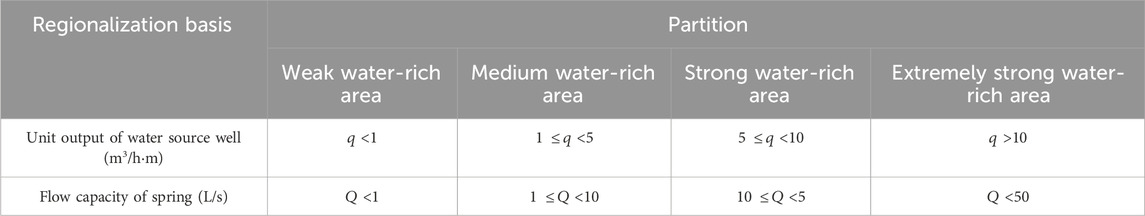
Table 5. Division table of groundwater water abundance in the Yellow River Water Supply Area in Henan.
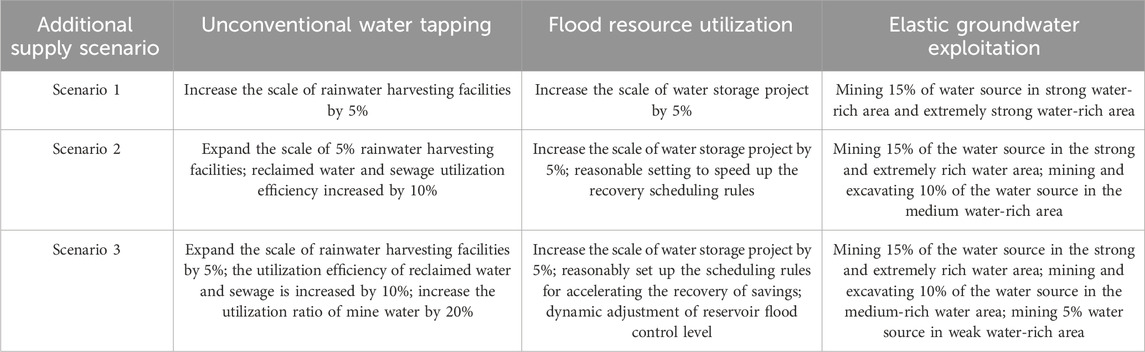
Table 6. Measures for increasing supply of different potential water sources under different supply scenarios.
The development potential of unconventional water sources is great. At present, the utilization form of unconventional water sources in the Yellow River Water Supply Area in Henan is mainly rainwater harvesting. Under extreme drought conditions, it is necessary to increase the scale of rainwater harvesting facilities, improve the utilization efficiency of reclaimed water and sewage, and increase the utilization of mine water; In order to improve the accuracy of flood forecasting, it is necessary to increase the dam gate, make full use of natural depressions and artificial lakes, improve the water storage capacity of the water storage project, speed up the storage and set the scheduling rules scientifically, which is suitable for improving the normal water level of the reservoir, and the potential of increasing the supply of flood resources will be greatly improved; The elastic mining of groundwater is based on the unit water yield of the water source well and the spring flow to carry out water-rich zoning (Zhao and Zhao, 2014). As shown in Table 5, according to the strength of water-richness, different scenarios are tapped. From scenario one to scenario 3, the supply potential increases in turn, and different supply increase scenarios correspond to different supply increase measures, as shown in Table 6.
4 Study on multi-water sources allocation of multi-scenario potential tapping
4.1 Water source analysis of multi-scenario potential tapping
Based on the potential unconventional water volume, flood resource water volume and groundwater volume, Multi-scenario potential tapping is carried out, In 2010, the potential water volume of unconventional water in the Yellow River Water Supply Area in Henan was 5.045 hundred million m3, the potential water volume of flood resources was 10.223 hundred million m3, and the potential water volume of groundwater elastic exploitation was 9.660 hundred million m3. According to the proportion of different potential water volume and potential total water volume, it is divided into three different potential water source scenarios. The potential water volume and the comparison before and after potential tapping are shown in Table 7.
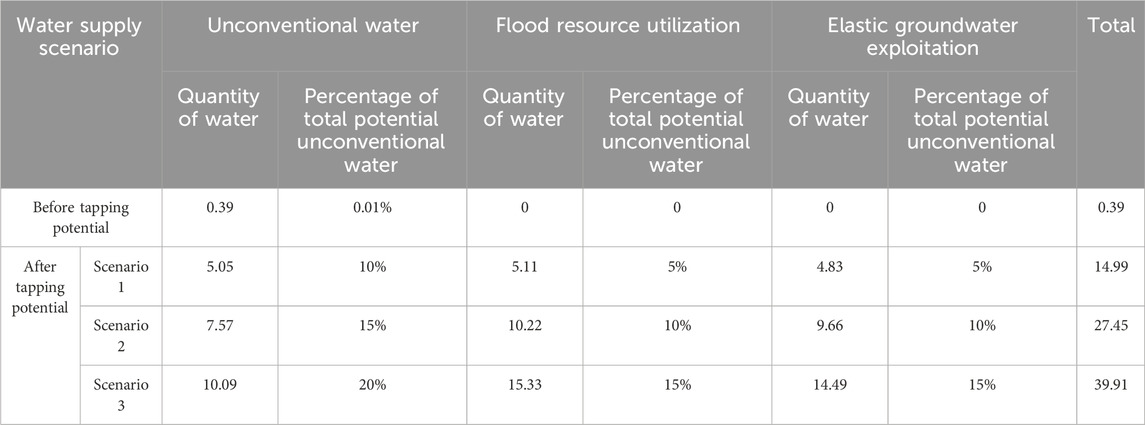
Table 7. The amount of potential tapping water in different scenarios and the comparison table before and after potential tapping Unit: hundred million m3.
According to the Table 7, there is a great potential for the development of unconventional water and flood water resources. The potential water of unconventional water sources in scenarios 1, 2 and 3 is 505 million m3, 757million m3 and 109 million m3; The amount of potential water in flood resource tapping scenarios 1, 2 and 3 is 511 million m3, 1,022 million m3, and 1.533 hundred million m3. With the increase of excavation potential, the total water volume of water supply scenarios 1, 2 and 3 is 1.499 hundred million m3, 2.745 hundred million m3 and 3.991 hundred million m3. Compared with before tapping the potential, the available water supply has been greatly improved. The rational development and utilization of unconventional water sources and flood water sources plays an important role in the sustainable development of water resources in the future.
4.2 Water demand level division and configuration principle
Western sociologist Maslow’s hierarchy of needs theory believes that human needs are divided into five levels like a ladder, namely,: physiological needs, security needs, social needs, respect needs, and self-realization needs. The more these needs are met, the stronger the sense of wellbeing will be. Specific to the river basin, combined with the water demand characteristics of various departments and development conditions in different regions, the life, industry, agriculture, and ecological water demand processes are divided into three levels, namely, rigid demand, rigid elastic demand, and elastic demand, as shown in Figure 5.
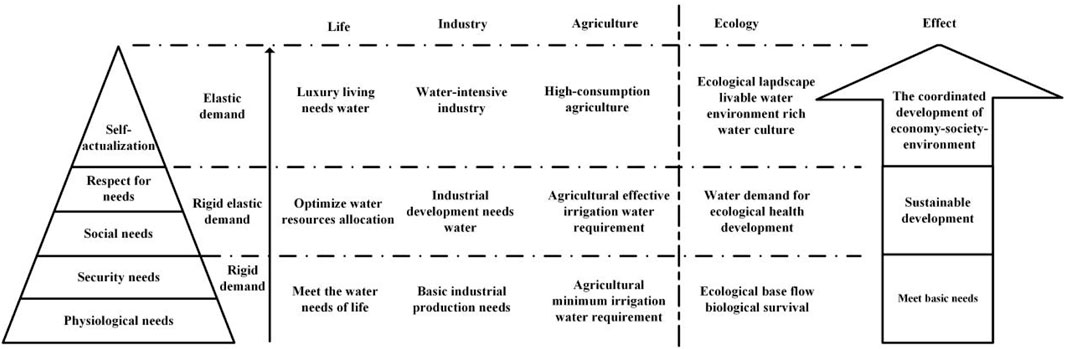
Figure 5. Water demand level division diagram.
The satisfaction of each water sector is the relationship between water users according to their water demand status and water distribution. It is generally a subjective evaluation. It is the happiness of water users after their needs are met. When the water demand of the water sector is met. The more, the higher the satisfaction. The runoff volume and wet and dry years are different, and the water demand level is different. The rigid water demand is the first priority in the distribution water, and it will be difficult to recover the loss once it is destroyed. The rigid elastic water demand is in the second priority in the water distribution, and the loss caused by water shortage is recoverable; elastic water demand is the last consideration in water resources allocation. When the water distribution amount obtained by the water use department is at different water demand levels, the level of satisfaction is related to different water use departments. For example, in dry years and when the runoff is small, the water use department meets the basic needs. At this time, the satisfaction of the agricultural department is higher than that of the domestic, industrial and ecological water use departments.
The configuration of Multi-water sources allocation it he Yellow River Water Supply Area in Henan should follow the following principles:
(1) The principle of matching the type of potential water sources with the water use department. Under extreme drought conditions, groundwater sources are flexibly exploited for domestic water and some industrial water; unconventional water sources are mainly used for industrial water and landscape greening water; flood water resources are used for agricultural irrigation and ecological water use.
(2) Priority principle. Priority should be given to the protection of basic domestic water. Because the drought in the study area is mainly reflected in agriculture, agricultural water is put in the second place, and on this basis, industrial water and ecological water are considered in turn. At the same time, give priority to meet the rigid demand, and then ensure the rigid elastic water, and finally meet the elastic demand.
(3) The principle of fairness. Equal distribution is needed between individual water users and water users, and between partitions and regions in the Yellow River Water Supply Area in Henan. Each district cooperates with each other and cooperates with the overall situation, and objectively has the same status to allocate water sources.
(4) The principle of total control. The development of groundwater elastic mining, unconventional water and flood water resources in the Yellow River Water Supply Area in Henan should be matched with the carrying capacity of local water resources, reasonably control the polluting environmental industries and high-intensity water consumption industries, and strengthen the supervision of their total amount.
(5) The principle of sustainable use. In the case of widespread drought and complex water shortage structure in the Yellow River Water Supply Area in Henan, a fair, effective, reasonable and scientific setting of the water distribution ratio between life, agriculture, industry and ecology is conducive to the benign maintenance of water resources regeneration mechanism and sustainability.
4.3 Model construction
(1) Taking the minimum water shortage Equation 1 as the objective function:
Where
(2) Constraint conditions
Equations 2–5 represents the constraints of available water supply and water demand:
In the formula,
Equations 6–8 represent unconventional water resources and flood resource constraints:
In the formula,
Priority constraints. Equations 9–10 represent the water supply sequence:
Equation 11 represents the groundwater depth constraint:
In the formula,
Equation 12 represents the minimum ecological flow constraint:
In the formula,
Non-negative constraints: All variables are greater than or equal to 0.
4.4 Model solving
Genetic algorithm is a kind of intergenerational evolution, survival of the fittest, from low to high level algorithm. This algorithm takes the optimization of the global as the goal, carries out random search in the feasible solution space, realizes the group replacement and iterative optimization through cross compilation, and makes each individual gradually reach the optimal until the evolution of each generation. The genetic algorithm has strong adaptability, can independently optimize and search the solvable space, has fast convergence speed and does not depend on the decoding process, and the large search space greatly improves the calculation accuracy.
(1) The calculation steps of multi-water allocation algorithm are as follows:
The first step: Let the random scale value
The second step: calculate the crowding distance and the order of the parent population, and optimize the selection, crossover and mutation to obtain the offspring population
The third step: merge
Step 4: judge whether the result meets the conditions, if not, go back to the second step, and output the result if it meets.
(2) The decision variables are written as follows:
This study considers five water sources (surface water, elastic groundwater exploitation, flood resources, unconventional water) and three water supply scenarios (Scenario 1, Scenario 2, Scenario 3), four water sectors (domestic, industrial, agricultural, and ecological water). According to the constraints of the multi-water allocation model, the decision variables are numbered as follows (Table 8),
(3) Function call and optimal solution selection:
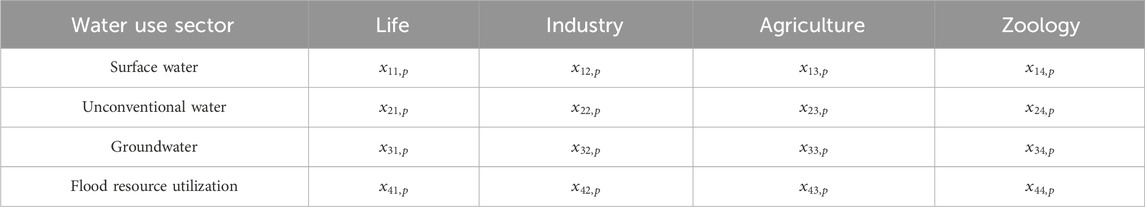
Table 8. Numbering of decision variables.
The gamultiobj function needs to be called during the operation of the genetic algorithm. The function expression to be called is [x,fval] = gamultiobj (fitnessfcn, nvars, A, b, Aeq, beq, lb, ub, options), x is the pareto solution set obtained by the gamultiobj function, fval is the objective function, nvars is the total amount of variables, options is the genetic parameter, fitnessfcn is set as the handle of the objective function, which is regarded as the fitness function. A, Aeq, b and beq are the constraint conditions of the function, and ub and lb are the upper and lower limits of the constraint values. The genetic parameters of the genetic algorithm are set as follows: the individual coefficient is 0.3, the highest evolution generation is 3,000, the end generation is 3,000, and the fitness function error value is 0.0001.
The optimal solution is distributed in the pareto solution set, and the minimum water shortage of domestic water demand, industrial water demand, agricultural water demand and ecological water demand is comprehensively considered. Finally, the optimal solution is selected. Under the condition of satisfying the available water supply and related constraints, the priority of domestic water supply is considered, then the industrial water supply is considered, then the agricultural water supply is considered, and finally the ecological water supply is considered.
5 Scenario configuration scheme analysis
5.1 Scheme calculation
According to the distribution of water shortage and drought grade in each area of the Yellow River Water Supply Area in Henan in extreme drought years, the model is solved according to the configuration principle and water use constraint conditions. The solution process is based on three different water supply scenarios to obtain three schemes for increasing supply. The configuration results are shown in Figure 6 and Table 9.
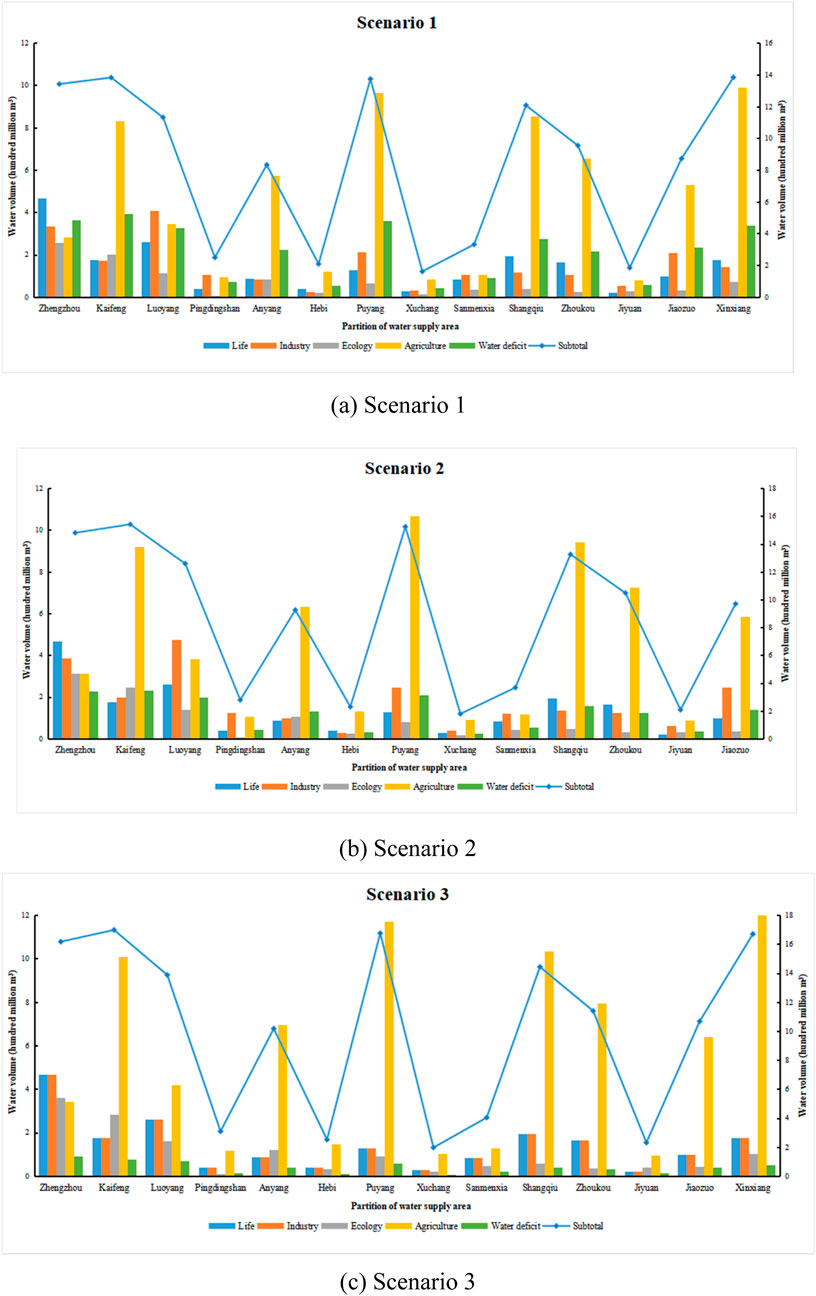
Figure 6. The results of water resources allocation in each partition of the Yellow River Water Supply Area in Henan. (a) Scenario 1. (b) Scenario 2. (c) Scenario 3.
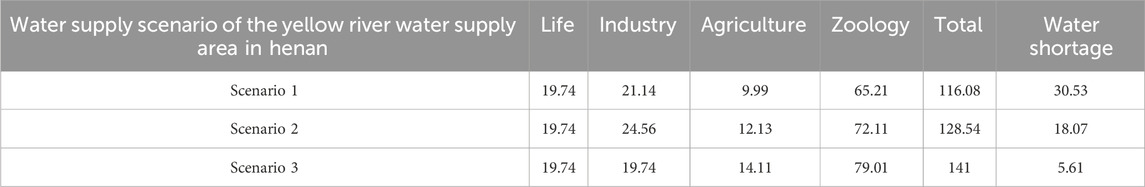
Table 9. Water resources allocation results of the Yellow River Water Supply Area in Henan Unit: hundred million m3.
Based on different potential tapping levels, three different scenarios are obtained, as shown in Figure 6 and Table 9. With the increase of the proportion of water supply in the potential tapping water, the water shortage in each partition is significantly reduced, and the water supply and demand are close to balance. Under different water supply scenarios, the total water supply in the Yellow River Water Supply Area in Henan increased from 11.07 hundred million m3 to 11.608 hundred million m3, 12.854 hundred million m3, and 14.100 hundred million m3, respectively, and the total water shortage decreased from 4.555 hundred million m3 to 3.053 hundred million m3, 18.07 hundred million m3, and 0.561 hundred million m3.
5.2 Discussion of the scheme
5.2.1 Comparative analysis of tapping potential water
According to the water resources bulletin of Henan Province in 2010, in addition to conventional water, the water supply volume of unconventional water in Henan Province in 2010 was 39 million m3. In this study, through the excavation of the potential water volume of unconventional water, the potential water volume of flood resources and the elastic exploitation of groundwater in 2010, the total water volume of potential exploitation based on different potential exploitation scenarios was 1.499 hundred million m3, 2.745 hundred million m3 and 3.991 hundred million m3, respectively. Therefore, the effect of tapping potential and increasing supply in the Yellow River Water Supply Area in Henan is obvious.
5.2.2 Comparative analysis of department water supply
The water supply data of the water resources bulletin department of Henan Province in 2010 are compared with the results of the three scenarios after tapping the potential, as shown in Table 10. After the allocation, compared with the water resources bulletin of Henan Province in 2010, the water supply under different scenarios increased, which alleviated the water pressure of various departments and realized the improvement of social and economic benefits and the benign development of ecological environment.
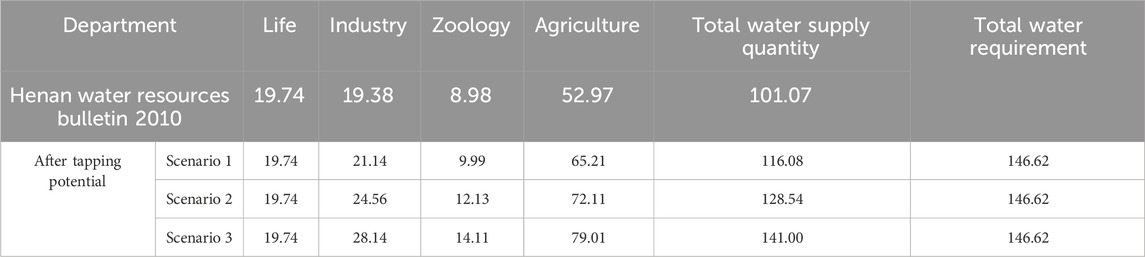
Table 10. Comparative analysis table of department water supply after tapping potential Unit: hundred million m3.
5.2.3 Mitigation analysis of water shortage
The comparative analysis of the water shortage results of each water supply scenario is shown in Table 11. On the whole, the water shortage situation in the Yellow River Water Supply Area in Henan has been significantly improved compared with that before tapping the potential. Under different supply scenarios, the average water shortage in the water supply area decreased from 325 million m3 to 218 million m3, 129 million m3 and 40 million m3 respectively. The overall water shortage rate decreased from 31.07% to 20.83%, 12.33% and 3.83%, respectively. Among them, there is no water shortage in domestic water. Through the potential tapping of multiple scenarios, the water shortage rate of industrial water decreased from 35.90% to 30.09%, 18.78% and 6.94% respectively. The water shortage rate of ecological water decreased from 44.12% to 37.87%, 24.56% and 12.25%, respectively; The water shortage rate of agricultural water decreased from 34.25% to 19.05%, 10.49% and 1.92% respectively. After Multi-scenario potential tapping, the water shortage rate of each department (except domestic water) has been greatly reduced, but there is still a shortage of water in industrial water, ecological water and agricultural water. In the future, it is urgent to deepen the excavation of unconventional water sources and flood water sources, so that the Yellow River Water Supply Area in Henan has sustainable water resources support.
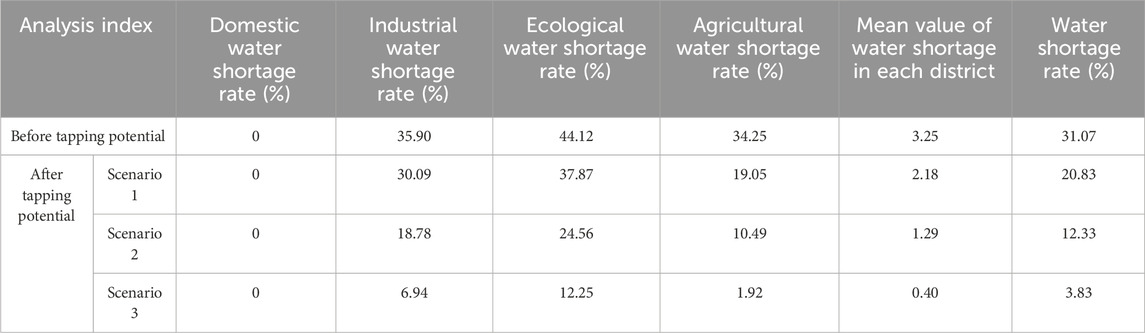
Table 11. Comparison table of water shortage results before and after tapping the potential of the Yellow River Water Supply Area in Henan Unit: hundred million m3.
5.2.4 Configuration effect of multi-level water demand
Based on three water demand levels (rigid demand, rigid elastic demand and elastic demand), this study explores the potential of multiple water sources. Different water supply scenarios correspond to different water demand levels. Water supply scenarios 1, 2 and 3 correspond to rigid demand, rigid elastic demand and elastic demand respectively, and a multi-level water demand configuration scheme is obtained. Table 12 shows the water demand satisfaction under different water demand conditions. Through the increase of different potential tapping scenarios, the overall satisfaction rates of rigid demand, rigid elastic demand and elastic demand have reached 79.17%, 87.67% and 96.17% respectively. Specifically, under the condition of rigid water demand, the satisfaction rates of domestic water demand, industrial water demand, ecological water demand and agricultural water demand are 100%, 69.91%, 62.13% and 80.95% respectively. Under the condition of rigid elastic demand, the satisfaction rates of domestic water demand, industrial water demand, ecological water demand and agricultural water demand are 100%, 81.22%, 75.44% and 89.51% respectively. Under the condition of elastic demand, the satisfaction rates of domestic water demand, industrial water demand, ecological water demand and agricultural water demand are 100%, 93.06%, 87.75% and 98.08% respectively. Based on different potential tapping scenarios corresponding to different water demand levels, in the future, water demand can be considered to be hierarchical to achieve precise potential tapping and supply increase and scientific configuration.
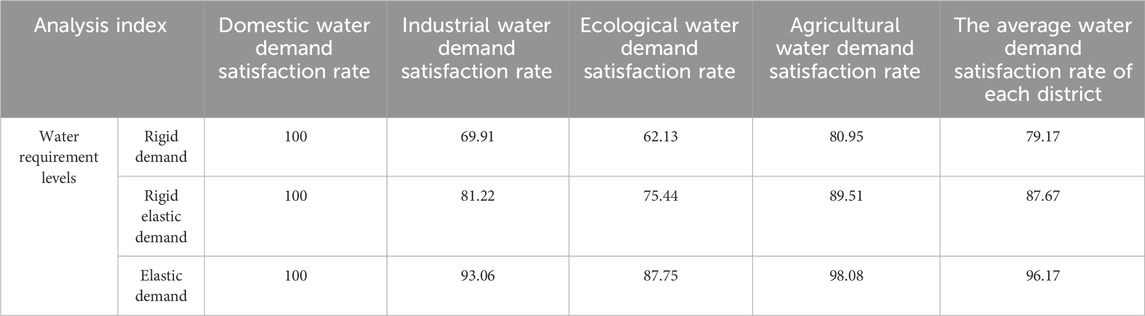
Table 12. Water demand satisfaction under different water demand conditions Unit: %.
5.3 Discussion
In terms of research results, the total water demand in extreme drought years in this study is 146.62 hundred million m3, and the total water supply in water supply scenarios 1, 2 and 3 is 116.08 hundred million m3,128.54 hundred million m3 and 141.00 hundred million m3, respectively. Compared with the research results of other scholars, Wang et al. (2024) and Mianabadi et al. (2014) studied the Yellow River Basin and the Euphrates River respectively. The spatial scale of the study is relatively large, and the water resources allocation scheme is not specific enough. This study takes the Henan water supply area of the Yellow River as the research object. The multi-water source water supply scheme is specific to the district and county levels, which improves the accuracy of multi-resource allocation, and more scientifically reveals the drought and supply and demand conditions at a smaller spatial scale. The multi-water source tapping potential based on multiple scenarios has greatly alleviated the drought status of the Henan Yellow River water supply area, reduced the water supply pressure and water use restrictions of conventional water sources, and improved the support capacity and guarantee capacity of water resources. In the future, it is necessary to further optimize the research methods and improve the accuracy of data to enhance the rationality and scientificity of multi-water source allocation schemes.
In terms of research methods, Naghdi et al. (2021) used simulation–optimization approach and Nash bargaining theory for optimal allocation of water resources. The simulation–optimization and conflict resolution model was used for the integrated allocation of surface and underground water in drinking, industry, agriculture and environment sectors in Najafabad basin in Iran. Kalhori et al. (2023) used the simulation-optimization approach for the conjunctive use of surface and underground water in climate change conditions. For this purpose, A multi-objective invasive weed optimization algorithm (MOIWOA) was developed and validated, and it was applied to the optimal water resource allocation for drinking water industry and agricultural demand. This study constructs a model with the minimum water shortage as the goal, and uses genetic algorithm to calculate the configuration model. Due to the randomness of crossover and mutation operations, the algorithm may fall into the local optimal solution in the search process, and the global optimal solution cannot be found, which may affect the accuracy and reliability of the solution. At the same time, the parameter settings in the genetic algorithm, such as crossover rate and mutation rate, have an important impact on the solution results. However, the setting of these parameters often needs to be adjusted according to specific problems, and there is no unified setting method at present. Different parameter settings may lead to the instability of the solution results. In the future, the algorithm needs to be further optimized. The limited objective function and constraint conditions in the multi-water source configuration model are difficult to fully consider the current situation and development requirements of the water supply area. In the future, it is necessary to improve the applicability of multi-water source users and configuration models, and at the same time, it is necessary to comprehensively consider high-quality development goals such as economic growth, water supply safety, and ecological health.
In terms of research perspective, Mooselu et al. (2020) only proposed a method for optimal allocation of Treated Wastewater (TW), Naghdi et al., 2021 carried out multi-objective optimization of water resources allocation, but only considered surface water and groundwater. This study takes the multi-water source potential tapping and multi-scenario supply increase configuration in extreme drought years as the research highlights. The water supply sources mainly include unconventional water, flood resource water source and groundwater elastic mining water source. Through the potential tapping of different measures, the drought situation in the water supply area has been greatly alleviated. However, there are water supply safety problems in the exploitation of flood resource water and groundwater, especially the realization of flood resource through the regulation of reservoir flood limit water level, which makes the contradiction between benefit and flood control safety. In the future, we can consider vigorously exploiting unconventional water sources to achieve the reduction of water supply risk and the benign maintenance of ecological environment.
6 Conclusion
Aiming at the problem of multi-resource allocation under extreme drought the Yellow River Water Supply Area in Henan, this study sets different water supply scenarios through different potential tapping measures, constructs a Multi-water sources allocation model based on multiple scenarios, and proposes three schemes for increasing supply. The main conclusions of this study are as follows: (1) Under extreme drought, the amount of potential tapping water has been significantly improved through different scenarios of potential tapping measures. The amount of potential tapping water in the three scenarios is 1.499 hundred million m3, 2.745 hundred million m3 and 3.991 hundred million m3, respectively. The potential of unconventional water and flood resources the Yellow River Water Supply Area in Henan is great. The results of potential tapping provide practical value for the study of reasonable potential tapping of unconventional water sources. (2) After the allocation, the overall water shortage degree of the Yellow River Water Supply Area in Henan has been significantly alleviated. Under different water supply scenarios, the total water shortage has been reduced from 4.555 hundred million m3 to 3.054 hundred million m3,1.808 hundred million m3 and 0.562 hundred million m3, respectively. The overall water shortage rate decreased from 31.07% to 20.83%, 12.33% and 3.83%. (3) At present, the potential of groundwater is very limited, and the potential space of unconventional water source and flood resource water source is very large. Under different scenarios, the sum of the potential water volume of unconventional water source and flood resource water source and the total water supply before the potential is more than 10%. Under extreme drought conditions, this paper studies the water resources allocation of Multi-scenario potential tapping and increasing supply. In the actual water distribution, the water quality of the water distribution is subject to various complex requirements and restrictions, such as different water users have different water quality requirements. In the future research, the joint allocation of water quantity and water quality can be further considered.
Data availability statement
The original contributions presented in the study are included in the article/supplementary material, further inquiries can be directed to the corresponding author.
Author contributions
XZ: Investigation, Methodology, Writing – original draft. WW: Writing – original draft. YW: Investigation, Writing – review and editing. CM: Writing – review and editing. FW: Conceptualization, Formal Analysis, Writing – original draft.
Funding
The author(s) declare that financial support was received for the research and/or publication of this article. The research was supported by the National Key Research and Development Program of China (2022YFC3202300), National Natural Science Foundation of China (52479014), Talent support project of Henan province (254000510001), Science and Technology Program for Outstanding Young Talents of the Yellow River Conservancy Commission (HQK-202318), Key Laboratory of Water Management and Water Security for Yellow River Basin, Ministry of Water Resources (under construction) (2023-SYSJJ-05), Open Fund of Key Laboratory of Flood and Drought Disaster Defense, the Ministry of Water Resources (KYFB202307260036), The Belt and Road Special Foundation of National Key Laboratory of Water Disaster Prevention (2023nkzd02).
Conflict of interest
Author XZ was employed by Yellow River Engineering Consulting Co., Ltd.
The remaining authors declare that the research was conducted in the absence of any commercial or financial relationships that could be construed as a potential conflict of interest.
Generative AI statement
The author(s) declare that no Generative AI was used in the creation of this manuscript.
Publisher’s note
All claims expressed in this article are solely those of the authors and do not necessarily represent those of their affiliated organizations, or those of the publisher, the editors and the reviewers. Any product that may be evaluated in this article, or claim that may be made by its manufacturer, is not guaranteed or endorsed by the publisher.
References
Balla, K. M., Schou, C., Bendtsen, J. D., and Kallesøe, C. S. (2020). “Multi-scenario model predictive control of combined sewer overflows in urban drainage networks,” in 2020 IEEE conference on control technology and applications (CCTA). doi:10.1109/CCTA41146.2020.9206362
Banadkooki, F. B., Xiao, Y., Hossein, M. M., and Hosseini, M. M. (2022). Optimal allocation of regional water resources in an arid basin: insights from integrated water resources management. J. Water Supply Res. Technology-Aqua 71, 910–925. doi:10.2166/aqua.2022.029
Du, Q., Liu, X., and Hao, Y. (2020). A preliminary study on the economical and intensive utilization of water resources in the yellow river water supply area of Henan Province, journal of north China university of water resources and hydropower. Nat. Sci. Ed. 41 (04), 10–14+60. doi:10.19760/j.ncwu.zk.2020043
Fang, G. H., Tu, Y. H., Wen, X., Yan, M., and Tan, Q. F. (2019). Research on the development process and evolution characteristics of meteorological drought in huaihe river basin from 1961 to 2015. Water Conservancy J. 50 (05), 598–611. doi:10.13243/j.cnki.slxb.20180986
Garcia, M., and Islam, S. (2021). Water stress and water salience: implications for water supply planning. Hydrological Sci. J. 66 (6), 919–934. doi:10.1080/02626667.2021.1903474
Guo, D., Zhang, D., Xu, D., Bian, Y., and Pan, Y. (2025). Multi-objective water allocation for wu’an city. Water 17 (2), 153. doi:10.3390/W17020153
Helsel, D. R., Hirsch, R. M., and Ryberg, K. R. (2020). Statistical methods in water resources. US Geological Survey. doi:10.3133/TM4A3
Kalhori, M., Ashofteh, P. S., and Moghadam, S. H. (2023). Development of the multi-objective invasive weed optimization algorithm in the integrated water resources allocation problem. Water Resour. Manage 37, 4433–4458. doi:10.1007/s11269-023-03564-3
Kang, J. F., Zhang, Y. N., Liu, C., and Wu, Y. M. (2022). Human economic data set of the Yellow River Basin from 2015 to 2019, China Scientific Data, 7 (04), 118–132. doi:10.11922/11-6035.ncdc.2021.0024.zh
Li, J., Nie, H. M., and Xu, G. Z. (2023). Characteristics analysis on carbon reduction of crop production in Henan Province based on the statistical yearbook data. Chin. J. Agrometeorology 44 (09), 759–768. doi:10.3969/j.issn.1000-6362.2023.09.001
Lu, J. Y., Sun, L. Y., Wang, C. L., Zhai, Z. H., and Wu, J. D. (2022). Analysis of droughtcharacteristics in Guangdong in recent 40 years based on PDSI index. Meteorological Res. Appl. 43 (01), 36–40. doi:10.19849/j.cnki.CN45-1356/P.2022.1.07
Marques, J., Cunha, M., and Dragan, A. (2015). Multi-objective optimization of water distribution systems based on a real options approach. Environ. Model. Softw. 63, 1–13. doi:10.1016/j.envsoft.2014.09.014
Mianabadi, H., Mostert, E., Zarghami, M., and Giesen, N. (2014). A new bankruptcy method for conflict resolution in water resources allocation. J. Environ. Manag. 144, 144152–144159. doi:10.1016/j.jenvman.2014.05.018
Mooselu, M. G., Nikoo, M. R., Latifi, M., Sadegh, M., Al-Wardy, M., and Al-Rawas, G. A. (2020). A multi-objective optimal allocation of treated wastewater in urban areas using leader-follower game. J. Clean. Prod. 267, 122189. doi:10.1016/j.jclepro.2020.122189
Naghdi, S., Bozorg-Haddad, O., Khorsandi, M., and Chu, X. (2021). Multi-objective optimization for allocation of surface water and groundwater resources. Sci. Total Environ. 776 (12), 146026. doi:10.1016/j.scitotenv.2021.146026
Qian, L. (2019). Evaluation of the advancement of industrial water quota in Henan Province. Zhihuai (10), 62–63. doi:10.3969/j.issn.1001-9243.2019.10.037
Razavi, S., Asadzadeh, M., Tolson, B., Fay, D., Moin, S., Bruxer, J., et al. (2014). Evaluation of new control structures for regulating the Great Lakes system: Multiscenario, multireservoir optimization approach. J. Water Resour. Plan. Manag. 140 (8), 1–14. doi:10.1061/(ASCE)WR.1943-5452.0000375
Ren, C., Guo, P., Tan, Q., and Zhang, L. (2017). A multi-objective fuzzy programming model for optimal use of irrigation water and land resources under uncertainty in Gansu province, China. J. Clean. Prod. 164, 85–94. doi:10.1016/j.jclepro.2017.06.185
Sperotto, A., Molina, L. J., Torresan, S., Critto, A., Pulido-Velazquez, M., and Marcomini, A. (2019). Water quality sustainability evaluation under uncertainty: a multi-scenario analysis based on Bayesian networks. Sustainability 11 (17), 4764. doi:10.3390/su11174764
Sun, X., Sun, P., Liu, L., Jiang, P., and Li, Y. (2021). Ferulic acid attenuates microglia-mediated neuroinflammation in retinal degeneration. Henan Agric. 21 (22), 13–14. doi:10.1186/s12886-020-01765-7
Tan, Q., and Zhang, T. (2018). Robust fractional programming approach for improving agricultural water-use efficiency under uncertainty. J. Hydrology 564, 1110–1119. doi:10.1016/j.jhydrol.2018.07.080
Ugural, N. M., Aghili, S., and Burgan, I. H. (2024). Adoption of lean construction and AI/IoT technologies in iran’s public construction sector: a mixed-methods approach using fuzzy logic. Buildings 14 (10), 3317. doi:10.3390/BUILDINGS14103317
Wang, X. Y., Yuan, R. H., and Wang, Y. (2024). Construction and simulation of water resources allocation SD model in the yellow river basin under the new situation. Ecol. Econ. 40 (02), 181–190.
Wang, Y., Peng, S. M., Shang, W. X., Zheng, X. K., Zhou, X. N., and Li, Y. (2021). Discussion on the dynamic allocation mechanism of water resources in the yellow river basin based on water-sand-ecological multi-factors. Water Sci. Prog. 32 (04), 534–543. doi:10.14042/j.cnki.32.1309.2021.04.005
Water Resources Development and Management (2022). 2021 annual“China water resources bulletin” released, 8(07): 85.
World Meteorological Organization (WMO) (2021). Atlas of mortality and economic losses from weather, climate and water Extremes(1970-2019) (WMO-No.1267).
Wu, L., Tian, J., Liu, Y., Wang, Y., and Zhang, P. (2024). Multi-objective planting structure optimisation in an irrigation area using a grey wolf optimisation algorithm.Water 16(16):2297–2297. doi:10.3390/W16162297
Yang, M. Z., Xu, J. J., Sang, L. H., and Liu, Q. (2022). Development and application of distributed water resources allocation model based on water cycle. J. Water Resour. 53 (04), 456–470. doi:10.13243/j.cnki.slxb.20210759
Yao, J., Zhao, Y., Chen, Y., Yu, X. J., and Zhang, R. B. (2018). Multi-scale assessments of droughts:a case study in Xinjiang,China. Sci. Tota Environ. 630, 444–452. doi:10.1016/j.scitotenv.2018.02.200
Zhang, F. Y., Wu, Z. N., Di, D. Y., and Wang, H. L. (2023). Water resources allocation based on water resources supply-demand forecast and comprehensive values of water resources. J. Hydrology Regional Stud. 47, 101421. doi:10.1016/j.ejrh.2023.101421
Zhao, R., and Zhao, X. (2014). Study on the classification of hydrological drought grade in the upper reaches of the fenhe river based on the standard runoff indexmethod. Hydropower Energy Sci. 32 (09), 11–14. doi:10.20040/j.cnki.1000-7709.2014.09.003
Zheng, L., Liu, Y., Ren, L., Yin, H., Yuan, F., and Zhang, L. (2022). Spatio temporal characteristics and propagation relationship of meteorological drought and hydrological drought in the yellow river basin. Water Resour. Prot. 38 (3), 87–95. doi:10.3880/j.issn.1004-6933.2022.03.012
Zheng, Z. (2018). Regional water consumption characteristics and trend forecast under the most stringent water resources management system. North China University of Water Resources and Electric Power.
Zhou, B. (2017). Analysis of key special projects of national key research and development plan “efficient development and utilization of water resources.”. Water Sci. Prog. 28 (03), 472–478. doi:10.14042/j.cnki.32.1309.2017.03.019
Keywords: eco-hydrology process, land use, adaptive management, climatic change, water balance
Citation: Zheng X, Wang W, Wang Y, Ma C and Wan F (2025) Study on multi-scenario and multi-water source allocation in Henan water supply area of Yellow River considering extreme drought. Front. Environ. Sci. 13:1600583. doi: 10.3389/fenvs.2025.1600583
Received: 27 March 2025; Accepted: 09 July 2025;
Published: 18 July 2025.
Edited by:
Maria Elisa Magri, Federal University of Santa Catarina, BrazilReviewed by:
Bai Tao, Xi’an University of Technology, ChinaHalil Ibrahim Burgan, Akdeniz University, Türkiye
Copyright © 2025 Zheng, Wang, Wang, Ma and Wan. This is an open-access article distributed under the terms of the Creative Commons Attribution License (CC BY). The use, distribution or reproduction in other forums is permitted, provided the original author(s) and the copyright owner(s) are credited and that the original publication in this journal is cited, in accordance with accepted academic practice. No use, distribution or reproduction is permitted which does not comply with these terms.
*Correspondence: Weihao Wang, d2FuZ3doQGl3aHIuY29t