 Temitope D. Timothy Oyedotun1*
 Ate Poortinga2
 Karis Tenneson2
 M. Warizmi Wafiq2Weraphong Suaruang2
 Andréa Puzzi Nicolau2
 Esan A. Hamer1Gordon A. Nedd1
 Helene Burningham3
- 1Department of Geography, Faculty of Earth and Environmental Sciences, University of Guyana, Georgetown, Guyana
- 2Spatial Informatics Group, Pleasanton, CA, United States
- 3Coastal and Estuarine Research Unit, UCL Department of Geography, London, United Kingdom
Small Island Developing States (SIDS) face significant challenges due to coastal hazards, climate change impacts, and data limitations that hinder effective coastal management. The Guyana Coastal Analysis System (G-CAS) was developed as a web-based geospatial tool to address these challenges by integrating remote sensing, machine learning, and cloud computing technologies. This study presents G-CAS as a replicable framework that enhances coastal monitoring and decision-making processes in Guyana and similar SIDS. The system consists of four core analytical modules: Shoreline Analysis, Coastal Squeeze Assessment, Bathymetric Change Detection, and Flood Detection and Modelling. These modules provide near real-time, data-driven insights into shoreline erosion, wetland compression, underwater depth variations, and flood risk exposure. Results from the application of the Shoreline Analysis module indicate spatially variable shoreline retreat rates, with critically eroded sections requiring urgent intervention. The Coastal Squeeze Assessment highlights areas where infrastructure restricts landward migration, increasing vulnerability to habitat loss. Bathymetric mapping reveals dynamic sediment transport patterns, essential for understanding coastal stability and marine ecosystem health. The Flood Detection and Modelling module assists in identifying high-risk zones, particularly in low-lying coastal settlements, supporting early warning systems and disaster mitigation planning. The offering of a cost-effective, scalable, and accessible coastal monitoring tool like G-CAS provides a data-driven foundation for coastal adaptation strategies in Guyana and beyond. The findings show the importance of integrating geospatial technologies into national coastal management frameworks to support climate resilience, disaster risk reduction, and sustainable development. This study highlights the potential for similar coastal analysis systems to be adopted across SIDS, ensuring evidence-based decision-making and enhanced environmental stewardship in response to climate change.
1 Introduction
Small Island Developing States (SIDS) face unique and heightened vulnerabilities due to their geographic, economic, and environmental characteristics (Briguglio, 1995; Turvey, 2007; Hay, 2013; Gheuens et al., 2019). These include low-lying coastal zones, reliance on marine and coastal ecosystems, and limited adaptive capacity (Nurse et al., 2014; Bush, 2018; Leal Filho et al., 2021; Hernández-Delgado, 2024). With the unfolding and accelerating climate change, developing a Coastal Analysis System (CAS) is critical for SIDS to enhance resilience, support sustainable development, and safeguard their populations and ecosystems. SIDS are affected by the impacts of climate change, such as sea-level rise, coastal erosion, storm surges, and extreme weather events (IPCC, 2014; Asariotis, 2020). A CAS, therefore, serves as an essential tool that could be used to analyse and model coastal dynamics under various climate scenarios, identify vulnerable areas and populations at risk from flooding and erosion and plan proactive adaptation strategies, such as managed retreat, coastal defenses, or ecosystem-based approaches. Guyana, although geographically situated on the northeastern coast of South America, is a member of SIDS and shares many of the vulnerabilities and characteristics of Small Island Developing States (SIDS).
Like other SIDS, Guyana’s coastal zone, located primarily below sea level, faces increasing threats due to climate change, including sea-level rise and increased frequency of coastal flooding (Hickey and Weis, 2012; Bassett and Scruggs, 2013; Nagy et al., 2019; Trotz, 2024). The extensive coastal plain is home to the majority of the country’s population and its economic infrastructure (Pelling, 1999; Khan, 2001; Hickey and Weis, 2012). With elevations of just 0.5–1 m above sea level, this area is highly susceptible to even minor shifts in sea levels (Oyedotun and Burningham, 2021). Although Guyana has recognised its vulnerability and identified coastal zone management as a national priority, there are significant gaps in monitoring capabilities and integrated data systems for effective coastal management (Weekes and Bello, 2019; Oyedotun and Burningham, 2021; Oyedotun et al., 2022; Kum, 2022).
However, a wide range of tools has been created to support coastal research and analysis, addressing various aspects of shoreline dynamics and coastal management. Examples of these include instruments for monitoring and assessing coastal vulnerabilities (McLaughlin and Cooper, 2010; Ramieri et al., 2011; Rangel-Buitrago et al., 2020; Akash et al., 2024), tools for forecasting shoreline changes (Davidson et al., 2010; Montaño et al., 2020; Abd-Elhamid et al., 2023; Palanisamy et al., 2024), and technologies for detecting shorelines (Gens, 2010; Pardo-Pascual et al., 2018; Toure et al., 2019). Other prominent systems, such as the Digital Shoreline Analysis System (Thieler et al., 2017), CoastSat software (Vos et al., 2019; Curoy et al., 2022), and the Coastal Analyst System from Space Imagery Engine (CASSIE) (Almeida et al., 2021; Klein et al., 2023), have also been developed. Numerous GIS-based tools have also contributed to advancements in this field (e.g., Elkafrawy et al., 2020; Serwa, 2020a; b; Marzouk et al., 2021; Nicolodi et al., 2021; de Lima et al., 2021; Serwa, 2022). However, limited data availability and the lack of integrated approaches persist, particularly in developing nations and SIDS like Guyana. Addressing these issues requires innovative strategies, including the establishment of centralised web-based platforms to facilitate long-term and short-term coastal monitoring in the context of climate change. Guyana Coastal Analysis System (G-CAS) is our proposed solution and answer to this need.
The Guyana Coastal Analysis System (G-CAS) is designed as a web-based platform (https://gcas.gy/) to address coastal monitoring and analysis issues in Guyana by offering a comprehensive, user-friendly tool for coastal monitoring. G-CAS is intended to support coastal zone management through near-real-time satellite data analysis, providing local authorities, researchers, and stakeholders with the information needed to make informed decisions regarding disaster risk management, climate change adaptation, and effective coastal management. The development of this tool could also be adapted to a similar coastal environment in SIDS for coastal monitoring and management. This Guyana Coastal Analysis System (G-CAS) presents an in-country pioneering framework that utilises sophisticated spatiotemporal analyses with state-of-the-art machine learning algorithms to offer novel insights into the complexities of coastal dynamics in Guyana. In the face of mounting challenges such as climate change impacts, coastal erosion, and habitat degradation, G-CAS is a tool of innovation, striving to enhance the understanding, prediction, and management of coastal ecosystems. By integrating diverse geospatial datasets, advanced modelling techniques and machine learning algorithms in Google Earth Engine (GEE), G-CAS exceeds traditional approaches, offering a comprehensive platform to address the Shoreline Analysis, Coastal Squeeze, Bathymetric Change and Flood detection/modelling along the Guyanese coastline.
The development of G-CAS has the aim of creating an Integrated Web-Based Monitoring System. This is a core goal of G-CAS, which is to have a fully functional web-based data analysis system to capture, monitor, and analyse the dynamics at the catchment-coastal-marine interface. Using near-real-time satellite imagery, G-CAS provides an automated tool for coastal area dynamics analysis and mapping. By making this platform open-source, the project aims to provide a user-friendly tool accessible to both local and international stakeholders for monitoring coastal changes—that is, shoreline changes, coastal squeeze, bathymetric changes, and coastal flood modelling—and for preparing for climate-related hazards. The development of the Guyana Coastal Analysis System (G-CAS), as presented in this paper, serves as a pioneering example for SIDS, demonstrating how geospatial tools can be tailored to address coastal vulnerabilities and support climate resilience. By integrating climate data, flood modelling, and risk assessment, G-CAS provides a scalable framework that can be adapted by other SIDS to enhance coastal zone management and disaster risk reduction efforts.
2 Guyana coast and G-CAS
The Guyana coast, stretching approximately 430 km from the Waini River at Mabaruma to the Corentyne River in Corriverton (Figure 1), forms a unique and dynamic ecological system along the northeastern edge of South America. Guyana’s coast, characterised by mild hydrological and meteorological conditions, is a low-lying coastal plain that is shaped by northeast trade winds, semi-diurnal tidal cycles, and wave heights averaging 1–2 m (van Ledden et al., 2009; GoG, 2012; Anthony et al., 2021; Best et al., 2022; Oyedotun and Nedd, 2023). Much of this coastal strip lies below mean high tide, relying heavily on natural and engineered defences for protection (Winterwerp et al., 2007; van Ledden et al., 2009). A defining feature of the coastline is the presence of extensive mud banks and deposits originating from the Amazon River (Anthony et al., 2010; Best et al., 2022). These mud flats, which dissipate up to 70% of wave energy, contribute to a relatively calm nearshore wave environment, critical for the stability of the coastline (Wells and Kemp, 1986; Sheremet and Stone, 2003; Winterwerp, et al., 2007; Anthony et al., 2010; Pilkey, 2011). Despite its ecological importance, Guyana’s coastal zone remains the most densely populated and economically active region in Guyana, underscoring its vulnerability to anthropological and environmental pressures in addition to climate-induced risks (Singhroy, 1996; Pelling, 2003; Redclift et al., 2011; Hickey and Weis, 2012; Kirton and Lewis, 2015; Oyedotun and Burningham, 2021; Aktürk and Hauser, 2024; Maximus, 2025).
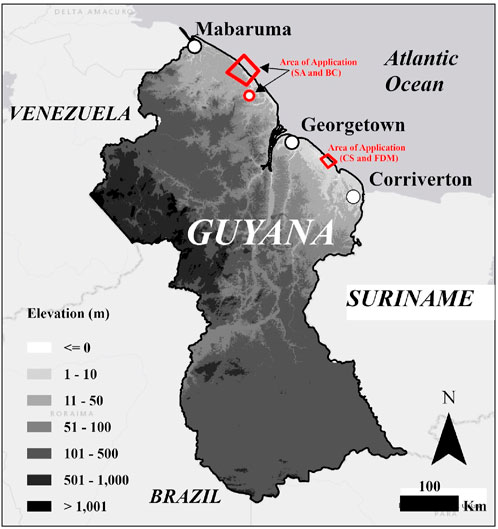
Figure 1. Map of Guyana showing the country’s elevation and the Area of Application of G-CAS for Shoreline Analysis (SA), Bathymetry Change (BC), Coastal Squeeze (CS) and Flood Detection and Monitoring (FDM) (Indicated in red by rectangle polygon for SA, CS, FDM and circle for BC).
The coastal environment is increasingly threatened by the impacts of climate change, with over 90% of Guyana’s population concentrated in low-lying areas prone to flooding and inundation (González and Gonzalez, 2020; Oyedotun and Burningham, 2021). Rising sea levels, more frequent extreme weather events, and the overtopping of sea defences have highlighted the urgency of implementing adaptive strategies. Recent fluvial and coastal floods (e.g., in 2013–2015) and drought events (2015–2016) underscore the need for robust climate resilience frameworks (Office of Climate Change, 2016). National policy documents, including the Low Carbon Development Strategy (LCDS) and the Green State Development Strategy (GSDS), emphasise the integration of scientific data and monitoring systems to address these vulnerabilities (Government of Guyana, 2012). Collaborative efforts among government agencies, researchers, and local communities have become vital for the sustainable management of coastal resources, as well as for safeguarding infrastructure and socio-economic activities.
Among the measures taken to protect Guyana’s coastline, mangrove restoration has emerged as a critical component of natural defences. The mangrove belt, historically resilient to coastal erosion, has been severely impacted by human activities and land-use changes, resulting in the loss of significant acreage, declining from approximately 80,000 ha in 1992 to just 22,000 ha in 2001 (Bovell, 2019; NAREI, 2015). Mangroves not only buffer wave energy and reduce the cost of maintaining artificial sea defences but also provide essential ecosystem services, including carbon sequestration and biodiversity support. To address this decline, initiatives such as the Guyana Mangrove Restoration Project (GMRP) were launched, focusing on conservation, replanting, and sustainable management (NAREI 2015; Vaughn, 2017; Johnson-Bhola, 2020; Nedd et al., 2023; Ram et al., 2024).
Climate change significantly affects coastal environments, altering the spatial and temporal patterns of flood and erosion risks that threaten vital infrastructure, large population centres, and critical habitats for numerous species (Wang et al., 2024). These evolving challenges necessitate the adoption of robust adaptation strategies and sustainable development practices to safeguard vulnerable coastal areas (Suhaeb and Tamrin, 2024). In Guyana, such strategies must leverage near-real-time monitoring systems to minimise negative impacts and enhance resilience. In response to these pressing needs, this study highlights the development of the Guyana Coastal Analysis System (G-CAS).
G-CAS is designed as a comprehensive framework for understanding and addressing the dynamic challenges faced by the country’s coastal zone. Of the four (4) core focuses of G-CAS (Figure 2), three (3) are based on the work of Almeida et al. (2021), and the fourth is our new addition. These three are Shoreline Analysis, Coastal Squeeze and Bathymetry Change, respectively, and the fourth is Flood Detection and Modelling. The focus of the four components is summarily described below:
(i) Shoreline Analysis: This focus of G-CAS helps examine the spatiotemporal shifts in the coastline to identify patterns of erosion and accretion. By integrating high-resolution satellite imagery, this component provides critical insights into coastal stability and shoreline dynamics. Understanding shoreline dynamics is vital for the planning and management of coastal infrastructure and the preservation of habitats, particularly as sea-level rise accelerates and human activities intensify.
(ii) Coastal Squeeze: G-CAS’s second component and focus are structured to help assess the interplay between built structures and natural coastal ecosystems. The goal is to emphasise areas where adaptive management strategies, such as habitat restoration or setback policies, are needed. System (G-CAS) is expected to estimate the coastal squeeze as a balanced approach to coastal zone management, ensuring both human and ecological needs are addressed.
(iii) Bathymetry Change: This scope is based on the work of Li et al. (2021) and is integrated into G-CAS to map and monitor variations in underwater topography along Guyana’s coastal and nearshore zones. Using hydrographic survey information and remotely sensed data, this component tracks underwater topography, morphological and statistical changes.
(iv) Flood Detection and Modelling: Within G-CAS, this scope employs remote sensing, historical hydrometeorological data, and machine learning algorithms to identify flood-prone areas and simulate future flood scenarios. This component supports real-time flood monitoring and the development of possible early warning systems, providing critical tools for disaster risk reduction.
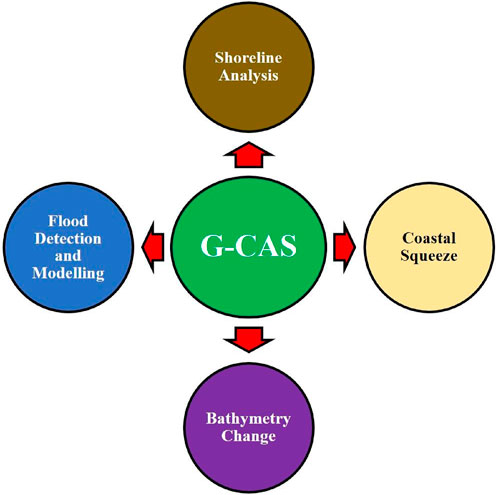
Figure 2. The four (4) components and scope of the G-CAS tool.
The four G-CAS tools are applied to distinct locations along the Guyana coast, as indicated in Figure 2. The Shoreline Analysis is implemented in Region 1, Barima-Waini, with a specific focus on Waini. The Bathymetry Change assessment is conducted at Somerset and Berks in Pomeroon-Supenaam in Region 2. Additionally, the Flood Detection and Modelling tool is applied in Buxton, while the Coastal Squeeze analysis is tested in Mahaica (Region 4–5). The varied geographic application of G-CAS demonstrates its versatility as a web-based tool capable of assessing and monitoring different aspects of Guyana’s coastal environment.
The development of G-CAS is strategically designed to tackle the pressing issues affecting Guyana’s coastal region in the face of climate change (Oyedotun et al., 2024), examples of which include but are not limited to:
2.1 Shoreline monitoring and sea-level rise
By tracking changes in shoreline position over time, G-CAS will offer detailed insights into areas most affected by coastal erosion and rising sea levels. This information is critical for identifying high-risk zones and guiding the implementation of effective mitigation measures to protect vulnerable coastal areas.
2.2 Coastal squeeze and sustainable land use
G-CAS can be used to evaluate the effects of coastal squeeze by studying the interplay between natural processes and human activities. Analyses with G-CAS will help inform sustainable land-use strategies, support the preservation of critical habitats, and guide the planning of coastal infrastructure to balance ecological and developmental needs.
2.3 Responding to extreme weather events
The system will enhance the resilience of Guyana’s coastal zone by monitoring extreme events and providing real-time information for early warning systems. These capabilities will strengthen emergency response efforts and aid in the design of infrastructure capable of withstanding extreme climatic conditions.
2.4 Preserving biodiversity and ecosystems
With G-CAS, it is hoped that the tool will be able to assess the effects of climate change on coastal ecosystems by analysing shifts in vegetation, land cover, and physical features. This data will be instrumental in supporting efforts for habitat restoration, conservation initiatives, and the protection of biodiversity along the coast.
2.5 Facilitating community and stakeholder involvement
By offering accessible tools and data, G-CAS is expected to empower communities, policymakers, and other stakeholders to engage in informed decision-making.
The potential applications of G-CAS are manifold, spanning coastal risk assessment, natural resource management, infrastructure planning, and policy support. By empowering decision-makers with actionable insights and evidence-based recommendations, G-CAS paves the way for informed decision-making processes that prioritise the resilience, sustainability, and wellbeing of coastal communities and ecosystems in Guyana. As G-CAS continues to evolve and expand its capabilities, it holds the promise of ushering in a new era of coastal management, where cutting-edge technologies will continue to safeguard the future of Guyana’s coastal heritage.
There are many in-country agencies and organisations - stakeholders - who are potential beneficiaries of this development. In no particular order, the examples of these in Guyana are:
2.5.1 Guyana’s environmental protection agency (EPA)
On 18 March 2021, the Environmental Protection Agency established a Coastal and Marine Management Committee (CMMC) to implement the function of the Environmental Protection Act, Cap 20:05 Law of Guyana, which is specifically tasked to ‘coordinate an integrated Coastal Zone Management programme’. Having access to concise and integrated data will be of tremendous benefit to this committee in the performance of its functions, which is one of the targets of this G-CAS.
2.5.2 Protected area commission (PAC)/protected area trust (PAT)
With the mandate of PAC/PAT to mobilise and allocate resources and finances for the management of the National Protected Areas in Guyana, to contribute to and/or promote the conservation and preservation of biological diversity and the maintenance of ecosystem services, we believe that having access to an integrated and comprehensive analytically-ready data system will help the agency in the setting of its priority and agenda as relates to coastal and marine environments.
2.5.3 Civil defence commission (CDC)
The CDC was established to plan and conduct operations to deal with all types of disasters in Guyana. Currently, the CDC is challenged with determining the response to climate change-related disasters, for example, flooding of coastal residences, businesses and agricultural farms as a result of elevated water levels overtopping sea defences. One of the challenges faced by the commission, which has been repeatedly reported, is “insufficient Early Warning Systems for the entire country” and a lack of an up-to-date and real-time data analysis system to guide the commission in its preparedness. We believe that this tool (G-CAS) will be able to meet this challenge, and the CDC would be a significant beneficiary of this work.
The advances in this application will also provide a valuable resource to agencies such as Guyana Lands and Survey Commission (GLSC), National Agricultural Research and Extension Institute (NAREI) (currently focusing on mangrove restoration), the Sea and River Defence Unit of the Ministry of Public Works, Conservation International (CI), and Hydrometeorological Service (HydroMet) and insurance companies (and their needs to understand and mitigate for coastal flood risk). Similarly, the Government of Guyana (GoG), as with other countries, has an obligation to report its climate-related activities to United Nations Conventions to which it is a signatory to as National Communications, especially the United Nations Framework Convention on Climate Change (UNFCCC), United Nations Convention on Biological Diversity (UNCBD) and United Nations Convention to Combat Desertification (UNCCD). Preparation of the National Communications enhances general awareness and knowledge of climate change-related issues in Guyana, as it is expected to assist in national planning and policy formulation related to mainstreaming vulnerability and adaptation measures. Having access to an integrated analytical data system like G-CAS is vital in this regard, and we see the project as playing an important role in supporting the Government of Guyana in its national communications preparations.
3 Materials and methods
3.1 G-CAS workflow
The G-CAS workflow shows a modern approach to coastal analysis by combining advanced geospatial technology with a user-friendly interface. Central to its functionality is the Shoreline Analysis module, a sophisticated graphical user interface (GUI) developed using the JavaScript Google Earth Engine (GEE) API, after CASSIE (https://cassiengine.org/; Almeida et al., 2021). This module empowers users to load and visualise high-resolution satellite imagery (Table 1) and perform automatic shoreline detection and analysis for Guyana, where a clear boundary exists between land and water. For a country like Guyana, where much of the population and economic activity are concentrated in vulnerable coastal zones, this tool offers a vital resource for monitoring dynamic coastal processes and mitigating climate risks.
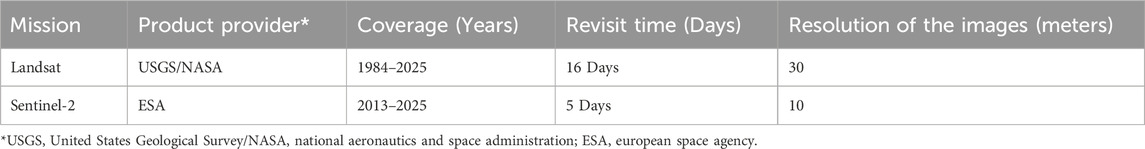
Table 1. Satellite imagery used in GEE for G-CAS.
The workflow involves a straight integration of user interaction and internal computational processes, enabling both accessibility and efficiency. As illustrated in Figure 3, users interact with the Shoreline Analysis GUI to input parameters, define areas of interest, and initiate shoreline detection with minimal technical expertise. Behind the scenes, the tool automates data retrieval from GEE, processes the satellite imagery, and applies advanced algorithms to identify shoreline boundaries and generate detailed visualisations. This streamlined workflow ensures that stakeholders can rapidly obtain actionable insights to inform decisions related to coastal management, disaster risk reduction, and climate adaptation.
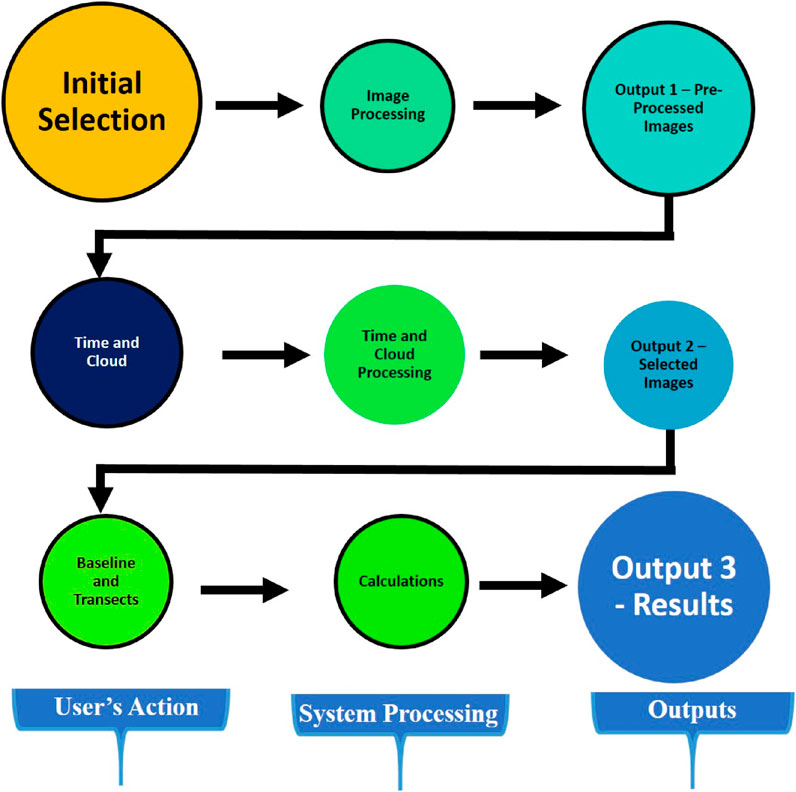
Figure 3. Workflow of G-CAS, adapted after CASSIE (Almeida et al., 2021).
Through its design, G-CAS shows how geospatial tools can address the specific needs of Small Island Developing States (SIDS). Integrating advanced analytics with an integrative interface bridges the gap between complex technology and practical application, making it a scalable and adaptable model for other SIDS. Whether for assessing erosion hotspots, evaluating flood risk, or planning sustainable coastal development, the G-CAS workflow sets a benchmark for the utilisation of technology to enhance resilience and support the long-term sustainability of vulnerable coastal communities.
The workflow of the G-CAS system (Figure 3) is designed to guide users through a structured, yet flexible, process for coastal analysis, ensuring both precision and ease of use. The workflow begins with the selection of the imagery type, where users can choose from various satellite datasets tailored to their specific analytical needs. This selection allows the system to utilise the most appropriate imagery for shoreline detection, flood mapping, or other coastal processes, ensuring the data aligns with the desired objectives.
Next, users define the time frame of analysis, which enables them to focus on specific periods of interest, such as seasonal variations or long-term coastal changes. To ensure data quality, the workflow also includes the step of specifying cloud cover percentage tolerance, allowing users to filter out imagery with excessive cloud coverage. This feature ensures the analysis is based on clear and reliable satellite composites. Once the parameters are set, users can visualise free-cloud composites, providing a seamless preview of the processed imagery within the user interface. This step allows for quick verification and refinement of the selected inputs before the final analysis. The workflow concludes with the generation of results based on the module, where G-CAS applies its algorithms to produce actionable outputs, such as detected shoreline changes, flood extent maps, or vulnerability assessments. This structured approach ensures that users can efficiently derive meaningful insights while maintaining full control over the analysis process.
3.2 Shoreline analysis
The G-CAS system integrates user-defined inputs with advanced computational techniques to deliver accurate shoreline analysis (Himmelstoss et al., 2021). The process begins with the manual digitisation of a baseline, which serves as the foundational reference for evaluating shoreline changes (Almeida et al., 2021). This baseline is to be carefully placed inland at a predefined distance from the observed shoreline to avoid overlapping with historical shoreline data. It acts as the starting point for generating transects—lines cast perpendicular to the baseline at regular intervals and user-specified lengths (after Himmelstoss et al., 2021). These transects form the spatial framework for calculating shoreline-change metrics, such as rates of erosion and accretion (Leatherman et al., 1983; Thieler and Danforth, 1994; Oyedotun and Johnson-Bhola, 2019; Himmelstoss et al., 2021; Oyedotun et al., 2024).
To automate shoreline detection, G-CAS utilises a geospatial algorithm based on spectral indices derived from satellite imagery. The system utilises the Normalised Difference Water Index (NDWI), which differentiates land and water by analysing reflectance values from the near-infrared and green spectral bands as follows:
This spectral index is applied to pre-processed satellite images, enabling the classification of pixels into land and water categories. In scenarios where the NDWI histogram displays two distinct peaks (bimodal), G-CAS applies a standard thresholding algorithm to separate the two classes (after Cordeiro et al. 202). However, in more complex environments, such as estuaries with intertidal zones, the system adapts by implementing multilevel thresholding techniques to account for intermediate features, improving the accuracy of shoreline delineation (after Pucino et al., 2022; Chen et al., 2023; Mahmoud et al., 2025). Once the NDWI-based classification is complete, the resulting binary image is converted into vectorised polygons. The polygon edge that intersects each transect is identified as the shoreline, while all other polygons are excluded from the analysis. This step ensures that the extracted shoreline corresponds precisely to the desired spatial reference. To enhance the accuracy and visual quality of the shoreline, the system applies a smoothing algorithm using a 1D Gaussian filter (Ciecholewski, 2024; Savastano et al., 2024). This filter eliminates abrupt pixel-induced irregularities and creates a more continuous representation of the shoreline, with parameters that allow for the adjustment of smoothing intensity.
After the automatic extraction of the shoreline from the selected images, G-CAS computes the statistical analyses for each of the transects after Digital Shoreline Analysis System (DSAS) (Thieler and Danforth, 1994; Thieler et al., 2013). Examples of the statistical analyses that are generated by the Shoreline Analysis module of G-CAS are briefly below (after Thieler and Danforth, 1994; Thieler et al., 2013; Oyedotun, 2014; Himmelstoss et al., 2021).
i. Shoreline Change Envelope (SCE): which
o measures the total variation in shoreline movement at each transect by considering the farthest and closest shoreline positions from the baseline.
o Reports the maximum range of shoreline movement without factoring in specific dates.
o provides insights into the overall extent of shoreline dynamics over the observed time periods.
ii. Net Shoreline Movement (NSM): which
o calculates the direct distance (in meters) between the oldest and most recent shoreline positions for each transect.
o represents the net positional shift of the shoreline over the analysed timeframe.
o aids in understanding long-term shoreline trends, whether dominated by erosion or accretion.
iii. End Point Rate (EPR): which
o estimates the rate of shoreline change (in meters per year) by dividing the NSM by the total time elapsed between the earliest and latest shoreline positions.
o provides a straightforward measure of shoreline change over a specific period, suitable for assessing short- and medium-term trends.
o particularly effective for locations with limited shoreline datasets or where only start and end points are available.
iv. Linear Regression Rate (LRR): which
o uses the least-squares regression method to fit a linear trend to all available shoreline positions along each transect.
o provides a statistically robust rate of change (in meters per year) by incorporating all shoreline data points rather than relying on just two endpoints.
o Additional LRR metrics include:
▪ Standard Error of Linear Regression (LSE): Quantifies the accuracy of the regression fit.
▪ Confidence Interval of Linear Regression (LCI): Reflects the uncertainty range of the rate-of-change estimate.
▪R-squared (R2): Measures the strength of the linear relationship between shoreline position and time, indicating the reliability of the regression model.
3.3 Coastal squeeze
The Coastal Squeeze Analysis (CSA) module of G-CAS evaluates the compression of tidal wetlands, which are increasingly constrained by rising sea levels, fixed infrastructure, and urban development, limiting their ability to migrate naturally. This compression, known as coastal squeeze, leads to significant habitat loss and degradation in intertidal zones. The CSA module uses satellite-derived data and the Normalised Difference Water Index (NDWI) to analyse wetland dynamics over time, focusing on changes within the study area. This analysis covered the dataset period for the G-CAS system, offering a temporal perspective on how coastal squeeze has impacted wetland ecosystems.
The analysis follows a systematic process to calculate the Coastal Squeeze Index (CSI). First, satellite imagery is pre-processed to extract key features such as intertidal zones, impervious surfaces, and elevation data. Second, NDWI is applied to identify water-dominant and intertidal areas. Third, spatial data layers representing slope, elevation, and impervious surfaces are integrated into a fuzzy logic model, following methodologies by Gilles et al. (2003), Torio and Chmura (2013) and applied by Oyedotun et al. (2024) (See Equations 2–5). Fourth, CSI values are computed, with low values indicating minimal constraints on wetland migration, moderate values identifying potential risk areas, and high values signalling severe restrictions caused by urban development or hard coastal defences. Finally, the results are mapped and visualised to pinpoint vulnerable areas.
For the elevation, slope and impervious surfaces, a Fuzzy membership function was defined using the formulae (after Oyedotun et al., 2024):
where x is the elevation value.
where x is the slope value.
where x is the slope value.
These variables were then transformed into a standardised fuzzy scale (0–1) to address uncertainties and successfully merge different data types. A minimum (AND) operation is used to compute the Coastal Squeeze index, CSI (after Torio and Chmura, 2013).
This step-by-step process allows for a detailed evaluation of the spatial extent and intensity of coastal squeeze. The resulting CSI maps provide actionable insights for coastal managers, highlighting areas where adaptive interventions, such as sustainable coastal defences or wetland restoration, are most urgently needed. By analysing these vulnerabilities, the CSA module supports evidence-based decision-making to safeguard wetland ecosystems against the combined pressures of urbanisation and climate change.
The CSA module also serves as a critical tool for assessing habitat and biodiversity loss in vulnerable ecosystems such as mangroves. These ecosystems play a vital role in coastal protection, carbon sequestration, and supporting marine biodiversity. By identifying areas where mangroves are most constrained due to coastal squeeze, the module could aid in the prioritisation of conservation efforts. It also provides a quantitative basis for monitoring habitat loss, helping policymakers and environmental managers implement targeted interventions to protect these critical ecosystems and mitigate further biodiversity decline. Additionally, the module facilitates land-use change mapping, which is crucial for effective risk management and planning. By analysing the extent of impervious surfaces and other human-induced changes, it enables a detailed understanding of how urbanisation and infrastructure development contribute to coastal vulnerability. This data is invaluable for environmental impact assessments, as it allows users to evaluate the effects of land-use decisions using environmental indices and factors. The insights generated from the CSA module can inform sustainable development strategies, ensuring that future land-use policies account for environmental constraints and minimise adverse impacts on coastal ecosystems.
3.4 Bathymetric change
The Bathymetric Change Module in the Guyana Coastal Analysis System (G-CAS) serves as a comprehensive tool for analysing changes in underwater topography, after CASSIE (Almeida et al., 2021; Li et al., 2021). By integrating satellite imagery and advanced geospatial techniques, this module enables users to assess and monitor bathymetric variations over time. Its primary objective is to support coastal management and decision-making by providing detailed, reliable bathymetric data for understanding sediment dynamics, erosion, and deposition patterns.
The analysis begins with the acquisition of satellite images using the Digital Shoreline Analysis System (DSAS) interface. Users first define the mission by selecting the satellite collection, such as Sentinel-2, and identify their area of interest (AOI) or Area of Application (AOA) by drawing a polygon on the map or importing a. kml file. Subsequently, users set the time window and apply a cloud cover filter to ensure the selection of high-quality images. Training data, including depth information, is then imported in a. csv format, ensuring compatibility with the system’s requirements, such as latitude, longitude, and depth parameters.
Once the AOI and training data are established, the next step involves defining image parameters for bathymetry generation. The application automatically retrieves satellite images based on the specified dates and AOI. If the initial image does not meet the required quality, users can define a time range to generate a median image, averaging pixel values over the specified period. This process ensures optimal image quality and accuracy for bathymetric extraction.
Following image selection, users proceed to manual cutting and algorithm training. This involves selecting two spectral bands to create a ratio or index algorithm, inspecting the regression graph, and identifying the inflection point for light extinction depth. Users then apply a “cut line” to limit the analysis depth, ensuring that only valid bathymetric data are included in the final analysis. The final stage involves generating and visualising the bathymetric surface. Users can load the base image, the generated bathymetry image, or the median image for comparison. The system displays a detailed statistical summary of the analysis, including a thumbnail of the bathymetric surface with colour and depth scales. Users can download the final data in various formats for further analysis or integration into other coastal management tools. The system’s interface and efficient processing capabilities ensure seamless data generation, even for larger study areas.
This module provides a platform for assessing underwater terrain changes, making it invaluable for coastal zone management. It plays a critical role in understanding sediment transport, mapping erosion hotspots, and supporting the design of effective coastal protection measures. The bathymetric data generated can also inform marine spatial planning, aiding in the identification of suitable locations for ports, dredging activities, and other coastal infrastructure projects.
Additionally, the Bathymetric Change Module contributes to environmental impact assessments by identifying areas of potential habitat loss or degradation. By enabling the monitoring of underwater ecosystems such as seagrass beds and coral reefs, it helps assess biodiversity changes and supports sustainable marine resource management. This functionality aligns with broader objectives of mitigating the impacts of climate change and human activities on coastal and marine environments.
The integration of the Bathymetric Change Module into G-CAS enhances its capacity to address coastal management challenges in dynamic environments like Guyana’s coastlines. With ongoing advancements in satellite technology and algorithm refinement, the module has the potential to provide even greater precision and automation in bathymetric analysis. Expanding the module to incorporate additional datasets, such as LiDAR or sonar-derived bathymetry, could further strengthen its applicability for detailed and large-scale coastal studies.
3.5 Flood detection and modelling
The Flood Detection and Modelling module within the G-CAS system leverages satellite-based observations and advanced geospatial analysis to accurately identify flood-prone areas and simulate potential flood scenarios along Guyana’s coastal region. Through its interactive interface, the module integrates flood frequency mapping, flood-prone area delineation, and infrastructure impact analysis, effectively combining hazard assessment with exposure analysis from the disaster risk framework. This holistic approach enhances disaster preparedness and response efforts by providing actionable insights for decision-makers.
The first component of the Flood Detection and Modelling module calculates flood frequency analysis, utilising historical water occurrence data to identify flood-prone areas. This component relies on datasets such as the JRC Global Surface Water (Pekel et al., 2016), which consolidates over 30 years of satellite-derived observations to compute flood frequency as the ratio of water presence to total observations over a specified time period. Historical flood events serve as reliable predictors of future flooding patterns, and the extensive Landsat data archive provides the longest medium-resolution time series available for this purpose. The methodology mirrors the approach developed by Phongsapan et al. (2019) for Myanmar. The module enables real-time geospatial analysis, offering efficient and scalable flood mapping capabilities using Google Earth Engine (Gorelick et al., 2017).
The second component of the Flood Detection and Modelling module focuses on identifying flood-prone areas by combining flood frequency information with terrain characteristics using the SRTM Digital Elevation Models (Van Zyl, 2001), this component identifies low-lying regions and flat terrain based on elevation and slope thresholds, which are critical physical indicators of flood susceptibility. By overlaying flood frequency data, derived from the JRC Global Surface Water dataset, with these terrain features, the module delineates areas with a history of recurrent inundation.
The assessment of exposure integrates both land cover and building datasets to evaluate the potential impacts of flooding on human and natural systems. The ESA World Cover dataset provides detailed land cover classifications, allowing the analysis of flood impacts across various land types such as urban areas and agricultural fields. Flood-prone area maps, derived from flood frequency and terrain analysis, are overlaid with the land cover data to determine the extent of flooding across these classes. This enables a deeper understanding of how flooding affects socio-economic assets and ecological systems, from urban infrastructure to food production areas and wetlands.
Additionally, the integration of the Google Open Buildings (Sirko et al., 2021) dataset provides unprecedented granularity to the exposure assessment. This dataset, which includes high-resolution building footprints, allows for a very fine-scale analysis of infrastructure within flood-prone areas. Such detailed insights were not possible until recently, showcasing the transformative role of this dataset in understanding flood risks. By converting building footprints into centroids and intersecting them with flood-prone zones, the number and spatial distribution of affected structures are quantified. This level of granularity significantly enhances the ability to pinpoint vulnerable infrastructure, providing actionable information for disaster response, urban planning, and risk reduction strategies. The full manual on the utilisation of the developed system can be found at https://gcas.gy/.
4 Results and discussion
4.1 G-CAS module and process
The Guyana Coastal Analysis System (G-CAS) represents a significant advancement in coastal zone management, providing a user-friendly, web-based platform for geospatial analysis. One of the most defining features of the G-CAS platform is its accessibility. Unlike many other geospatial applications that require user registration and login credentials, G-CAS is designed for immediate use upon accessing the website (http://gcas.gy) (Figure 4a). This accessibility ensures ease of use and broadens its applicability among diverse stakeholders, including researchers, policymakers, and coastal managers.
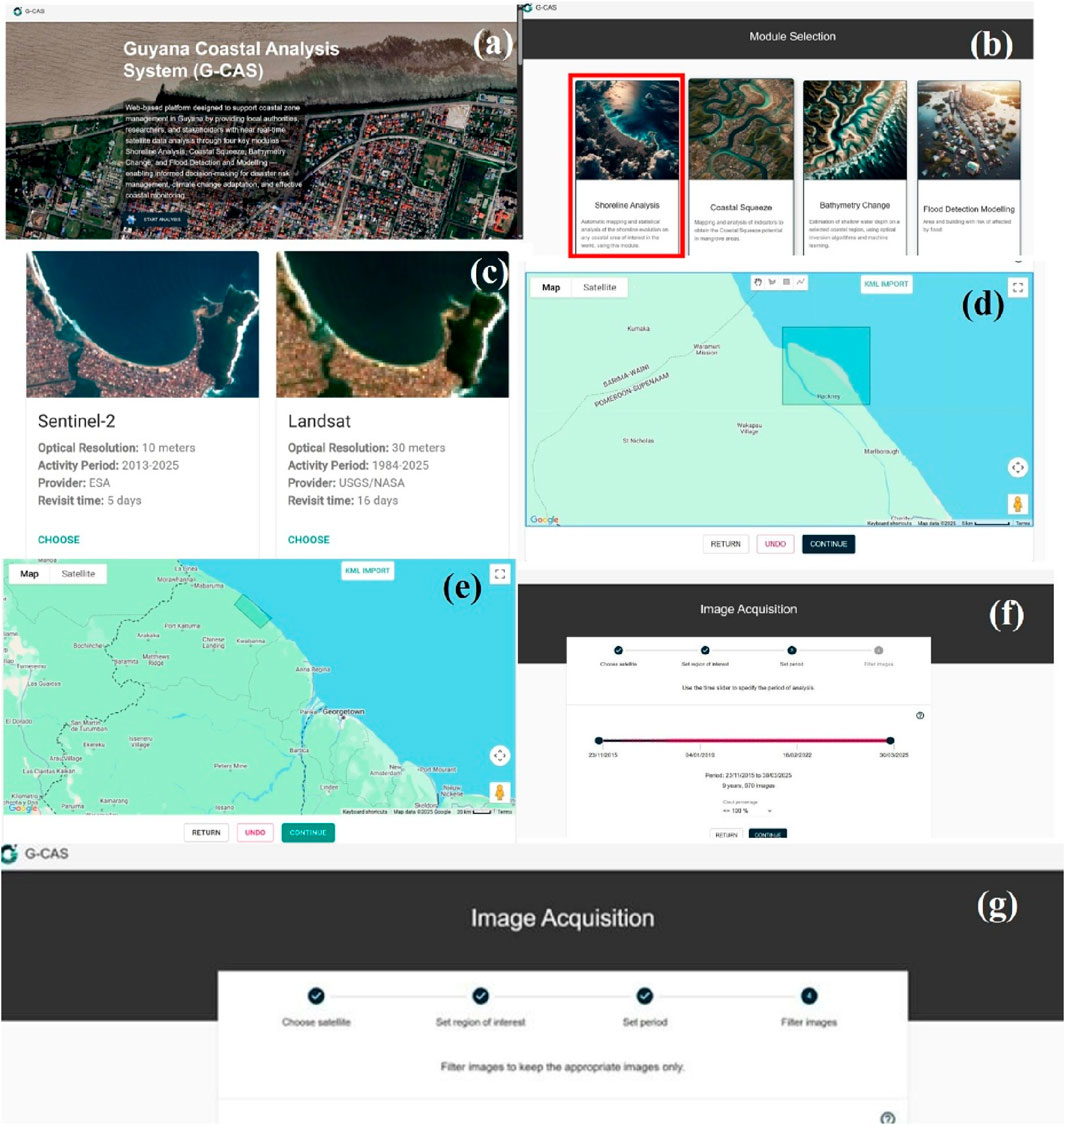
Figure 4. The sample of the G-CAS Application Process (from http://www.gcas.gy) (a) The Landing Page of G-CAS where analysis can start by clicking “Start Analysis); (b) Selection of the Tool or Module page where the appropriate application or tool for analysis could be selected - either for Shoreline Analysis, Bathymetric Change analysis, Coastal Squeeze evaluation or Flood Risk Modelling and Analysis; (c) The page for the selection of Remotely Sensed images to be used for any of the analyses - either Sentinel-2 or Landsat Images; (d) The platform for user to identify the area of application which can be done by drawing the polygon on the area of study or application; (e) Example of polygon drawn on an area of interest or an area of application; (f) the page where the years of images or analyses could be selected and the percentage of cloud coverage for the images determined (g) selection of images to be used for analysis is completed at this page.
4.1.1 Selection of the module or tool for the analysis
The first step after initiating the G-CAS analysis is the selection of the appropriate module or tool (Figure 4b) for the intended analysis. Users are presented with four specialised analytical modules: Shoreline Analysis, Coastal Squeeze, Bathymetry Change, and Flood Detection and Modelling. Each module is designed to address specific coastal monitoring and management needs. The selection of a module determines the subsequent workflow and processing steps, ensuring that the analytical approach aligns with the user’s objectives. Once a module is chosen, the system guides the user through the relevant image acquisition and analysis processes tailored to that specific study area.
4.1.2 Data acquisition and processing
The Image Acquisition Steps in G-CAS (Figure 4b) provide a structured workflow that ensures the integrity and relevance of the data used in the analysis. The key steps in this process are outlined below:
4.1.2.1 Defining the mission (satellite collection selection)
G-CAS integrates two primary satellite collections: Sentinel-2 and Landsat. These missions are critical in providing high-resolution optical imagery suitable for various coastal studies, including shoreline dynamics, coastal squeeze, bathymetric changes, and flood modelling. Users must select the appropriate satellite mission based on the resolution and spectral capabilities best suited for their analysis (European Space Agency, 2023; USGS, 2022) (See Figure 4a: Mission Selection Interface).
4.1.2.2 Choosing the area of interest (AOI)
Selecting an Area of Interest (AOI) is crucial, as it determines the spatial extent of the analysis. The platform provides interactive tools for delineating the AOI manually or importing predefined . kml files. To ensure efficiency, smaller regions are recommended, as extensive areas may increase processing time. The platform allows modifications through an “Undo” function before finalising the selection (See Figure 4e for example,).
4.1.2.3 Setting the time window and cloud cover filter
Temporal analysis is facilitated by defining a time window and setting a cloud cover threshold. The platform queries Google Earth Engine (GEE) to retrieve imagery based on the selected parameters (after Gorelick et al., 2017). Cloud-free images are critical in optical remote sensing, and users can refine the dataset by filtering out cloudy images. This step in GCAS optimises the dataset for high-quality analysis (See Figure 4c: Time and Cloud Cover Filter Settings).
4.1.2.4 Reviewing and filtering images
In the final image acquisition stage, users review thumbnails of selected images to filter out those with excessive cloud cover, sensor errors, or visual distortions. The ability to manually curate datasets enhances the reliability and accuracy of the analyses. The interface also provides navigation options to browse multiple pages of image thumbnails for selection (See Figure 4f: Image Review and Filtering Interface).
4.1.3 Analysis in G-CAS modules
Following image acquisition, the analysis phase consists of three primary steps:
4.1.3.1 Image preview
Users can preview the selected images on a map interface, providing a spatial context for further processing. This step allows for an initial assessment of image quality and alignment with research objectives (See Figure 4g: Example of Image Preview Interface).
4.1.3.2 Operations with image bands
G-CAS supports advanced remote sensing applications, including spectral band operations such as:
Normalised Difference Water Index (NDWI) for water body detection.
Change detection to assess coastal dynamics.
Bathymetric assessments for seabed monitoring.
These operations enhance the interpretability of satellite data and support in-depth environmental analysis (See Figure 4f: Example of Band Operations Interface).
4.1.3.3 Analysis execution
The core analytical functionality of G-CAS is embedded in this step. The platform supports multiple specialised analyses, including:
Shoreline Analysis: Identifying and quantifying coastline changes over time (Parker, 2003).
Coastal Squeeze Assessment: Evaluating land loss due to natural and anthropogenic factors.
Bathymetry Change Detection: Monitoring seabed variations and sediment transport.
Flood Detection and Modelling: Assessing flood extents and inundation risks using multi-temporal analysis (JRC, 2020).
The analytical phase does not require prior image previews or band operations, offering flexibility to users who seek direct computational outputs. (See Section 4.2, Section 4.3, Section 4.4, Section 4.5 the examples of the outputs of the analyses executed by G-CAS).
4.1.4 A G-CAS example
Small Island Developing States (SIDS) are particularly vulnerable to coastal hazards, including sea-level rise, coastal erosion, and extreme weather events. The development of advanced coastal analysis systems such as G-CAS provides critical tools for climate adaptation and disaster risk reduction in these regions. Remote sensing-based analysis, coupled with cloud computing capabilities, allows for cost-effective and scalable monitoring of coastal environments (IPCC, 2021). G-CAS serves as an example of how geospatial technology can be leveraged to support evidence-based decision-making in SIDS. By integrating open-source satellite imagery with automated processing workflows, the system provides insights into coastal change dynamics, informing sustainable coastal zone management policies (UNEP, 2019). Moreover, its accessibility removes barriers to entry, enabling local governments, researchers, and community organisations to harness geospatial analysis without requiring extensive computational resources. Future iterations of G-CAS could enhance its applicability to SIDS by incorporating real-time climate data, socio-economic vulnerability assessments, and AI-driven predictive modelling. Such advancements would significantly strengthen the capacity of these regions to respond to coastal hazards and climate-induced changes (Mahmoud Shaaban Mabrouk et al., 2022).
4.2 Shoreline analysis
The shoreline change analysis was conducted using the G-CAS system, integrating geospatial techniques to assess coastal dynamics. The results are visualised in Figure 5, which presents the spatial distribution of shoreline transects along the applied area of G-CAS in Region one of Guyana. Each transect represents a perpendicular measurement extending from the manually digitised baseline (orange line), serving as a reference for shoreline movement calculations. The transects are colour-coded to reflect different shoreline change classifications: stable (green), accreted (blue), eroded (yellow), and critically eroded (red) (Figure 5).
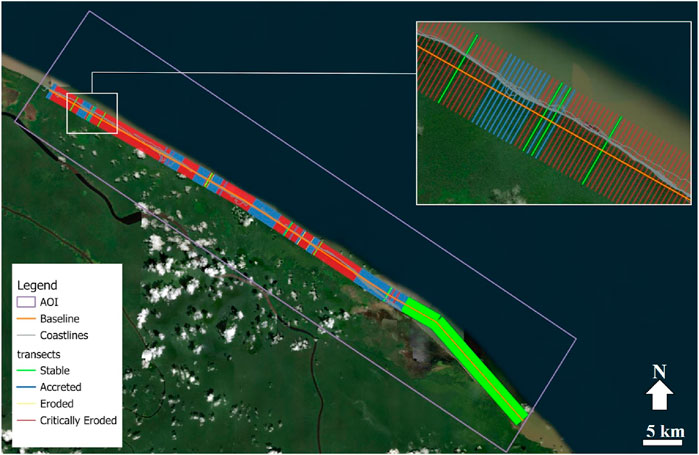
Figure 5. Shoreline Transects generated by the application of the Shoreline Analysis Tool in G-CAS at Region 1 (Barima-Waini) of Guyana (See Figure 1 for the Area of Application in Waini).
The results indicate a heterogeneous pattern of shoreline change across the study area. Certain sections exhibit significant erosion, particularly in areas marked as critically eroded, where shoreline retreat is pronounced (Figure 6a). In contrast, accreted regions demonstrate net land gain, likely due to sediment deposition processes. The stable sections suggest minimal fluctuation in shoreline position over time. The coastal stretch shows a high-variation segment. This highlights the complex spatial variability of shoreline dynamics, reinforcing the need for targeted coastal monitoring and management strategies. The spatial trends observed in Figure 5 suggest that erosion is more prominent in specific coastal sections, emphasising the necessity for coastal protection and sustainable shoreline management strategies.
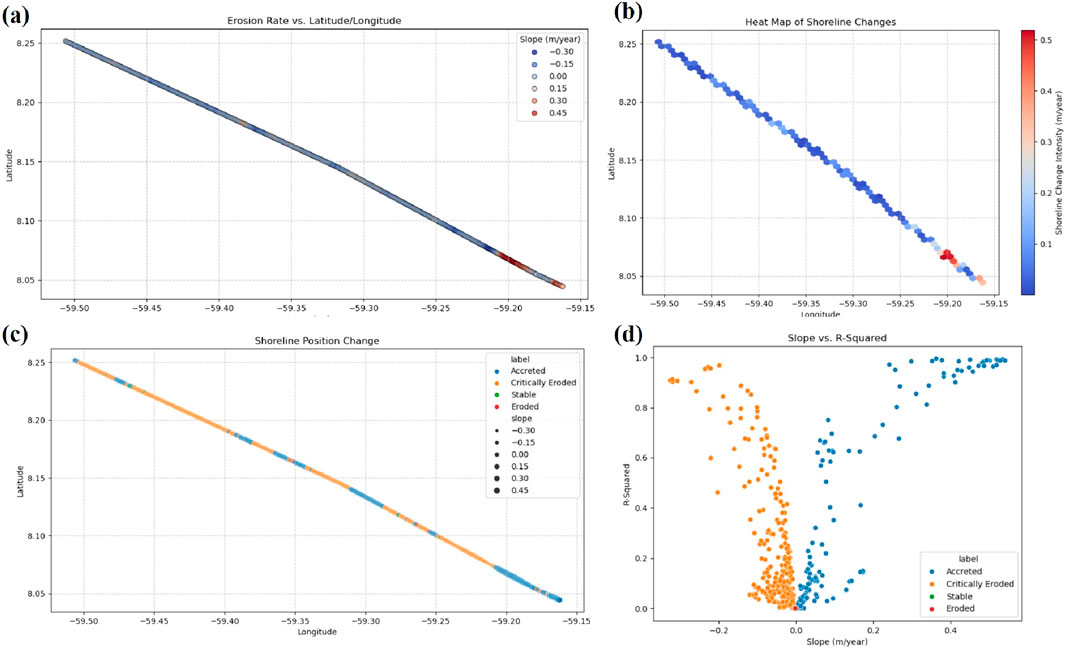
Figure 6. Sample of shoreline Transects statistics generated by the application of the Shoreline Analysis Tool in G-CAS at Region 1 (Barima-Waini) of Guyana. The generated sample statistics include: (a) The Yearly Erosion Rate (m. yr-1); the heat map of the shoreline changes at the area of application, showing the shoreline change intensity in m yr-1 (b); Shoreline Position Change (c) and the rate of slope (m. yr-1) vs. Regression Square (d).
The results of the Shoreline Analysis Module in G-CAS provide crucial insights into the dynamics of coastal change within the Area of Application. Figure 6b illustrates a heat map of shoreline changes, depicting the intensity of shoreline movement in meters per year. The observed shoreline change rate predominantly falls within 0.00–0.3 m per year, indicating relatively stable conditions across most of the coastline. However, a localised region, identified between longitude 29.20 and latitude 8.06–8.8.07, exhibits slightly higher shoreline retreat rates of 0.4–0.5 m yr-1. This spatial variation in erosion intensity underscores the heterogeneous nature of coastal processes, influenced by factors such as wave action, sediment supply, and anthropogenic activities (Parker, 2003).
Further insights into shoreline stability are provided in Figure 6c, which presents statistical analyses of shoreline position changes. The output categorises the coastline into segments that are critically eroded, stable, or experiencing erosion at varying intensities. This segmentation is crucial for coastal zone management, as it helps in identifying high-risk areas that may require intervention strategies such as beach nourishment, mangrove restoration, or engineering defences (JRC, 2020). The results demonstrate the applicability of G-CAS in supporting evidence-based decision-making for coastal conservation and infrastructure planning. The ability to quantify and visualise shoreline changes enhances the effectiveness of coastal monitoring frameworks, a key component in climate adaptation and resilience strategies (Gorelick et al., 2017).
Additionally, Figure 6d presents the Regression Square and Slope Rate statistics generated by the Shoreline Analysis module in G-CAS. These statistical outputs are instrumental in understanding long-term trends in shoreline movement. Regression analysis provides a mathematical approximation of past shoreline behaviour, which can be used to predict future changes and assess the impact of sea-level rise, storm surges, and coastal land-use practices (ESA, 2023). The slope rate further refines this understanding by indicating the rate of shoreline movement, allowing coastal managers to prioritise mitigation measures in areas of accelerated erosion or accretion.
These sample results of statistics from the Shoreline Analysis module in G-CAS highlight the importance of integrating geospatial tools such as G-CAS into coastal monitoring programs. The ability to detect shoreline variations with high precision supports sustainable coastal management, particularly for Small Island Developing States (SIDS) and low-lying coastal regions like Guyana, where coastal erosion, flooding, and land loss pose significant socio-economic and environmental challenges. By utilising advanced remote sensing and geospatial analytics, G-CAS provides an accessible and cost-effective solution for tracking coastal changes, aligning with global efforts in climate change adaptation and disaster risk reduction.
The application of the Shoreline Analysis Tool in G-CAS provides key insights into shoreline dynamics through various statistical measures which are presented in the heat map graph in Figure 7. Figure 7a, which presents the Shoreline Change Envelope (SCE), indicates that the range of shoreline movement within the area of application is between 0–200 m per year, with an isolated zone experiencing a negative change of approximately 350 m–450 m. The SCE metric is particularly useful for understanding the maximum extent of shoreline fluctuations over time, capturing both accretion and erosion trends. Similar studies have demonstrated that SCE values often correlate with seasonal sediment transport variations, tidal influences, and extreme weather events (Mondal et al., 2021). The presence of a pocket of high negative change could be indicative of localised erosion hotspots, possibly driven by storm surges, wave action, or anthropogenic influences such as coastal infrastructure development (Mitra et al., 2018).
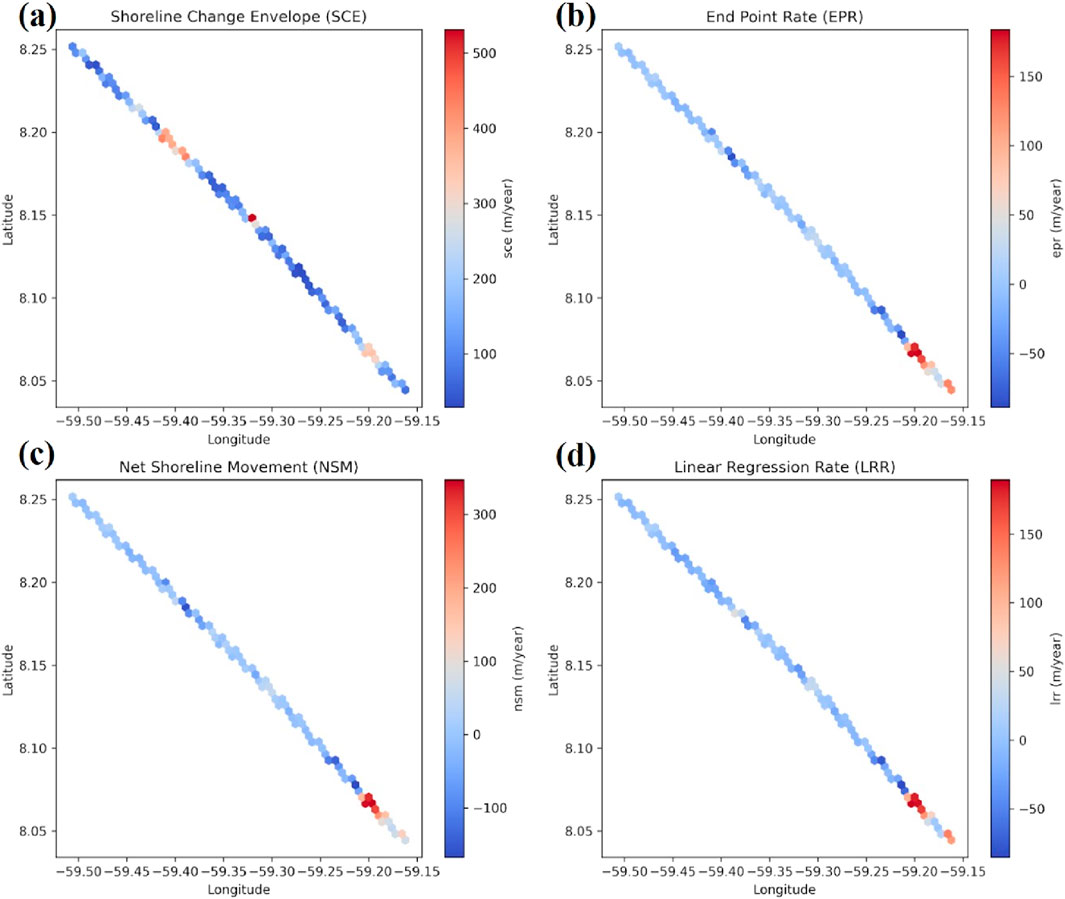
Figure 7. The visual presentations of the key shoreline statistics generated by the sampled application of the Shoreline Analysis Tool in G-CAS (a) Shoreline Change Envelope, SCE; (b) End Point Rate; (c) The Net Shoreline Movement (NSM) and (d) Linear Regression Rate (LRR).
Figure 7b presents the End Point Rate (EPR), which quantifies the annual rate of shoreline change. This metric is essential for tracking long-term shoreline trends, allowing researchers to determine whether an area is predominantly experiencing erosion or accretion. A comparison of EPR across different coastal zones can help identify areas where intervention is needed to mitigate erosion and protect coastal habitats (Luijendijk et al., 2018). Similarly, Figure 7c displays the Net Shoreline Movement (NSM), which provides a cumulative measure of shoreline displacement over time. By aggregating yearly changes, NSM helps in understanding the overall trajectory of shoreline evolution—whether it is gradually retreating inland or prograding seaward. The significance of NSM is well-documented in coastal vulnerability assessments, where it serves as a key indicator for long-term shoreline stability and flood risk management (Esteves et al., 2017). Lastly, Figure 7d presents the Linear Regression Rate (LRR), which is a statistically robust approach to estimating shoreline movement trends over time. LRR calculates a best-fit regression line through multiple shoreline positions, offering a more reliable assessment of long-term trends compared to EPR (Thieler et al., 2017). This technique is particularly beneficial in regions where shoreline change is influenced by both natural and anthropogenic processes, as it reduces the impact of short-term fluctuations and provides a clearer picture of gradual shifts. The integration of LRR with other metrics such as NSM and SCE enhances the accuracy of coastal change predictions, which is crucial for developing sustainable coastal adaptation strategies (Hapke and Henderson, 2015).
The findings from these shoreline statistics highlight the importance of continuous monitoring and data-driven decision-making in coastal management. Given the vulnerability of Guyana’s coastline to climate change and sea-level rise, tools like G-CAS provide a cost-effective and scalable approach for tracking shoreline changes and informing adaptation measures. The results align with broader studies emphasising the need for nature-based solutions, managed retreat, and hybrid engineering approaches to enhance coastal resilience (Temmerman et al., 2013). These insights reinforce the value of integrating geospatial analytics into national coastal zone management policies, ensuring evidence-based planning and sustainable resource allocation for SIDS.
4.3 Bathymetry change
The application of the Bathymetric Change Module within the Guyana Coastal Analysis System (G-CAS) provided a detailed bathymetric map of the Pomeroon-Supenaam region, offering critical insights into underwater depth variations and sediment transport dynamics. The use of satellite-derived bathymetric (SDB) techniques in G-CAS allowed for the estimation of water depths without the need for extensive field surveys, demonstrating the capability of remote sensing technologies in data-scarce environments. The resulting bathymetric gradient, ranging from shallow zones (lighter blue) to deeper areas (darker blue), provides an essential dataset for coastal zone management and hazard mitigation efforts (Figure 8). Similar applications in other Small Island Developing States (SIDS) have shown that SDB techniques can significantly enhance coastal monitoring, particularly in regions vulnerable to sea-level rise and coastal erosion (Gao, 2020). The maximum recorded depth in the area of application (AOA) is approximately 6.73 m, with deeper sections extending beyond −42.57 m (see Figure 8). These depth variations play a crucial role in understanding sediment transport processes, which influence shoreline stability, navigation safety, and ecosystem health. Changes in bathymetry often reflect erosional and depositional trends, which can be linked to tidal influences, river discharge, and anthropogenic activities (Gallop et al., 2019). The integration of bathymetric data with other coastal parameters—such as shoreline change and flood modelling—further strengthens the predictive capabilities of G-CAS, enabling more informed decision-making for coastal adaptation strategies.
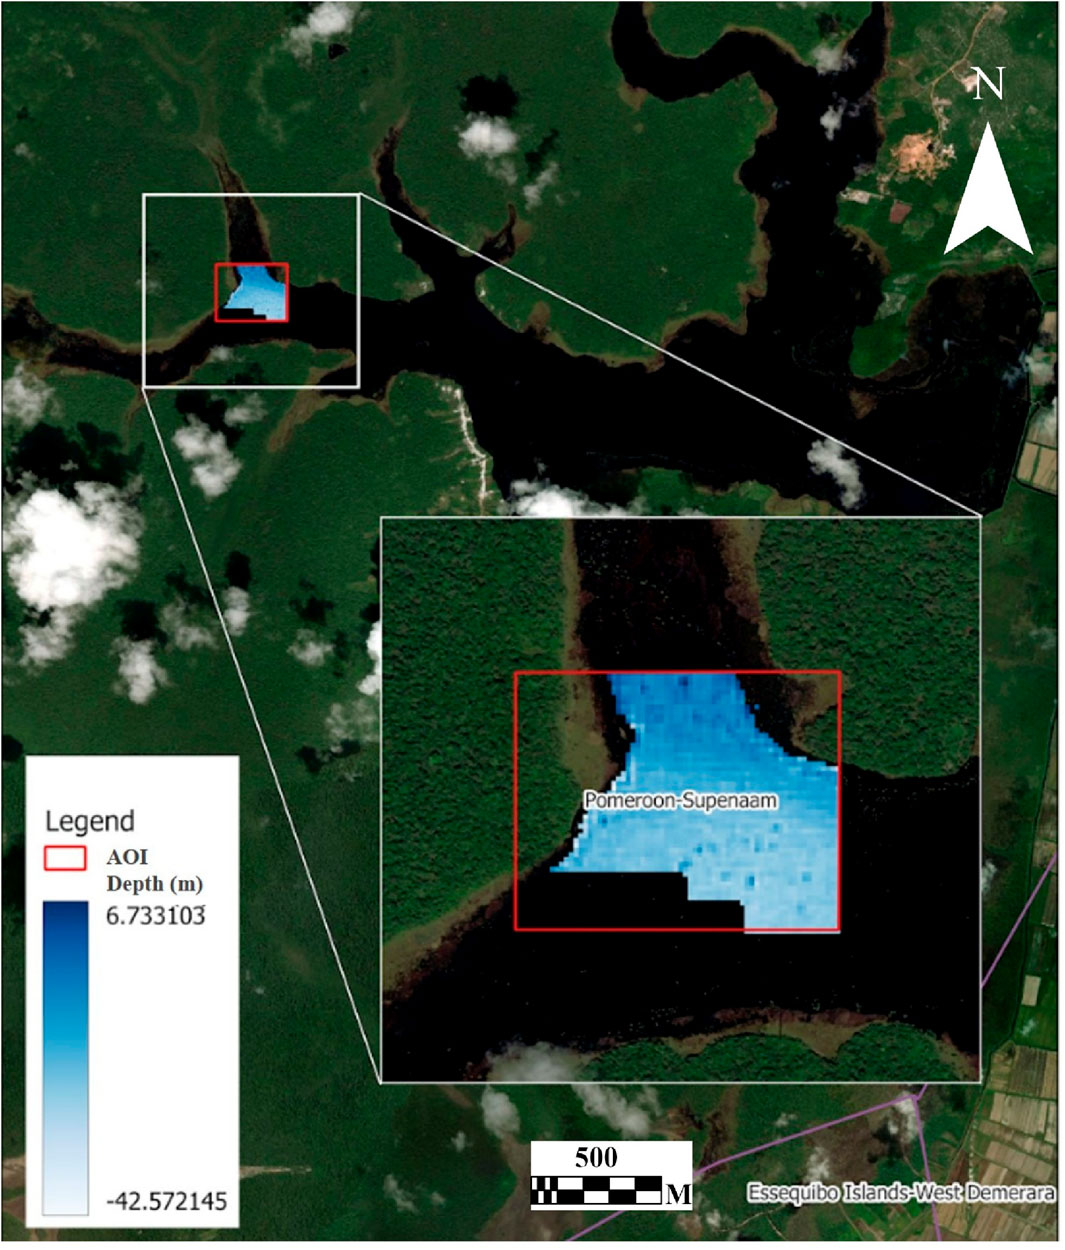
Figure 8. The example of the output of the application of Bathymetric Change module generating an underwater depth variation.
The successful implementation of G-CAS Bathymetric Change Module highlights the importance of geospatial analytics in coastal monitoring and management, especially in SIDS where traditional bathymetric surveys may be costly and logistically challenging. The insights gained from this analysis can support marine spatial planning, dredging operations, and the design of nature-based coastal defenses. Moreover, the ability of G-CAS to track bathymetric changes over time allows policymakers to assess the long-term impacts of climate change on coastal and marine ecosystems, making it a valuable tool for sustainable development initiatives (Leon et al., 2021). By demonstrating the effectiveness of SDB methodologies within G-CAS, this study provides a scalable and replicable framework that can be applied to other coastal regions facing similar challenges. The findings reinforce the potential for integrated coastal analysis systems to improve disaster risk management, support ecosystem resilience, and enhance data-driven policy formulation in SIDS and beyond. As climate change continues to alter coastal morphodynamics, the ability to rapidly assess and respond to bathymetric and shoreline changes will be critical to ensuring the sustainability of vulnerable coastal communities (Anfuso et al., 2021; Cruz-Ramírez et al., 2024; Ferrero-Martín et al., 2025).
4.4 Coastal squeeze
The Coastal Squeeze Module within the Guyana Coastal Analysis System (G-CAS) provides a critical tool for assessing wetland and estuarine compression and habitat loss along the Mahaica-Berbice coastline. The visual outputs of the Coastal Squeeze Analysis (CSA) in Figure 9 illustrate the spatial distribution of potential coastal squeeze in the area of application (AOA), highlighting varying degrees of estuarine and mangrove migration restriction. Using the Coastal Squeeze Index (CSI), the analysis categorises coastal environment compression zones into four levels: full squeeze, moderate squeeze, stable mangrove and insufficient mangrove (Figure 9, number 6). This classification provides a quantifiable measure of the extent to which the environments are constrained by anthropogenic activities and natural barriers, reinforcing the importance of integrating coastal squeeze assessments into environmental planning and management strategies (Pontee, 2021).
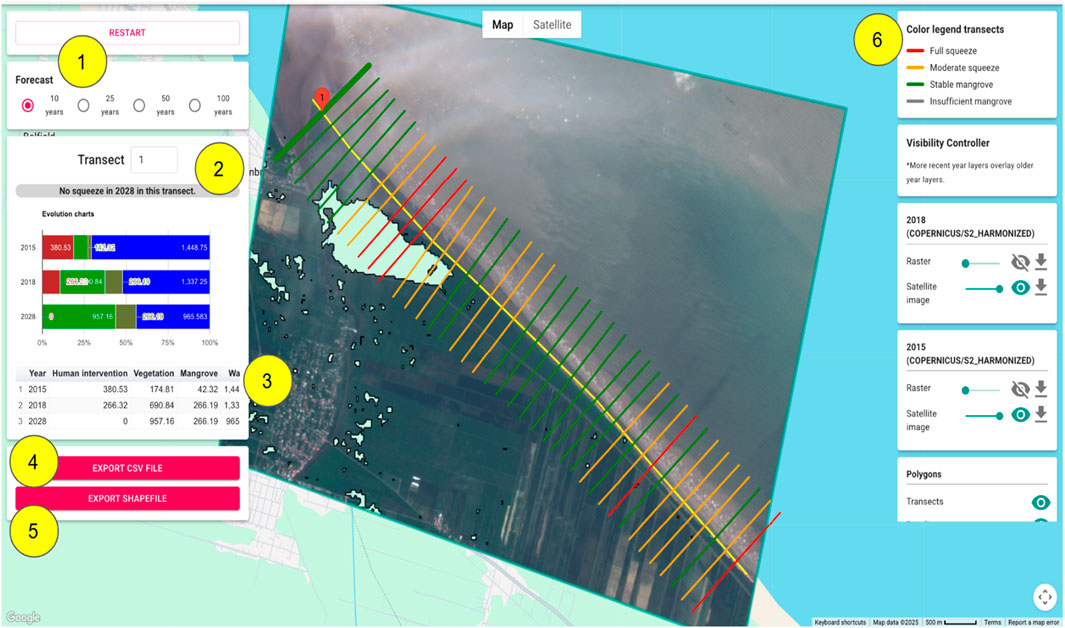
Figure 9. The example of the output of the application of the Coastal Squeeze module in G-CAS, generating different outputs of the analysis (See Figure 1 for the location of this Area of Application and the text for explanation of the numbers indicated in the figure).
The Coastal Squeeze analysis tool in the Guyana Coastal Analysis System (G-CAS) is structured to support detailed geospatial and temporal assessments through a user-friendly interface composed of several integrated components. (1) Forecast Options are accessed through the Forecast Panel, where users can select predefined time horizons—10, 25, 50, or 100 years—via radio buttons, allowing forward-looking projections of coastal change and potential squeeze scenarios. (2) Transect Details provide a localised view of projected impacts along specific coastal transects. This section includes textual outputs such as “No squeeze in 2028 in this transect,” alongside visual evolution charts that depict land cover changes over time. (3) The Data Table complements these visualisations with numerical records of land cover types—namely Human Intervention, Vegetation, Mangrove, and Water—across selected historical (e.g., 2015, 2018) and forecasted (e.g., 2028) years. (4) The Export CSV File function facilitates the extraction of this tabulated data in a format compatible with spreadsheet and statistical software, thereby supporting further offline analysis, modelling, and reporting. (5) The Export Shapefile feature allows users to download spatial vector data representing transect lines and their associated attributes, enabling seamless integration into Geographic Information Systems (GIS) for advanced spatial analysis. (6) Finally, the Colour Legend Transects supports interpretation by defining the symbology used in the Map View, categorising transect outcomes such as “Full squeeze,” “Moderate squeeze,” “Stable mangrove,” and “Insufficient mangrove.” Together, these six elements of the G-CAS interface create a comprehensive, interactive platform for evaluating and anticipating coastal squeeze phenomena, while the export functionalities extend the analytical value of the tool for use in broader environmental planning and coastal management contexts.
Exploring the findings of this sample analysis further (Figures 9, 10) reveals that full squeeze zones, marked in red, are concentrated along coastal embankments and infrastructure, where hard barriers prevent wetland retreat. These areas represent the highest risk for habitat loss, as mangrove and other wetland or estuarine systems in these locations are unable to migrate inland in response to sea-level rise, making them highly vulnerable to ecosystem degradation and biodiversity loss (Doody, 2019). This pattern is consistent with studies in other Small Island Developing States (SIDS), where coastal squeeze has been identified as a key driver of mangrove and saltmarsh decline, leading to reduced coastal resilience and increased exposure to storm surges and erosion (McKee et al., 2023). Moderate or medium squeeze zones, represented in orange, indicate regions where possible mangrove migration is constrained but not completely obstructed. These areas, although not facing immediate loss, remain susceptible to further pressure from land-use changes and climate-driven processes. Coastal regions experiencing moderate squeeze are often sites of progressive land reclamation, agricultural expansion, and infrastructure development, which gradually reduce wetland resilience (Schuerch et al., 2018). Conversely, stable mangrove areas indicate regions where the coastal environment remains resilient despite ongoing environmental changes. These areas are critical for coastal protection, as mangrove forests and salt marshes provide ecosystem services such as carbon sequestration, wave attenuation, and sediment stabilisation (Spencer et al., 2016). The preservation of these stable zones is essential for maintaining coastal ecosystem functionality and should be prioritised in national adaptation and conservation policies. Lessons from other SIDS, such as Indonesia and the Philippines, have demonstrated that proactive mangrove restoration programs can significantly enhance coastal resilience by allowing for natural shoreline adjustments and promoting biodiversity (Friess et al., 2022).
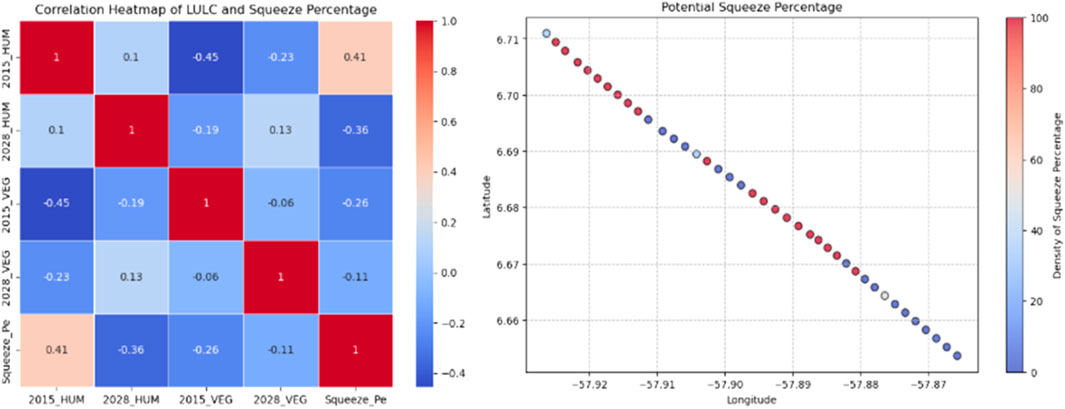
Figure 10. Correlation of the heatmap of Land use-Land Cover Squeeze percentage.
The successful application of the Coastal Squeeze Module in G-CAS reinforces the importance of geospatial tools in evaluating wetland dynamics and guiding sustainable coastal management. By providing spatially explicit insights into the impacts of coastal squeeze, G-CAS offers a scalable and replicable framework that can be applied to other SIDS facing similar threats. The ability to quantify and visualise coastal squeeze allows decision-makers to identify priority areas for intervention, design adaptive strategies, and integrate coastal resilience into policy frameworks. As climate change continues to intensify, tools like G-CAS will play an increasingly vital role in helping vulnerable coastal communities navigate the challenges of environmental change.
4.5 Flood analysis
The Flood Detection and Modelling module provides a comprehensive spatial analysis of flood-prone areas along Guyana’s coastal region. The generated flood maps highlight areas susceptible to inundation, the extent of flood impact on infrastructure, and the distribution of affected land cover types (See Figure 10 for the example of the output of the analyses in G-CAS).
Figure 11 presents an overview of flood exposure across the study area. Flood-prone areas (shaded in blue) were identified using historical flood frequency analysis and terrain characteristics. The results indicate that flooding primarily affects low-lying coastal zones, where water accumulation is recurrent. The flood extent map reveals that numerous buildings are situated within these flood-prone areas, with flooded structures highlighted in red. The inset zoomed-in section provides a detailed visualisation of a heavily impacted urban area, where a significant number of buildings are exposed to flood hazards.
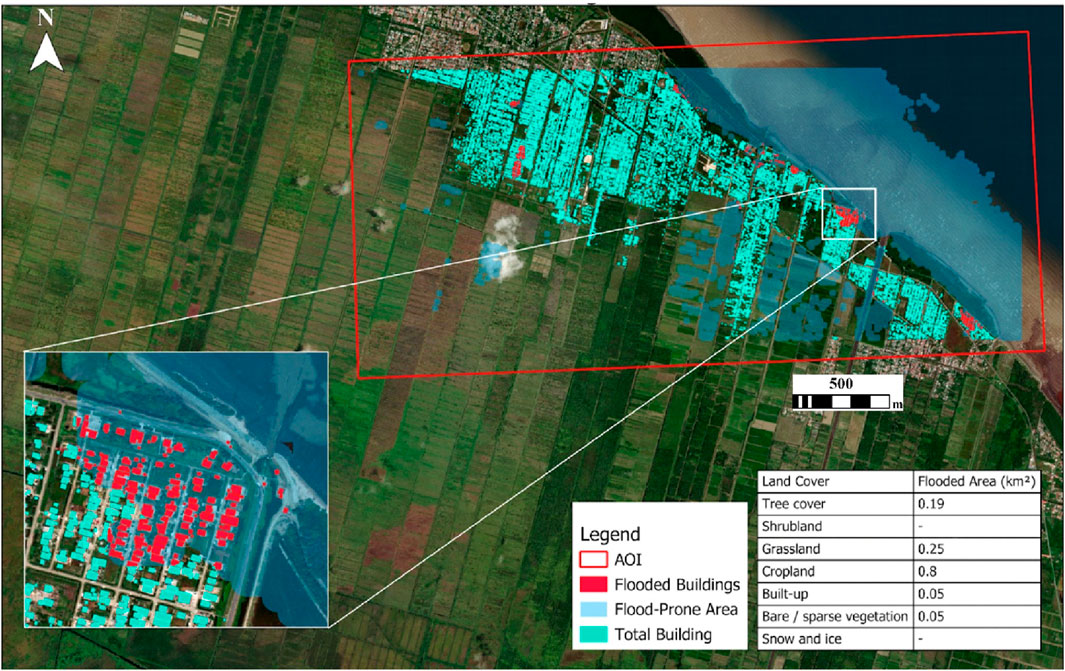
Figure 11. The example of the output of the application of the Flood Detection and Modelling tool in G-CAS generating areas of flooded areas, flooded buildings and flood-prone areas in the Mahaica area of Guyana (See Figure 1 for the location of this Area of Application).
The inset figure (Figure 11) expands on the analysis by incorporating land cover classification and quantifying the extent of inundation across different land types. The flood impact assessment shows that 0.8 km2 of cropland—the most affected land cover class—has been inundated, posing potential risks to agricultural production and food security. 0.25 km2 of grassland and 0.19 km2 of tree cover are also flooded, highlighting environmental vulnerabilities. Additionally, 0.05 km2 of built-up areas are affected, confirming the direct impact on infrastructure and human settlements.
The findings from this application show that developing a robust Coastal Analysis System tailored to the needs of Small Island Developing States (SIDS) is critical for enhancing disaster preparedness and climate resilience. In many low-lying coastal regions, flooding remains one of the most pressing environmental threats, exacerbated by climate change, land subsidence, and anthropogenic modifications (IPCC, 2023). The integration of flood detection and modelling tools within a coastal analysis framework offers a data-driven approach to identifying high-risk flood zones, assessing vulnerable infrastructure, and formulating effective adaptation strategies (Bagheri and Liu, 2024). By utilising historical flood frequency data, topographic variations, and hydrological patterns, such systems enable policymakers to prioritise risk reduction interventions, such as the implementation of nature-based solutions and the reinforcement of critical infrastructure (Hinkel et al., 2018). A GIS-based flood analysis platform, like the Guyana Coastal Analysis System (G-CAS), exemplifies the potential of such tools in providing granular, spatially explicit insights into flood exposure, making it a replicable model for other SIDS facing similar climate challenges.
A well-developed coastal analysis system serves as a decision-support mechanism for integrating disaster risk reduction strategies into national and regional planning frameworks. In SIDS, where economic activities are often concentrated along coastlines, the ability to map and quantify flood impact across different land-use categories is essential for balancing urban development, agricultural sustainability, and ecosystem conservation (Kirezci et al., 2020). Advanced flood modelling tools facilitate targeted policy interventions, such as enforcing zoning regulations, optimising early warning systems, and guiding sustainable land-use practices to mitigate flood-related disruptions. Furthermore, by integrating remote sensing and geospatial analytics, coastal analysis systems like G-CAS can enhance near real-time flood monitoring capabilities, contributing to more proactive climate adaptation measures (Muis et al., 2022). Given the increasing frequency and severity of coastal hazards, investing in such data-driven coastal management solutions is imperative for ensuring long-term resilience in SIDS and other climate-vulnerable coastal regions.
4.6 Comparison of G-CAS with other systems
The Guyana Coastal Analysis System (G-CAS) represents a significant advancement in coastal monitoring tools, particularly for Small Island Developing States (SIDS) and low-lying coastal nations, and this is tailored to focus on Guyana. While platforms such as CASSIE, DSAS, and CoastSat offer valuable analytical capabilities at a global scale, G-CAS distinguishes itself through its tailored integration for national decision-making in the Global South, with particular emphasis on Guyana’s coastal challenges (Table 2). Unlike DSAS, which focuses primarily on historical shoreline change detection, or CoastSat, which relies on optical imagery limited by cloud cover, G-CAS utilises a multi-sensor fusion approach (including SAR and Landsat) to enhance spatial and temporal coverage. Furthermore, G-CAS provides a user-friendly, web-based interface that simplifies access to high-resolution visualisations, time-series coastal dynamics, and flood exposure mapping at the regional and village levels—features not fully available in existing systems. Its modular design supports custom integration of hydrological data, offering a flexible and extensible platform that responds to local adaptation needs. These functionalities position G-CAS, based on CASSIE, as an innovative tool optimised for national-scale coastal adaptation planning and community-level resilience building in data-sparse environments.
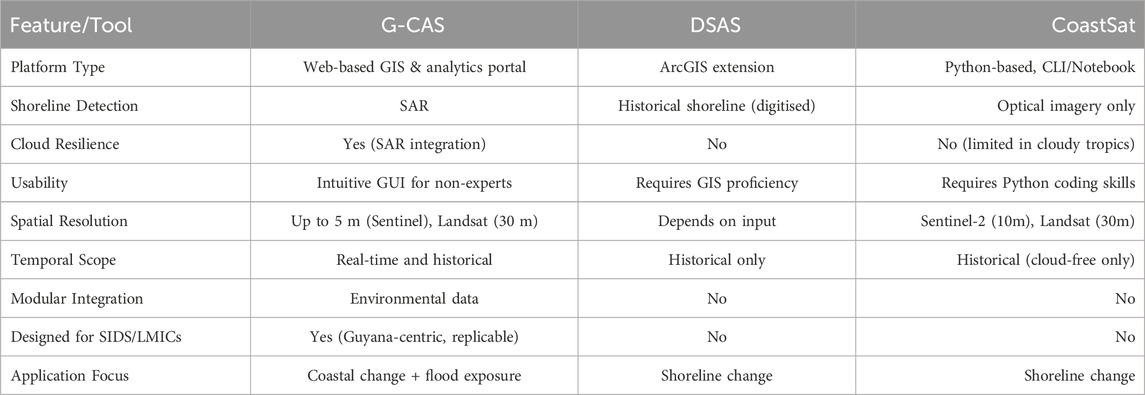
Table 2. Comparison of G-CAS with other existing systems.
4.7 Validation and accuracy assessment
To assess the reliability of the outputs generated by G-CAS, we conducted preliminary validation exercises across its core modules: shoreline detection, bathymetry estimation, and flood modelling. For shoreline detection, automated outputs derived from Sentinel-2 imagery (Table 1) were compared against manually digitised shorelines from high-resolution satellite images and historical aerial photographs for the years 2016 and 2020. The mean positional offset was ±12 m, with a root mean square error (RMSE) of 9.8 m, indicating acceptable accuracy for regional-scale coastal monitoring. In the bathymetry estimation module, direct validation was limited by the lack of recent in situ bathymetric surveys along much of Guyana’s coastline. However, comparisons with historical nautical charts showed consistent depth gradients up to 15 m, providing confidence in the relative accuracy of shallow water estimations. For the flood modelling module, outputs were compared with observed flood events documented in official reports from the Guyana Civil Defence Commission (CDC) and United Nations Office for the Coordination of Humanitarian Affairs (UN OCHA) for the period 2015–2021. In priority pilot areas such as the Mahaica-Mahaicony-Abary region, modelled flood extents aligned with reported flood zones with an overall spatial accuracy of approximately 84%. While these validation efforts are encouraging, we acknowledge the need for more rigorous field-based calibration and ground truthing. Future enhancements to G-CAS will include targeted UAV surveys, integration of community-reported geospatial data, and collaboration with national agencies to strengthen validation capacity.
5 Conclusion
The development and implementation of the Guyana Coastal Analysis System (G-CAS) represent a significant advancement in coastal monitoring and management for climate-vulnerable regions such as Small Island Developing States (SIDS). By integrating remote sensing, machine learning, and cloud-based geospatial analysis, G-CAS provides a scalable and replicable framework for understanding shoreline dynamics, coastland compression, bathymetric changes, and flood risks. The results demonstrate how data-driven coastal management can support early warning systems, policy interventions, and adaptive strategies to mitigate climate change impacts on coastal infrastructure, ecosystems, and human settlements.
The successful application of G-CAS in Guyana highlights the potential for geospatial innovations to enhance climate resilience and disaster preparedness in Guyana and similar SIDS. Future enhancements could incorporate real-time climate modelling, socio-economic vulnerability assessments, and AI-driven predictive analytics to further improve the system’s capabilities. As coastal hazards intensify, the adoption of integrated coastal analysis tools like G-CAS will be essential for safeguarding coastal communities, preserving natural ecosystems, and guiding sustainable development. This study reinforces the critical role of advanced geospatial technologies in shaping evidence-based coastal governance and adaptation strategies in the face of accelerating climate change.
Data availability statement
The original contributions presented in the study are included in the article, further inquiries can be directed to the corresponding author.
Author contributions
TO: Methodology, Visualization, Data curation, Software, Conceptualization, Investigation, Resources, Writing – review and editing, Formal Analysis, Writing – original draft, Project administration, Funding acquisition, Supervision, Validation. AP: Investigation, Visualization, Software, Validation, Supervision, Data curation, Writing – review and editing, Formal Analysis, Methodology, Writing – original draft. KT: Software, Investigation, Writing – review and editing, Supervision. MW: Writing – original draft, Data curation, Software, Visualization, Validation. WS: Software, Visualization, Data curation, Writing – original draft, Validation, Methodology. AN: Writing – review and editing. EH: Writing – review and editing, Visualization, Supervision, Methodology. GN: Methodology, Visualization, Validation, Writing – review and editing. HB: Writing – review and editing.
Funding
The author(s) declare that financial support was received for the research and/or publication of this article. TDTO also appreciate the Association of Commonwealth Universities (ACU) Engineering (Wighton) Fellowship for the support that started this work.
Acknowledgments
The authors acknowledge the support provided by the PEGASuS (Program for Early-stage Grants Advancing Sustainability Science (PEGASuS)) 5:1 “Take it Further Grant” towards the Development of the Guyana Coastal Analysis System (G-CAS). PEGASuS is funded by the Gordon and Betty Moore Foundation’s Science Program and administered by Future Earth.
Conflict of interest
The authors declare that the research was conducted in the absence of any commercial or financial relationships that could be construed as a potential conflict of interest.
Generative AI statement
The author(s) declare that no Generative AI was used in the creation of this manuscript.
Publisher’s note
All claims expressed in this article are solely those of the authors and do not necessarily represent those of their affiliated organizations, or those of the publisher, the editors and the reviewers. Any product that may be evaluated in this article, or claim that may be made by its manufacturer, is not guaranteed or endorsed by the publisher.
References
Abd-Elhamid, H. F., Zeleňáková, M., Barańczuk, J., Gergelova, M. B., and Mahdy, M. (2023). Historical trend analysis and forecasting of shoreline change at the Nile Delta using RS data and GIS with the DSAS tool. Remote Sens. 15 (7), 1737. doi:10.3390/rs15071737
Akash, S. H., Sarkar, S. K., Bindajam, A. A., Kumari, R., Talukdar, S., and Mallick, J. (2024). Assessment of coastal vulnerability using integrated fuzzy analytical hierarchy process and geospatial technology for effective coastal management. Environ. Sci. Pollut. Res. 31 (41), 53749–53766. doi:10.1007/s11356-023-28317-y
Aktürk, G., and Hauser, S. J. (2024). Integrated understanding of climate change and disaster risk for building resilience of cultural heritage sites. Nat. Hazards, 1–26.
Almeida, L. P., de Oliveira, I. E., Lyra, R., Dazzi, R. L. S., Martins, V. G., and da Fontoura Klein, A. H. (2021). Coastal analyst system from space imagery engine (CASSIE): shoreline management module. Environ. Model. and Softw. 140, 105033. doi:10.1016/j.envsoft.2021.105033
Anfuso, G., Postacchini, M., Di Luccio, D., and Benassai, G. (2021). Coastal sensitivity/vulnerability characterization and adaptation strategies: a review. J. Mar. Sci. Eng. 9 (1), 72. doi:10.3390/jmse9010072
Anthony, J. E., Gardel, A., Gratiot, N., Proisy, C., Allison, M. A., Dolique, F., et al. (2010). The Amazon-influenced muddy coast of South America: a review of mud-bank–shoreline interactions. Earth-Science Rev. 103, 99–121. doi:10.1016/j.earscirev.2010.09.008
Anthony, E. J., Brondizio, E. S., dos Santos, V. F., Gardel, A., and Besset, M. (2021). Sustainable management, conservation, and restoration of the Amazon River Delta and Amazon-influenced guianas coast: a review. Water 13 (10), 1371. doi:10.3390/w13101371
Asariotis, R. (2020). “Climate change impacts and adaptation for coastal transportation infrastructure: a sustainable development challenge for SIDS in the Caribbean and beyond,” in Coastal and marine environments (Boca Raton, FL: CRC Press), 253–264.
Bagheri, A., and Liu, G. J. (2024). Climate change and urban flooding: assessing remote sensing data and flood modeling techniques: a comprehensive review. Environ. Rev. 33, 1–14. doi:10.1139/er-2024-0065
Bassett, T. E., and Scruggs, G. R. (2013). Water, water everywhere: sea level rise and land use planning in Barbados, Trinidad and Tobago, Guyana, and Pará. Massachusetts, United States: Lincoln Institute of Land Policy.
Best, Ü. S., van der Wegen, M., Dijkstra, J., Reyns, J., van Prooijen, B. C., and Roelvink, D. (2022). Wave attenuation potential, sediment properties and mangrove growth dynamics data over Guyana’s intertidal mudflats: assessing the potential of mangrove restoration works. Earth Syst. Sci. Data Discuss. 2022, 2445–2462. doi:10.5194/essd-14-2445-2022
Bovell, O. (2019). “Setting the foundations for zero net loss of the mangroves that underpin human wellbeing in the north Brazil shelf LME: review of the effectiveness of existing coastal restoration efforts in Guyana,” in Conservation international and the national agricultural research and extension institute.
Briguglio, L. (1995). Small island developing states and their economic vulnerabilities. World Dev. 23 (9), 1615–1632. doi:10.1016/0305-750x(95)00065-k
Bush, M. J. (2018). Climate change adaptation in small island developing states. John wiley and sons.
Chen, C., Zhang, C., Tian, B., Wu, W., and Zhou, Y. (2023). Mapping intertidal topographic changes in a highly turbid astuary using dense Sentinel-2 time series with deep learning. ISPRS J. Photogrammetry Remote Sens. 205, 1–16. doi:10.1016/j.isprsjprs.2023.09.022
Ciecholewski, M. (2024). Review of segmentation methods for coastline detection in SAR images. Archives Comput. Methods Eng. 31 (2), 839–869. doi:10.1007/s11831-023-10000-7
Cordeiro, M. C., Martinez, J. M., and Peña-Luque, S. (2021). Automatic water detection from multidimensional hierarchical clustering for Sentinel-2 images and a comparison with Level 2A processors. Remote Sens. Environ. 253, 112209. doi:10.1016/j.rse.2020.112209
Cruz-Ramírez, C. J., Chávez, V., Silva, R., Muñoz-Perez, J. J., and Rivera-Arriaga, E. (2024). Coastal management: a review of key elements for vulnerability assessment. J. Mar. Sci. Eng. 12 (3), 386. doi:10.3390/jmse12030386
Curoy, J., Ward, R. D., Barlow, J., Moses, C., and Nakhapakorn, K. (2022). Coastal dynamism in Southern Thailand: an application of the CoastSat toolkit. Plos one 17 (8), e0272977. doi:10.1371/journal.pone.0272977
Davidson, M. A., Lewis, R. P., and Turner, I. L. (2010). Forecasting seasonal to multi-year shoreline change. Coast. Eng. 57 (6), 620–629. doi:10.1016/j.coastaleng.2010.02.001
de Lima, L. T., Fernández-Fernández, S., Weiss, C. V. C., Bitencourt, V., and Bernardes, C. (2021). Free and open-source software for geographic enformation system on coastal management: a study case of sea-level rise in southern Brazil. Regional Stud. Mar. Sci. 48, 102025. doi:10.1016/j.rsma.2021.102025
Doody, J. P. (2019). Coastal squeeze and managed realignment in Southeast England: does it work? Ocean & Coast. Manag. 177, 133–145.
Elkafrawy, S. B., Basheer, M. A., Mohamed, H. M., and Naguib, D. M. (2020). Applications of remote sensing and GIS techniques to evaluate the effectiveness of coastal structures along Burullus headland-eastern nile Delta, Egypt. Egypt. J. Remote Sens. Space Sci. 24, 247–254. doi:10.1016/j.ejrs.2020.01.002
Esteves, L. S., Williams, J. J., and Toldo, E. E. (2017). Dynamic coastal management: lessons from the past and directions for the future. Ocean & Coast. Manag. 142, 30–38.
European Space Agency (ESA) (2023). Sentinel-2 mission overview. Available online at: https://www.esa.int.
Ferrero-Martín, C., Izquierdo, A., Bethencourt, M., and Fernández-Montblanc, T. (2025). A risk assessment of underwater cultural heritage for wave-induced hazards: the impact of climate change on Cadiz Bay. J. Mar. Sci. Eng. 13 (1), 136. doi:10.3390/jmse13010136
Friess, D. A., Rogers, K., Lovelock, C. E., and Krauss, K. W. (2022). The role of mangrove conservation in climate resilience for small island nations. Nat. Clim. Change 12 (3), 287–294.
Gallop, S. L., Bosserelle, C., Pattiaratchi, C., and Eliot, I. (2019). Understanding sediment transport mechanisms in dynamic coastal environments. Mar. Geol. 412, 45–58.
Gao, J. (2020). Advances in satellite-derived bathymetry for coastal applications. Remote Sens. Environ. 240, 111690.
Gens, R. (2010). Remote sensing of coastlines: detection, extraction and monitoring. Int. J. Remote Sens. 31 (7), 1819–1836. doi:10.1080/01431160902926673
Gheuens, J., Nagabhatla, N., and Perera, E. D. P. (2019). Disaster-risk, water security challenges and strategies in small island developing states (SIDS). Water 11 (4), 637. doi:10.3390/w11040637
Government of Guyana. (2012). Guyana’s second national communication to the United Nations Framework Convention on Climate Change. 186. Available at online: https://unfccc.int/resource/docs/natc/guync2.pdf
Gillies, R. R., Box, J. E., and Morgan, J. A. (2003). Impervious surface mapping using aerial photography and satellite data. Photogrammetric Eng. & Remote Sens. 69 (9), 1009–1017.
González, V. C., and Gonzalez, C. C. (2020). Vulnerability to climate change: a case study of environmental migration in the Caribbean islands.
Gorelick, N., Hancher, M., Dixon, M., Ilyushchenko, S., Thau, D., and Moore, R. (2017). Google Earth mngine: hlanetary-scale geospatial analysis for everyone. Remote Sens. Environ. 202, 18–27. doi:10.1016/j.rse.2017.06.031
Government of Guyana (2012). Guyana’s second national communication to the U. N. Framew. Convention Clim. Change, 186.
Hapke, C. J., and Henderson, R. E. (2015). Quantifying the magnitude and variability of long-term coastal change. Geomorphology 228, 23–40.
Hay, J. E. (2013). Small island developing states: coastal systems, global change and sustainability. Sustain. Sci. 8, 309–326. doi:10.1007/s11625-013-0214-8
Hernández-Delgado, E. A. (2024). Coastal restoration challenges and strategies for small dsland developing states in the face of sea level rise and climate change. Coasts 4 (2), 235–286. doi:10.3390/coasts4020014
Hickey, C., and Weis, T. (2012). The challenge of climate change adaptation in Guyana. Clim. Dev. 4 (1), 66–74. doi:10.1080/17565529.2012.661036
Himmelstoss, E. A., Henderson, R. E., Kratzmann, M. G., and Farris, A. S. (2021). Digital shoreline analysis system (DSAS) version 5.1 user guide. U. S. Geol. Surv.–1091.
Hinkel, J., Aerts, J. C., Brown, S., Jiménez, J. A., Lincke, D., Nicholls, R. J., et al. (2018). The ability of societies to adapt to twenty-first-century sea-level rise. Nat. Clim. Change 8 (7), 570–578. doi:10.1038/s41558-018-0176-z
IPCC. (2021). Climate change 2021: the physical science basis. Contribution of working proup I to the Sixth assessment ieport of the sntergovernmental sanel on climate change.
IPCC (2023). Climate change 2023: synthesis report. Geneva, Switzerland: Intergovernmental Panel on Climate Change.
Johnson-Bhola, L. (2020). Effects of rural land tenure system on mangrove management in sorentyne, Guyana. Land Use Change Sustain. 33.
Joint Research Centre (JRC) (2020). Flood Risk Mapping: technical Guidelines. Luxemburg: European Commission.
Khan, M. (2001). National climate change adaptation policy and implementation plan for Guyana: Climate change issues, adaptation planning and management mechanisms. Caribb. Plan. Adapt. Glob. Clim. Change. CPACC Compon. 4.
Kirezci, E., Young, I. R., Ranasinghe, R., Muis, S., Nicholls, R. J., Lincke, D., et al. (2020). Projections of global-scale extreme sea levels and resulting episodic coastal flooding over the 21st century. Sci. Rep. 10 (1), 11629. doi:10.1038/s41598-020-67736-6
Kirton, C., and Lewis, P. (2015). Guyana country case study. Migr. Dev. Perspect. Small States 5 (4), 92.
Klein, A., Almeida, L., Gonçalves, R., Unas, P., Bughi, C., and Tallmann, J. (2023). “Coastal analyst system from space imagery engine (Cassie-Core): a cloud-based toolset for geoscientists,” in Coastal Sediments 2023: the Proceedings of the Coastal Sediments 2023, 1584–1596.
Kum, S. (2022). Towards the development of an integrated National Ocean Policy framework for Guyana. Japan: United Nations – The Nippon Foundation of Japan Fellowship Programme.
Leal Filho, W., Krishnapillai, M., Sidsaph, H., Nagy, G. J., Luetz, J. M., Dyer, J., et al. (2021). Climate change adaptation on small island states: an assessment of limits and constraints. J. Mar. Sci. Eng. 9 (6), 602. doi:10.3390/jmse9060602
Leatherman, S. P., Kearney, M. S., and Clow, B. (1983). Assessment of coastal responses to projected sea level rise: galveston Island and Bay.
Leon, J. X., Phinn, S. R., Hamylton, S. M., and Saunders, M. I. (2021). The role of remote sensing in monitoring coastal bathymetry change in response to climate-driven processes. Coast. Eng. 168, 103927.
Li, J., Knapp, D. E., Lyons, M., Roelfsema, C., Phinn, S., Schill, S. R., et al. (2021). Automated global shallow water bathymetry mapping using google earth engine. Remote Sens. 13 (8), 1469. doi:10.3390/rs13081469
Luijendijk, A., Hagenaars, G., Ranasinghe, R., Baart, F., Donchyts, G., and Aarninkhof, S. (2018). The global shoreline change dataset: a consistent dataset for the detection of shoreline change across all coastal regions. Sci. Rep. 8, 6641. doi:10.1038/s41598-018-24630-6
Mahmoud, A. S., Mohamed, S. A., Helmy, A. K., and Nasr, A. H. (2025). BDCN_UNet: advanced shoreline extraction techniques integrating deep learning. Earth Sci. Inf. 18 (2), 187–12. doi:10.1007/s12145-024-01693-w
Mahmoud Shaaban Mabrouk, M., Mohamed Wafaie Abdel-Salam, E., and Serwa, A. (2022). Geomorphological hazard analysis using DEM along the eastern coast between marsa alam and ras gharib, Egypt. Eng. Res. J. 174, 1–21. doi:10.21608/erj.2022.240856
Marzouk, M., Attia, K., and Azab, S. (2021). Assessment of coastal vulnerability to climate change impacts using GIS and remote sensing: a case study of Al-Alamein New City. J. Clean. Prod. 290, 125723. doi:10.1016/j.jclepro.2020.125723
Maximus, J. K. (2025). Assessing watershed vulnerability to erosion and sedimentation: integrating DEM and LULC data in Guyana's diverse landscapes. HydroResearch 8, 178–193. doi:10.1016/j.hydres.2024.11.002
McKee, K. L., Saintilan, N., Smoak, J. M., and Holmquist, J. R. (2023). Wetland resilience to sea-level rise and coastal squeeze: implications for SIDS. Estuaries Coasts 46, 312–329.
McLaughlin, S., and Cooper, J. A. G. (2010). A multi-scale coastal vulnerability index: a tool for coastal managers? Environ. Hazards 9 (3), 233–248. doi:10.3763/ehaz.2010.0052
Mitra, D., Banerjee, K., and Sengupta, D. (2018). Shoreline change prediction using geospatial techniques along the Indian coastal regions. J. Coast. Res. 34 (5), 1145–1156.
Mondal, A., Kumar, P., Ghosh, S., and Mallick, J. (2021). Spatiotemporal shoreline change analysis and future prediction using machine learning models. Environ. Earth Sci. 80 (12), 415.
Montaño, J., Coco, G., Antolínez, J. A. A., Beuzen, T., Bryan, K. R., Cagigal, L., et al. (2020). Blind testing of shoreline evolution models. Sci. Rep. 10, 2137. doi:10.1038/s41598-020-59018-y
Muis, S., Verlaan, M., Nicholls, R. J., Brown, S., Hinkel, J., Lincke, D., et al. (2022). A high-resolution global dataset of extreme sea levels, tides, and storm surges. Nat. Commun. 13 (1), 2498.
Nagy, G. J., Gutiérrez, O., Brugnoli, E., Verocai, J. E., Gómez-Erache, M., Villamizar, A., et al. (2019). Climate vulnerability, impacts and adaptation in Central and South America coastal areas. Regional Stud. Mar. Sci. 29, 100683. doi:10.1016/j.rsma.2019.100683
NAREI (2015). Mangrove restoration and management department: annual report. Mon Repos, Guyana: National Agriculture Research and Extension Institute.
Nedd, G. A., Oyedotun, T. D. T., and Simard, M. (2023). Evaluation of spatio-temporal dynamics of Guyana’s mangroves using SAR and GEE. Earth Syst. Environ. 7 (2), 509–524. doi:10.1007/s41748-021-00277-8
Nicolodi, J. L., Asmus, M. L., Polette, M., Turra, A., Seifert, C. A., Stori, F. T., et al. (2021). Critical gaps in the implementation of coastal ecological and economic zoning persist after 30 years of the Brazilian coastal management policy. Mar. Policy 128, 104470. doi:10.1016/j.marpol.2021.104470
Nurse, L. A., McLean, R. F., Agard, J., Briguglio, L. P., Duvat-Magnan, V., and Webb, A. (2014). “Small islands,” in Climate change 2014: impacts, adaptation, and vulnerability. Part B: regional aspects. Contribution of Working Group II to the fifth assessment report of the. Cambridge, United Kingdom: Intergovernmental Panel on Climate Change, 1613.
Office of Climate Change (2016). Technology needs assessment: adaptation. Final report. Identif. prioritisation Adapt. Technol. Guyana. Office Clim. Change.
Oyedotun, T. D. (2014). Shoreline geometry: DSAS as a tool for historical trend analysis. Geomorphol. Tech. 3 (2.2), 1–12.
Oyedotun, T. D. T., and Burningham, H. (2021). The need for data integration to address the challenges of climate change on the Guyana coast. Geogr. Sustain. 2 (4), 288–297. doi:10.1016/j.geosus.2021.11.003
Oyedotun, T. D. T., and Johnson-Bhola, L. (2019). Shoreline change identification and analysis along the coast of Guyana, South America. Interdiscip. Environ. Rev. 20 (1), 7–31. doi:10.1504/ier.2019.098348
Oyedotun, T. D. T., and Nedd, G. A. (2023). River mouth morphodynamics and deflection over the short term: effects on spit growth and mangrove dynamics. Front. Environ. Sci. 11, 1181627. doi:10.3389/fenvs.2023.1181627
Oyedotun, T. D. T., Moonsammy, S., Renn-Moonsammy, J., Renn-Moonsammy, D. M., Nedd, G. A., Bishop, J., et al. (2022). Data consolidation for coastal management: the development of the Guyana coastal database platform. Interdiscip. Environ. Rev. 22 (2), 1–162. doi:10.1504/ier.2022.10047466
Oyedotun, T. D. T., Hamer, E., Nedd, A. G., and Burningham, H. (2024). “Advancing coastal monitoring: integrating spatiotemporal analyses and machine algorithms in G-CAS,” in Coastlines under Global Change: proceedings from the International Coastal Symposium (ICS) 2024 (Doha, Qatar). Editors M. R. Phillips, S. Al-Naemi, and C. M. Duarte (Charlotte (North Carolina)), 315–320. doi:10.2112/JCR-SI113-062.1
Palanisamy, P., Sivakumar, V., Velusamy, P., and Natarajan, L. (2024). Spatio-temporal analysis of shoreline changes and future forecast using remote sensing, GIS and Kalman filter model: a case study of Rio de Janeiro, Brazil. J. S. Am. Earth Sci. 133, 104701. doi:10.1016/j.jsames.2023.104701
Pardo-Pascual, J. E., Sánchez-García, E., Almonacid-Caballer, J., Palomar-Vázquez, J. M., de los Santos, E. P., Fernández-Sarría, A., et al. (2018). Assessing the accuracy of automatically extracted shorelines on microtidal beaches from landsat 7, landsat 8 and Sentinel-2 imagery. Remote Sens. 10, 326. doi:10.3390/rs10020326
Parker, B. B. (2003). Theories of shoreline change and their implications. J. Coast. Res. 19 (4), 791–795.
Pekel, J. F., Cottam, A., Gorelick, N., and Belward, A. S. (2016). High-resolution mapping of global surface water and its long-term changes. Nature 540 (7633), 418–422. doi:10.1038/nature20584
Pelling, M. (1999). The political ecology of flood hazard in urban Guyana. Geoforum 30 (3), 249–261. doi:10.1016/s0016-7185(99)00015-9
Pelling, M. (2003). “Vulnerability, urbanisation and environmental hazard in coastal Guyana,” in Resources, planning and environmental management in a changing Caribbean, 133–172.
Phongsapan, K., Chishtie, F., Poortinga, A., Bhandari, B., Meechaiya, C., Kunlamai, T., et al. (2019). Operational flood risk index mapping for disaster risk reduction using earth observations and cloud computing technologies: a case study on Myanmar. Front. Environ. Sci. 7, 191. doi:10.3389/fenvs.2019.00191
Pilkey, O. H. (2011). The world's beaches: a global guide to the science of the shoreline. California, United States: Univ of California Press.
Pontee, N., Ellingwood, B., and Mahmoud, H. (2021). Vulnerability of seaports to hurricanes and sea level rise in a changing climate: a case study for mobile, AL. Coast. Eng. 167, 103884. doi:10.1016/j.coastaleng.2021.103884
Pucino, N., Kennedy, D. M., Young, M., and Ierodiaconou, D. (2022). Assessing the accuracy of Sentinel-2 instantaneous subpixel shorelines using synchronous UAV ground truth surveys. Remote Sens. Environ. 282, 113293. doi:10.1016/j.rse.2022.113293
Ram, M., Sheaves, M., and Waltham, N. J. (2024). Tracking the long-term vegetation and soil characteristics of restored mangroves: a case study from Guyana's coast. Restor. Ecol. 32, e14170. doi:10.1111/rec.14170
Ramieri, E., Hartley, A., Barbanti, A., Santos, F. D., Gomes, A., Hilden, M., et al. (2011). Methods for assessing coastal vulnerability to climate change. ETC CCA Tech. Pap. 1, 1–93.
Rangel-Buitrago, N., Neal, W. J., Bonetti, J., Anfuso, G., and de Jonge, V. N. (2020). Vulnerability assessments as a tool for the coastal and marine hazards management: an overview. Ocean & Coast. Manag. 189, 105134. doi:10.1016/j.ocecoaman.2020.105134
Redclift, M. R., Manuel-Navarette, D., and Pelling, M. (2011). “Climate change and human security: the challenge to local governance under rapid coastal urbanisation,” in Climate change and human security. Cheltenham, United Kingdom: Edward Elgar Publishing.
Savastano, S., Gomes da Silva, P., Sánchez, J. M., Tort, A. G., Payo, A., Pattle, M. E., et al. (2024). Assessment of shoreline change from SAR satellite imagery in three tidally controlled coastal environments. J. Mar. Sci. Eng. 12 (1), 163. doi:10.3390/jmse12010163
Schuerch, M., Spencer, T., Temmerman, S., Kirwan, M. L., Wolff, C., Lincke, D., et al. (2018). Future response of global coastal wetlands to sea-level rise. Nature 561 (7722), 231–234. doi:10.1038/s41586-018-0476-5
Serwa, A. (2020a). Potentiality of using digital wavelet/qmf pyramids in remotely sensed satellites’ images classification. Geodesy Cartogr. 46 (4), 163–169. doi:10.3846/gac.2020.11415
Serwa, A. (2020b). Studying the potentiality of using digital gaussian Pyramids in multi-spectral satellites images classification. J. Indian Soc. Remote Sens. 48 (12), 1651–1660. doi:10.1007/s12524-020-01173-w
Serwa, A. (2022). Development of a soft computational simulator for optimised deep artificial neural networks for geomatics applications: remote sensing classification as an application. Geodesy Cartogr. 48 (4), 224–232. doi:10.3846/gac.2022.15642
Sheremet, A., and Stone, G. W. (2003). Observations of nearshore wave dissipation over muddy sea beds. J. Geophys. Res. Oceans 108 (C11), 2003JC001885–11. doi:10.1029/2003jc001885
Singhroy, V. (1996). Interpretation of SAR images for coastal zone mapping in Guyana. Can. J. Remote Sens. 22 (3), 317–328. doi:10.1080/07038992.1996.10855187
Sirko, W., Kashubin, S., Ritter, M., Annkah, A., Bouchareb, Y. S. E., Dauphin, Y., et al. (2021). Continental-scale building detection from high-resolution satellite imagery. arXiv Prepr. arXiv:2107.12283.
Spencer, T., Schuerch, M., Nicholls, R. J., and Hinkel, J. (2016). Global coastal wetland vulnerability to sea-level rise. Sci. Adv. 2 (11), e1501202.
Suhaeb, F. W., and Tamrin, S. (2024). Community adaptation strategies to climate change: towards sustainable social development. Migr. Lett. 21 (S2), 943–953.
Temmerman, S., Meire, P., Bouma, T. J., Herman, P. M., Ysebaert, T., and De Vriend, H. J. (2013). Ecosystem-based coastal defence in the face of global change. Nature 504 (7478), 79–83. doi:10.1038/nature12859
Thieler, E. R., and Danforth, W. W. (1994a). Historical shoreline mapping (I): improving techniques and reducing positioning errors. J. Coast. Res., 549–563.
Thieler, E. R., and Danforth, W. W. (1994b). Historical shoreline mapping (II): application of the digital shoreline mapping and analysis systems (DSMS/DSAS) to shoreline change mapping in Puerto Rico. J. Coast. Res., 600–620.
Thieler, E. R., Smith, T. L., Knisel, J. M., and Sampson, D. W. (2013). Massachusetts shoreline change mapping and analysis project, 2013 update. U. S. Geol. Surv.
Thieler, E. R., Himmelstoss, E. A., Zichichi, J. L., and Ergul, A. (2017). Digital Shoreline Analysis System (DSAS) for calculating shoreline change. U. S. Geol. Surv. Open-File Rep. 2017-1111.
Torio, D. D., and Chmura, G. L. (2013). Assessing coastal squeeze of tidal wetlands. J. Coast. Res. 29 (5), 1049–1061. doi:10.2112/JCOASTRES-D-12-00162.1
Toure, S., Diop, O., Kpalma, K., and Maiga, A. S. (2019). Shoreline detection using optical remote sensing: a review. ISPRS Int. J. Geo-Information 8 (2), 75. doi:10.3390/ijgi8020075
Trotz, U. (2024). “Global climate change dynamics: impacts on the Guyana-Suriname Basin,” in Oil and climate change in the Guyana-Suriname Basin (London, United Kingdom: Routledge), 221–233.
Turvey, R. (2007). Vulnerability assessment of developing countries: the case of small-island developing states. Dev. Policy Rev. 25 (2), 243–264. doi:10.1111/j.1467-7679.2007.00368.x
United Nations Environment Programme (UNEP) (2019). Global environment outlook 6: healthy planet, healthy people. Cambridge University Press.
United States Geological Survey (USGS) (2022). Landsat missions. Available online at: https://landsat.usgs.gov.
van Ledden, M., Vaughn, G., Lansen, J., Wiersma, F., and Amsterdam, M. (2009). Extreme wave event along the Guyana coastline in October 2005. Cont. Shelf Res. 29 (1), 352–361. doi:10.1016/j.csr.2008.03.010
Van Zyl, J. J. (2001). The shuttle radar topography mission (SRTM): a breakthrough in remote sensing of topography. Acta astronaut. 48 (5-12), 559–565. doi:10.1016/s0094-5765(01)00020-0
Vaughn, S. E. (2017). Disappearing mangroves: the epistemic politics of climate adaptation in Guyana. Cult. Anthropol. 32 (2), 242–268. doi:10.14506/ca32.2.07
Vos, K., Splinter, K. D., Harley, M. D., Simmons, J. A., and Turner, I. L. (2019). CoastSat: a Google Earth engine-enabled python toolkit to extract shorelines from publicly available satellite imagery. Environ. Model. & Softw. 112, 104528–104529. doi:10.1016/j.envsoft.2019.104528
Wang, B., Hua, L., Mei, H., Wu, X., Kang, Y., and Zhao, N. (2024). Impact of climate change on the dynamic processes of marine environment and feedback mechanisms: an overview. Archives Comput. Methods Eng. 31, 3377–3408. doi:10.1007/s11831-024-10072-z
Weekes, C., and Bello, O. (2019). Mainstreaming disaster risk management strategies in development instruments (II): policy briefs for Barbados, Guyana, Saint Lucia, Suriname, and Trinidad and Tobago.
Wells, J. T., and Kemp, G. P. (1986). “Interaction of surface waves and cohesive sediments: field observations and geologic significance,” in Estuarine cohesive sediment dynamics. Editor A. J. Mehta (Springer), 14, 43–65. doi:10.1029/ln014p0043
Keywords: climate resilience strategies, coastal vulnerability assessment, erosion and sediment dynamics, geospatial flood modelling, remote sensing applications, shoreline change detection
Citation: Oyedotun TDT, Poortinga A, Tenneson K, Wafiq MW, Suaruang W, Nicolau AP, Hamer EA, Nedd GA and Burningham H (2025) Developing a coastal analysis system: the Guyana coastal analysis system (G-CAS) as an example for small island developing states (SIDS). Front. Environ. Sci. 13:1600858. doi: 10.3389/fenvs.2025.1600858
Received: 27 March 2025; Accepted: 28 July 2025;
Published: 09 September 2025.
Edited by:
Ewan Tregarot, University of Portsmouth, United KingdomReviewed by:
Michael Gebreslasie, University of KwaZulu-Natal, South AfricaA. Serwa, Helwan University, Egypt
Copyright © 2025 Oyedotun, Poortinga, Tenneson, Wafiq, Suaruang, Nicolau, Hamer, Nedd and Burningham. This is an open-access article distributed under the terms of the Creative Commons Attribution License (CC BY). The use, distribution or reproduction in other forums is permitted, provided the original author(s) and the copyright owner(s) are credited and that the original publication in this journal is cited, in accordance with accepted academic practice. No use, distribution or reproduction is permitted which does not comply with these terms.
*Correspondence: Temitope D. Timothy Oyedotun, dGVtaXRvcGUub3llZG90dW5AdW9nLmVkdS5neQ==