 Mei-hua Wang
- Zhejiang Geological Prospecting Institute of China Chemical Geology and Mine Bureau, Hangzhou, China
Introduction: Most studies have not fully considered the impact of heavy metal pollution sources on soil environmental capacity. However, a detailed analysis of pollution sources helps to more accurately assess regional environmental capacity and its dynamic changes, providing new research ideas and theoretical support for the management, early warning, and treatment of heavy metal pollution. Changshan County in the western Zhejiang province, as an important agricultural county, has increasingly prominent soil heavy metal pollution issues with the advancement of industrialization and urbanization. However, the current situation of regional environmental capacity remains unclear.
Methods: This study focuses on the black shale geological background of the county, collecting 1,788 farmland soil samples. The enrichment factor method was used to assess the enrichment levels of heavy metals in the soil, and principal component analysis and correlation analysis methods were employed to clarify the main sources of heavy metals in the farmland soil. Using Geographic Information System (GIS) technology and geostatistical methods, the environmental capacity characteristics of farmland soil heavy metals and their spatial distribution patterns were assessed.
Results: The results show that the average concentrations of ω (Cd), ω (Hg), ω (As), ω (Pb), ω (Cr), ω (Ni), ω (Cu), and ω (Zn) in the surface soil of Changshan County’s farmland are 0.53, 0.12, 15.33, 34.03, 65.87, 29.06, 30.37, and 99.77 mg·kg−1, respectively. Except for Cd, which is moderately enriched, and Cr, which is not enriched, the other heavy metals show mild enrichment characteristics. Principal component analysis extracted four principal components with a cumulative contribution rate of 78.92%, and the spatial distribution differences were obvious. Cd Ni, Cu, Zn, As, Pb, Cr and Hg showed significant regional enrichment, and Cd was mainly affected by the dual influence of natural baseline and human disturbance. The static environmental capacity of heavy metals in the soil and the existing capacity rank in the same order: Cr > Zn > Pb > Ni > Cu > As > Hg > Cd. Their existing capacity average values are as follows: Cr 428.77, Zn 239.99, Pb 140.56, Ni 93.19, Cu 55.12, As 31.56, Hg 0.90, Cd −0.35 kg·hm−2. The comprehensive capacity index is 0.66. Moreover, the existing capacity of Cd in paddy fields is significantly lower than in drylands.
Discussion: The main sources of heavy metals in farmland soil are divided into four categories: mixed sources, natural sources, natural and industrial sources, and industrial sources. The comprehensive capacity index reflects that the overall environmental capacity level of farmland soil in the study area is low, and the problem of heavy metal pollution is relatively serious. In particular, areas such as Huibu Town, Baishi Town, Jinchuan Street, and Fangcun Town, which are jointly affected by geology and human activities, face higher environmental risks. This study strengthens the coupling research between environmental capacity and pollution source analysis, providing theoretical support for the prevention and remediation of heavy metal pollution in the farmland soil of Changshan County, as well as a new research pathway for assessing the dynamic changes in regional environmental capacity.
1 Introduction
As an important component of nature, soil is the fundamental resource for human survival and development. However, with the growth of population, expansion of industry, acceleration of urbanization process, and extensive use of fertilizers and pesticides in agricultural production, soil heavy metal pollution has become a global environmental problem (Zeng et al., 2022; Yu et al., 2024; Zhang et al., 2019). Heavy metal pollution not only affects the quality of agricultural products, but also poses a threat to ecosystems and human health. Therefore, studying and evaluating soil environmental capacity is of great significance for soil pollution prevention and contamination control.
Soil environmental capacity refers to the maximum load of pollutants that soil can accommodate within a certain spatiotemporal range, without causing environmental pollution and ensuring the yield and quality of agricultural products (Ye, 1993; Xia, 1986). When the pollutants exceed this load, the soil will suffer from heavy metal pollution, which in turn will lead to environmental problems (Fu et al., 2014). In recent years, research on soil heavy metal environmental capacity has become a hot topic. Many scholars have evaluated the environmental capacity level of regional soils by different methods, such as the comprehensive index method, enrichment factor method (Xing et al., 2005; An et al., 2022; Yan et al., 2024; Marhaba et al., 2020), etc. Soil environmental capacity can not only reflect the accumulation state of pollutants in the soil, but also provide a basis for predicting and warning the trend of heavy metal pollution.
Previous studies have shown that the environmental capacity of heavy metals in soil is influenced by multiple factors such as pollutant sources, soil types, and human activities (Xia, 1993; Zhu, 2023). Ma et al. (2016) had evaluated the heavy metal capacity of different soil types in Jinghe County through an environmental capacity model and found that their capacity levels decreased over time, and the rate of decrease in dynamic capacity was slower than that in static capacity (Ma et al., 2016). Liu et al. (2023) had evaluated the spatiotemporal distribution characteristics of heavy metal environmental capacity in sediments of West Lake and East Lake in Huoqiu County using a comprehensive index method, and found that the rate of change in dynamic environmental capacity is relatively fast within 5–20 years, and the dynamic annual capacity is generally greater than the static annual capacity (Liu et al., 2023). However, these research findings can provide significant support for assessing the environmental capacity of heavy metals in soil. However, studies on the analysis of heavy metal pollution sources in farmland based on black shale geological backgrounds and their coupling with environmental capacity are relatively scarce.
Changshan County is located in the western part of Zhejiang Province and is an important agricultural production base in the region, but its soil faces a certain risk of heavy metal pollution. Through a 1:50,000 land quality survey, the distribution of heavy metals such as cadmium (Cd), mercury (Hg), arsenic (As), copper (Cu), chromium (Cr), lead (Pb), zinc (Zn), and nickel (Ni) in the cultivated land of the county had been basically mastered. Among them, 666.67 ha of agricultural land exceeded the risk control value, mainly affected by cadmium pollution (Zhou et al., 2019). Corresponding pollution source analysis research had been conducted for polluted farmland. The results indicated that the ‘black rock series’ such as the Lower Cambrian Hetang Formation and Ordovician Ningguo Formation, which contained coal or coal bearing siliceous rocks, were rich in elements such as cadmium, chromium, and nickel. The high cadmium geological background was the main reason for the high cadmium content in local farmland soils. In addition, industrial activities, mining, and agricultural activities such as fertilizer and sludge application had exacerbated heavy metal pollution on farmland (Song, 2009; Liu et al., 2019; Wang, 2023; Zhou et al., 2023). With the acceleration of industrialization and urbanization in Changshan County, it will be particularly important to study the environmental capacity and source apportionment of soil heavy metals. To further investigate the static distribution characteristics and pollution sources of heavy metals in farmland soil, this study combined GIS technology, geostatistics, enrichment factor method, and principal component analysis to analyze the enrichment characteristics and sources of soil heavy metals. Through source analysis, the environmental capacity and spatial distribution were accurately evaluated. A dual source analysis system of ‘natural background-human disturbance’ was established for the geological anomaly area of black rock series, and the influence of geological factors on pollution sources during the weathering process was analyzed by combining the characteristic element combination of rock and coal weathering (Cd-Ni-V). At the same time, an analysis was conducted on the differentiated dynamic capacity of hydroponic and dryland systems, providing more accurate identification of pollution sources and assessment of environmental carrying capacity. This study focuses on the static distribution characteristics of heavy metals in farmland soil and provides new ideas and methods for regional soil pollution prevention and control as well as resource management.
2 Materials and methods
2.1 Study area
The study area is located in Changshan County, western Zhejiang Province, with a cultivated area of approximately 213.9 square kilometers. The terrain is mainly hilly, known as ‘80% of mountains, 5% of water bodies, 15% of flat lands’. The terrain of the county is stepped, gradually transitioning from the highlands in the northeast, northwest, and southwest to the central part. The entire terrain is characterized by highlands in the northwest and north, belonging to mountainous areas. The central terrain is relatively low, forming an alluvial plain. The main water systems in the area include ‘One Port and Four Streams’, with ‘One Port’ being Changshan Port river, a major tributary of the Qiantang River system that runs through the entire region. The four streams are Fangcun Creek, Hongqiao Creek, Nanmen Creek, and Longluo Creek. The main wind direction in Changshan County throughout the year is east northeast (ENE), with a frequency of 17.85%, and the secondary dominant wind direction is northeast (NE), with a frequency of 10.87%. The annual average wind speed is 2.0 m·s−1, with a maximum wind speed of 3.72 m·s−1 and a minimum wind speed of 1.16 m·s−1.
The main soil type of cultivated land in this area is paddy soil, covering both paddy fields and dry land. The main crop is rice, and the soil texture is mainly from loamy to clayey. According to previous data (Zhou et al., 2019), soil pH was generally acidic, ranging from 4.0–9.0 with an average of 5.57. The background valuesof organic matter were 2.15% for paddy fields and 1.85% for dry land, respcetively. The average cation exchange capacity (CEC) was 10 cmol (+)/kg, indicating a certain ability to retain nutrients and fix heavy metals. The average quality of arable land is grade 9, with high-quality arable land concentrated in Tianma Street, Huibu Town, Qiuchuan Town, and Tonggong Township. The strata are mainly composed of the Cambrian, Ordovician, and Quaternary systems, with the Quaternary system being the most widely distributed and mainly composed of river alluvial deposits. The Cambrian is mainly composed of carbonate and siliceous rocks deposited in marine environments, while the Ordovician is mainly composed of detrital rocks deposited by marine continental interactions. Magmatic rocks are mainly acidic and intermediate acidic intrusive rocks, and fault zones mainly extend in a northeast direction. There is a mining history of stone coal, limestone and other mines near the cultivated land.
2.2 Collecting samples and measurement
In this study, 1788 soil samples were uniformly collected within the cultivated land area of Changshan County at a sampling density of 8.36 km-2 (excluding 136 duplicate samples). The distribution of sampling points is shown in Figure 1. Handheld GPS was used for positioning during sampling, and sampling points were mainly concentrated in representative areas of the study area, while avoiding areas with significant human interference such as roads and ditches as much as possible. Samples were collected continuously from a depth of 0–20 cm, Each sampling point collected 3–5 sub samples arranged in a plum blossom pattern and combines them into a mixed sample. The collected samples were dried in a well ventilated area and crushed with a wooden stick to remove plant residues, stones, and other debris. After crushing, the soil sample was sieved through a 2 mm (10 mesh) sieve, and about 200 g of the sample was sent to the laboratory for laboratory analysis.
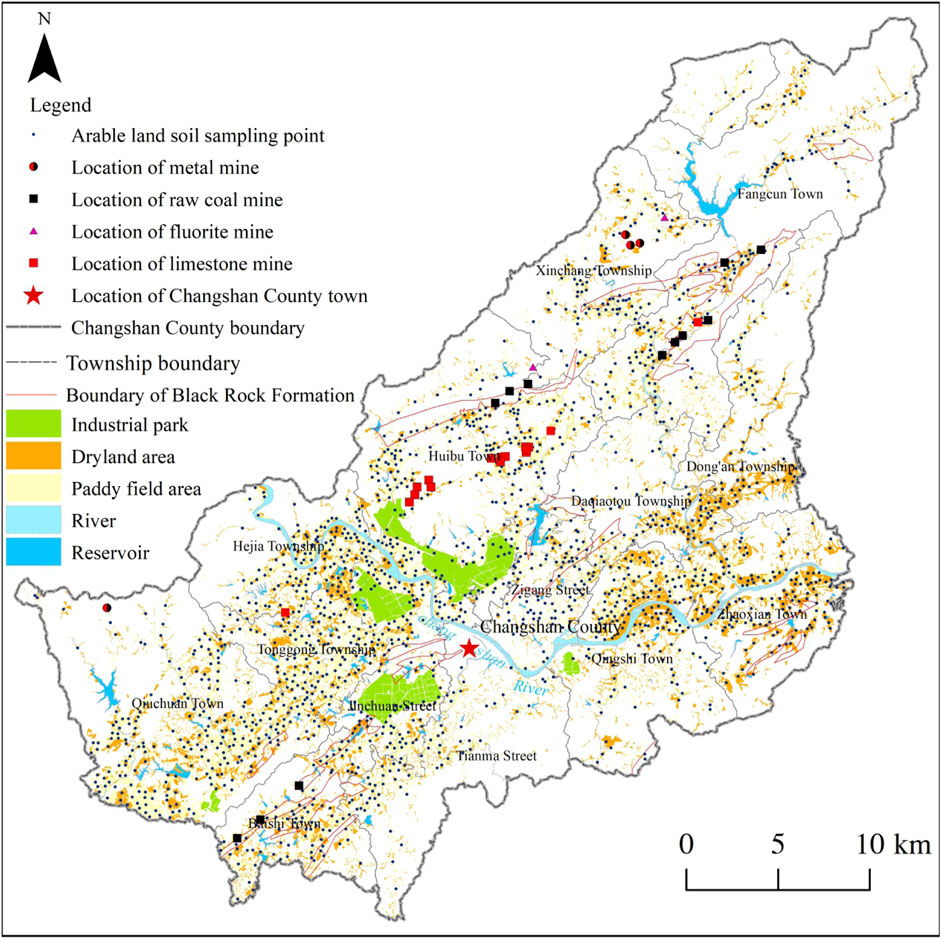
Figure 1. Distribution of arable land sampling points in the study area.
The laboratory work was completed by the 18th Laboratory of Chemical Geology and Mining, testing heavy metal elements including Cd, Hg, As, Cu, Zn, Ni, Cr, and Pb, as well as soil pH and SiO2. The specific testing methods were as follows: Cd and Ni were tested using inductively coupled plasma mass spectrometry (ICP-MS); Cu, Zn, Cr, Pb, and SiO2 were analyzed using X-ray fluorescence spectroscopy (XRF). Hg was measured using cold vapor atomic fluorescence spectroscopy, which was determined using hydride generation atomic fluorescence spectroscopy. The soil pH value was measured by the glass electrode method. During the experiment, soil quality control samples were used to monitor the detection accuracy and precision, and the results showed that all detection indicators met the requirements of the DZ/T 0295–2016 standard (Ministry of Land and Resources of the People’s Republic of China, 2016).
2.3 Measurement methods
2.3.1 Static environmental capacity and existing environmental capacity of soil heavy metals
The static environmental capacity and existing environmental capacity of soil reflected the maximum carrying capacity of heavy metal pollutants in a static state (Lv et al., 2020). The calculation formula (Equations 1, 2) was as follows:
where Wb and Wi are the static environmental capacity and existing environmental capacity of heavy metal element i in cultivated soil, respectively, in kg·hm−2. M is the mass of the 0–20 cm tillage layer soil per hectare of land, with an empirical value of 2.25 × 10⁶ kg·hm−2 (Fan et al., 2022). Cic, Cib and Cip are the critical value, regional background value, and measured value of heavy metal element i in soil at monitoring points, respectively, with units of mg·kg−1. Most of the dry land in the county comes from the transformation of paddy fields, so the critical values in the study are based on the screening values in GB 15618-201823 (Ministry of Ecology and Environment of the People’s Repulic of ChinaState Administration for Maket Regulation, 2018), as shown in Table 1.
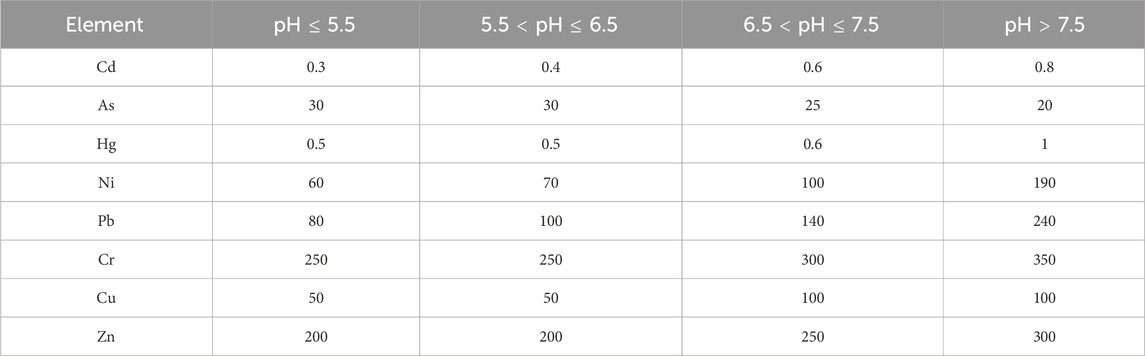
Table 1. Screening threshold values of heavy metals in the cultivated soils of the study area (Unit: mg·kg−1).
2.3.2 Calculation of annual dynamic environmental capacity of soil heavy metals
The dynamic environmental capacity of soil refers to its annual carrying capacity for heavy metals during the processes of heavy metal migration, transformation, and self purification (Eli et al., 2020). The calculation formula (Equation 3) is as follows:
where Wn is the annual dynamic environmental capacity of heavy metal element i in the soil, measured in kg·hm−2. M is the mass of the 0–20 cm tillage layer soil per hectare of land, with an empirical value of 2.25 × 10⁶ kg·hm−2. Cin is the critical value of heavy metal element i in the soil after n years, measured in mg·kg-1. Cip is the measured content of heavy metal element i at the monitoring point, measured in mg·kg−1. K is the residual coefficient, representing the ratio of the amount of a given element remaining in the soil after 1 year of cultivation to the sum of the previous year’s soil content and the current year’s input. Based on previous research and parameter settings, the value of K in this study is set to 0.9 (Liu et al., 2016; Yu et al., 2009). n is the control period.
2.3.3 Evaluation method for soil heavy metal environmental capacity
The comprehensive index method calculates pollution sub indices based on measured values and evaluation criteria, and then uses these sub indices to calculate the comprehensive index (Cheng et al., 2011). The calculation formula (Equations 4, 5) is as follows:
where Pi is the single environmental capacity index of heavy metal element i in soil; Wi and Wb are the existing and static environmental capacities of heavy metal element i in soil, respectively, measured in kg·hm-2. n is the number of types of elements, PI is the comprehensive index of environmental capacity. The evaluation criteria for soil heavy metal environmental capacity are based on the environmental capacity index, as shown in Table 2.
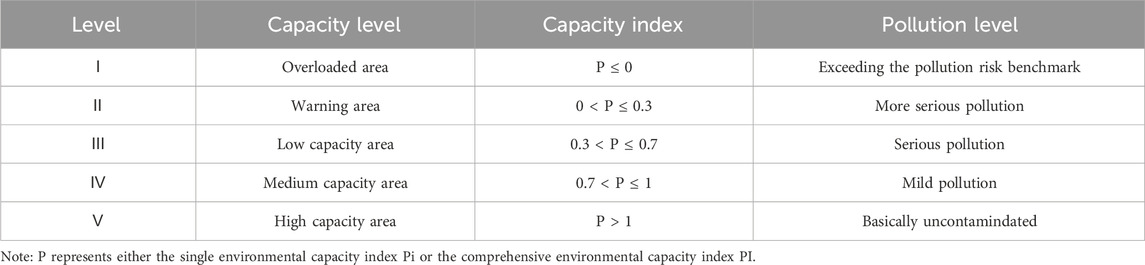
Table 2. The classification criteria for the assessment of heavy metal environmental capacity in the cultivated soils of the study area.
2.3.4 Enrichment factor method
The enrichment factor method evaluates the impact of human activities on heavy metal enrichment by calculating the ratio of heavy metal element concentration to reference element concentration in soil (Hernandez et al., 2003). The calculation formula (Equation 6) is:
where Ci and Bi are the measured concentration and background concentration of heavy metal element i in the soil, respectively, measured in mg·kg−1.
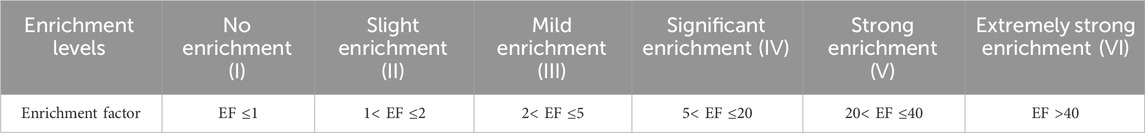
Table 3. Enrichment factor method of evaluation grading standard.
2.4 Data analysis
Multiple tools were used for data analysis, including Excel 2020 for descriptive statistics, enrichment factor, and environmental capacity index calculations. Independent sample t-tests (to analyze significant differences in heavy metal content under different land use types), Pearson correlation analysis (to examine linear relationships between variables), and principal component analysis (PCA) (for dimensionality reduction and variable classification) were performed using IBM SPSS Statistics 21 software. Before conducting PCA, the suitability of the data was assessed using the KMO test and Bartlett’s sphericity test. Draw sampling point distribution maps and spatial distribution maps used ArcGIS 10.8. Origin 2021 had been drawn a scale chart of enrichment factor grading and a correlation heatmap. These tools work together to ensure the accuracy and comprehensiveness of the analysis.
3 Results
3.1 Characteristics of heavy metal content in soil
The descriptive statistical results of heavy metal content in the soil of the study area is shown in Table 4. By adding or subtracting twice the standard deviation of the arithmetic mean to remove abnormal data, and after multiple rounds of elimination, the heavy metal data was made to approach a normal distribution. The arithmetic mean was used as the background value of heavy metals in the soil of the study area. According to the calculations, the background values of ω (Cd), ω (Hg), ω (As), ω (Pb), ω (Cr), ω (Ni), ω (Cu), and ω (Zn) were 0.23, 0.10, 9.80, 31.30, 65.80, 26.50, 26.60, and 85.90 mg·kg−1, respectively. Correspondingly, the average soil pH in this area was 5.57, and the average contents of 8 heavy metals were 0.53, 0.12, 15.33, 34.03, 65.87, 29.06, 30.37, and 99.77 mg·kg−1, respectively, all of which are higher than their corresponding soil background values. The average values of the main pollutant element Cd were 2.30, 3.12, and 5.46 times higher than the background soil values of the regional, Zhejiang Province (Xie et al., 2017), and national background values (Wei et al., 1991), respectively, while the average values of As were 1.56, 2.40, and 1.37 times higher, respectively.
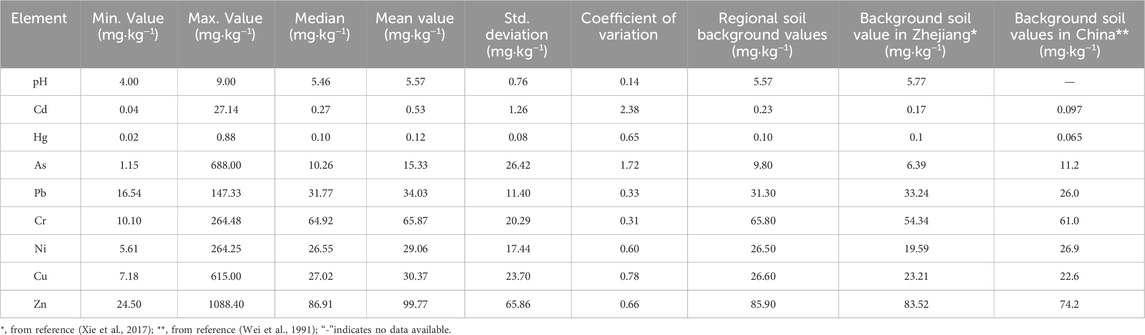
Table 4. Basic statistical analysis of heavy metal content in farmland soil of the study area.
The coefficient of variation of soil heavy metals showed that the order of coefficient of variation was Cd > As > Cu > Zn > Hg > Ni > Pb > Cr. among them, the coefficients of variation for Cd and As were 2.38 and 1.72, respectively, indicating strong variability.
According to the discrimination criteria of GB 15618-2018 (Ministry of Ecology and Environment of the People’s Repulic of ChinaState Administration for Maket Regulation, 2018), the order of exceedance rates in the study area from highest to lowest was Cd > As > Cu > Zn > Ni > Pb > Hg > Cr. Except for Cd, the average content of other heavy metals was lower than the corresponding soil risk screening values (Risk screening values of heavy metals corresponding to the data in Table 1). The average content of Cd exceeded the risk screening value, indicating that the soil in the study area was mainly polluted by Cd, and its point exceedance rate was 32.77%. In addition, there were also a small number of locations in the study area where other heavy metal elements exceed the soil risk screening value, which posed certain environmental risks.
3.2 Characteristics of heavy metal enrichment in soil
According to the calculation results of the enrichment factor of heavy metals in cultivated soil in the research area, the average enrichment factor of soil Cd was 2.30, indicating that the overall state was in a mild enrichment state. The average enrichment factors of six heavy metals, As, Hg, Zn, Cu, Ni, and Pb, in the soil were 1.56, 1.27, 1.16, 1.14, 1.1, and 1.09, respectively, all showing slight enrichment, while the average enrichment factor of Cr was 1, indicating a no enrichment.
According to the classification of enrichment factor levels (Figure 2), heavy metals in the surface soil of cultivated land in the study area showed varying degrees of enrichment. Among them, these 8 heavy metals were mainly no enrichment and slight enrichment, both accounting for over 76%. In the soil of the study area, there was no strong enrichment or extremely strong enrichment of Hg, Pb, Cr, Ni, and Zn. However, soil As, Cd, and Cu showed strong enrichment or extremely strong enrichment at some points, with the proportion of points containing strong enrichment or above being 0.3%, 1.2%, and 0.1%, respectively. These results indicated that there was a high degree of enrichment of certain heavy metals in local areas, which requires attention.
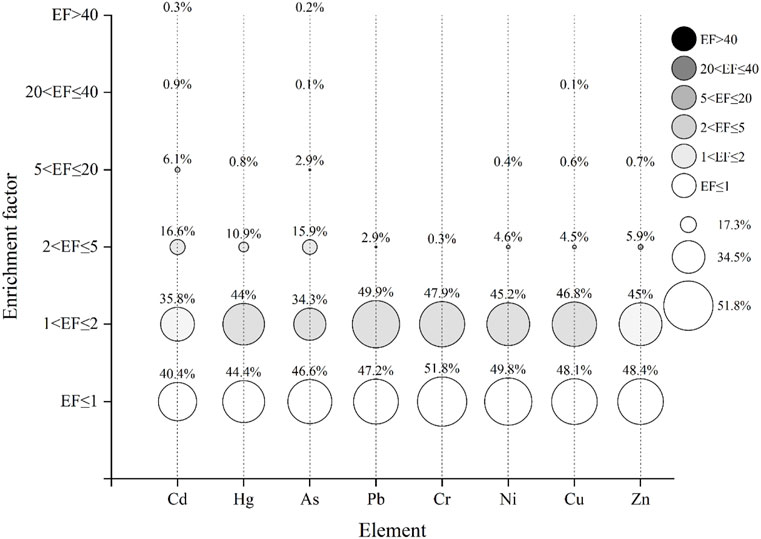
Figure 2. Proportional distribution of soil heavy metal enrichment factors.
3.3 Analysis of heavy metal sources in soil
Principal Component Analysis (PCA) had been widely used in multiple research fields, and its premise was to compress the original variables, there should be strong correlation between the original variables (Carlon et al., 2001; Burns et al., 1997). PCA was commonly used to identify the compositional characteristics of pollutants and determine their sources. In this study, principal component analysis was used to determine the sources of heavy metals in cultivated soil in the research area, aiming to provide a basis for better evaluating the environmental capacity of soil heavy metals.
Firstly, KMO and Bartlett sphericity tests were conducted on the soil heavy metal data in the study area. The results showed that the KMO value of the study area dataset was 0.769, which was suitable for factor analysis. The approximate chi square value of Bartlett’s test is 4846.909, with a significance level of 0.00, which indicated that the selected indicators were suitable for factor analysis. Four principal components with eigenvalues greater than 0.8 after rotation were selected in the analysis, with a cumulative variance contribution rate of 78.92%. The spatial distribution map of principal component factor scores was generated by inverse distance weight interpolation of four principal components using ArcGIS, as shown in Figure 3.
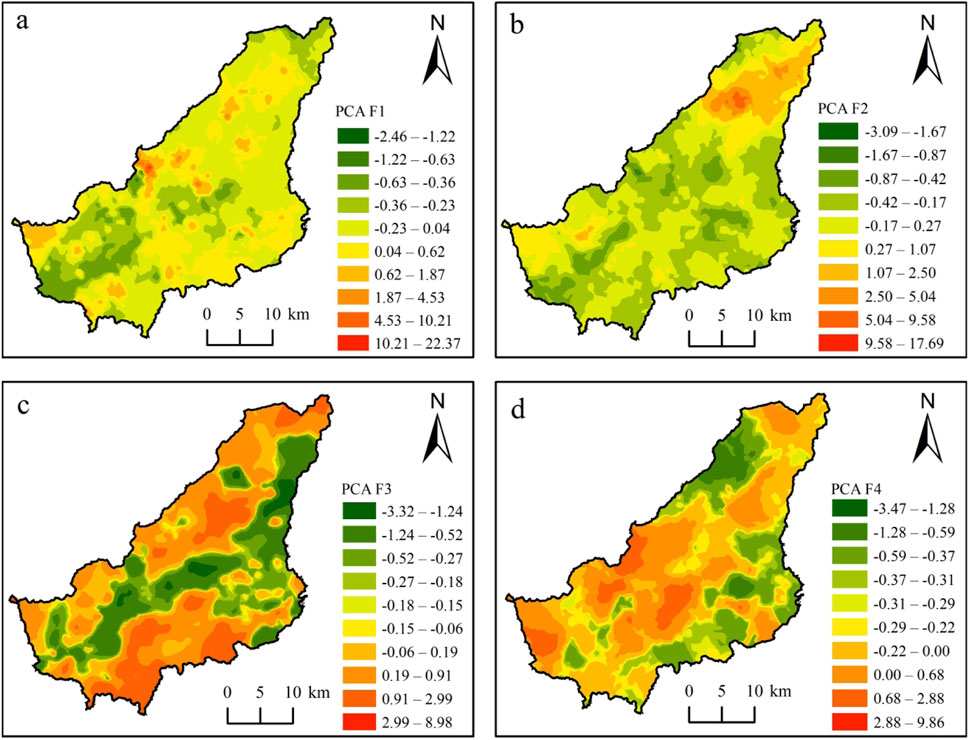
Figure 3. Spatial distribution maps of principal component factor scores. (a) Spatial distribution of Factor F1; (b) Spatial distribution of Factor F2; (c) Spatial distribution of Factor F3; (d) Spatial distribution of Factor F4.
PCA F1 explains 32.62% of the data variance, and Cd, Ni, Cu, and Zn had high positive loadings on this principal component, with loading values of 0.904, 0.779, 0.77, and 0.717, respectively. The correlation heatmap (Figure 4) between these elements showed a highly significant positive correlation (p < 0.01), with correlation coefficients above 0.5, indicating that their sources are homologous. Except for Cd showing strong variability, Ni, Cu, and Zn all exhibited moderate variability. These four elements mainly showed mild enrichment of Cd and slight enrichment of others in the soil of the study area. Through the spatial distribution of principal component factor scores (Figure 3a), it was found that high-value areas were concentrated in the northern part of Hejia Township, the central part of Baishi Town, the northwestern part of Qiuchuan Town, the central part of Jinchuan Street, the northern part of Huibu Town, and most areas of Fangcun Town.
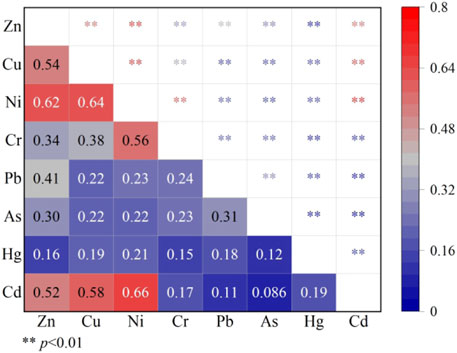
Figure 4. Heatmap of correlation analysis of soil indicators in the study area.
PCA F2 explained 18.63% of the data variance, with As, Pb, and Zn had high positive loadings on this principal component, at 0.755, 0.808, and 0.446, respectively. The correlation heatmap showed a highly significant positive correlation (p < 0.01) between these elements, indicating that their sources were homologous. According to the spatial distribution map of principal component factor scores (Figure 3b), high-value areas were mainly distributed in most areas of Xinchang Township, Fangcun Town North, Xinqiao Township, as well as Baishi Town, Jinchuan Street Central, and Qiuchuan Town Northwest. The content of the main pollutant element As in this area exceeds 260.8 mg·kg−1 (Zhou et al., 2019). The low value areas were mainly located in the valley plain areas, including Tonggong Township, Hejia Township, and Qingshi Township Most areas of the town and Dong’an Township. Overall, the content in hilly areas was higher than that in valley plain areas, and was directly related to the distribution of Cambrian strata Connect related.
PCA F3 explained 15.08% of the data variance, with Cr and Ni having high positive loadings in this component, at 0.938 and 0.464, respectively, and showing a significant positive correlation (correlation coefficient of 0.56, p < 0.01). The spatial distribution of principal component factor scores (Figure 3c) showed that Cr and Ni exhibited high values in hilly areas, while they were lower in valley and plain areas. The high-value areas were concentrated in Xinchang Township, the northwest of Fangcun Town, the northwest of Qiuchuan Town, the middle of Jinchuan Street, the south side of Qingshi Town, and Baishi Town. These areas were mainly closely related to the sandstones, siltstones, and siliceous rocks of the Ordovician Changwu Formation, Lower Cambrian, and Silurian. In addition, high-value areas have also emerged near industrial parks and densely populated areas of industrial and mining enterprises.
PCA F4 explained 12.60% of the data variance, with Hg having a positive loading of 0.982 and a coefficient of variation of 0.65, indicating moderate variability. The high-value areas of Hg were mainly distributed in Huibu Town, Jinchuan Street, Hejia Township, the northwest of Qiuchuan Town, and the central part of Fangcun Town, with sporadic distribution in other areas (Figure 3d). These high-value areas were mostly located near large mines, industrial enterprises, and industrial parks, such as key polluting enterprises such as Southern Cement, Yongsheng Bearing, and Jiaheng Bearing.
3.4 Environmental capacity of heavy metals in soil
3.4.1 Static environmental capacity and existing environmental capacity of soil heavy metals
Based on the background and critical values of heavy metals in the soil of the research area, combined with the soil environmental capacity calculation model, the static and existing environmental capacity of heavy metals in cultivated soil could be calculated. The static environmental capacity of heavy metals in cultivated land within the research area, from high to low, was as follows: Cr > Zn > Pb > Ni > Cu > As > Hg > Cd. The static environmental capacities of each element were 428.92, 271.20, 146.70, 98.94, 63.60, 44.00, 0.96, and 0.32 kg·hm−2, respectively. According to Table 5, the ranking of the existing capacity and static capacity of heavy metals in cultivated land was the same, and the average existing capacity was as follows: Cr 428.77, Zn 239.99, Pb 140.56, Ni 93.19, Cu 55.12, As 31.56, Hg 0.90, Cd −0.35 kg·hm−2. The environmental capacity values of different elements varied greatly, with Cr, Pb, Ni, and Hg having the highest proportion of existing environmental capacity and static environmental capacity. Their average existing capacity accounts for 99.97%, 95.82%, 94.19%, and 93.97% of the total static environmental capacity, respectively; The next best ones are Zn, Cu, and As, whose average existing capacity to total static environmental capacity ratios are 88.49%, 86.68%, and 71.72%, respectively; the worst was Cd, with a negative average existing capacity, indicating that the Cd in cultivated land has exceeded the soil’s carrying capacity as a whole. The existing capacity reduction of each heavy metal was as follows: Cr 0.15, Zn 31.21, Pb 6.14, Ni 5.75, Cu 8.47, As 12.44, Hg 0.06, Cd 0.67 kg·hm−2. In terms of the reduction amplitude, Cd had the most significant reduction, reaching 208.6%.
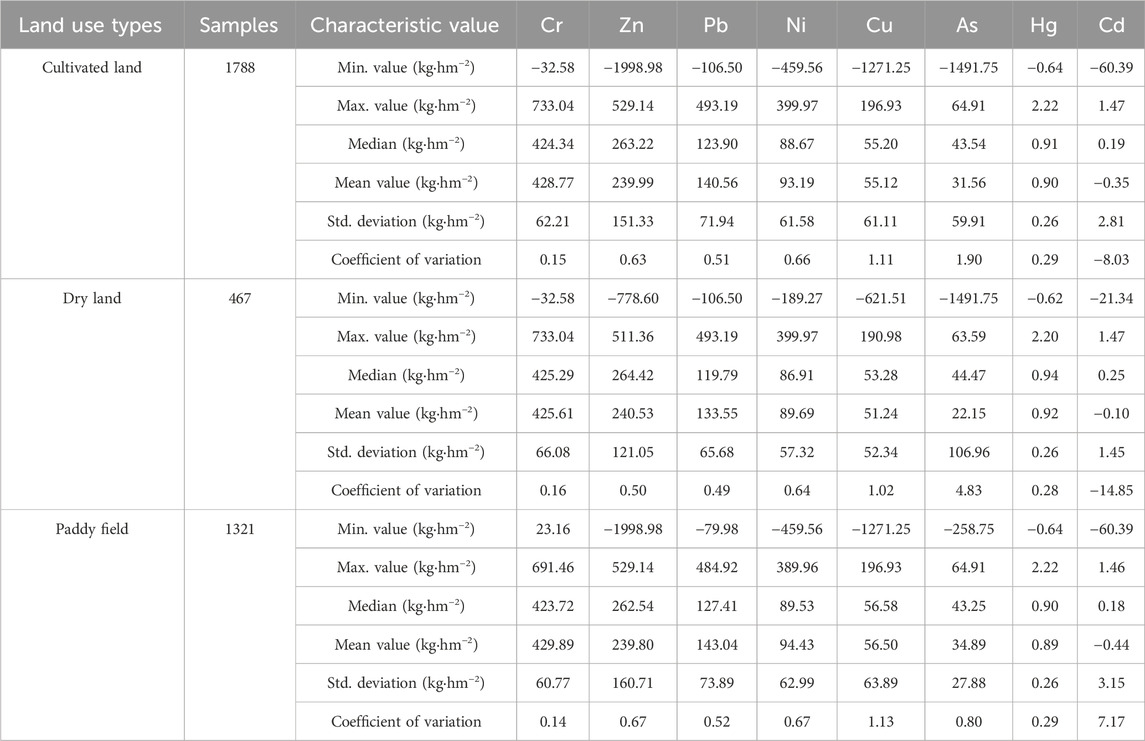
Table 5. Basic statistical analysis of the existing capacity of heavy metals in cultivated soils in the study area.
The statistical analysis of the static environmental capacity and the existing environmental capacity of the two different land use types, dry land and paddy field in the cultivated land was also conducted in this study. The average static environmental capacity of heavy metals in dry land was in the order of: Cr 425.77, Zn 268.05, Pb 138.96, Ni 94.07, Cu 6.08, As 44.32, Hg 0.95, Cd 0.29 kg·hm−2. According to Table 6, the reduction amount of the existing environmental capacity of heavy metals in dry land was: Cr 0.16, Zn 27.5, Pb 5.42, Ni 4.37, Cu 9.84, As 22.17, Hg 003, Cd 0.39 kg·hm−2, among which the reduction of Cd was the most significant, reaching 134.48%; The average static environmental capacity of heavy metals in paddy fields was: Cr 430.03, Zn 272.31 Pb 149.43, Ni 100.67, Cu 64.49, As 43.89,g 0.96, Cd 0.33 kg·hm−2. According to Table 6, the reduction amount of the existing environmental capacity heavy metals in paddy fields was: Cr 0.15, Zn 31.51, Pb 6.39, Ni 0.24, Cu 7.99, As 9.00, Hg 0.07, Cd 0.77 kg·hm−2, among which the reduction of Cd was the most significant, reaching 233.33%.
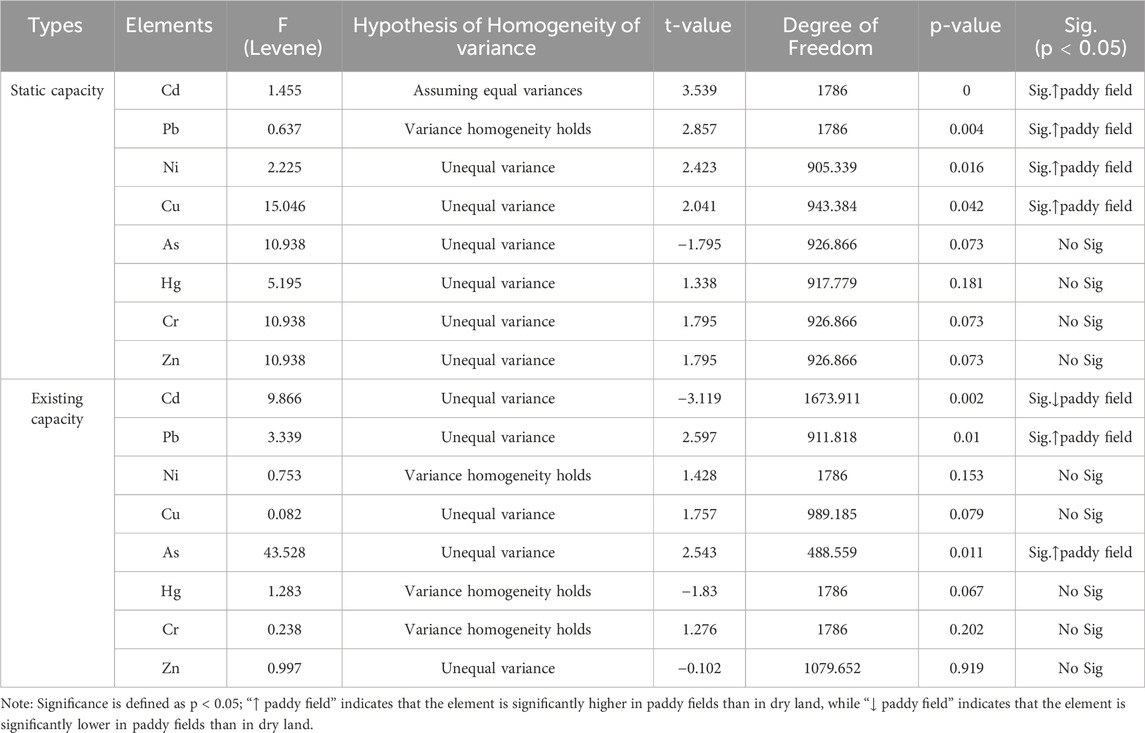
Table 6. Independent Samples t-Test Results for the Mean Static and Existing Capacities of Different Heavy Metals in Paddy Fields and Drylands.
According to the results of the independent sample t-test shown in Table 6, the means of Cd, Pb, Ni and Cu in the static capacity of the paddy field were significantly higher than those in the dry land (p < 0.05). However, in terms of the existing capacity, the mean of Cd in the paddy field was significantly lower than that in the dry land (p < 0.05), while the contents of As and Pb in the paddy field were significantly higher than those in the dry land (p < 0.05). No significant differences were found for the capacity of other elements. In addition, the reduction range of the main pollution element Cd in the paddy field was significantly greater than that in the dry land (p < 0.05). The results also revealed that there were points in the study area where the existing environmental capacity of heavy metals in some soils is negative, indicating that the concentration of heavy metals in some areas’ soils had exceeded their environmental carrying capacity, posing potential pollution risks.
3.4.2 Evaluation of soil heavy metal environmental capacity
A systematic analysis of the environmental capacity of heavy metals in cultivated soil in the study area was conducted using the comprehensive index method. The environmental capacity indices and comprehensive environmental capacity indices of various heavy metals were obtained, and the capacity indices were classified into levels. Subsequently, ArcGIS software was used to assign neighboring point values to the environmental capacity indices of various heavy metals, generating spatial distribution maps of the environmental capacity indices of various heavy metals in all soil patches of cultivated land in the study area. According to the statistical results of the point environmental capacity index, significant differences were observed in the environmental capacity indices of Cr, Pb, Hg, Ni, Zn, Cu, As, and Cd within the study area. The average environmental capacity indices of these 8 heavy metals are 1.00, 0.96, 0.94, 0.96, 0.89, 0.86, 0.70, and −1.05, respectively. The average value of the comprehensive environmental capacity index PI is 0.66, indicating that the overall heavy metal environmental capacity of the soil in the study area is relatively low and the pollution is severe. Specifically, the capacity indices of Cr, Pb, Hg, Ni, Zn, and Cu are between 0.7 and 1, belonging to the medium capacity region, indicating that these elements are generally mildly polluted. The capacity index of As is 0.70, approaching the upper limit of the low capacity area, indicating severe pollution. The capacity index of Cd is −1.05, located in the overload zone, and the pollution exceeds the risk benchmark. The study also showed (Figure 5) that, except for Cd, the environmental capacity levels of other heavy metals are mainly concentrated in high-capacity and medium capacity areas, accounting for 75% of the total area. Among them, Cr has the largest proportion of high-capacity and medium capacity areas, reaching 99.26%. The order of spot area from large to small is Cr > Pb > Hg > Ni > Zn > Cu > As. In contrast, the environmental capacity level of Cd is mainly distributed in high-capacity and overloaded areas, accounting for 70.84% of the total area.
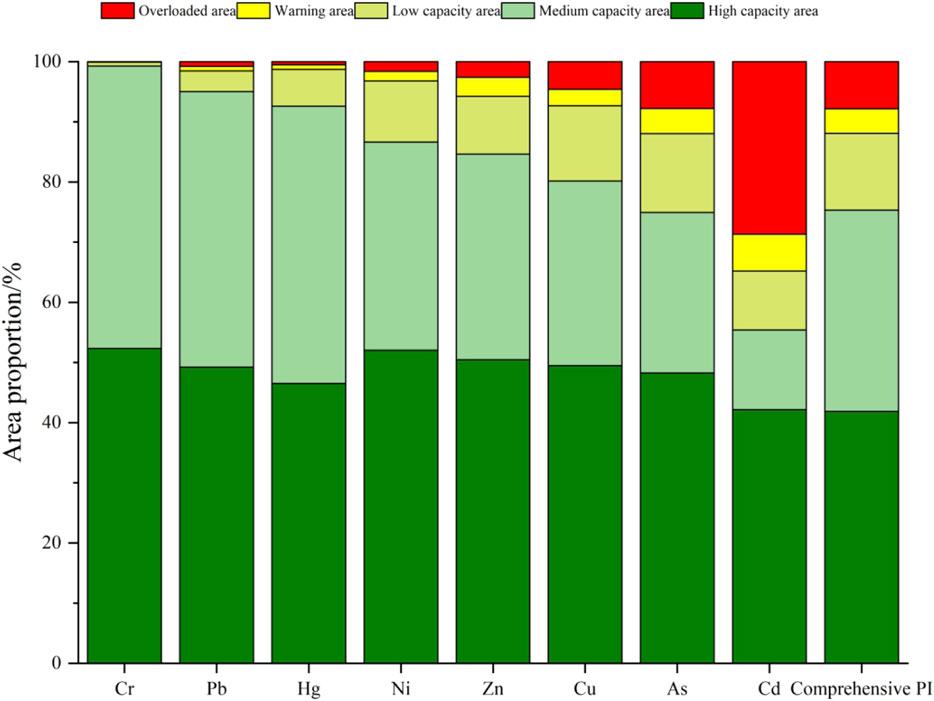
Figure 5. Grading of soil heavy metal environmental capacity index.
3.4.3 Distribution of soil heavy metal environmental capacity
The soil Cr environmental capacity in the research area was mainly composed of high capacity and medium capacity zones (Figure 6Cr), accounting for 52.36% and 46.90% of the total area, respectively. The areas of low capacity zone, alert zone, and overload zone were relatively small, accounting for 0.64%, 0.04% and 0.06% respectively. The excessive area was located in the southern part of Fangcun Town, and the warning area was located in Xindu Industrial Park, Jinchuan Street, with a local distribution and extremely small area. The low capacity areas were locally distributed in the northern part of Fangcun Town, Yawu Village in Huibu Town, the eastern part of Tonggong Township, the periphery of Xindu Industrial Park in Jinchuan Street, the southern part of Qingshi Town, and the southeastern part of Qiuchuan Town. High capacity areas were widely distributed in the eastern part of Qiuchuan Town, Tonggong Township, Jinchuan Street, Qingshi Town, Zhaoxian Town, and most areas of Dong’an Township.
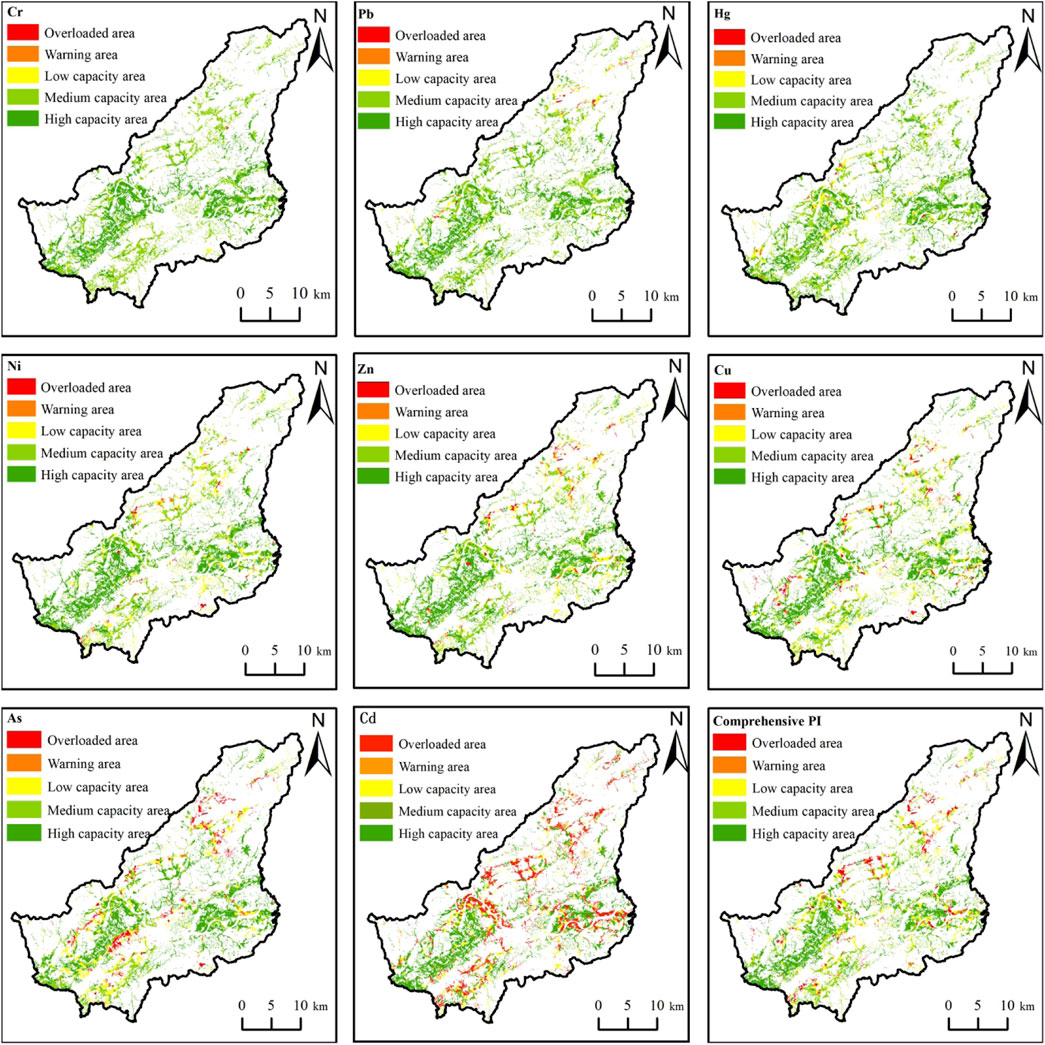
Figure 6. Spatial distribution analysis of soil environmental capacity index.
The areas of high and medium capacity Pb in the soil of the research area accounted for 49.22% and 45.79%, respectively. Their distribution was closely related to the geological background and was widely distributed in areas such as Qiuchuan Town, Hejia Township, Qingshi Town, and Zhaoxian Town. The low capacity area accounted for 9.61%, which mainly concentrated in Qiuchuan Town, Hejia Township, Fangcun Town, and Xinchang Township. The areas of overload zone and warning zone accounted for 0.78% and 0.76% respectively, which mainly distributed in the rock contact zone and surrounding areas of Xinchang Township, Fangcun Town, Tonggong Township and other places (Figure 6Pb).
The high and medium capacity areas of soil Hg accounted for 46.49% and 46.11% respectively, while the low capacity areas accounted for 6.12%, mainly distributed in Qiuchuan Town, Hejia Township, Tonggong Township, Huibu Town, Zigang Street, and Fangcun Town. The overloaded area and warning area accounted for 0.79% and 0.49% respectively, mainly located in Qiuchuan Town, Hejia Township, and Huibu Town (Figure 6Hg). These areas were mostly located around five large industrial parks or near industrial facilities such as cement plants and lime plants.
The high and medium capacity areas of Ni in the research area accounted for 52.05% and 34.57% respectively, while the low capacity area accounted for 10.17%, which had been mainly distributed in Baishi Town, Hejia Township, Huibu Town, Qingshi Town, Zhaoxian Town, Fangcun Town, and Xinchang Township. The areas of overload zone and warning zone were 1.60% and 1.61% respectively, similar to the distribution of low capacity zone, but with a smaller area. The lithology was mainly concentrated in the Ordovician Fangyan Formation, Changwu Formation, and Black Rock Series (Figure 6Ni).
The high and medium capacity areas of soil Zn in the research area respectively accounted for 50.49% and 34.16%, which were widely distributed in areas such as Qiuchuan Town, Hejia Township, Qingshi Town, and Zhaoxian Town. The low capacity area accounts for 9.61%, mainly concentrated in Baishi Town, Hejia Township, Qingshi Town, Tonggong Township, Huibu Town, Zhaoxian Town, Fangcun Town, and Xinchang Township (Figure 6Zn). The areas of overload zone and warning zone are 2.61% and 3.13% respectively, which are distributed in the same way as the low capacity zone, concentrated in the Cambrian and Ordovician strata, rock contact zones, and industrial areas. The areas of Qiuchuan Town, Hejia Township, and Huibu Town are located near five large industrial parks and are distributed in blocks.
The high capacity and medium capacity areas of soil Cu in the research area accounted for 49.47% and 30.70% respectively, with large areas distributed in various townships. The areas of low capacity zones accounted for 12.51%, with scattered distribution in various towns and villages, and the area was relatively small. The areas of the warning zone and overload zone accounted for 2.70% and 4.61% respectively, mainly concentrated in Qiuchuan Town, Qingshi Town, Tonggong Township, Jinchuan Street, Tianma Street, Huibu Town, Zhaoxian Town, Fangcun Town, and Xinchang Township (see Figure 6Cu).
The areas of high and medium capacity As in the soil of the study area accounted for 48.27% and 26.67%, respectively. Their distribution areas are similar to Pb elements and are closely related to the geological background. The low capacity area accounted for 13.09% and was widely distributed, appearing in all towns except Dong’an Township and Qingshi Town. The overloaded area and warning area accounted for 7.80% and 4.15% respectively, mainly distributed in the northern part of Qiuchuan Town and Hejia Township, the eastern part of Tonggong Township, the western and southeastern parts of Huibu Town, the northern part of Zigang Street, Fangcun Town and Xinchang Township (see Figure 6As). These areas are mainly concentrated near the contact zone between black rock formations and rock masses.
The areas of high and medium capacity Cd in the soil accounted for 42.15% and 13.24% respectively, mainly distributed in Qiuchuan Town and Tonggong Township, and also distributed in other towns. The areas of low capacity zones, warning zones, and overloaded zones accounted for 9.82%, 6.10%, and 28.69%, respectively, and were also distributed in various towns and villages. Among them, Cd overload areas were widely distributed, with a focus on Huibu Town, Hejia Township, Qingshi Town, Jinchuan Street, Zhaoxian Town, Fangcun Town, and Xinchang Township (Figure 6Cd). The high-value areas were mainly located in the Cambrian and Ordovician strata, as well as around five large industrial areas, mines, and related enterprises, presenting a blocky distribution.
3.4.4 Dynamic environmental capacity status of soil heavy metals
Tn the research area, the average pH value of the sampling points was 5.57, and the measured average value of Cd was 0.53 mg·kg-1, which had exceeded the critical value set by the paddy field screening value (5.5<pH ≤ 6.5) in the GB 15618–2018 standard. Therefore, based on this condition, the dynamic environmental capacity of heavy metal Cd was not calculated. According to the data in Table 7, there were differences in the dynamic environmental capacity of heavy metals in the soil of the study area under different control years. In the same year, the dynamic environmental capacity of the seven heavy metals in the study area was ranked from high to low as Cr > Zn > Pb > Ni > Cu > As > Hg, and the order of dynamic environmental capacity was consistent with that of static environmental capacity. In addition, the order of cumulative reduction rate of dynamic environmental capacity is Hg > Cr > As > Pb > Cd > Ni > Zn > Cu.
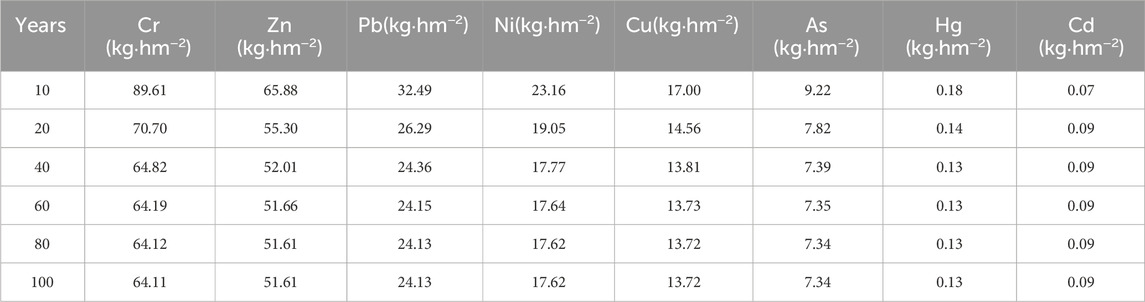
Table 7. Prediction of dynamic environmental capacity of soil heavy metals in the study area.
With the passage of time, the rate of decrease in the dynamic environmental capacity of the seven heavy metals also decreased gradually with the increase of control years, showing a significant downward trend in the first 20 years. After that, the changes gradually stabilized and eventually showed a relatively consistent rate of decrease. According to the prediction, when the control period reaches 100 years, the dynamic environmental capacities of Cr, Zn, Pb, Ni, Cu, As, and Hg in the soil would be 64.11, 51.61, 24.13, 17.62, 13.72, 7.34, and 0.13 kg·hm−2, respectively.
This study also analyzed the dynamic environmental capacity of two land use types, dryland and paddy field, in cultivated land, with a focus on the cumulative reduction rates of these seven heavy metal elements (Figure 7). The results showed that the dynamic environmental capacity of these 7 heavy metal elements decreased year by year over time, and the cumulative reduction rate of Hg was the highest, exceeding 85%. There are differences in the ranking of heavy metal accumulation reduction rates between paddy fields and dry land. The cumulative reduction rate of paddy fields, in order of magnitude, is as follows: Hg > Cr > Pb > Ni > As > Zn > Cu, The order of arid land is: Hg > Cr > Pb > Ni > Zn > As > Cu. Specifically, the cumulative reduction rate of As in paddy fields was significantly higher than that in dry land (p < 0.05).
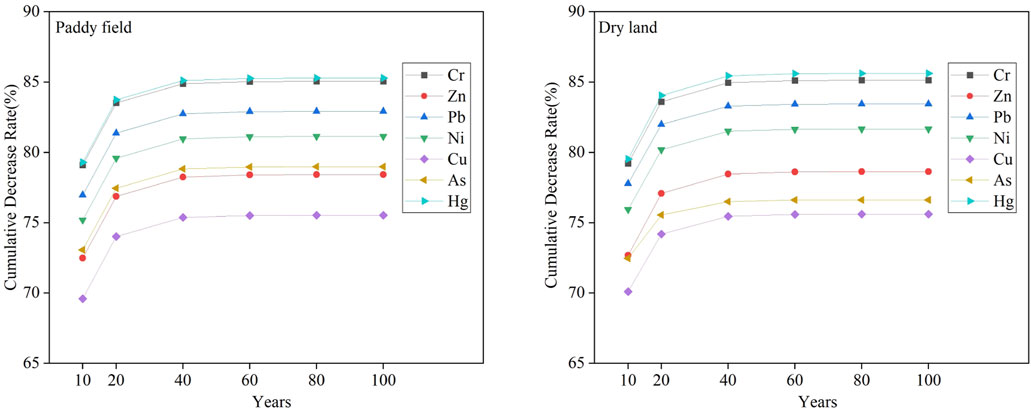
Figure 7. Cumulative reduction rate of dynamic environmental capacity of soil heavy metals in paddy fields and drylands.
4 Discussion
4.1 Source analysis of PCA
Based on the geological background data (Zhou et al., 2019), the high-value PCA F1 was consistent with the distribution of black rock formations in the Cambrian and Ordovician systems, and was distributed in a northeast direction. This indicates that the high content of heavy metals in the soil of the area was closely related to the geological background, especially the carbonaceous shale of the Ningguo Formation in the Lower Ordovician and the carbonaceous shale and siliceous rock of the Hetang Formation in the Lower Cambrian, which has similar characteristics of heavy metal content. The Cambrian Xiyangshan Formation, Qingbaikou Shangshu Formation, Nanhua Xiuning Formation, and Ordovician Yinzhubu Formation also showed high levels of heavy metal content (Table 8). In particular, the Cd content in rock types such as black rock Hetang Formation stone coal and siliceous rock was 6.5 times higher than the background value in Zhejiang Province, resulting in significant inheritance of heavy metals in cultivated soil in this area, mainly from parent materials, which is consistent with the research results of Song (2009). On the high contribution of rock types such as stone coal to elements such as Cd, Ni, Cu, and Zn in black rock types. Stone coal with typical Cd-Ni-V element combinations has generated a large amount of waste gas, wastewater, and waste residue during open-pit mining and weathering processes in the mining area over the years. Especially without effective treatment, these wastes further intensify the release of heavy metal elements, leading to an increase in the content of Cd, Cu, Zn, and Ni in the soil. Dai et al. (2024) also confirmed the significant exceedance of Cd content in the soil around the coal mining area, reflecting the dual effects of “natural background-human disturbance” in the typical black rock geological anomaly zone of the area. According to the investigation, the average contents of Cd, Cu, Zn, and Ni in the sediment of farmland around the mining area are 19.53, 1.97, 2.24, and 2.16 times the regional background values, respectively. According to the GB 15618–2018 standard (Ministry of Ecology and Environment of the People’s Repulic of ChinaState Administration for Maket Regulation, 2018), the exceedance rates are 51.69%, 14.4%, 18.64%, and 12.71%, respectively, indicating that these elements have significantly accumulated in the sediment, indirectly leading to the exceedance of soil heavy metal content. In addition, monitoring results of agricultural inputs show that the content of Cd and Cu in organic fertilizers is relatively high, exceeding the standards for these two elements in organic fertilizers (Ministry of Agriculture of the People’s Republic of China, 2012). Applying organic fertilizer per acre of land per year may introduce 0.414 g of Cd, 36.15 g of Cu, 17.88 g of Ni, and 3.678 g of Zn, further exacerbating soil heavy metal pollution (Zhou et al., 2023). Tang et al. (2012) further pointed out that long-term use of organic fertilizers containing heavy metals can lead to soil heavy metal accumulation, which is consistent with the conclusion of this study. In summary, the sources of principal component F1 include multiple factors such as natural geological background, mining activities, and agricultural activities, but the natural background source plays a dominant role.
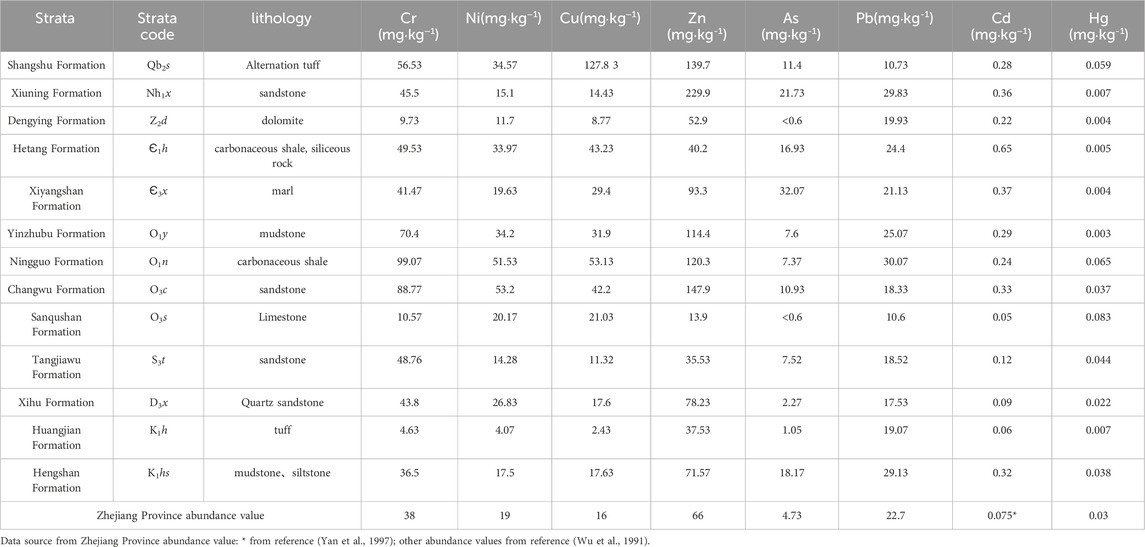
Table 8. The average heavy metal content in bedrock of each stratum in the study area.
From the geological and geochemical data of the strata in Table 8 and PCA F2, it could be seen that the As content in the Cambrian Xiyangshan Formation was significantly higher than other strata, and its As content was 6.78 times higher than the background value in Zhejiang Province. In addition, there were geochemical anomalies of As, Pb, Zn and other elements in acidic rock masses and their contact zones in Xinchang Township and Fangcun Town, and multiple polymetallic mineralization points such as lead and zinc could be seen in many places, accompanied by strong low-temperature hydrothermal alteration phenomena, forming such heavy metal element enrichment phenomena (Li et al., 2017). These characteristics indicate that the source of PCA F2 is closely related to the geological background of Cambrian strata and rock mass hydrothermal alteration, which belonged to natural sources.
As shown in Table 8 and PCA F3, both Cr and Ni elements in these strata were closely related to the relatively high content of these two elements in the Ordovician Changwu Formation, Lower Cambrian and Silurian sandstones, siltstones and siliceous rocks, showing obvious natural source characteristics. Another major source of Ni and Cr was closely related to industrial waste gas, urban solid waste, and domestic sewage. Changshan County is abundant in mineral resources, with limestone mainly distributed in Huibu Town, fluorite concentrated in the Yanqian Duiwu area of Xinchang Township, and resources such as pyrophyllite, stone coal, and bluestone widely distributed. Some high-value areas of these two elements were located near industrial parks, mines, and chemical plants, such as the southern cement plant in Huibu Town, the fluorite mine in Fangcun Town, and the industrial park in Jinchuan Street. The emissions of industrial activities and transportation dust significantly exacerbate the pollution of farmland in these areas. Other studies had also found that Cr and Ni were related to activities such as mining, smelting, and metal processing (Zhang et al., 2022). Industrial emissions and transportation dust play a significant role in soils with high concentrations of Cr and Ni. Therefore, the main source of PCA F3 is the combined effect of natural and industrial sources.
These high-value areas of PCA F4 were mainly distributed near industrial parks and industrial and mining enterprises. The main sources of Hg pollution includes non-ferrous metal smelting, coal combustion, gold mining, and mercury mining activities (Lu et al., 2020). During the production process of industrial and mining enterprises, Hg may migrate to surrounding farmland in the form of dust. Taking Huibu Town as an example, its large-scale has limed cement enterprise emits 304.498 tons of exhaust particulate matter annually (Yang et al., 2021). The Hg emitted during industrial processes enters the atmosphere and diffuses in gaseous form or adheres to particulate matter, ultimately settling to the surface. The results showed that Hg in the atmosphere mainly enter soil and water through wet deposition (such as rainfall) and dry deposition (in gaseous or particulate form). Atmospheric Hg deposition is one of the main pathways leading to soil pollution in industrial emission areas such as coal-fired power plants, non-ferrous metal smelters, and cement plants (Yang, 2014). The coal combustion process is a significant source of global Hg emissions, and the emitted Hg can migrate over long distances and accumulate in the soil through sedimentation, causing regional pollution (Wu et al., 2015). In the high-value areas of Huibu Town, Jinchuan Street, and Qiuchuan Town, the accumulation of Hg emitted by neighboring industrial and mining enterprises through atmospheric deposition in farmland has led to an increase in Hg content in the soil, causing soil pollution to surrounding farmland. In summary, the main source of principal component F4 is industrial sources, especially the pollution impact of fly ash released from stone coal mines and industrial and mining enterprises on arable land.
4.2 Environmental capacity characteristics and influencing factors of soil heavy metals
4.2.1 Comparison of soil heavy metal static and existing environmental capacity
Through the analysis of the static and existing environmental capacity of heavy metals in the soil of the study area, the results show that the static environmental capacity of each heavy metal in the study area is generally greater than the existing environmental capacity, indicating that the input rate of pollutants exceeds the self-purification capacity of the soil. Among all analyzed elements, the static environmental capacity of Cr, Zn, Pb, Ni, and Cu is much greater than that of Cd, Hg, and As, with Cr having an existing environmental capacity 1340 times that of Cd. This indicates that the soil has a strong ability to accommodate elements such as Cr, Zn, Pb, Ni, and Cu, but a low sensitivity, while having a lower ability to accommodate elements such as Cd, Hg, and As, but a higher sensitivity. When the input amount of these elements increases slightly with high sensitivity, it may quickly destroy the existing state of the soil, leading to varying degrees of pollution, especially Cd, whose sensitivity is most obvious. Overall, the difference between the existing environmental capacity and the static environmental capacity is generally small, and some heavy metals have approached or exceeded the soil’s carrying capacity, especially Cd, whose existing capacity is negative, indicating that overloading pollution has occurred in the region. This phenomenon is consistent with the research results of Tong et al. (2011). On the soil of the Baili Rhododendron mining area in Guizhou, indicating that Cd has strong mobility in the soil, resulting in a much greater decrease in its existing capacity than other heavy metals. In addition, the existing capacity of heavy metals such as Pb, Ni, and As has also decreased, indicating that the accumulation trend of these heavy metals is more severe in some areas, especially in areas with intensive industrial activities. This phenomenon is consistent with the research results of Yan et al. (2024) on soil in industrial pollution areas, which indicate that industrial pollution sources are the main factor leading to a decrease in heavy metal capacity.
4.2.2 Effects of different land use types on soil heavy metal environmental capacity
The research results indicate that there is a significant difference in the static environmental capacity of heavy metals between dryland and paddy fields. In terms of existing capacity, the Cd existing capacity in paddy fields is much lower than that in dry land, which may be related to the slightly acidic pH value of paddy soil. Acidic environment can increase the solubility of Cd, leading to enhanced adsorption capacity of paddy soil for this element (Chen et al., 2022). Similar to the study by Deng et al. (2024), paddy soil has a stronger ability to fix heavy metals due to its higher organic matter content and special hydrological conditions. The difference is that the existing capacity of As and Pb in paddy fields is higher than that in dry land, which may be due to leaching in paddy fields promoting the migration of these heavy metals to the lower soil layers, resulting in overall lower levels of these two heavy metals in paddy fields than in dry land.
4.2.3 Differences in environmental capacity of different heavy metals
The enrichment degree of different heavy metals significantly affects the environmental capacity of soil. The enrichment factors of elements such as Cr, Zn, Pb, Hg, and Ni are relatively low, exhibiting high environmental capacity and light pollution levels, mainly influenced by natural background factors, especially the significant impact of geological conditions on Pb and Ni. In contrast, Cd has a higher enrichment factor and exhibits a significant overload phenomenon. Zhang et al. (2021) found that the active states of Cd (water-soluble, ion exchanged, and carbonate bound) in weathered black shale soils in Zhejiang Province are relatively high, indicating their strong migration ability and environmental activity. Especially in industrial areas and specific geological backgrounds, the environmental capacity of Cd is severely limited, and the risk of pollution increases. The environmental capacity index of As and Cu is relatively low, especially in areas with frequent agricultural and industrial activities, where pollution pressure is high. The study by An et al. (2022) also pointed out that the overloading phenomenon of Cd is particularly prominent in areas with dense industrial and mining activities, indicating that the environmental risk of this element is relatively high in industrial activity areas. Therefore, heavy metals with higher enrichment levels (such as Cd, As, and Cu) are more prone to overloading and require special attention, while heavy metals with lower enrichment levels (such as Cr, Zn, Pb, Hg, and Ni) exhibit higher environmental capacity and lower pollution risk.
4.2.4 Effects of industrial activities on the environmental capacity of heavy metals in soil
The impact of industrial activities on the environmental capacity of heavy metals in soil is particularly significant. The enrichment of heavy metals such as Hg, Cd, Cu, etc. is mainly concentrated near industrial parks and mines. Combined with source apportionment, these elements are closely related to atmospheric deposition, industrial emissions, and mining activities. Especially Hg is mainly from industrial sources, and its warning and overload areas are concentrated in industrial activity areas, reflecting the strong impact of industrial emissions and atmospheric deposition. Previous studies have also shown that in black rock formations affected by human activities such as mining development, the heavy metal content in the soil is significantly higher than the natural background values in undeveloped areas (Wang, 2023). Meanwhile, this study further found that Cu and Cd are greatly affected by emissions from high polluting industries such as metallurgy and chemical engineering. The discharge of mining and industrial waste further exacerbates the enrichment of these heavy metals in the soil, resulting in a significant reduction in soil environmental capacity in these areas.
4.2.5 Effects of agricultural activities on soil heavy metal environmental capacity
Agricultural fertilization is one of the important factors affecting the environmental capacity of heavy metals in soil. The organic fertilizers commonly used in study area exceed the standard content of Cu and Cd, and long-term fertilization leads to the acceleration of the accumulation of these heavy metals in the soil, especially in with frequent agricultural activities. This study also found that agricultural activities significantly affected the capacity of Cd and Cu, especially in areas where organic fertilizers containing Cd and Cu were, the phenomenon of overloading of Cd and Cu was significantly intensified, resulting in a significant decrease in the existing capacity. Therefore, the fertilizer management in agricultural activities urgently need to be improved to avoid further accumulation of heavy metals.
4.2.6 Effects of geological background on soil heavy metal environmental capacity
Different geological backgrounds have a significant impact on the environmental capacity of soil heavy metals. Due to the variation of heavy metal elements released during rock weathering due to differences in lithology, the content of heavy metals in soil and environmental capacity are affected. The research area is widely distributed with black rock formations rich in heavy metals, mainly consisting of dark gray and gray black thin layer carbonaceous siliceous rocks, mudstone siliceous rocks, and siliceous mudstones. The statistical results show that the average current environmental capacity of Cd, Ni, Cu, and Zn in this black rock series are −1.79, 72.23, 26.81, and 178.84 kg·hm−2, respectively, which are significantly lower than the average current environmental capacity of the study area, which are −5.12, 0.78, 0.49, and 0.75 times higher, respectively. Among them, the mudstone of the Xiyangshan Formation in the Upper Cambrian is rich in As, and the current environmental capacity of As in its formation is −54.98 kg·hm−2, indicating an overloaded area, which is much lower than the current environmental capacity of As in the study area of 31.56 kg·hm−2. Combining the distribution of the black rock series (Figure 1) with the spatial distribution of the soil environmental capacity index (Figure 6), it could be clearly seen that there is a significant correspondence between the environmental capacity overload areas of heavy metals such as Cd in the soil and the exposed areas of the black rock series strata, while As mainly corresponds to the limestone of the Xiyangshan Formation. This further proves that the main source of heavy metals such as Cd, Ni, Cu, and Zn in the soil of the study area is the parent material of the black rock series. These rocks release a significant amount of heavy metal elements during weathering, resulting in high soil background values and low environmental capacity, which can easily lead to overloading. On the contrary, rocks such as sandstone, mudstone, and siltstone that are poor in heavy metals generate soils with lower background values, larger environmental capacity, and can withstand more pollution inputs. In addition, special geological structures such as mining areas or rock contact zones are rich in heavy metals, and the soil in these areas has a higher natural content, making the environmental capacity more susceptible to limitations. The weathering and sedimentation processes of rocks also have a significant impact on the migration and enrichment of heavy metals. Rocks rich in metals have a faster weathering rate and accumulate more heavy metals, leading to faster consumption of environmental capacity. Overall, lithology determines the background value of heavy metals in soil, thereby affecting its environmental capacity and pollution carrying capacity.
4.2.7 Spatial distribution of soil heavy metal environmental capacity and pollution prevention and control
Research has shown that the soil heavy metal environmental capacity index in the study area exhibits significant spatial heterogeneity, with some areas reaching or exceeding overload levels, especially in industrial and agricultural activity intensive areas such as Huibu Town, Jinchuan Street, and Fangcun Town. The distribution of elemental environmental capacity index is highly consistent with the source apportionment results. For example, the mixed source characteristics of elements such as Cd, Ni, Cu, Zn, etc. are consistent with the overloaded and low capacity areas in the distribution of environmental capacity index, mainly concentrated in high geological background strata and human activity areas, especially within a 2-km range of large industrial parks and mines and other industrial activity areas. The analysis of As, Pb, and Zn sources reflects the characteristics of natural sources, with overloaded and low capacity areas distributed at the northeast and southwest rock mass contact surfaces and near the Xiyangshan Formation limestone. The source analysis of Cr and Ni indicates that they are a mixture of natural and industrial sources. The environmental capacity index map shows that low capacity and overloaded areas are concentrated in hilly areas, while valley and plain areas are lower. The Hg element mainly comes from industrial sources, and its overloaded and low capacity areas are concentrated around industrial parks and large industrial and mining enterprises. Based on this, the study suggests taking targeted pollution prevention and control measures in these high-risk areas, such as controlling industrial emissions, repairing mining environments, and strengthening agricultural pollution prevention and control, to reduce the negative impact of heavy metals on soil environment and ensure the sustainability of soil quality.
4.3 Influencing factors and mechanisms of dynamic environmental capacity changes
The research results indicate that there are significant differences in the sources of 8 heavy metals in the study area, and different pollution sources determine the input range and intensity of heavy metals in the environment. The maximum decrease in dynamic environmental capacity of Hg is mainly due to industrial activities, especially mining and industrial zone emissions, with high emission intensity and concentration in densely populated areas of industrial and mining enterprises such as Huibu Town, Jinchuan Street, and Qiuchuan Town. Previous studies have also pointed out that industrial emissions and mining activities are the main sources of Hg pollution, and although the pollution diffusion is relatively concentrated, the intensity is high and the impact is significant (Yan et al., 2024). The high mobility of Hg exacerbates its diffusion in soil, further leading to a significant decrease in dynamic environmental capacity (Zhang et al., 2006). The acidic pH in the research area also promotes the migration and morphological transformation of Hg, explaining its dynamic changes. In contrast, the main sources of Cu are natural geological background and agricultural activities. Although its input range is wide, its intensity is relatively low, so the dynamic environmental capacity change of Cu is relatively small. The existing capacity of Cd is negative, indicating that its pollution input has exceeded the soil carrying capacity and has not yet reached dynamic equilibrium. The pollution process is complex and has strong accumulation.
The study also found that the dynamic environmental capacity changed significantly in the first 20 years, presumably due to a lack of timely balance between pollutant input and soil adsorption and output. Over time, soil pollutants undergo processes such as input, output, fixation, dissolution, accumulation, and degradation. The self-purification ability of soil promotes the gradual restoration of environmental capacity balance, and the rate of capacity change slows down and tends to stabilize. The dynamic capacity accumulation reduction rate of As in paddy fields is higher than that in dry land. In paddy field environments, As is prone to react with elements such as iron and manganese, forming insoluble compounds and reducing its availability. However, dry land has less water and slower migration and transformation of As, resulting in a lower accumulation reduction rate.
This study provides important reference for the treatment of heavy metal pollution in soil. Future pollution control strategies should be tailored based on the sources, physicochemical properties, and environmental behavior of different heavy metals, with particular emphasis on controlling the prevention and control of Hg and Cd. Hg should focus on controlling industrial emissions, while Cd needs to pay attention to its accumulation and migration characteristics in agricultural systems, and undergo long-term monitoring and management.
4.4 Limitations and suggestions
This study has limitations to some extent. Firstly, the research mainly focuses on farmland soil and does not cover other land use types, making it difficult to comprehensively assess heavy metal pollution in the region. Secondly, the research focuses on the static distribution of heavy metals in soil, lacking a systematic analysis of their dynamic migration, bioavailability, and interaction with crops in the environment, resulting in an inability to comprehensively assess their long-term risks to ecosystems and human health. In addition, the impact of external environmental factors such as climate change and soil pH on the accumulation and migration of heavy metals has not been fully considered.
In response to the above issues, future research should conduct in-depth analysis of the specific contributions of different pollution sources to the environmental capacity of soil heavy metals, clarify the relative impacts of industry, agriculture, and natural sources, and conduct comprehensive risk assessments, especially in areas with heavy metal overload. In terms of governance suggestions, the first step should be to strengthen the management and restoration of abandoned mines left over from history, especially stone and coal mines, to prevent high heavy metal content rock types from further polluting farmland through atmospheric deposition, mine wastewater flowing into irrigation water and farmland sediment. Secondly, it is necessary to strengthen the supervision of agricultural inputs, improve soil, and restrict the cultivation of high accumulation crops. At the same time, it is necessary to strengthen the supervision of major pollution sources, and for low capacity and overloaded areas, especially Cd polluted areas, soil pollution remediation should be strengthened. These measures will help to enhance soil environmental capacity, slow down the accumulation of heavy metals, and promote the sustainable development of regional ecological environment.
5 Conclusion
The average contents of ω (Cd), ω (Hg), ω (As), ω (Pb), ω (Cr), ω (Ni), ω (Cu), and ω (Zn) in the surface soil of cultivated land in the study area were 0.53, 0.12, 15.33, 34.03, 65.87, 29.06, 30.37, and 99.77 mg·kg−1, respectively, all exceeding the soil background values in the study area. According to the enrichment factor method, Cd was moderately enriched, Cr did not show enrichment characteristics, and other heavy metals were mainly slightly enriched. The results of principal component analysis showed that the main sources of heavy metals in the soil of the study area were divided into four principal components: mixed sources, natural sources, natural and industrial sources, and industrial sources.
The static environmental capacity of heavy metals in the surface soil of cultivated land in the study area was in the order of Cr > Zn > Pb > Ni > Cu > As > Hg > Cd from high to low. The average existing capacities of Cd, Hg, As, Pb, Cr, Ni, Cu, and Zn were −0.35, 0.90, 31.56, 140.56, 428.77, 93.19, 55.12, and 239.99 kg·hm−2, respectively. Among them, the average existing capacity of Cd was significantly lower in paddy fields than in dry land, and the decrease in existing capacity of Cd was the largest. Over time, the dynamic environmental capacity of heavy metals in soil showed a decreasing trend. Overall, there was a significant difference in the environmental capacity index of heavy metals in the soil within the study area. Cr, Pb, Hg, Ni, Zn, and Cu were mildly polluted, while As pollution was more severe, and Cd was already overloaded. The comprehensive capacity index was 0.66, indicating that the overall soil heavy metal environmental capacity in the study area was in a low capacity zone, with serious pollution problems and significant influence from geological background. However, in areas such as Huibu Town, Baishi Town, Jinchuan Street, and Fangcun Town, due to the combined impact of industrial and agricultural activities, there had been an excessive consumption of soil heavy metal environmental capacity.
The ranking of dynamic environmental capacity and static environmental capacity is consistent. The dynamic environmental capacity of the seven heavy metals, from high to low, is Cr > Zn > Pb > Ni > Cu > As > Hg, and the dynamic annual capacity of all heavy metals gradually decreases with the increase of control years. The cumulative reduction rate of dynamic environmental capacity is ranked as Hg > Cr > As > Pb > Cd > Ni > Zn > Cu, with Hg having the highest reduction rate, indicating its most significant change in soil. In addition, the dynamic capacity accumulation reduction rate of As in paddy fields is significantly higher than that in dry land, which may be related to the mobility and elemental reactions in paddy field environments.
The result has shown that heavy metal pollution in the soil of Changshan County is significantly influenced by factors such as geological background, industrial activities, and agricultural inputs. For medium capacity areas, it is recommended to strengthen the supervision of mine restoration and industrial emissions, promote green agricultural technologies to reduce the use of fertilizers and pesticides, and regularly monitor the dynamic changes of soil heavy metals. For low capacity and alert areas, the focus should be on soil pollution remediation. This provides scientific basis and action guidance for future pollution control and soil remediation.
Data availability statement
The original contributions presented in the study are included in the article/supplementary material, further inquiries can be directed to the corresponding author.
Author contributions
MW: Writing – review and editing, Writing – original draft.
Funding
The author(s) declare that no financial support was received for the research and/or publication of this article.
Acknowledgments
I would like to thank both Li Hepeng from Zhejiang Academy of Forestry and Huang Biao from Nanjing Institute of Soil Research, Chinese Academy of Sciences for their valuable suggestions regarding manuscript revisions.
Conflict of interest
The author declares that the research was conducted in the absence of any commercial or financial relationships that could be construed as a potential conflict of interest.
Generative AI statement
The author(s) declare that no Generative AI was used in the creation of this manuscript.
Publisher’s note
All claims expressed in this article are solely those of the authors and do not necessarily represent those of their affiliated organizations, or those of the publisher, the editors and the reviewers. Any product that may be evaluated in this article, or claim that may be made by its manufacturer, is not guaranteed or endorsed by the publisher.
References
An, W. C., Wang, Y. L., Wang, J. S., Wang, F. Y., and Zhang, S. W. (2022). Research on background concentrations of agricultural land soil heavy metals and heavy metal environmental capacity in Qingdao City. J. Guangxi Univ. Nat. Sci. Ed. 47, 1662–1669. doi:10.13624/j.cnki.issn.1001-7445.2022.1662
Burns, W. A., Mankiewicz, P. J., Bence, A. E., Page, D. S., and Parker, K. R. (1997). A principal-component and least-squares method for allocating polycyclic aromatic hydrocarbons in sediment to multiple sources. Environ. Toxicol. Chem. 16, 1119–1131. doi:10.1002/etc.5620160605
Carlon, C., Critto, A., Marcomini, A., and Nathanail, P. (2001). Risk based characterisation of contaminated industrial site using multivariate and geostatistical tools. Environ. Pollut. 111, 417–427. doi:10.1016/S0269-7491(00)00089-0
Chen, Z. H., Wang, B. G., and Zhao, J. F. (2022). Adsorption and desorption characteristics of Cd in upland and paddy soil of jianghan plain. Earth Sci. 47, 544–555. doi:10.3799/dqkx.2021.108
Cheng, J., Bi, J. B., Wu, J., and Yang, G. X. (2011). Prediction of the trend for soil pollution of heavy metals in soils at Huzhou and evaluation of the environmental capacity. Earth Environ. 39, 531–535. doi:10.14050/j.cnki.1672-9250.2011.04.012
Dai, X. Y., Shen, Z. C., Hu, H. L., Shi, H. D., He, Z. X., Li, L., et al. (2024). Evaluation assessment and source analysis of heavy metals in sediment near the stone coal mining area in the lower reaches of the Zi River, China. J. Agro-Environ. Sci. 43, 1123–1130. doi:10.11654/jaes.2023-1016
Deng, F., Wu, A. N., and Zhu, M. J. (2024). Effect of paddy-upland rotation on pH, organic matter and heavy metal content of soil. Hubei Agr. Sci. 63, 18–23+28. doi:10.14088/j.cnki.issn0439-8114.2024.10.004
Eli, A., Eziz, M., Jin, W. G., and Li, G. X. (2020). Environmental capacity of heavy metals in farmland soils in Yanqi basin, Xinjiang. Environ. Eng. 3, 168–173. doi:10.13205/j.hjgc.202003028
Fan, J. N., Tian, W. J., Zhang, Y., Guo, L., Du, W., Xong, J., et al. (2022). Environmental capacity analysis and prediction of heavy metal Cd in regional soil background environmental capacity. Environ. Sci. Technol. 45, 241–246. doi:10.19672/j.cnki.1003-6504.1454.21.338
Fu, C. C., Wang, W. Y., Pan, J. J., Lu, H. D., and Liao, Q. L. (2014). Research of heavy metal environmental capacity in Lishui District, Nanjing. Chin. J. Soil Sci. 45, 734–742. doi:10.19336/j.cnki.trtb.2014.03.037
Hernandez, L., Probst, A., Probst, J. L., and Ulrich, E. (2003). Heavy metal distribution in some French forest soils: evidence for atmospheric contamination. Sci. Total Environ. 312, 195–219. doi:10.1016/S0048-9697(03)00223-7
Li, L. C., Zhou, Y., Tan, J., Li, W., Yang, W. F., Yuan, Y., et al. (2017). Survey and evaluation report on lead, zinc, and polymetallic mineral resources in Fangcun area, Changshan County, Zhejiang Province. Hangzhou: Zhejiang Geological Prospecting Institute of China Chemical Geology and Mine Bureau.
Liu, D. R., Xu, H., Zhou, Y., Hou, J. G., Song, Y. Q., and Weng, Y. R. (2019). Characteristics and genetic analysis of selenium-rich soil in Changshan County, western Zhejiang province. Geophys. Geochem. Explor. 43, 658–666. doi:10.11720/wtyht.2019.1415
Liu, H., Wei, W., Song, Y., and Pan, Y. (2023). Evaluation and prediction of environmental capacities of heavy metals in the surface sediments of lakes in Huoqiu county. Environ. Sci. 44, 6106–6115. doi:10.13227/j.hjkx.202211011
Liu, P. J., Wu, K. N., Luo, M., Li, C. X., Zhu, P. T., Zhang, Q., et al. (2016). Evaluation of agricultural land soil heavy metal elements exceed standards and safe utilization zones. T. Chinese Soc. Agr. Eng.(Transactions CSAE) 32, 254–262. doi:10.11975/j.issn.1002-6819.2016.23.035
Lu, X. Z., Wei, Y. C., Huang, C. L., Gu, A. Q., and Wu, X. F. (2020). Characteristics of heavy metal pollution in soil in typical black shale area in the lower reaches of the Yangtze river. Environ. Ecol. 2, 29–38.
Lv, Y. F., Xie, L., Zhu, W. J., Zhou, Y., and Sun, H. (2020). Risk prediction of heavy metals in farmland soil based on environmental capacity case study of the county scale in Northern Zhejiang provinc. Resour. Environ. Yangtze basin. 29, 253–264. doi:10.11870/cjlyzyyhj202001023
Ma, H. Y., Yang, X. D., and Lv, G. H. (2016). Tendency prediction about soil environmental capacity of heavy metals in Jinghe county in recent 100 years. Xinjiang Agr. Sci. 53, 1521–1532. doi:10.6048/j.issn.1001-4330.2016.08.022
Marhaba, T., Mamattursun, E., Aynur, M., and Wang, W. W. (2020). Evaluation and prediction of environmental capacities of heavy metals in Vineyard soils in the Turpan basin. Earth Environ. 48, 584–592. doi:10.14050/j.cnki.1672-9250.2020.48.078
Ministry of Agriculture of the People's Republic of China (2012). NY525-2012, organic fertilizers. Beijing: China Agriculture Press.
Ministry of Ecology and Environment of the People’s Repulic of China,State Administration for Maket Regulation (2018). GB15618-2018, Soil environmental quality risk control standard for soil contamination of agricultural land. Beijing: China Environmental Science Press.
Ministry of Land and Resources of the People’s Republic of China (2016). Specification of land quality geochemical assessment (DZ/T 0295-2016). Beijing: China Geological Press.
Song, M. Y. (2009). Supergenic geochemistry and environmental effects of Selenium and heavy metals in the lower Cambrian black series of western Zhejiang Province, China. China: Hefei University of Technology. PhD Thesis.
Sutherland, R. A. (2000). Bed sediment-associated trace metals in an urban stream, Oahu, Hawaii. Environ. Geol. 39, 611–627. doi:10.1007/s002540050473
Tang, Z., Qiu, J. J., Chen, X. X., and Zou, G. Y. (2012). Effects of different organic fertilizer management on the heavy metal cumulate of organic planting. Guangdong Agr. Sci. 39, 95–97. doi:10.16768/j.issn.1004-874x.2012.16.011
Tong, X. Y., Yang, Y. J., and liu, H. (2011). Study on potential ecological risk and environmental capacity of heavy metal in soil nearby Baili Rhododendron mining areas. J. Anhui Agri 39, 2146–2148. doi:10.13989/j.cnki.0517-6611.2011.04.076
Wang, M. H. (2023). Source analysis of heavy metals in typical farmland soils based on PCA-APCS-MLR and Geostatistics. Environ. Sci. 44, 3509–3519. doi:10.13227/j.hjkx.202208002
Wei, F. S., Chen, J. S., Wu, Y. Y., and Zheng, C. J. (1991). Study on the background value of soil environment in China. Environ. Sci. 12 (12-19), 94. doi:10.13227/j.hjkx.1991.04.005
Wu, F. Q., Liang, Z., Wang, Y. L., Xue, Y. Y., and Wang, G. Y. (2015). Study on the status of global atmospheric mercury emission inventory. Adm. Tech. Environ. Monit. 27, 18–21.
Wu, K. Q., Yu, G. H., Han, J. C., Zhou, Z., and Li, W. H. (1991). Study report on regional stratigraphy, geophysical and geochemical parameters of Zhejiang Province.Hangzhou: Zhejiang Institute of Geophysical and geochemical exploration, 246–247.
Xia, Z. L. (1993). Regional differentiation of critical concentration and environmental capacity of some heavymetals for the main soil types in China. Acta Geogr. Sin. 4, 297–303. doi:10.11821/xb199304001
Xie, H. S., Guo, X. M., Pan, W. F., Xiao, H., Huang, C. L., Chen, G. F., et al. (2017). 1:250,000 multi-target geochemical survey results in northwest Zhejiang, 61. Hangzhou: Zhejiang Institute of Geological Survey.
Xing, X. L., Zhou, A. G., Liang, H. C., and Ma, Z. X. (2005). Appraisal for the soil environm ental quality in nan chang city. Guizhou Geol. 3, 29–33.
Yan, L. P., Xie, X. M., and Tang, Z. H. (2024). Study on soil heavy metal environmental capacity in Shantou City based on Source analysis. Earth Sci. Front. 31, 403–416. doi:10.13745/j.esf.sf.2024.4.23
Yan, M. C., Chi, Q. H., Gu, T. X., and Wang, C. S. (1997). Chemical compositions of continental crust and rocks in eastern China. Geophys. Geochem. Explor. 21, 451–459.
Yang, H. (2014). Study on atmospheric mercury emission and control strategies from cement production in China. China: Tsinghua University.
Yang, Q., Qin, H. Y., Yu, W. C., and Chen, S. C. (2021). Analysis report on pollution sources of arable land in changshan county. Wenzhou: Zhejiang Province Eleventh Geological Team, 7–101.
Ye, S. Z. (1993). Application of soil environmental background values in capacity calculation and environmental quality assessment. Environ. Monit. China 3, 52–54.
Yu, G. J., Cheng, J. M., Wang, Z. X., Mu, J. B., and Xing, L. X. (2009). Soil-environmentalcapacity in different vegetative types in Shandong Province. Chin. J. Soil Sci. 40, 366–368. doi:10.19336/j.cnki.trtb.2009.02.035
Yu, Q. Y., Li, W. Y., Zhang, N., Zhao, L., Wang, Y. M., Song, J. Y., et al. (2024). Present pollution status and safe utilization technologies of heavy metal-polluted farmland. Soils 56, 229–241. doi:10.13758/j.cnki.tr.2024.02.001
Zeng, S. Y., Yu, H. C., Ma, J., Liu, J. N., and Chen, F. (2022). Identifying the status of heavy metal pollution of cultivated land for tradeoff spatial fallow in China. Acta Pedol. Sin. 59, 1036–1047. doi:10.11766/trxb202009270541
Zhang, H. X., Cai, A. Z., Zhao, H. P., Zhao, Y. W., Wang, X. J., Wang, L. T., et al. (2022). Source apportionment of metals in atmospheric deposition of a typical industrial city based on PMF and APCS-MLR and comprehensive pollution assessment. Chin. J. Environ. Eng. 16, 3816–3827. doi:10.12030/j.cjee.202205110
Zhang, M. K., Fu, J. L., Gu, G. P., and Huang, C. Y. (2006). Chemical forms, transformation and adsorption of mercury in the soils of the Changjiang Deltaand Zhujiang Delta. J. Safe. Environ. 6, 1–5.
Zhang, S., Xu, Y. F., Wu, M. J., Mao, X. L., Yao, Y. C., Shen, Q., et al. (2021). Geogenic enrichment of potentially toxic metals in agricultural soils derived from black shale in northwest Zhejiang, China: pathways to and risks from associated crops. Ecot. Environl. Safe. 215, 112102. doi:10.1016/j.ecoenv.2021.112102
Zhang, Y. Y., Ma, J., Wei, H. Y., and Shi, T. R. (2019). Heavy metals in typical farmland soils of Zhejiang Province: levels, sources and ecological risks. Ecol. Environ. Sci. 28, 1233–1241. doi:10.16258/j.cnki.1674-5906.2019.06.020
Zhou, J. Y., Hou, J. G., Cao, M. Y., Zhang, M., and Hu, B. (2023). Analysis report on agricultural land pollution sources in Changshan county. Hangzhou: Zhejiang Geological Prospecting Institute of China Chemical Geology and Mine Bureau.
Zhou, Y., Li, L. C., Liu, D. R., Gu, L. F., Liu, Y., Song, Y. Q., et al. (2019). Geological survey report on land quality in Changshan county. Hangzhou: Zhejiang Geological Prospecting Institute of China Chemical Geology and Mine Bureau.
Keywords: black rock series, cultivated soil heavy metals, source apportionment, environmental capacity, enrichment factor, spatial distribution
Citation: Wang M-h (2025) Assessment of heavy metal pollution sources and environmental capacity of typical farmland soils in northwestern Zhejiang based on the geological background of black rock series. Front. Environ. Sci. 13:1601205. doi: 10.3389/fenvs.2025.1601205
Received: 27 March 2025; Accepted: 05 June 2025;
Published: 26 June 2025.
Edited by:
Oliver Matthias Wiche, Zittau/Görlitz University of Applied Sciences, GermanyReviewed by:
Precious Okoroafor, City Department of Climate Protection and Adaptation, GermanyKatarzyna Szopka, Wroclaw University of Environmental and Life Sciences, Poland
Copyright © 2025 Wang. This is an open-access article distributed under the terms of the Creative Commons Attribution License (CC BY). The use, distribution or reproduction in other forums is permitted, provided the original author(s) and the copyright owner(s) are credited and that the original publication in this journal is cited, in accordance with accepted academic practice. No use, distribution or reproduction is permitted which does not comply with these terms.
*Correspondence: Mei-hua Wang, d21oMTM4NTgwNzgzMTJAMTI2LmNvbQ==