 Georgia Destouni
 Mohanna Zarei
- 1Department of Physical Geography, Stockholm University, Stockholm, Sweden
- 2Department of Sustainable Development, Environmental Science and Engineering, KTH Royal Institute of Technology, Stockholm, Sweden
It is largely unknown, yet essential for the Baltic Sea state, the nutrient and pollutant loads from land, and the coastal-marine ecosystem health how freshwater discharges to the sea and their drought and flood extremes vary and change over the Baltic Sea Drainage Basin (BSDB). Based on four different (types of) datasets, we here compare these variations and changes over 1980-2010 across 69 large hydrological catchments in the BSDB. The datasets agree that the precipitation changes over the study period do not necessarily propagate to analogous changes for runoff and related discharges to the sea, with results showing various contrasting precipitation and runoff changes. The datasets differ markedly in that some model-based reanalysis datasets yield directly opposite water balance closures, implying persistent 30-year average regional storage wetting or drying depending on the dataset. For droughts and floods, dataset differences are overall greater for runoff than for precipitation, and widely used reanalysis data do not fully capture how extremely high and low flood- and drought-related runoff fluxes can be, as observed in the BSDB. These findings are important for plans and preparations to mitigate and/or adapt to changes and extremes in the Baltic freshwater conditions and discharges to the sea.
1 Introduction
The flows of water on land and associated freshwater discharges from land to the sea—along with the loads of nutrients and pollutants these discharges carry—are essential for the quality and ecosystem health of coastal and marine waters (Häder and Barnes, 2019). To appropriately manage and plan for mitigating or adapting to changes in these discharges and their drought (low-flow) and flood (high-flow) extremes, the spatial covariations and temporal coevolution of water, climate, and other environmental and societal conditions need to be understood. This understanding is confused, however, by key knowledge gaps and open research questions (Blöschl et al., 2019; Zarei and Destouni, 2024a), along with the large spatiotemporal variability of water conditions and water-influencing human activities on land (Althoff and Destouni, 2023; Teuling et al., 2019). The combination may lead to quantification discrepancies and uncertainties between different observation- and model-based datasets for the same terrestrial water flux variables around the global land area (Zarei and Destouni, 2024b), calling for improved quantification of the variations and changes, and the drought and flood extremes, of the water fluxes on land and discharges to the sea.
Water balance closure is key to constraining and testing the realism of various dataset representations of the main water fluxes, storage changes, and their relationship on land. The main fluxes are those of precipitation (P), evapotranspiration (ET), and runoff (R; discharge divided by the contributing hydrological catchment area), and the associated water storage change (DS) that a possible imbalance of these fluxes implies as DS = P-ET-R. This water balance relationship applies at all scales, including various temporal ones (Berghuijs et al., 2014), and spatially over each hydrological catchment (Destouni and Verrot, 2014), multiple catchments in regional aggregations (Berghuijs et al., 2019; Moshir Panahi et al., 2020), and over the global land area (Lehmann et al., 2022). Different datasets can be used to quantify this relationship and the variations and changes in the linked hydro-climatic variables (Zarei and Destouni, 2024b), along with those of other climatic and additional driver-pressure variables (Althoff and Destouni, 2023; Teuling et al., 2019). As mentioned, the datasets may then disagree in their quantifications of the water fluxes and implications for water storage changes and discharge extremes. In view of this, we here aim to decipher: (i) if and how such dataset disagreements emerge for the runoff and discharges of water from the Baltic Sea Drainage Basin (BSDB); (ii) what the dataset agreements and differences are for the discharge extremes under droughts and floods; and (iii) which datasets are more and less realistic and relevant for the water aspects of (i)–(ii) in the BSDB.
To this end, we use the four comparative datasets included in the Baltic Hydro-Climatic Data (BHCD) synthesis for the BSDB by Zarei and Destouni (2025a). This was extracted from the Global Hydro-Climatic Data (GHCD) reported by Zarei and Destouni (2024b), using consistent catchment selection criteria for data quality and spatial and temporal coverage. Each dataset in the BHCD facilitates water balance closure for 69 non-overlapping hydrological catchments within the BSDB (Figure 1A), selected to fulfil the criteria of continuous multi-decadal data time series over the 30-year period 1980–2020. The Baltic multi-dataset and multi-catchment synthesis of the BHCD (Zarei and Destouni, 2025b) samples a broad range of hydro-climatic conditions, with widespread spatial coverage across the BSDB, based on which the research questions (i)–(iii) can be reasonably addressed.
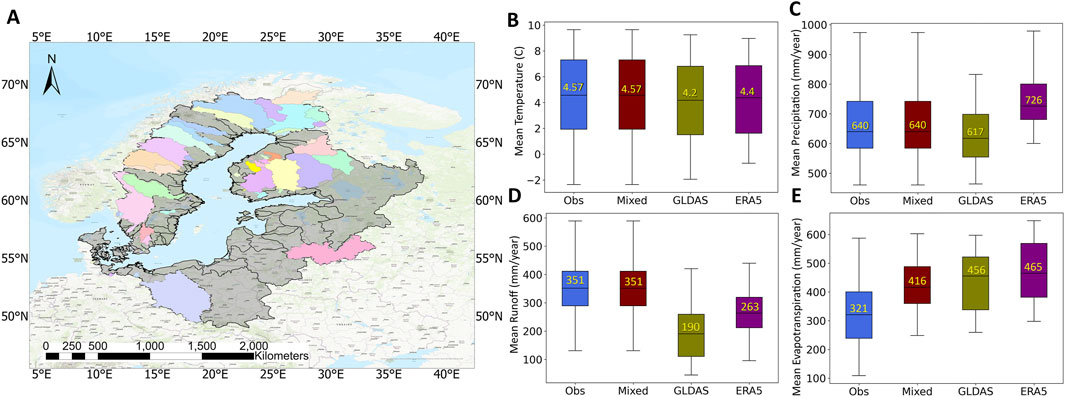
Figure 1. Locations and hydro-climatic variability of the 69 hydrological study catchments. (A) Map of the 69 non-overlapping catchments (colored fields) within the total Baltic Sea Drainage Basin (colored and gray fields). Boxplot statistics for the catchment-wise spatial and temporal (1980-2010) average (CSTA) values of: (B) air temperature at the land surface, (C) precipitation, (D) runoff, and (E) evapotranspiration, as obtained from the comparative datasets Obs, Mixed, GLDAS, and ERA5. Each boxplot shows the following CSTA statistics across catchments: median value (mid-line number), interquartile range (IQR: box, showing the middle 50% of the data), and data range up to 1.5 times below the 25% and above the 75% quartile values of the IQR.
2 Methods
The catchments included in the BHCD synthesis (Figure 1) have a total area of 722,235 km2 (Zarei and Destouni, 2025a), corresponding to nearly half of the total area of the BSDB (Hannerz and Destouni, 2006). These 69 Baltic catchments were selected consistently with the worldwide catchment selection in the GHCD (Zarei and Destouni, 2024b), based on requirements for the catchment data time series to: (a) include a minimum of 300 non-missing monthly runoff values over the total study period of 30 years; (b) be available for each comparative dataset; and (c) have maximal non-overlapping spatial coverage by including the largest possible catchments meeting the other inclusion criteria (a–b). These criteria were used for comprehensive and harmonized spatiotemporal data coverage, with open data accessibility. The criterion of non-overlapping catchments (c) was used to avoid double- or multi-counting of the same overlapping hydro-climatic conditions in the regional statistics.
The four comparative datasets in the BHCD, consistent with the GHCD, are: (I) Obs, based on in-situ measured data for runoff (R) (Do et al., 2018; Gudmundsson et al., 2018) and precipitation (P) (Schneider et al., 2016) and modelled data for average annual evapotranspiration (ET) based on the simplified water balance model ET ˜ P-R, assuming negligible average water storage change (DS ≈ 0); (II) Mixed, based on the same R and P data as Obs but using a different ET model, the “Global Land Evaporation Amsterdam Model” (GLEAM; Martens et al., 2017; Miralles et al., 2011), which facilitates calculation of water storage change as DS = P-ET-R; and two global reanalysis products that each provide a complete set of P, ET, and R data, from which DS can also be calculated as DS = P-ET-R, including (III) the “Global Land Data Assimilation System” (GLDAS; Beaudoing and Rodell, 2019; Rodell et al., 2004), and (IV) the “ECMWF Reanalysis 5th Generation” (ERA5; Hersbach et al., 2017) described in further detail by Hersbach et al. (2020). Additionally, data for air temperature at the surface (T) are also included in Obs and Mixed from GHCN-CAMS (Fan & Van den Dool, 2008), and in GLDAS and ERA5 from the corresponding reanalysis products.
Zarei and Destouni (2025a) provide further descriptions and details of the BHCD, including its data structure and metadata. Supplementary Material S1 explains in more detail the catchment selection approach. The selection of catchments is constrained by the availability of long-term, quality-controlled monitored discharge data, obtained in this study from the GSIM dataset (Do et al., 2018; Gudmundsson et al., 2018). The necessity of such discharge data is unavoidable for relevant water balance-constrained comparisons and reality checks of how different types of datasets agree and/or disagree with each other and with actual observation data in their representations of runoff and freshwater discharges from land to the sea. The monitoring data requirements imply a sampling bias toward catchments with existing hydrological infrastructure and monitoring capacity, and an underrepresentation of less-developed or remote parts of the BSDB—as is the case for other data-poor regions around the world—more or less similarly when using GSIM (Zarei and Destouni, 2024b) or other discharge datasets with comparable spatial coverage (Althoff and Destouni, 2023). In fact, the spatial bias is considerably smaller for the BSDB—with nearly half of its total area covered by the discharge data from GSIM—than the average spatial coverage globally by such high-quality long-term discharge data, which is typically no more than around one-third of the world’s total land area, excluding Antarctica (Althoff and Destouni, 2023; Zarei and Destouni, 2024b).
To identify and decipher key agreements and disagreements among the comparative datasets in the BHCD, we compare how each dataset quantifies the same hydro-climatic variation and change statistics of relevance for the freshwater discharges to the Baltic Sea. For annual average hydro-climatic conditions, the dataset comparisons concern the condition variations spatially among the catchments, and the temporal condition changes over the 30-year study period 1980-2010, and from the first (1980-1994) to the second (1995-2010) half of the period.
For the key water fluxes of precipitation and runoff, monthly fluxes are assessed separately for winter (DJF), spring (MAM), summer (JJA), and autumn (SON). The monthly flux assessments include the following statistics across catchments: median values; temporal coefficients of variation (CV (s/m); standard deviation (s) divided by the mean value (m)); and 1st and 99th percentile values of the monthly fluxes in each season over each of the subperiods 1980-1994 and 1995-2010. The 1st and 99th percentile values bound the lowest and highest 1% of the monthly fluxes, indicating the drought- and flood-related flux conditions, respectively, for each season and subperiod. The subperiod division yields a sample size of 3,105 monthly flux values for each 3-month season over the 15 years of each sub-period across the 69 catchments. This can reasonably indicate essential agreements and disagreements in how the comparative datasets represent the studied regional statistics and their changes between the sub-periods.
3 Results
3.1 Variations and changes in water fluxes and storages
Figures 1B–E show boxplot statistics across the study catchments for the catchment-wise spatial and temporal (1980-2010) average (CSTA) values of air temperature at the land surface, and the fluxes of precipitation, runoff, and evapotranspiration. All datasets agree well on the CSTA statistics for temperature (Figure 1B). For precipitation, runoff, and evapotranspiration, the datasets differ more (Figures 1C–E). The flux differences are particularly important for the water storage changes they imply through the water balance relationship for each catchment (DS = P-ET-R; Figure 2A). On average across the catchments, this yields opposite directions for the regional area-weighted average water storage change implied by the Mixed and ERA5 datasets (Figure 2B). Specifically, Mixed yields overall negative, while ERA5 yields overall positive, storage change, implying persistent regional area-weighted average storage drying versus storage wetting, respectively, continuously over the whole 30-year study period across the BSDB catchments. In contrast to these opposite ERA5 and Mixed implications, but consistent with the DS ≈ 0 assumption of Obs, the regional area-weighted average storage change implied by GLDAS varies closely around zero over the whole study period.
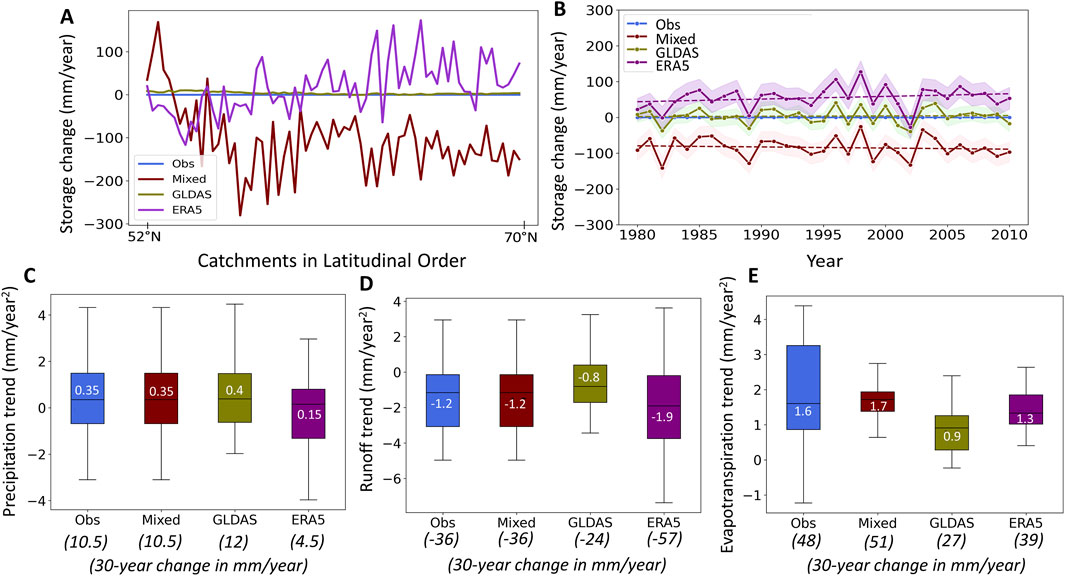
Figure 2. Terrestrial water changes across the Baltic study catchments. (A) The 30-year average storage change for each catchment in longitudinal order, and (B) the regional area-weighted average annual storage changes (solid lines) with associated regression lines fitted over 1980–2010 (dashed lines) and bands of ± one standard deviation around the average annual values (shaded areas). Boxplots of statistics across catchments are further illustrated for the slopes (in mm/year2) of regression lines fitted to the temporal variations over 1980–2010 of each catchment’s annual: (C) precipitation (P), (D) runoff (R), and (E) evapotranspiration (ET); the values written in parentheses below the boxplots show the changes over the 30 years of the study period 1980–2010 (in mm/year) implied by the median regression line slopes across all catchments. Each boxplot in panels (C–E) shows the slope statistics: median value (mid-line number), interquartile range (IQR: box, showing the middle 50% of the data), and data range up to 1.5 times below the 25% and above the 75% quartile values of the IQR. Each panel compares these results for the different datasets Obs, Mixed, GLDAS, and ERA5; note that the storage change implied by Obs is zero by assumption.
The storage change implications of Mixed and ERA5 are physically unreasonable for several reasons:
1. The directly opposite implications for the 30-year regional area-weighted average storage change—persistent wetting in ERA5 versus persistent drying in Mixed (Figure 2B; with the dataset differences far exceeding the respective standard deviation bands for each dataset)—which clearly cannot both be real for the same region at the same time.
2. The 30-year regional average cumulative water level rise for ERA5 and drop for Mixed that their respective area-weighted average water storage changes imply; such water level changes are unreasonably large in both directions. Consider, for example, the regional average groundwater table level existing beneath the entire land surface of all catchments. This would rise by 1.3–1.7 m according to ERA5 and drop by 8.5–11 m according to Mixed, based on their respective area-weighted average storage change values and a typical average aquifer porosity value of around 0.3–0.4. Such dramatic average water level changes are not seen or reported across the BSDB catchments (see further discussion about this below).
3. The much larger spatial variations emerging from both ERA5 and Mixed for the local catchment-wise average water storage changes—even between directly adjacent catchments (around the respective directly opposite area-weighted average storage change levels implied by these datasets)—than the corresponding variations seen for GLDAS (Figure 2A). Such large spatial variations are physically unexplained and unrealistic for nearby catchments sharing similar overarching hydro-climatic conditions.
Further regarding reason (2), water level drops of the overall average magnitude implied by Mixed may occur locally—for example, in some drying and/or highly water-consuming parts of the world (Destouni et al., 2010; Moshir Panahi et al., 2020)—but have not been reported and are unrealistic on average across the Baltic study catchments. Such a regional average water level drop would be dramatically notable if it had really occurred. The regional average water level rise implied by ERA5 is also physically unrealistic, considering that groundwater levels in this region are typically around 1–2 m below the land surface (Verrot and Destouni, 2015); a regional average groundwater level rise of the same magnitude—i.e., full water saturation more or less all the way up to the surface—is also not reported and would be dramatically notable, e.g., for forestry and agriculture, if it had actually occurred.
Despite their differences for water storage changes, the datasets more or less agree on the median water flux changes across the catchments (Figures 2C–E). The datasets consistently show a relatively small median increase in precipitation by 4.5–12 mm/year, a considerably greater median increase in evapotranspiration by 27–51 mm/year, and a median decrease in runoff by 24–57 mm/year over the 30-year period. Regarding clear dataset disagreements, ERA5 differs most from the other datasets for both runoff and precipitation, as well as in the spatial variability of changes around the median change values (i.e., spatially between catchments; shown by the boxes and whiskers in Figures 2C–E). Obs differs from the other datasets for the spatial variability of ET, as its assumption of ET = P-R with DS = 0 implies no storage change that can dampen the evapotranspiration variations calculated in this way (Figure 2E). Yet, this deviation for Obs is still smaller than the spatial variability deviation of ERA5 for runoff (Figure 2D; note that the y-axis scale for R in Figure 2D is greater than that for ET in Figure 2E).
3.2 Flux seasonality and drought-flood extremes
Considering the seasonal variations in monthly precipitation and runoff, the datasets agree that the catchment-median monthly precipitation is greatest, while the corresponding monthly runoff is essentially smallest in the summer (JJA; Figures 3A,B), when monthly evapotranspiration is also large (not shown); note that Obs and Mixed include the same precipitation and runoff data and are therefore shown together in Figures 3, 4. The datasets also largely agree on the median seasonal values and temporal CV of monthly precipitation (Figures 3A,C), even though ERA5 overall implies somewhat larger values, as it does for annual precipitation (Figure 1C).
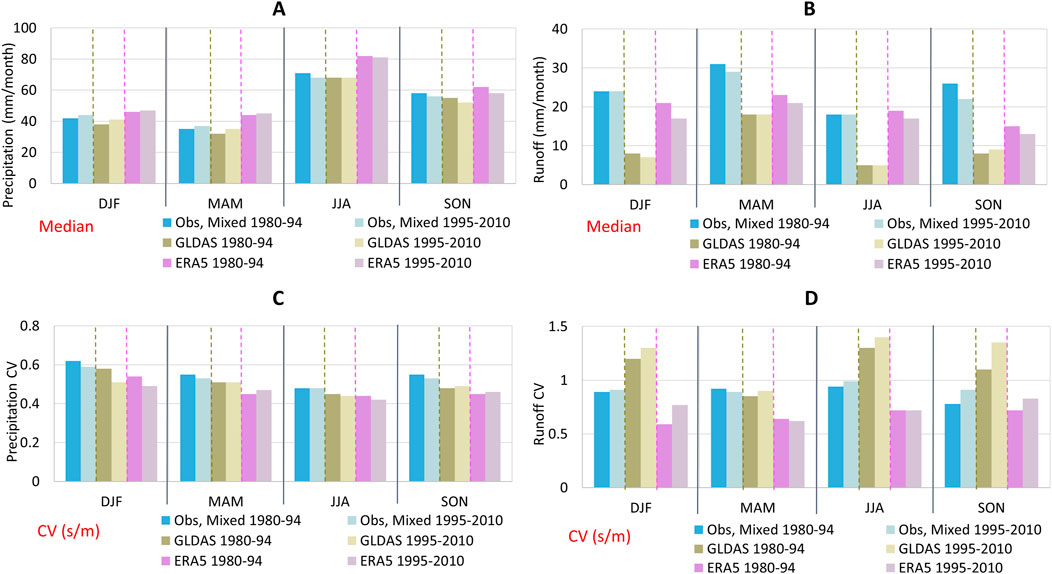
Figure 3. Seasonal statistics of precipitation and runoff over 1980–1994 and 1995–2010 across the Baltic catchments. The statistics shown are: the median monthly (A) precipitation and (B) runoff, and the temporal coefficient of variation (CV; standard deviation divided by the mean (s/m)) of monthly (C) precipitation and (D) runoff in winter (DJF), spring (MAM), summer (JJA), and autumn (SON) for all datasets, Obs, Mixed, GLDAS, and ERA5.
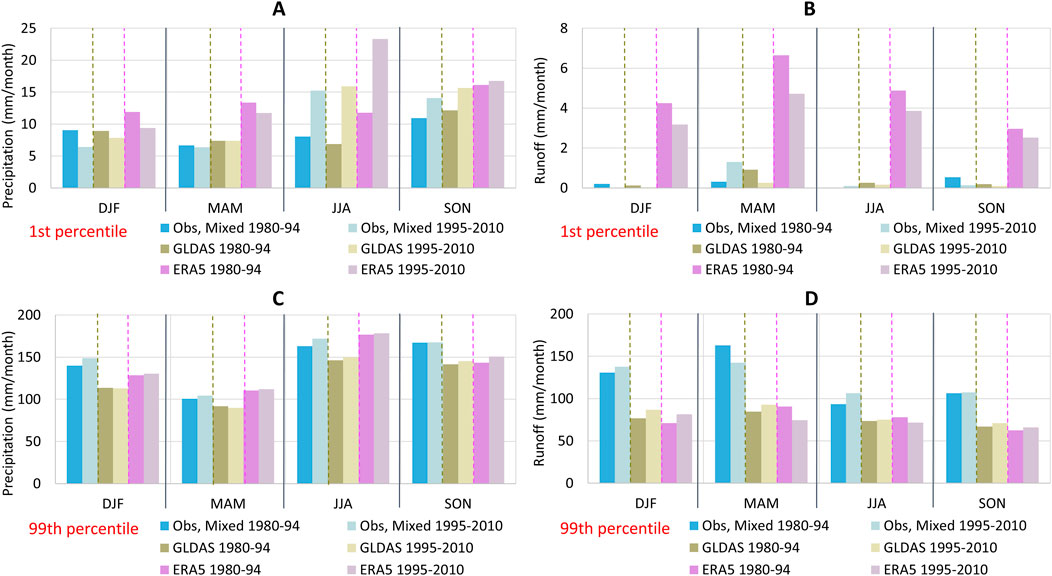
Figure 4. Seasonal 1st and 99th percentile values for monthly precipitation and runoff over 1980–1994 and 1995–2010 across the Baltic catchments. The 1st percentile values for monthly (A) precipitation and (B) runoff, and the 99th percentile values for monthly (C) precipitation and (D) runoff are shown for the seasons of winter (DJF), spring (MAM), summer (JJA), and autumn (SON).
With regard to changes from the first to the second half of the study period, the datasets largely agree that the median monthly precipitation has slightly increased in winter and spring, remained more or less the same in summer, and slightly decreased in autumn. For the median monthly runoff, when the datasets show a change between the subperiods, that is mostly a decrease. The datasets also agree in showing decreased temporal CV of monthly precipitation across the seasons and datasets (Figure 3C), but increased CV of monthly runoff except in spring (Figure 3D).
Regarding dataset differences, these are overall greater for both the median and the CV of monthly runoff (Figures 3B,D) compared to precipitation (Figures 3A,C). For runoff, the GLDAS and ERA5 datasets, with runoff data from global land surface and climate modelling, respectively, show overall smaller median runoff values across the seasons than the Mixed and Obs datasets with runoff data based on ground observations (Figure 3B).
For the drought and flood extremes of monthly precipitation and runoff, we compare the 1st and 99th percentile values that bound the lowest and the highest 1% of these monthly fluxes in the different seasons, respectively, and indicate the changes in these extremes from the first to the second half of the study period (Figure 4). Previous work has shown that changes in the 1st and 99th percentile values for monthly fluxes are consistent with the changes in the corresponding percentile values for more fine-resolved, daily flux intensities, even though the monthly averaging to some degree dampens the change magnitudes compared to those of the daily flux intensities (Destouni and Verrot, 2014).
Consistently across the datasets, the drought-related 1st percentile values in summer (JJA) and autumn (SON) increase for precipitation (Figure 4A) and decrease or show little change for runoff (Figure 4B) across the BSDB catchments. For flood conditions, the datasets agree in showing little change or slight increase in the 99th percentile value for precipitation across all seasons (Figure 4C). For runoff, the datasets mostly agree in indicating decreased 99th percentile values during the spring snowmelt (MAM; Figure 4D) when the average monthly runoff fluxes are the highest (Figure 3B).
Dataset differences for drought and flood extremes are overall greater for runoff (Figures 4B,D) than precipitation (Figures 4A,C), and also greater for the drought-related 1st (Figure 4B) than the flood-related 99th (Figure 4D) percentile values. The ERA5 runoff results differ particularly strongly for the drought-related lowest 1% of the runoff fluxes, which are overall higher (less extremely low) in this dataset than the others. That is, compared to the ground observation data for runoff in Mixed and Obs, as well as to the model-based runoff data in GLDAS, the ERA5 data do not fully capture how low runoff can be in the most severe drought conditions across the BSDB catchments. For floods, the ground observation data for runoff in Obs and Mixed show overall higher 99th percentile values than both ERA5 and GLDAS; the model-based data in the latter two datasets thus do not fully capture how high runoff can be in the most severe flood events across the BSDB catchments.
4 Concluding discussion
Various disciplines and sectors relate to the environmental and ecosystem status of the coastal and marine waters of the Baltic Sea and may use different datasets to assess the freshwater discharges to the sea from the BSDB, as well as their spatial variations, temporal changes, and drought and flood extremes. Comparative testing has largely been lacking regarding how consistently and robustly different datasets represent these water aspects for the Baltic region. This study addresses that gap, using water balance closure for consistent synthesis, constraint, and comparison of the implications of different (types of) datasets.
The implications addressed and compared here concern the same spatial variation, temporal change, and drought and flood extreme aspects, as provided by each dataset in the BHCD. Data from the BHCD can also be used to assess other aspects, such as broader spatial-temporal trends and their significance and confidence levels in relation to relevant prevailing variations and uncertainties around the average trends. For the comparative aims of this study, the assessment of realism and relevance in divergent dataset implications concerns the physical reasonableness and relation to observations of the same water aspects, addressed consistently for the same spatial scale and time period across all datasets, irrespective of what significant or insignificant broader trends may be determined from each dataset. Concretely, this means assessing as physically unreasonable the 30-year cumulative regional average water level rise versus drop implied by ERA5 versus Mixed, because their implications are directly opposite, with the differences far exceeding several standard deviations of each dataset (Figure 2B). Moreover, such regional average water level changes are unobserved, even though they would be dramatically notable had they actually occurred. For drought and flood extremes, if the lowest or highest 1% of actually measured regional water fluxes are lower or higher, respectively, than the corresponding flux percentiles in the model-based datasets, then the latter clearly do not fully capture the lowest and highest flux extremes observed in the region. Furthermore, when datasets essentially agree, their convergent implications are robust and can be considered more realistic than just one selected implication from various contrasting ones.
Overall, the comparative datasets agree that the precipitation changes over the study period in the BSDB catchments do not necessarily propagate to analogous changes in runoff and discharges to the sea. The datasets instead converge in showing some contrasting precipitation and runoff changes. The contrasts highlight that terrestrial water changes are not just simply binary, with all water fluxes either accelerating or decelerating. The changes are more complex in that different change directions may prevail concurrently for precipitation, runoff, and evapotranspiration fluxes and their extremes, along with the related water storage changes. The complexity reflects the interactions between the fluxes and storage changes and how they modulate and propagate anomalies, changes, and extreme events from precipitation to runoff.
Regarding dataset disagreements, as mentioned, the widely used global reanalysis data in ERA5 and model (GLEAM) based data for evapotranspiration in Mixed yield physically unreasonable water balance closures for the BSDB catchments considering, for example, the directly opposite implications of average water storage wetting according to ERA5 and drying according to Mixed-GLEAM. For drought and flood extremes, the dataset discrepancies and related uncertainties are overall greater for runoff than precipitation. For runoff under flood conditions, ERA5 and GLDAS show lower values than the ground observation data in Obs and Mixed for the highest 1% monthly fluxes. For runoff under drought conditions, ERA5 shows higher values than the other datasets for the lowest 1% monthly fluxes. The ERA5 data thus do not fully capture how extremely high and low the regional runoff fluxes may be during floods and droughts, respectively. Moreover, in the event of observation inaccuracies, the Obs and Mixed datasets tend to be conservative, encouraging consideration of more extreme runoff fluxes than the model-based datasets in flood and drought plans and preparations.
These findings are important for consistent understanding and consideration of the conditions, changes, and extremes of the freshwater discharges to the Baltic Sea. As some datasets disagree on these discharge aspects—even implying opposite related regional water level changes—it is important to be cautious and acknowledge that not all datasets can be right and some may be misleading. Relying uncritically on misleading datasets can distort our understanding and lead to poor decisions for efforts to address major challenges for the future of the Baltic Sea.
Data availability statement
Publicly available datasets were analyzed in this study. This data can be found here: Zenodo https://doi.org/10.5281/zenodo.15019907 Github https://github.com/MohannaZ/BHCD_Code.git.
Author contributions
GD: Formal Analysis, Supervision, Methodology, Writing – review and editing, Conceptualization, Investigation, Writing – original draft, Funding acquisition, Visualization. MZ: Visualization, Methodology, Investigation, Software, Formal Analysis, Writing – original draft.
Funding
The author(s) declare that financial support was received for the research and/or publication of this article. Funding support for this study has been provided by the Swedish Research Council (VR, project 2022-04672) and the Knut and Alice Wallenberg Foundation (Grant no. KAW 2022.0096).
Acknowledgments
Part of the computations and data handling were enabled by resources provided by the National Academic Infrastructure for Supercomputing in Sweden (NAISS), partially funded by the Swedish Research Council through grant agreement no. 2022-06725.
Conflict of interest
The authors declare that the research was conducted in the absence of any commercial or financial relationships that could be construed as a potential conflict of interest.
Generative AI statement
The author(s) declare that no Generative AI was used in the creation of this manuscript.
Any alternative text (alt text) provided alongside figures in this article has been generated by Frontiers with the support of artificial intelligence and reasonable efforts have been made to ensure accuracy, including review by the authors wherever possible. If you identify any issues, please contact us.
Publisher’s note
All claims expressed in this article are solely those of the authors and do not necessarily represent those of their affiliated organizations, or those of the publisher, the editors and the reviewers. Any product that may be evaluated in this article, or claim that may be made by its manufacturer, is not guaranteed or endorsed by the publisher.
Supplementary material
The Supplementary Material for this article can be found online at: https://www.frontiersin.org/articles/10.3389/fenvs.2025.1601433/full#supplementary-material
References
Althoff, D., and Destouni, G. (2023). Global patterns in water flux partitioning: Irrigated and rainfed agriculture drives asymmetrical flux to vegetation over runoff. One Earth 6 (9), 1246–1257. doi:10.1016/j.oneear.2023.08.002
Beaudoing, H., and Rodell, M. (2019). GLDAS noah land surface model L4 monthly 1.0× 1.0 degree V2. 0, Greenbelt, Maryland, USa, goddard earth sciences data and information services center (GES DISC).
Berghuijs, W. R., Sivapalan, M., Woods, R. A., and Savenije, H. H. (2014). Patterns of similarity of seasonal water balances: a window into streamflow variability over a range of time scales. Water Resour. Res. 50 (7), 5638–5661. doi:10.1002/2014wr015692
Berghuijs, W. R., Harrigan, S., Molnar, P., Slater, L. J., and Kirchner, J. W. (2019). The relative importance of different flood-generating mechanisms across Europe. Water Resour. Res. 55 (6), 4582–4593. doi:10.1029/2019wr024841
Blöschl, G. K. K. Y., Bierkens, M. F. P., Chambel, A., Cudennec, C., Destouni, G., Fiori, A., et al. (2019). Twenty-three unsolved problems in hydrology (UPH) – a community perspective. Hydrological Sci. J. 64 (10), 1141–1158. doi:10.1080/02626667.2019.1620507
Destouni, G., and Verrot, L. (2014). Screening long-term variability and change of soil moisture in a changing climate. J. Hydrology 516, 131–139. doi:10.1016/j.jhydrol.2014.01.059
Destouni, G., Asokan, S. M., and Jarsjö, J. (2010). Inland hydro-climatic interaction: effects of human water use on regional climate. Geophys. Res. Lett. 37 (18). doi:10.1029/2010gl044153
Do, H. X., Gudmundsson, L., Leonard, M., and Westra, S. (2018). The global Streamflow Indices and Metadata Archive—Part 1: Station catalog and catchment boundary. Bremen, Germany: PANGAEA. doi:10.1594/PANGAEA.887477
Fan, Y., and Van den Dool, H. (2008). A global monthly land surface air temperature analysis for 1948–present. J. Geophys. Res. Atmos. 113 (D1). doi:10.1029/2007jd008470
Gudmundsson, L., Do, H. X., Leonard, M., and Westra, S. (2018). The global Streamflow Indices and Metadata Archive (GSIM)—Part 2: time series Indices and Homogeneity assessment. Bremen, Germany: PANGAEA. doi:10.1594/PANGAEA.887470
Häder, D.-P., and Barnes, P. W. (2019). Comparing the impacts of climate change on the responses and linkages between terrestrial and aquatic ecosystems. Sci. Total Environ. 682, 239–246. doi:10.1016/j.scitotenv.2019.05.024
Hannerz, F., and Destouni, G. (2006). Spatial characterization of the Baltic Sea drainage basin and its unmonitored catchments. AMBIO A J. Hum. Environ. 35 (5), 214–219. doi:10.1579/05-a-022r.1
Hersbach, H., Bell, B., Berrisford, P., Hirahara, S., Horányi, A., Muñoz-Sabater, J., et al. (2017). Complete ERA5 from 1940: Fifth generation of ECMWF atmospheric reanalyses of the global climate. Copernic. Clim. Change Serv. (C3S) Data Store (CDS). doi:10.24381/cds.143582cf
Hersbach, H., Bell, B., Berrisford, P., Hirahara, S., Horányi, A., Muñoz-Sabater, J., et al. (2020). The ERA5 global reanalysis. Q. J. R. Meteorological Soc. 146 (730), 1999–2049. doi:10.1002/qj.3803
Lehmann, F., Vishwakarma, B. D., and Bamber, J. (2022). How well are we able to close the water budget at the global scale? Hydrology Earth Syst. Sci. 26 (1), 35–54. doi:10.5194/hess-26-35-2022
Martens, B., Miralles, D. G., Lievens, H., Van Der Schalie, R., De Jeu, R. A., Fernández-Prieto, D., et al. (2017). GLEAM v3: satellite-based land evaporation and root-zone soil moisture. Geosci. Model. Dev. 10 (5), 1903–1925. doi:10.5194/gmd-10-1903-2017
Miralles, D. G., Holmes, T., De Jeu, R., Gash, J., Meesters, A., and Dolman, A. (2011). Global land-surface evaporation estimated from satellite-based observations. Hydrology Earth Syst. Sci. 15 (2), 453–469. doi:10.5194/hess-15-453-2011
Moshir Panahi, D., Kalantari, Z., Ghajarnia, N., Seifollahi-Aghmiuni, S., and Destouni, G. (2020). Variability and change in the hydro-climate and water resources of Iran over a recent 30-year period. Sci. Rep. 10 (1), 7450. doi:10.1038/s41598-020-64089-y
Rodell, M., Houser, P., Jambor, U., Gottschalck, J., Mitchell, K., Meng, C.-J., et al. (2004). The global land data assimilation system. Bull. Am. Meteorological Soc. 85 (3), 381–394. doi:10.1175/bams-85-3-381
Schneider, U., Becker, A., Finger, P., Meyer-Christoffer, A., Rudolf, B., and Ziese, M. (2016). GPCC full data reanalysis version 7.0: monthly land-surface precipitation from rain gauges built on GTS based and historic data.
Teuling, A. J., De Badts, E. A., Jansen, F. A., Fuchs, R., Buitink, J., Hoek van Dijke, A. J., et al. (2019). Climate change, reforestation/afforestation, and urbanization impacts on evapotranspiration and streamflow in Europe. Hydrology Earth Syst. Sci. 23 (9), 3631–3652. doi:10.5194/hess-23-3631-2019
Verrot, L., and Destouni, G. (2015). Screening variability and change of soil moisture under wide-ranging climate conditions: Snow dynamics effects. Ambio 44, 6–16. doi:10.1007/s13280-014-0583-y
Zarei, M., and Destouni, G. (2024a). Research gaps and Priorities for terrestrial water and Earth system Connections from catchment to global scale. Earth’s Future 12 (1), e2023EF003792. doi:10.1029/2023ef003792
Zarei, M., and Destouni, G. (2024b). A global multi catchment and multi dataset synthesis for water fluxes and storage changes on land. Sci. Data 11 (1), 1333–13. doi:10.1038/s41597-024-04203-1
Zarei, M., and Destouni, G. (2025a). Baltic hydro-climatic data: a regional data synthesis for the Baltic Sea Drainage basin. Front. Earth Sci. – Hydrosphere 13, 1595943. doi:10.3389/feart.2025.1595943
Keywords: Baltic Sea, freshwater discharges, precipitation and discharge extremes, drought and flood extremes, water balance, hydro-climatic and reanalysis data
Citation: Destouni G and Zarei M (2025) Hydro-climatic variations, changes, and extremes in the Baltic Sea Drainage Basin. Front. Environ. Sci. 13:1601433. doi: 10.3389/fenvs.2025.1601433
Received: 27 March 2025; Accepted: 28 August 2025;
Published: 08 September 2025.
Edited by:
Laura Tuomi, Finnish Meteorological Institute, FinlandReviewed by:
Debashis Nath, Sun Yat-sen University, ChinaGermo Väli, Tallinn University of Technology, Estonia
Copyright © 2025 Destouni and Zarei. This is an open-access article distributed under the terms of the Creative Commons Attribution License (CC BY). The use, distribution or reproduction in other forums is permitted, provided the original author(s) and the copyright owner(s) are credited and that the original publication in this journal is cited, in accordance with accepted academic practice. No use, distribution or reproduction is permitted which does not comply with these terms.
*Correspondence: Georgia Destouni, Z2VvcmdpYS5kZXN0b3VuaUBuYXRnZW8uc3Uuc2U=