 Yanlu Huang
 Zifei Wang
 Xudong Hu
- Southern Power Grid Artificial Intelligence Technology Co., Ltd., Guangzhou, China
The power sector is the largest contributor to global carbon emissions, particularly in China, where decarbonizing electricity generation is crucial for achieving carbon neutrality. Understanding the drivers of carbon emissions in this sector is vital for formulating effective policy measures. This study investigates carbon emissions from the Southern Power Grid of China between 2013 and 2021. It employs decomposition analysis techniques to identify the key driving factors across five provinces within the grid region. GDP per capita emerged as a major driver of electricity-related carbon emissions across provinces. Guangdong, Guangxi, and Hainan achieved reductions in per capita emissions from electricity supply, while Guizhou and Yunnan showed improvements through different mechanisms. The analysis revealed substantial provincial disparities in emission patterns, closely associated with differences in economic output and electricity generation structures. Contribution rate analysis further highlighted varied progress toward carbon peaking and heterogeneous supply methods. These findings underscore the importance of recognizing interprovincial differences in emission drivers within the Southern Power Grid. Tailored, region-specific policy interventions are essential to accelerate the sectoral transition toward carbon neutrality and to ensure balanced progress across provinces.
1 Introduction
In the face of increasingly severe global climate change, greenhouse gas emissions have become a focus of international attention. As the world’s largest emitter of carbon dioxide (CO2), China faces immense pressure on carbon emissions reduction. China is still working hard to combat climate change and has set ambitious “dual carbon” goals (Ministry of Foreign Affairst.P.s.R.o.C, 2020), aiming to promote the low–carbon transformation by strengthening the energy transition, where energy consumption is the predominant cause of CO2 emissions in China accounting for approximately 87% of total carbon emissions, and in particular, the power sector accounts for approximately 40% of the energy carbon emissions (Zhang Y. et al., 2020). Also, the power sector is the coal–dominated power supply structure, and coal consumption in the power sector accounts for almost half of China’s total coal consumption (Li et al., 2019), highlighting that the electricity carbon emission reduction is essential for the carbon emission reduction (Demetriou and Hadjistassou, 2021; Luo et al., 2022; Wang Z. et al., 2024). Identifying and quantifying the key drivers of these emissions is therefore essential for informing effective policy interventions.
Previous studies have employed decomposition methods to analyze the drivers of carbon emissions in the power sector. Techniques such as the Logarithmic Mean Divisia Index (LMDI) and Structural Decomposition Analysis (SDA) have been widely applied to identify the impacts of economic growth, energy intensity, and energy mix on emissions. While national-level studies have provided broad insights into the drivers of electricity-related carbon emissions, they often overlook the significant spatial heterogeneity of electricity systems in China. In particular, the Southern Power Grid encompasses provinces with distinct economic development stages, energy resource endowments, and cross-provincial electricity trading patterns. Yet, few studies have systematically examined how these interprovincial differences shape emission dynamics within a unified grid system.
Comparative analysis in this study reveals significant divergence in carbon emission characteristics between the five southern provinces (Guangdong, Guangxi, Yunnan, Guizhou, and Hainan) and northern power grids (e.g., North China and East China grids). Southern provinces, benefiting from abundant hydropower and wind resources as well as well-developed interregional transmission infrastructure, exhibit a higher share of non-fossil energy in their power supply structure compared to northern grid regions. Moreover, as interprovincial electricity trading is predominantly characterized by “north-to-south transmission,” northern grids bear the electricity load of energy-intensive industrial clusters, resulting in significantly higher carbon emission intensity in northern provinces than in southern provinces.
This research addresses this gap by conducting a province-level decomposition of electricity-related carbon emissions in the southern provinces from 2013 to 2021 using the LMDI approach. The study contributes scientifically in two key ways. First, it proposes a dual-framework categorization of emission drivers—based on both emission characteristics and sectoral stages—allowing for multidimensional attribution. Second, it links structural drivers to operational power flow features unique to the Southern Grid, such as hydro-rich western provinces supplying electricity to more industrialized eastern provinces. By identifying the heterogeneous sources of emission pressure and reduction potential across provinces, this study provides a replicable analytical model for other multi-province power systems. The results offer region-specific insights for low-carbon electricity planning, contributing to both the literature and policymaking under China’s dual-carbon goals.
2 Literature review
In recent years, the study of factors influencing carbon emissions has attracted growing scholarly attention, driven by the urgency of global climate targets and rapid advances in analytical methods. Numerous studies have examined both sector-specific and macro-level determinants of carbon emissions and energy use in China.
Research on the drivers of carbon emissions has proliferated in response to global climate targets and improved data/analytical capacity. Multi-scale analyses—national, regional, sectoral—show that macroeconomic expansion, demographic change, technological progress, and energy-system restructuring interact in complex, path-dependent ways. Studies drawing on extensions of the Kaya identity and decomposition frameworks consistently find that economic activity and population scale tend to exert upward pressure on emissions, whereas energy intensity improvements and low-carbon energy substitution counteract these forces (Li et al., 2018; Kim et al., 2020; Yang, 2020; Liu, 2022). Related work identifies living standards, industrial structure, and urbanization dynamics as additional channels influencing electricity-related emissions in China (Zhao et al., 2023). Emerging provincial panel evidence further indicates that human capital accumulation can serve as a mitigation lever (Yao et al., 2021). Collectively, these literatures establish a macro baseline: socioeconomic growth lifts energy demand and emissions unless offset by intensity and structural shifts.
Because electricity generation both reflects upstream energy choices and conditions downstream decarbonization (electrification of end uses), power-sector emissions receive disproportionate attention in China’s carbon and energy policy discourse. National-scale decomposition studies frequently apply the Logarithmic Mean Divisia Index (LMDI) to parse contributions from activity, structure, fuel mix, and efficiency. Evidence from China overall and from large subregions indicates that economic activity effects dominate increases in CO2 from electricity, while generation efficiency (and, in some cases, fuel mix) offsets part of that growth (Zhang et al., 2013; Mai et al., 2020). Scenario and structural adjustment analyses reinforce the mitigation leverage embedded in the power mix: shifting from coal toward lower-carbon resources and improving conversion efficiency can materially bend the emissions trajectory (Feng, 2017; Li et al., 2022; Zheng et al., 2023).
Emerging scholarship probes spatial heterogeneity in policy design and its unintended distributional or leakage consequences. Zhou et al. (2024) show that equity-motivated differentiation of regional carbon-neutrality targets can trigger cross-provincial coal displacement and industrial relocation, diluting aggregate mitigation gains if coordination is weak (Zhou et al., 2024). Similar concerns surface in studies that contrast production-versus consumption-based accounting in China’s power sector (Li et al., 2022) and that construct electricity emission factors across alternative transformation pathways (Zheng et al., 2023). These findings underscore a central policy tension: localized stringency without system-level alignment may shift emissions geographically rather than reduce them overall.
Tracing where emissions are generated versus where electricity (and electricity-intensive goods) are consumed requires interregional accounting. Multi-Regional Input-Output (MRIO) models combined with Structural Decomposition Analysis (SDA) allow researchers to attribute embodied emissions along supply chains and across space. For example, Zhang P. et al. (2020) integrate MRIO and SDA to evaluate how Beijing’s electricity consumption links to urban carbon outcomes, illuminating transfer channels relevant for city-level mitigation strategies. Broader modeling exercises that incorporate assumed parameter sets for renewable penetration and system constraints provide comprehensive scenario platforms to test the carbon consequences of alternative electricity development pathways (Mostafaeipour et al., 2022).
Comparative evidence from other large electricity markets enriches interpretation. Decoupling and decomposition studies for the United States highlight the salience of electricity output growth as a proximate driver of emissions variation (Jiang and Li, 2017). Across the EU-27 and United Kingdom, decomposition results indicate that economic activity effects remain strong but are increasingly offset by generation structure changes—notably renewables uptake and coal phase-down (Karmellos et al., 2021). Broader reviews of European power-sector transformation identify interacting technological, policy, and demand-side factors shaping long-term emissions pathways (Koval et al., 2023). Cross-country Index Decomposition Analysis of electricity carbon intensity (ACI) in ASEAN countries finds that resource endowments and development stages materially condition ACI differentials, cautioning against one-size-fits-all benchmarks (Ang and Goh, 2016). Methodological innovations that integrate technological innovation measures and structural adjustments (Peng and Tao, 2018) and scenario-driven global mitigation modeling in which power-sector carbon intensity is a key lever (Van Vuuren et al., 2009) further broaden the toolkit.
Despite substantial progress, three gaps limit how well current research informs subnational policy within interconnected grid systems.
Most national or provincial studies treat grids as administratively bounded systems. Few examine intra-grid variability in emissions drivers across provinces that physically share transmission infrastructure and trade electricity in large volumes—as is the case in China’s Southern Power Grid.
Production-side generation profiles and consumption-side demand characteristics are often analyzed separately. Integrated accounting that captures both where electricity is generated and where it is ultimately used—along with associated transfers of embodied carbon—remains limited.
Standard LMDI decompositions provide factor contributions but rarely translate these into cumulative and relative contribution rates that support cross-province benchmarking over time. Nor do most studies explicitly map how socioeconomic and structural factors interact under shared grid governance arrangements.
This study extends regional carbon systems theory by conceptualizing a shared-grid emissions commons in which provinces are linked through physical flows (power dispatch), market transactions, and policy spillovers. Building on spatial policy differentiation work (Zhou et al., 2024) and production–consumption splits (Li et al., 2022), the study theorizes how asymmetric development levels and energy resource endowments within an interconnected grid can generate implicit carbon transfers that complicate province-level target setting and equity debates.
Methodologically, this study is designed as a two-stage decomposition framework tailored to multi-province, single-grid settings. First, the study computed electricity carbon emission factors harmonized across provinces with differing data definitions, and implemented an extended LMDI that yields both cumulative and relative (share-normalized) contribution rates for activity, structure, intensity, and energy-mix effects over time. This design supports comparability and highlights transition timing asymmetries. By embedding interprovincial electricity exchange information, our approach moves beyond stand-alone provincial accounts common in the literature (e.g., Zhang et al., 2013; Mai et al., 2020) and complements MRIO/SDA transfer studies (Zhang P. et al., 2020) by focusing on the operational grid boundary.
For policy aspects, the Southern Power Grid provides a natural laboratory to test whether differentiated provincial development trajectories translate into coordinated—or conflicting—emissions outcomes under a shared transmission network. Our framework can identify which provinces drive aggregate grid emissions, which benefit from imports of low-carbon electricity, and where efficiency gains or structural shifts would deliver the largest marginal reductions. This granularity offers actionable input to multi-province planning processes, helping to prevent the type of cross-border leakage and inequitable burden shifting highlighted by Zhou et al. (2024) and to align production- and consumption-side mitigation incentives raised by Li et al. (2022).
The literature points to several design imperatives we adopt: (i) capture heterogeneity within physically integrated but administratively distinct provinces; (ii) harmonize emission factor construction to ensure comparability; (iii) deploy decomposition metrics that allow both level and share comparisons over time; and (iv) interpret results through an equity and coordination lens that connects production-side changes to consumption-side burdens. By doing so, the study contributes an analytically transparent and policy-relevant evidence base to guide a unified yet differentiated roadmap for electricity carbon mitigation across the five provinces of China’s Southern Power Grid.
3 Methodology
3.1 Study area
This study focuses on five provinces—Guangdong, Guangxi, Yunnan, Guizhou, and Hainan—which together constitute the geographical coverage of the China Southern Power Grid (CSPG). It is important to clarify that the CSPG, as defined by the operational and administrative boundaries of China Southern Power Grid Company Limited, differs from the broader geographic or cultural notion of “southern China.” While the latter may include provinces such as Fujian, Jiangxi, or Hunan, these are served by the State Grid Corporation of China and therefore fall outside the scope of this study. The five selected provinces are interconnected through shared infrastructure, electricity dispatch mechanisms, and emission responsibilities under the CSPG framework. Analyzing them collectively allows for more accurate attribution of electricity-related carbon emissions and enables insights into intra-grid policy coordination.
3.2 Decomposition methodology
Previous studies pointed out that when a total amount index is decomposed, the additive LMDI method is the preferred method (Ang, 2005; 2015). Therefore, this study utilizes this method to decompose carbon dioxide emissions from the electricity sector in five southern provinces (Guangdong, Guangxi, Guizhou, Hainan, and Yunnan), involving eleven influencing factors, which are classified into four categories by the electricity carbon emission features and five categories according to the electricity generation and consumption stages. The decomposing formula as Equation 1.
Where, j is an integer ranging from 1 to 5, represents different regions, namely, Guangdong, Guangxi, Guizhou, Hainan, and Yunnan. The data in Equation 1 are sourced from the Southern Power Grid. Specifically, CO2j represents the carbon dioxide emissions from electricity generation in region j; FCj represents the fossil fuels consumption in region j; Gj represents the total electricity generation from fossil fuels in region j; TGj represents the total electricity generation in region j beside fossil fuels, such as solar, wind, and other types of renewable energy; ESj represents the electricity supply in region j; ECj represents the electricity consumption in region j; GDPj represents the Gross Domestic Product (GDP) in region j; Pj represents the population in region j.
The eleven influencing factors of carbon dioxide emissions from electricity sector are as follows: UFj is Fossil Fuel Carbon Emission Factor, carbon dioxide emission factor of fossil fuels in region j, calculated as the carbon emissions from electricity generation in region j divided by the consumption of fossil fuels in region j; PFj is Fossil Fuel Power Generation Efficiency, efficiency of fossil fuel electricity generation in region j, calculated as the consumption of fossil fuels in region j divided by the electricity generation from fossil fuels in region j. FIj is Fossil Fuel Power Generation Ratio, ratio of fossil fuel electricity generation in region j, calculated as the total electricity generation from fossil fuels in region j divided by the total electricity generation in region j, including hydroelectric, wind, and other renewable energy sources; PSj is Electricity Self–Sufficiency Rate, self–sufficiency rate of electricity in region j, calculated as the total electricity generation in region j divided by the electricity supply in region j; ESIj is Electricity Supply Intensity, intensity of electricity supply in region j, calculated as the electricity supply in region j divided by the economic output in region j; GDPpCj is GDP per capita in region j; CO2pCj is Carbon Dioxide Emission per capita in region j; ESPj is Available Population Size of Unit Electricity Supply in region j, calculated as the population in region j divided by the electricity supply in region j; ESDj is Electricity Supply–Demand Ratio in region j, calculated as the electricity supply in region j divided by the electricity consumption in region j; ECCj is Electricity Consumption Carbon Emission Factor, carbon emission factor of electricity consumption in region j, calculated as the electricity consumption in region j divided by the carbon emissions from electricity generation in region j.
The change of carbon dioxide emissions from the electricity sector between the base year 0 and the year t can be divided into eleven parts, i.e., the effects of eleven factors as Equation 2:
Four Categories of power carbon emission features include emission intensity effect, energy structure effect, electricity supply effect, and macroeconomic effect. Five categories by the stages are power generation sector effect, Power CTD (Conversion, Transmission, Distribution) sector effects, emission scale effect, economic output effect, and population scale effect.
This dual-framework design serves two purposes. First, the characteristic-based categorization enables a policy-relevant understanding of emission drivers, reflecting sectoral dynamics such as technological efficiency and structural transition. Second, the stage-based decomposition aligns with the physical and institutional stages of electricity flow—from generation to end-use—allowing clearer attribution of emissions to each operational segment of the electricity system. Such categorization approaches have been applied in previous empirical studies (Zhang et al., 2013; Yan et al., 2016; Zhang et al., 2022; Wang and Yang, 2023; Wei et al., 2023) to enhance interpretability and to facilitate more actionable policy recommendations.
Table 1 lists the variables used in the LMDI decomposition analysis, including their symbols and definitions, cover technical, structural, and socioeconomic factors affecting carbon emissions in the power sector. These factors are categorized according to electricity carbon emission features as follows:
• Emission intensity effects: UF and ECC.
• Energy structure effects: PF and FI.
• Electricity supply effects: PS, ESI, ESP, ESD.
• Macroeconomic indicators effects: GDPpC, CO2pC, P.
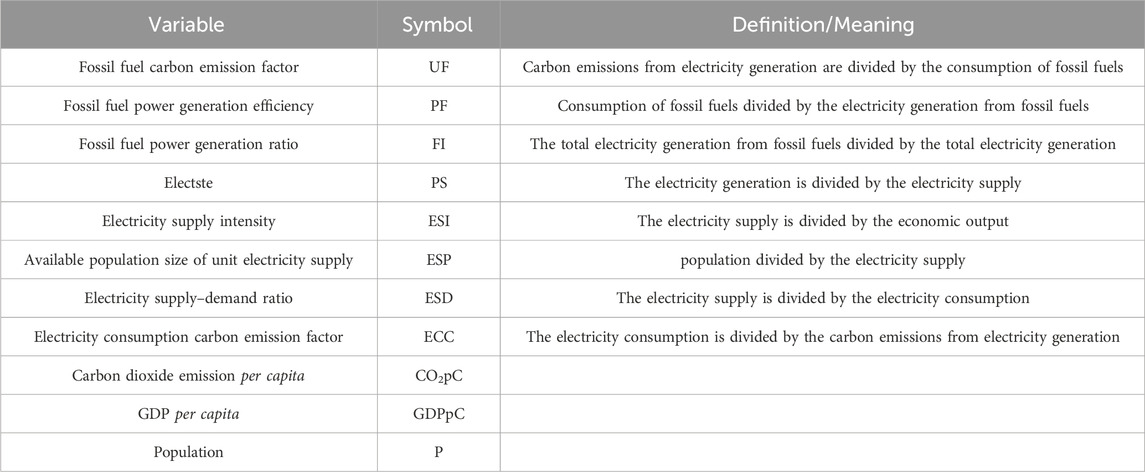
Table 1. List of variables.
They are also categorized according to electricity generation stages as follows:
• Power generation sector effects: UF, PF, FI.
• Power CTD (Conversion, Transmission, Distribution) sector effects: PS, ESI, ESP, ESD, ECC.
• Emission scale effects: CO2pC.
• Economic output effects: GDPpC.
• Population scale effects: P.
Equations 3–13 are logarithmic mean Divisia index (LMDI)-based decomposition formulas that quantify the contributions of various driving factors to changes in carbon emissions from the power sector. Where, ΔCO2j refers to the total change of carbon dioxide emissions from the electricity sector during the period from year 0 to year t; ΔUFij is the contributions of Fossil Fuel Carbon Emission Factor; ΔPFj is the contributions of Fossil Fuel Power Generation Efficiency; ΔFIj is the contributions of Fossil Fuel Power Generation Ratio; ΔPSj is the contributions of Electricity Self–Sufficiency Rate; Δ ESIj is the contributions of Electricity Supply Intensity; GDPpCj GDP per capita in region j; CO2pCj is Carbon Dioxide Emission per capita in region j; ESPj is the contributions of Available Population Size of Unit Electricity Supply, can be represented as Unit Electricity Supply in terms of contribution; ESDj is the contributions of Electricity Supply–Demand Ratio; ECCj is the contributions of Electricity Consumption Carbon Emission Factor.
3.3 Data source
The data used in this study were obtained from internal sources provided directly by the China Southern Power Grid Company Limited, covering provincial-level electricity generation, transmission, distribution, and consumption data for the five provinces (Guangdong, Guangxi, Yunnan, Guizhou, and Hainan) from 2013 to 2021. Due to confidentiality agreements, the raw data are not publicly accessible, but the aggregated statistics are consistent with those reported by provincial energy yearbooks and grid bulletins.
To ensure consistency across datasets, all variables were standardized into uniform measurement units—for example, electricity quantities were converted into terawatt-hours (TWh), and carbon emissions into metric tons of CO2. The conversion of electricity-related activity data into CO2 emissions followed the IPCC Guidelines (2006) and China’s regional emission factor specifications, with adjustment for fuel mix and combustion efficiency. Economic indicators such as GDP and population were derived from official provincial statistical yearbooks and the National Bureau of Statistics of China.
4 Results and discussion
4.1 Decomposition results
Changes in the ratio of fossil fuel power generation contributed to the decrease in power sector carbon emissions (Figure 1), likely due to a decline in coal-fired power generation that aligns with policy Figure 2 directives aimed at carbon emission reduction. The provinces of Hainan and Yunnan, with relatively smaller economic scales, demonstrated higher contributions to emission reduction, while provinces with larger economic scales, such as Guangdong and Guangxi, showed lower contributions. This suggests that changes in the ratio of fossil fuel power generation have a relatively greater impact on power sector carbon emissions in economically developing regions.
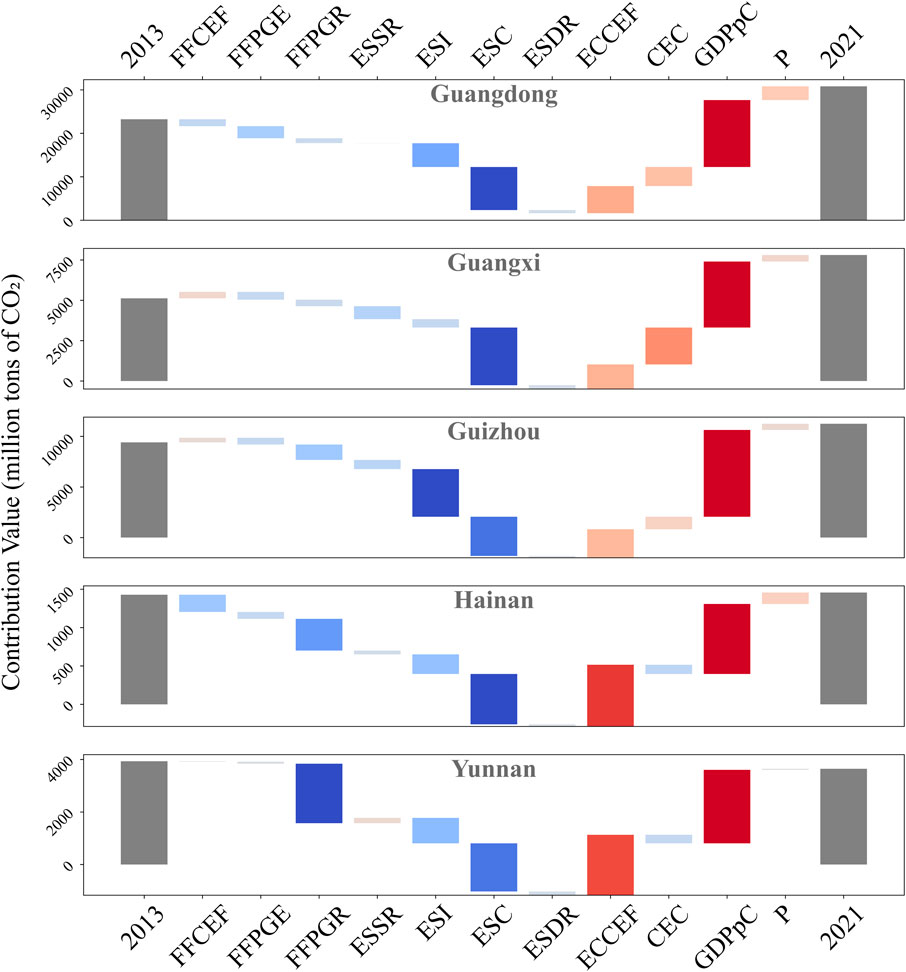
Figure 1. Contribution of driving Factors in power sector carbon emissions of five southern provinces.
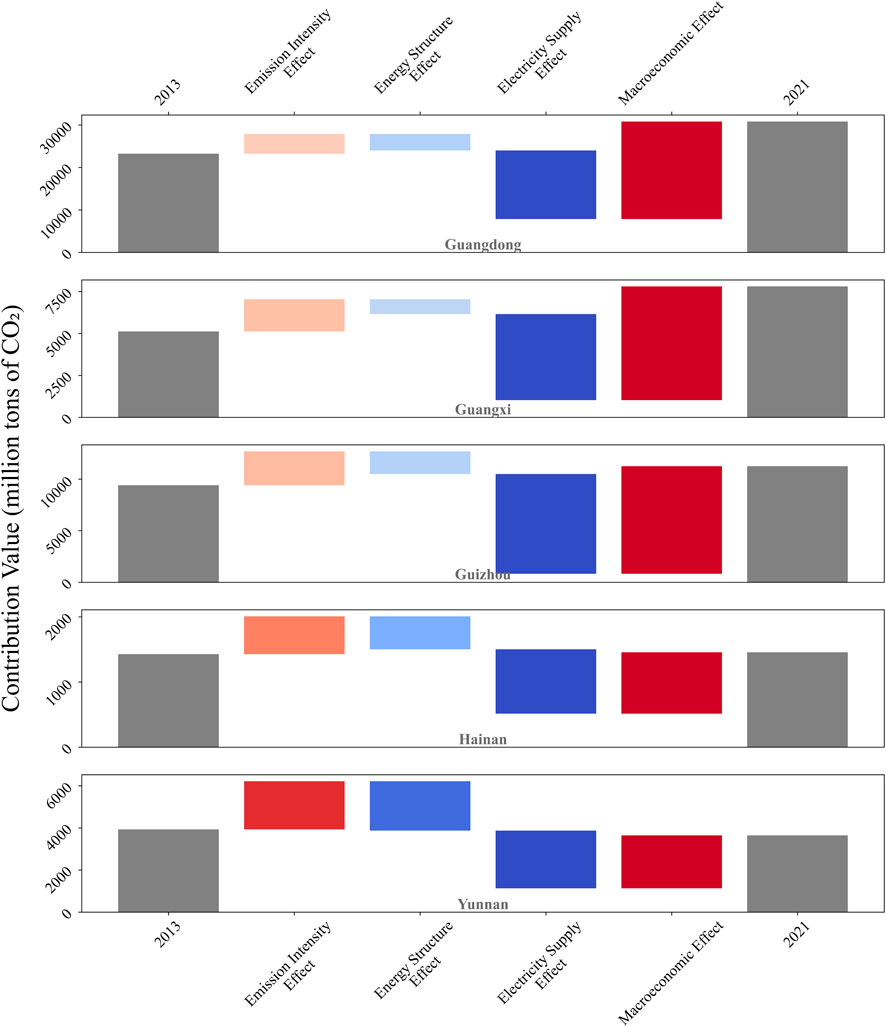
Figure 2. Contribution of Driving Factors in power sector carbon emissions of five southern provinces by category.
During the period from 2013 to 2021, changes in fossil fuel carbon emission factors and fossil fuel power generation efficiency had relatively minor impacts on changes in power sector carbon emissions.
Changes in the power self–sufficiency rate and power supply–demand ratio had a somewhat negligible impact on power sector carbon emissions. Conversely, changes in power supply intensity and per capita power supply had a relatively significant impact on emission reduction. While all four driving factors are directly related to power demand and supply, factors involving changes in power demand, such as power self–sufficiency rate and power supply-demand ratio, had relatively minor contributions to emission reduction, whereas factors centered on changes in power supply had relatively significant impacts on power sector carbon emission changes.
Among the driving factors in Guizhou Province, the contribution of power supply intensity to the decrease in power sector carbon emissions was most prominent. This indicates that, among the southern provinces, Guizhou has optimized power supply volume and economic scale for carbon emission reduction between 2013 and 2021.
Changes in per capita electricity supply had a significant impact on emission reduction across all southern provinces, particularly in Guangdong, Guangxi, and Hainan. Notably, while the difference in the contribution of driving factors to emission reduction was relatively small in Guangdong, changes in per capita power supply had a substantial impact on emission reduction in Guangxi. This suggests that, during the period from 2013 to 2021, the per capita power supply in Guangxi was optimized for emission reduction, while adjustments to other driving factors could maximize emission reduction in the region.
Power consumption and carbon emission factors contributed to increased power sector carbon emissions in all southern provinces, with relatively larger contributions from Hainan and Yunnan due to differences in economic scale, development environment, and power demand.
Changes in per capita carbon emissions had a significant impact on emission reduction in the southern provinces, with relatively larger contributions from Hainan and Yunnan due to their smaller economic scales. This indicates that, as regional economic development increases, per capita carbon emissions tend to rise proportionally with population size, resulting in an increased impact on carbon emission changes, highlighting the direct relationship between carbon emission changes and economic development.
Changes in per capita GDP and population had an impact on increased power sector carbon emissions, with per capita GDP having a substantial impact on emission increase. Conversely, population changes had relatively low impacts on increased power sector carbon emissions across all southern provinces. Particularly noteworthy is the relatively larger impact of per capita GDP compared to other driving factors, indicating a significant influence of regional economic development on increased power sector carbon emissions. Despite being a macro–social indicator like per capita GDP, population size had relatively minor impacts, suggesting that population changes in the southern provinces during the period from 2013 to 2021 had somewhat negligible effects on carbon emission changes.
4.1.1 Effects of factors categorized by carbon emission features
The emission intensity effect contributes to the increase in power sector carbon emissions, while the energy structure effect contributes to the decrease in power sector carbon emissions (Figure 2). It is noteworthy that the increase in power sector carbon emissions due to emission intensity effect is offset by the decrease in power sector carbon emissions due to the energy structure effect, indicating that the energy structure of the southern provinces counteracts the increase in carbon emissions caused by emission intensity.
On the other hand, in provinces with relatively large economic scales such as Guangdong, Guangxi, and Guizhou, the energy structure effect does not sufficiently offset the emission intensity effect. This leads to two implications: Firstly, the energy structure of these three provinces is not adequately optimized for carbon emission reduction. Secondly, due to the difference in the economic output of the provinces, the emission intensity effect is excessively high.
The power supply effect contributes to the decrease in power sector carbon emissions across all southern provinces, while the macroeconomic effect contributes to the increase in power sector carbon emissions. Additionally, in provinces with large economic scales such as Guangdong, Guangxi, and Guizhou, the increase in emissions due to the macroeconomic effect surpasses the decrease in emissions due to the power supply effect, whereas Hainan and Yunnan show the opposite trend.
4.1.2 Effects of factors categorized by different stages
The values of the contributions are irregular, indicating variations in the power supply processes of each province (Figure 3). Both the generation sector effect and the transmission and distribution sector effect contribute to a decrease in power sector carbon emissions, but the contribution values vary among provinces. Provinces with relatively larger economic scales, such as Guangdong, Guangxi, and Guizhou, show higher contributions from the electricity CTD effect, whereas provinces with relatively smaller economic scales, such as Hainan and Yunnan, exhibit higher contributions from the generation sector effect.
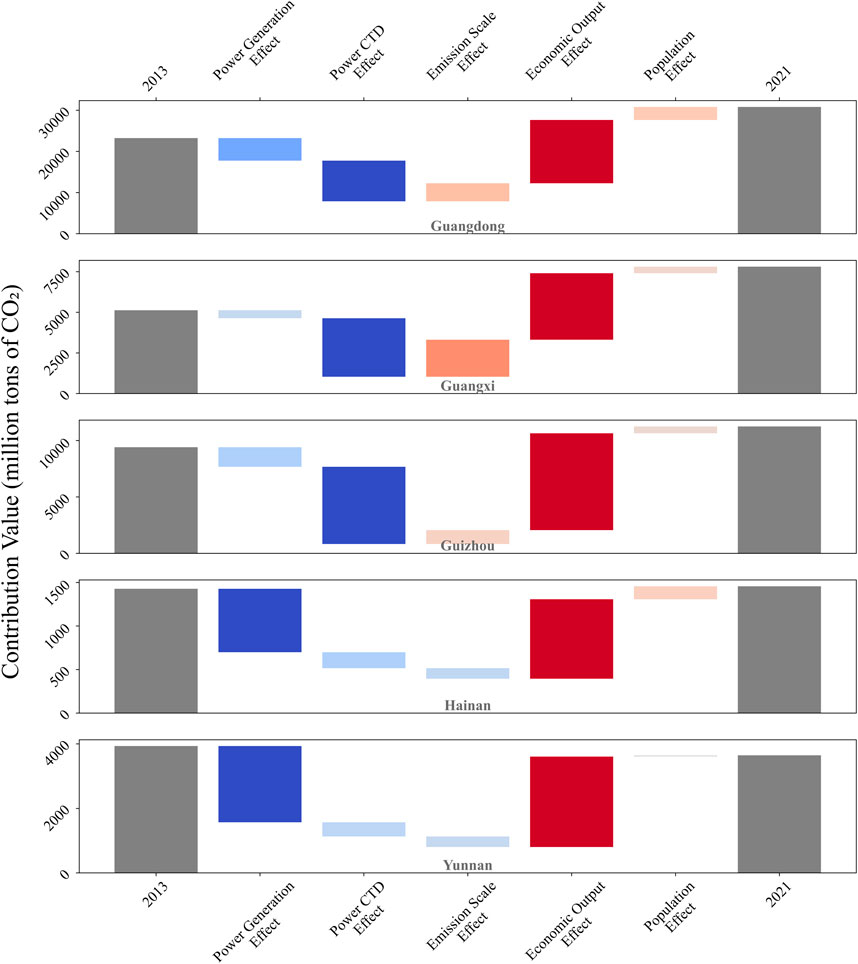
Figure 3. Contribution of Driving Factors in power sector carbon emissions of five southern provinces by stage.
In the case of the emission scale effect, similar to the two aforementioned effects, varying contribution values are derived based on the economic scale. Provinces with relatively larger economic scales, such as Guangdong, Guangxi, and Guizhou, contribute to the increase in power sector carbon emissions, while provinces with relatively smaller economic scales, such as Hainan and Yunnan, contribute to the reduction in power sector carbon emissions.
The economic output and population scale effects both contribute to an increase in power sector carbon emissions, with relatively consistent contribution values.
4.2 Cumulative contribution rate of different factors
In Guangdong Province, the absolute values of each effect show a relatively consistent pattern, except for the macroeconomic effect which has no change from 2013 to 2021 (Figure 4). Particularly noteworthy is the steady increase in the contribution of the macroeconomic effect to carbon emission reduction. This suggests that Guangdong’s economic development is contributing to carbon emission reduction efforts.
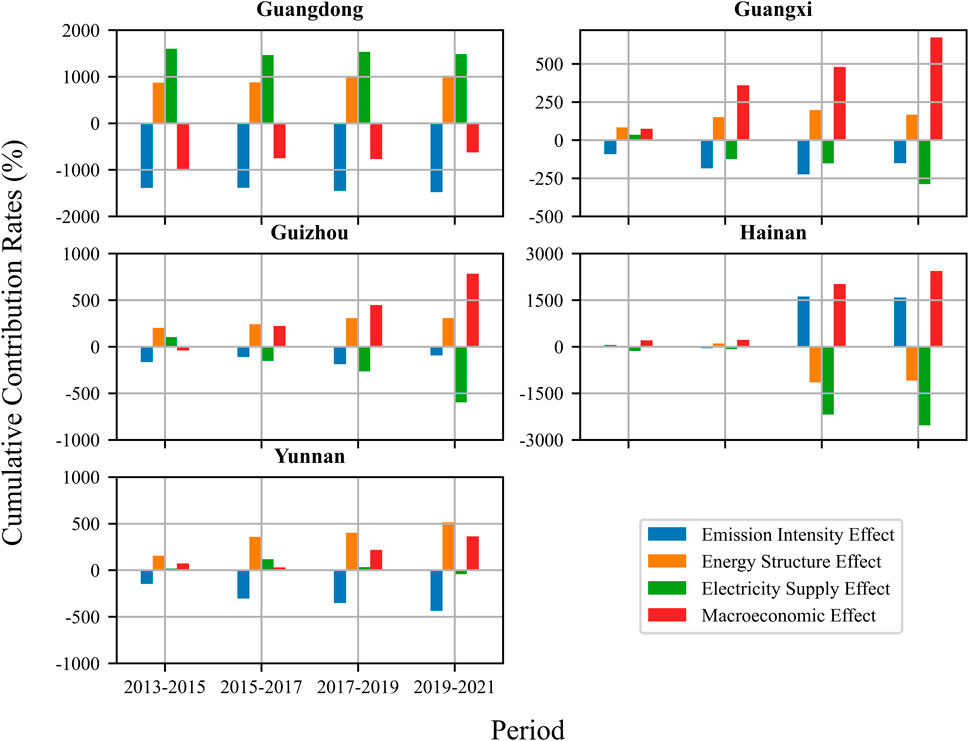
Figure 4. Cumulative Contribution Rates of Driving Factors in power sector carbon emissions of five southern provinces by category.
For Guangxi and Guizhou, the contribution of each effect was minimal during the period from 2013 to 2019 (Figure 4). However, from 2013 to 2021, there was a significant increase in both the electricity supply and macroeconomic effects. This indicates that despite a rapid increase in the contribution of carbon emissions due to increased energy demand in these provinces, the contribution of the electricity supply effect offset the contribution of the macroeconomic effect.
In Hainan Province, apart from the sudden increase in all effects, other effects exhibit irregular trends except for the macroeconomic effect, where the contribution of the macroeconomic effect increased in 2019–2021 (Figure 4).
Yunnan Province experienced a steady increase in the contribution of each effect but maintained low cumulative contribution rates relatively (Figure 4). Particularly, the emission scale, energy structure, and macroeconomic effects increased significantly, suggesting a balance in emission scale, energy structure, population scale, and economic output concerning power sector carbon emissions. However, despite the small increase, the cumulative contribution rate of the electricity supply effect rarely has changed, and no effect transitioned to other states. These findings underscore the need for Yunnan Province to adequately consider electricity supply planning.
In Guangdong Province, the absolute values of each effect show a relatively consistent pattern. However, from 2013 to 2021, there was an overall decrease, particularly for the power CTD effect (Figure 5). This suggests that despite the stimulated Guangdong’s economic development, should progress with systematical emission reduction, particularly through the power CTD effect.
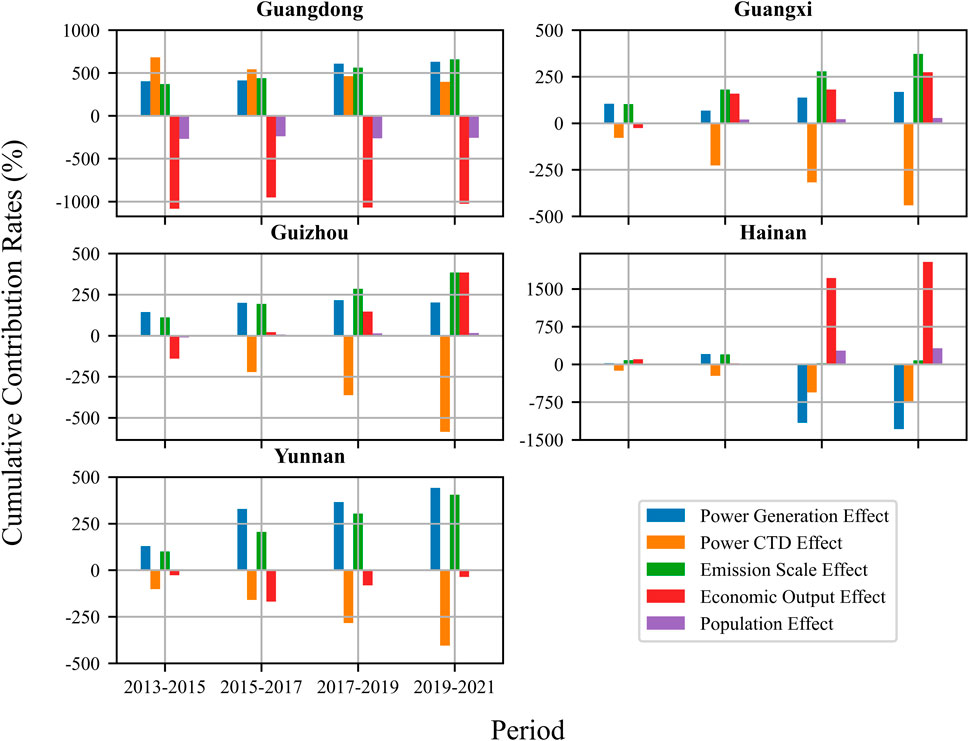
Figure 5. Cumulative Contribution Rates of Driving Factors in power sector carbon emissions of five southern provinces by stage.
For Guangxi and Guizhou, similar to the categorized analysis, from 2013 to 2021, the contribution of each effect increased steadily (Figure 5). From 2019 to 2021, noteworthy that is significant in the high absolute values of power CTD effect. This analysis indicates that while Guangxi and Guizhou relied solely on the power CTD effect to offset carbon emissions from the other effects, where policies should balance the contributions of economic output and emission scale effects to carbon emission reduction. This underscores the need for customized sector-specific carbon emission reduction policies in both Guangxi and Guizhou.
In Hainan Province, apart from the sudden increase in the power generation effect, power CTD effect and economic output effect, other effects have negligible change (Figure 5). This is consistent with the results from the categorized analysis.
For Yunnan Province, shortly after 2015, the absolute values of each effect experienced a sharp increase, whereas the economic output effect and population effect maintained low cumulative contribution rates (Figure 5). This suggests that as of 2021, the effects of each stage in Yunnan Province are in balance in terms of carbon emissions or reduction, except for the economic output effect and population effect. Particularly, considering that the power generation effect and the emission scale effect are in the emission state, current carbon emission reduction policies in Yunnan province should primarily focus on the generation sector.
4.3 Relative contribution rate of different effects
Figure 6 visualizes the relative contribution rates of power sector carbon emission driving factors for each province by category (Figure 6). Looking at the relative contribution rate of the emission intensity effect, we observe a gradual decrease in the area over time, indicating a decrease in the contribution of the emission intensity effect to power sector carbon emissions in all southern provinces. The shape of the area from 2015 to 2017 appears different, suggesting a transitional period for the emission intensity effect during that time.
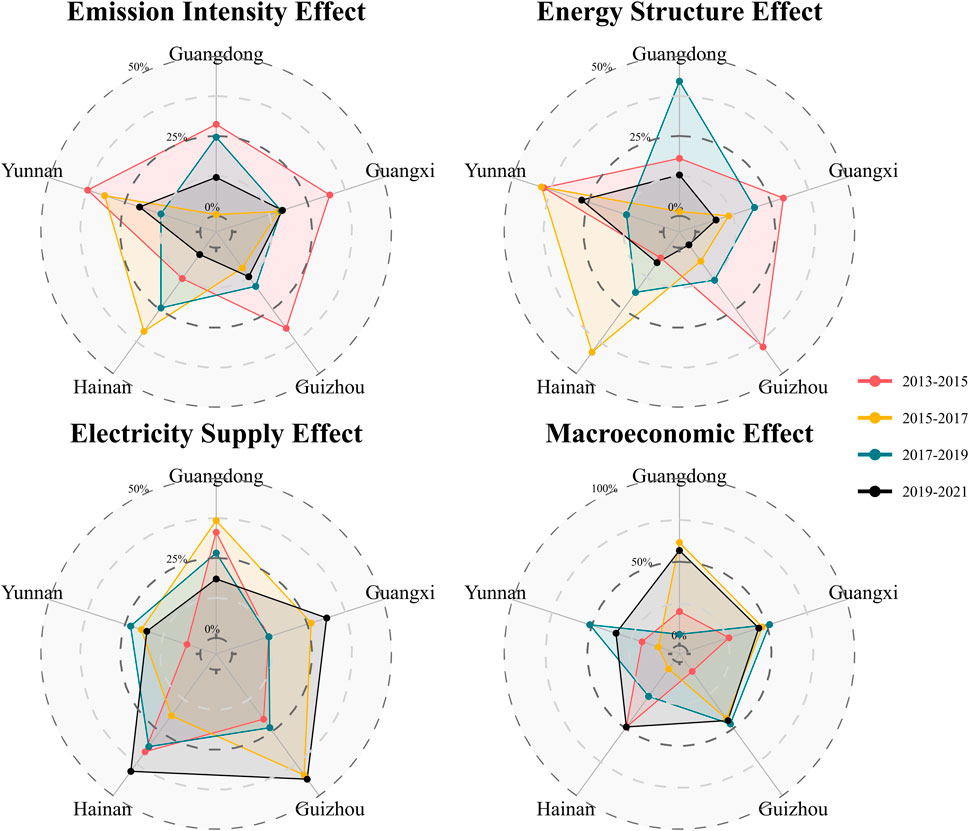
Figure 6. Relative Contribution Rates of Driving Factors in power sector carbon emissions of five southern provinces by category.
The relative contribution rate of the energy structure effect shows varying shapes of the areas for each period. This indirectly implies that the energy structures of each province changed over time. The highest relative contribution rates were observed in Yunnan, Guangxi, and Guizhou from 2013 to 2015, and in Guangdong from 2017 to 2019. These periods likely represent transitional phases driven by relevant policies in each province. Although the absolute size of the areas remained relatively stable from 2013 to 2019, there was a significant decrease in area size from 2019 to 2021, indicating a reduction in the absolute contribution of the energy structure effect to power sector carbon emissions.
The relative contribution rate of the power supply effect maintains relatively consistent area sizes regardless of the period, suggesting that the differences in the relative contribution rates of power supply effects among provinces are not significant. However, the relative contribution rates of Guangxi and Guizhou show a stark contrast in terms of electricity consumption but remain almost unchanged compared to previous years. This anomaly may be attributed to the reduced electricity supply during the COVID–19 period.
The relative contribution rate of the macroeconomic effect maintains a relatively stable shape over time. However, the area size steadily increased from approximately 25% in 2013–2015 to around 50% in 2019–2021, showing higher contribution rates compared to other effects. Notably, Guangdong’s relative contribution rate in 2017–2019 was in the 0% range, while it surpassed 50% in 2019–2021. This suggests that the increase in carbon emissions from 2019 to 2021 was significantly higher than in the previous period, leading to this result.
Figure 7, visualizes the relative contribution rates of power sector carbon emission driving factors for each province by stage. The shape of the power generation sector effect was not consistent, but the results from 2019 to 2021 were concentrated towards the center, indicating a decrease in the overall relative contribution rate. This trend resembles the change in shape observed for the energy structure effect, suggesting that these results are also likely due to different policies related to the power generation sector in each province.
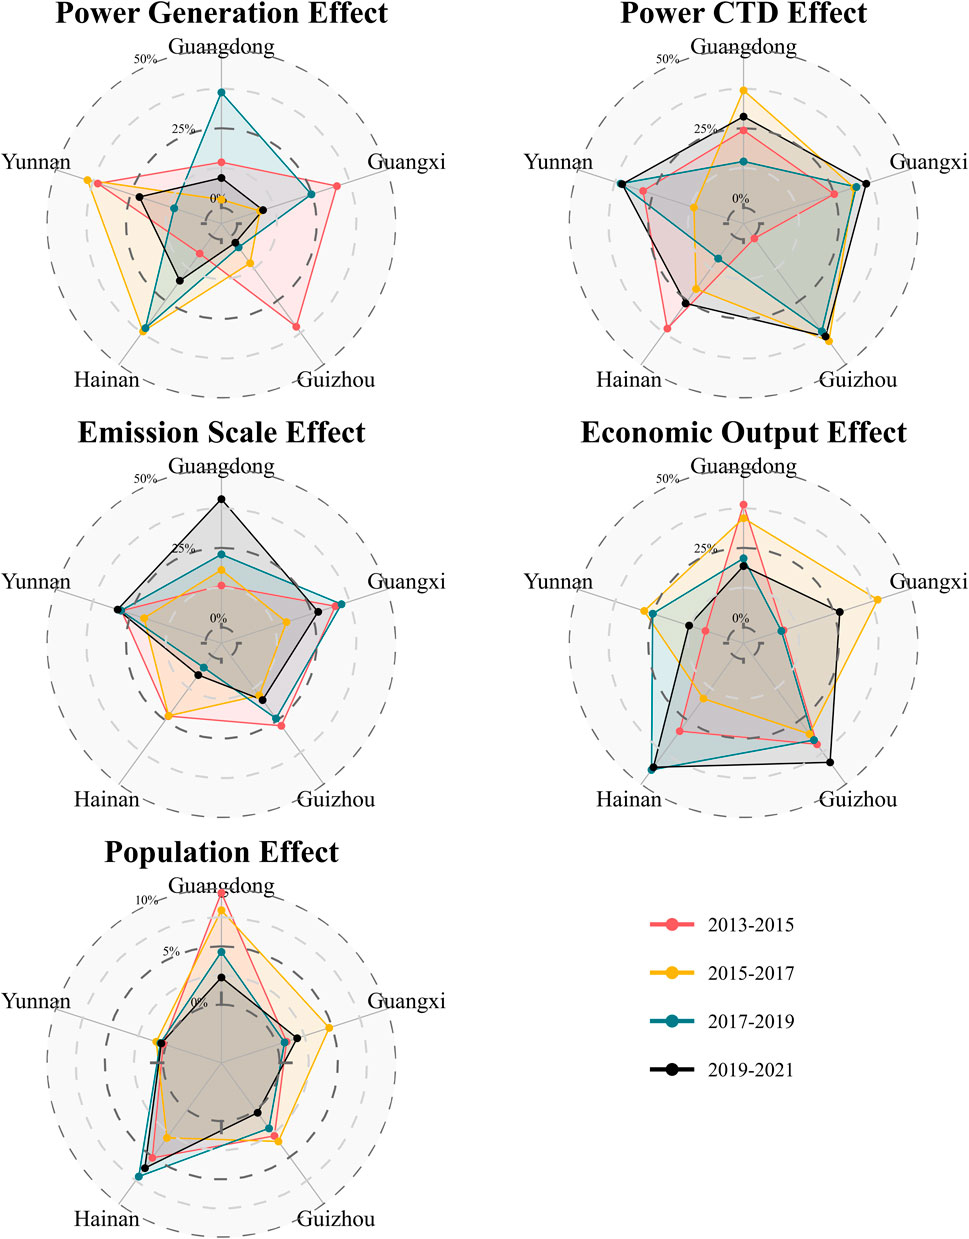
Figure 7. Relative Contribution Rates of Driving Factors in power sector carbon emissions of five southern provinces by stage.
The shape of the transmission and distribution sector effect was also inconsistent, and the results from 2019 to 2021 were widely dispersed, indicating an overall increase in the relative contribution rate. Among these, Guangxi showed relatively consistent relative contribution rates over the periods, suggesting that the carbon emissions from the transmission and distribution sector in Guangxi are relatively stable.
The shape of the emission scale effect remained relatively stable except for Hainan. However, from 2019 to 2021, the emission scale effect in Guangdong increased dramatically from around 25%–15%, reflecting the significant increase in carbon emissions in Guangdong.
The economic output effect exhibited extreme shapes from 2013 to 2015, with Guangxi and Yunnan showing relative contribution rates in the 0% range, indicating a relatively low contribution of economic output to carbon emissions. Apart from these extremes, the economic output effects were distributed more evenly, indicating that the contribution of economic output to power sector carbon emissions in southern provinces has remained relatively stable from 2013 to 2021. The population size effect exhibited a shape similar to the economic output effect, with a more even distribution. However, Guangdong showed a clear decreasing trend in relative contribution rates, indicating a relatively stable overall contribution to power sector carbon emissions. The relative contribution rate of the population size effect from 2019 to 2021 was approximately 5%, indicating a very low contribution of the population size effect to the macroeconomic effect of southern provinces as a whole.
4.4 Implications of the findings
The total electricity carbon emissions of the five provinces in southern China have been steadily increasing from 2013 to 2021. Regarding this increase in electricity carbon emissions, previous research interpreted that the contribution of macro-social indicators was the highest. (Liu, 2022). This study corroborates this perspective, highlighting the paramount contribution of macro-social indicators while noting minimal differentiations attributable to temporal and regional factors. Though nuances in the contributions of other effects such as energy intensity, energy structure, power generation, and power CTD were observed across regions, their significance remained modest. Thus, it appears that these results stem from the increased energy demand due to population growth and economic development in each province, even as the Chinese government maintains a policy emphasis on electricity supply security. (Yao and Chang, 2014). It should be noted, however, that frequent extreme climate events (e.g., the 2021 Yunnan drought) may episodically alter carbon emission intensity. For instance, short-term emissions increase from coal-fired power compensation during drought years could partially offset structural decarbonization efforts, further underscoring the complexity of ensuring energy supply security amid macro socioeconomic drivers.
Analyzing individual effect-related factors in detail, it was found that Guangdong, Guangxi, and Hainan have wielded considerable contributions to carbon emission reduction through factors such as per capita electricity supply, electricity supply intensity, and the ratio of fossil fuel power generation. This underscore differing approaches to addressing electricity demand contingencies across different provinces. For instance, Guangdong’s reliance on external power procurement manifests in a proportional relationship between per capita electricity supply and carbon emission reduction. (Cheng et al., 2016). Conversely, Guangxi, Guizhou, and Hainan generate enough power domestically, resulting in relatively lower carbon emissions burdens from electricity supply, thus allowing per capita electricity supply to contribute to carbon emission reduction. Yunnan, with its high proportion of renewable energy generation and forest carbon sequestration efforts, also showed the significant contribution of carbon emission reduction from the factor of fossil fuel power generation (Chen et al., 2009). However, its emission reduction effectiveness exhibits significant climate sensitivity. For instance, the 2021 drought caused a 30% decline in hydropower output, necessitating an 18% temporary increase in coal-fired power generation (resulting in approximately 20 million tons of additional carbon emissions). This highlights the climate vulnerability of provinces predominantly reliant on renewable energy.
Provinces with larger economies like Guangdong, Guangxi, and Guizhou are making greater efforts to reduce carbon emissions through various strategies. For instance, Guangdong implemented measures related to carbon emission management, trading, establishment of carbon funds, and integration of carbon emission trading before the nationwide carbon trading system was introduced in 2016. (Comission, 2015). In 2017, through the 32nd session of the Standing Committee of the Twelfth Guangdong Provincial People’s Congress, Guangdong Province promulgated the Regulations on Electricity Supply and Utilization. Emphasizing principles of safety, reliability, efficiency, orderliness, livelihood assurance, energy conservation, and emission reduction, it officially encourages and supports the development of smart grids, the construction of distributed power sources such as photovoltaic power generation, and the promotion and application of new technologies, materials, and devices for energy conservation and environmental protection, while highlighting the avoidance or reduction of harm to the nation, collective, and individuals (Province, 2019). Despite these concerted efforts, however, Guangdong’s electricity carbon emissions escalated, and cumulative contributions to carbon emission reduction from various factors remained relatively stable, except for the power CTD effect, which decreased due to the transfer of carbon emissions through power purchases from other provinces.
4.5 Regional implications
Guangxi, cumulative contributions to carbon emissions reduction due to macroeconomic effects and scale effects, as well as cumulative contributions to carbon emissions reduction due to the power CTD effect, are increasing. However, the contributions from other effects show minimal changes. While Guangxi Province’s economic development continues steadily, and its future energy system heavily relies on clean energy sources (Li et al., 2023; Zhou et al., 2023). Therefore, necessitates exploring carbon emission reduction measures and policies related to the intensity of development and power generation effects. Thorough management and supervision are essential to ensure the continuous sustainability of carbon emission reduction contributions from the power CTD effect.
Similar to Guangxi, Guizhou faces critical challenges in simultaneously ensuring energy security and advancing energy structure transition. In implementation, particular attention must be paid to the impacts of extreme climate events on achieving these dual objectives. The freezing disaster that struck the Yunnan-Guizhou Plateau in December 2023 serves as a telling example: it not only caused significant daily reductions in regional wind power output but also disrupted several transmission lines. The emergency diesel generators deployed to address power shortages substantially increased electricity carbon intensity in the short term. This case underscores that while maintaining power system stability, it is imperative to concurrently implement carbon reduction measures and establish continuous monitoring mechanisms for power supply effectiveness - all of which are crucial for Guizhou to meet its carbon control targets.
Guizhou, akin to Guangxi, needs to coordinate energy security and energy transition efforts. (Yan et al., 2022). This requires seeking carbon emission reduction measures while ensuring a stable electricity supply, emphasizing the importance of continuously monitoring the carbon emission reduction contribution of power supply effects.
Hainan, designated as a special economic zone, has experienced rapid economic growth, and sudden increases in the cumulative contribution of all effects since 2017 indicate the need for proactive policies to minimize carbon emissions during economic development (Meng et al., 2018). Specifically, policies focusing on minimizing carbon sequestration capacity reduction in urban planning and construction due to increased tourism and real estate development could be considered. (Meng et al., 2018; Duan and Su, 2021).
Yunnan showed a different trend in relative contribution, with high contributions from emission intensity, energy structure, and power generation effects, but low contributions from macroeconomic, economic output, and population size effects. This can be attributed to Yunnan’s relatively small economy and unique power generation and trading structure (Cheng et al., 2018; Liu et al., 2023). The decreasing trend in the cumulative contribution of the power CTD effect suggests a need for strict supervision and incentives to maintain Yunnan’s high proportion of renewable energy usage, to reserve high potential of carbon sequestration.
Since the five southern provinces of China share a single power grid, the specific electricity-related situations and policies of a particular province have overall effects on southern China. Each region has different economic scales, electricity supply structures, and climate risk exposure, consequently leading to varying contributions of electricity carbon emission influencing factors. Therefore, the establishment of cogent policies and frameworks necessitates dynamic coordination considering the differences between provinces, to engender decarbonizing electricity supply and energy structure.
To effectively reduce electricity carbon emissions, China Southern Power Grid released its Carbon Peak and Carbon Neutrality Plan in 2021, driving the expansion of non-fossil energy installed capacity share and power generation volume (China Southern Power Grid Co, 2021). Additionally, Guangdong Province issued the 2024–2025 Energy Conservation and Carbon Reduction Action Plan in 2024, advancing large-scale offshore wind power development and high-quality distributed photovoltaic deployment (Government, 2024). These policies will directly reduce electricity carbon intensity and alleviate fossil fuel dependence, accelerating the carbon peaking trajectory. However, the demand surge driven by economic growth may partially offset structural emission reductions, highlighting the dual challenge for industrial powerhouses like Guangdong, Guangxi, and Guizhou in balancing development and low-carbon transition.
5 Discussion
5.1 Plausibility of the decomposition results
The decomposition attributes approximately 82% of the cumulative growth in electricity-related carbon emissions to macro-social drivers—namely population expansion and economic growth. This proportion is congruent with the region’s compound annual GDP growth rate of 6.4% and the 68% rise in residential electricity sales recorded in the China Energy Statistical Yearbooks (2014–2022). Notably, the marginal contribution of macro-social factors declines after 2017, coinciding with the commissioning of ultra-high-voltage transmission lines that enabled large-scale imports of low-carbon electricity, and with the accelerated retirement of sub-critical coal units in Guangdong following the enlargement of its pilot emissions-trading scheme in 2017. The temporal alignment between model output and these exogenous interventions lends credibility to the decomposition.
Guangdong demonstrates an 11% emission-reduction contribution from the cross-territorial dispatch (CTD) effect. Net electricity imports increased from 14 TWh in 2013 to 52 TWh in 2021, a volume that equates to roughly 32 Mt CO2 when benchmarked against Guangdong’s average coal intensity (China Southern Power Grid Co, 2021). Yunnan records a 19% mitigation contribution from the energy-structure effect, reflecting the rise of hydropower’s generation share. The 2021 drought, which precipitated a 30% short-term reduction in hydro output and an 18% compensatory increase in coal generation, illustrates the climate sensitivity of hydro-dominant systems and explains the volatility observed in the annual series (Yunnan Provincial Energy Bureau, 2022). Guangxi and Guizhou show modest efficiency-related abatements of 2%–3%, in line with National Energy Administration audits reporting heat-rate improvements of 2.9% and 3.6% respectively over the study period (National Energy Administration South China Regulatory Bureau, 2023; Guizhou Provincial Bureau of Statistics, 2015). Hainan exhibits a pronounced rise in macro-economic contribution after 2017 that is traceable to the Free-Trade Port initiative, during which real GDP grew by 39% between 2017 and 2021.
5.2 Data rationality and sources of uncertainty
Provincial average coal-fired emission factors may over-state Guangdong’s intensity—owing to its fleet of ultra-super-critical units—and under-state Guizhou’s, where smaller captive plants remain prevalent. The resulting bias is estimated to be within ±5 Mt CO2 per annum and does not alter the qualitative hierarchy of effects. Future research would benefit from unit-level dispatch data.
Annual aggregation obscures the short-term impact of hydrological shocks such as the 2021 Yunnan drought. Integrating runoff indices to construct a counter-factual hydro baseline would allow the separation of climate-induced volatility from structural change, thereby refining the energy-structure effect in hydro-rich provinces.
The omission of approximately 7 GW of rooftop photovoltaic capacity in Guangdong leads to a slight over-statement of consumption-based emissions. Feeder-level metering suggests that correcting for this hidden generation would reduce Guangdong’s 2021 electricity-related emissions by about 3%, marginally increasing the contribution of the energy-structure effect.
5.3 Policy interpretation in light of actual developments
First, the asymmetric CTD effect corroborates findings by Zhou et al. (2024) that uncoordinated provincial targets can displace rather than abolish emissions. A grid-level balancing mechanism analogous to the carbon-adjusted dispatch used in the PJM interconnection could internalize such spill-overs. Second, the temporary reversal of emission reductions during extreme events—exemplified by the 2021 Yunnan drought and the 2023 Guizhou ice storm—indicates that climate resilience must be treated as a precondition for sustained decarbonization. Embedding resilience criteria in provincial power-sector action plans would mitigate the risk of rebound emissions. Third, the dominance of macro-social drivers implies substantial mitigation potential on the demand side.
The LMDI results are broadly consistent with documented economic growth patterns, generation-mix shifts, and policy milestones in the Southern Power Grid. Nevertheless, the numerical findings must be interpreted alongside climate-related supply volatility, cross-border leakage through electricity trade, and untapped demand-side potential. By aligning the decomposition output with empirical developments, this thesis advances from a purely quantitative attribution toward a decision-relevant diagnosis of provincial pathways to a low-carbon electricity future.
5.4 Broader implications
First, by treating the five southern provinces as components of a single operational grid, the study shows that electricity-related emissions are shaped as much by network interactions as by provincial policies. The prominence of the cross-territorial dispatch term reveals emission transfers that conventional province-by-province inventories tend to mask. Recognising these transfers can help planners understand why identical macro-social pressures yield contrasting trajectories across the region.
Second, the year-to-year movement of factor contributions during droughts and ice storms illustrates how climatic volatility can erode structural gains. This empirical link between extreme weather and the stability of decomposition effects enriches an emerging conversation about power-system resilience, yet it does so through the lens of routine statistical reporting rather than bespoke climate models.
Third, the two-stage decomposition framework produces replicable, low-cost indicators—for example, the elasticity of emissions with respect to imported electricity or the share of growth attributable to macro-social drivers. These metrics require only standard Yearbook data and therefore travel easily to other multi-province grids, offering practitioners a quick way to rank mitigation levers before committing to more sophisticated modelling exercises.
Finally, by anchoring numerical shifts in the chronology of infrastructure upgrades, market reforms, and educational attainment, the analysis links technical attribution to institutional narratives. This fusion ensures the results read as reflections of ongoing socio-economic transformation rather than as abstract statistical artefacts.
5.5 Limitations
While this study offers valuable insights into regional carbon emission dynamics within the Southern Power Grid, several limitations warrant attention. First, the analysis relies primarily on aggregated statistical data at the provincial level, which may obscure intra-provincial disparities and prevent identification of sector-specific emission sources. Second, the study does not explicitly quantify the impact of extreme weather events—such as droughts or heatwaves—which may disrupt renewable energy production and undermine the stability of decarbonization in hydropower- or wind-dependent provinces. Third, due to the time lag in data availability, the study period ends in 2021, thus excluding the effects of post-2021 climate policies following China’s “Dual Carbon” pledge. These recent developments may have significantly altered regional electricity structures and emission patterns.
To address these limitations, future research could integrate higher-resolution datasets, including hourly electricity dispatch data, facility-level emissions, and spatially disaggregated demand statistics. Quantitative modeling of climate-policy co-evolution—particularly the interaction between extreme weather events and dynamic policy responses—could further improve forecasting accuracy. In addition, expanding the scope beyond electricity-related emissions to include industrial, transportation, and building sectors would allow for a more comprehensive assessment of decarbonization trajectories. Despite these limitations, this study provides a replicable analytical framework and region-specific findings that can support more informed, localized policymaking in the context of complex multi-provincial electricity systems.
5.6 Future works
To further enhance the robustness and applicability of the findings, it is important to evaluate the reasonableness of the results against real-world developments. For instance, the dominance of economic growth and electricity supply in driving emissions aligns with the rapid industrialization and growing electricity demand observed in Guangdong and Guangxi during the study period. Meanwhile, the role of energy structure improvements in mitigating emissions corresponds to Yunnan’s significant hydropower investments.
Moreover, the analysis is constrained by annual temporal resolution, preventing the disentanglement of structural trends from short-lived shocks. End-use granularity is limited; linking factor decomposition to sectoral load curves could identify the specific demand segments that dominate the macro-social effect. Integrating abatement cost curves would further allow the ranking of provincial mitigation priorities under fiscal constraints. These findings support the validity of the decomposition results within the context of regional development trajectories.
6 Conclusion
This study analyzes the contribution of factors influencing electricity-related carbon emissions to construct a roadmap for electricity carbon emission reduction. The analysis was conducted by classifying the contributing factors by category and characteristics and examining both cumulative and relative contributions.
In the overall analysis of factors influencing electricity-related carbon emissions, significant differences among provinces were not observed, with the contribution of per capita GDP being the most significant factor for carbon emission increase. Regarding carbon emission reduction, in some cases, the contribution of the fossil fuel generation ratio was less significant than that of the per capita electricity supply, especially in provinces with larger economies such as Guangdong, Guangxi, and Guizhou. Even when analyzing by category and stage, the contribution of the macro–social indicator such as GDP per capita was consistently the most significant factor affecting changes in electricity-related carbon emissions. The per capita electricity supply and factors related to it, such as electricity supply and transmission distribution sectors, had the most significant impact on carbon emission reduction.
Analyzing each period in two–year intervals yielded meaningful results. In the category analysis, policies related to electricity supply and macro–social indicators had a consistent impact regardless of changes in electricity-related carbon emissions, while policies related to emission intensity and energy structure varied in their impact. Therefore, it is suggested that while policies related to macro–social indicators may have limited effects, policies concerning energy structure and electricity supply can contribute significantly to carbon emission reduction. In the analysis by stage, while the shape of the effect of the power generation sector decreased over time, the size of the effect of other factors remained relatively consistent. Specifically, the population size effect had a relatively low contribution of approximately 5% to electricity-related carbon emissions.
This study reveals the necessity for province-specific decarbonization pathways: Economically significant provinces like Guuangdong, Guangxi, and Guizhou should prioritize regulating electricity supply intensity and industrial structure, while Yunnan and Hainanmust optimize fossil-fuel power generation mixes. To address carbon spatial transfer induced by Bei-Dian-Nan-Song (electricity transmission from northern to southern China), we propose establishing a cross-provincial responsibility-sharing mechanism for transmission-embedded carbon, integrating proportionate emissions from sending provinces into recipients’ carbon accounting systems. Given the limited mitigation elasticity of macroeconomic effects versus the high potential of energy restructuring, we recommend adopting “demand-side stabilization + supply-side restructuring” policy packages, prioritizing non-fossil energy substitution and energy efficiency projects.
The spatial transfer of emissions is pronounced, with limited long-term carbon reduction effects and even a slight increase in emissions (Wang Y. et al., 2024). To address this, we recommend establishing a more equitable responsibility-sharing mechanism. Specifically, recipient provinces should account for a reasonable portion of the transmission-embedded carbon emissions from sending provinces in their provincial carbon accounting. This should be accompanied by differentiated carbon reduction assessment criteria to prevent the blurring of emission reduction responsibilities due to spatial transfer.
In conclusion, despite differences in economic size among provinces, the direction of each driving factor remained consistent, with only minor differences in their contributions. However, by categorizing and analyzing factors by category and stage, significant heterogeneity among provinces was discovered. This heterogeneity was mainly observed in factors excluding macroeconomic effects such as emission intensity, energy structure, electricity supply, power generation, and transmission distribution sectors. Based on these findings, it is recommended to differentiate policies for each province to enhance their effectiveness in reducing carbon emissions.
Data availability statement
The data analyzed in this study is subject to the following licenses/restrictions: Electricity sector data were obtained from the Southern Power Grid Corporation of China under license agreements that restrict public sharing. Requests to access these datasets should be directed to Yanlu Huang, aHVhbmd5bEBjc2cuY24=.
Author contributions
YH: Writing – review and editing, Conceptualization, Methodology, Supervision, Funding acquisition, Software, Formal Analysis, Writing – original draft, Data curation. ZW: Methodology, Resources, Investigation, Writing – original draft, Visualization. FZ: Formal Analysis, Resources, Project administration, Investigation, Writing – original draft. JT: Investigation, Writing – original draft, Formal Analysis, Data curation. XH: Investigation, Software, Visualization, Project administration, Writing – original draft.
Funding
The author(s) declare that no financial support was received for the research and/or publication of this article.
Conflict of interest
Authors YH, ZW, FZ, JT, and XH were employed by Southern Power Grid Artificial Intelligence Technology Co., Ltd.
Generative AI statement
The author(s) declare that Generative AI was used in the creation of this manuscript.
Any alternative text (alt text) provided alongside figures in this article has been generated by Frontiers with the support of artificial intelligence and reasonable efforts have been made to ensure accuracy, including review by the authors wherever possible. If you identify any issues, please contact us.
Publisher’s note
All claims expressed in this article are solely those of the authors and do not necessarily represent those of their affiliated organizations, or those of the publisher, the editors and the reviewers. Any product that may be evaluated in this article, or claim that may be made by its manufacturer, is not guaranteed or endorsed by the publisher.
References
Ang, B. W. (2005). The LMDI approach to decomposition analysis: a practical guide. Energy Policy 33 (7), 867–871. doi:10.1016/j.enpol.2003.10.010
Ang, B. W. (2015). LMDI decomposition approach: a guide for implementation. Energy Policy 86, 233–238. doi:10.1016/j.enpol.2015.07.007
Ang, B., and Goh, T. (2016). Carbon intensity of electricity in ASEAN: drivers, performance and outlook. Energy Policy 98, 170–179. doi:10.1016/j.enpol.2016.08.027
Chen, X., Zhang, X., Zhang, Y., and Wan, C. (2009). Carbon sequestration potential of the stands under the grain for green program in Yunnan province, China. For. Ecol. Manag. 258 (3), 199–206. doi:10.1016/j.foreco.2008.07.010
Cheng, B., Dai, H., Wang, P., Xie, Y., Chen, L., Zhao, D., et al. (2016). Impacts of low-carbon power policy on carbon mitigation in Guangdong province, China. Energy Policy 88, 515–527. doi:10.1016/j.enpol.2015.11.006
Cheng, C., Chen, F., Li, G., Ristić, B., Mirchi, A., Qiyu, T., et al. (2018). Reform and renewables in China: the architecture of Yunnan's hydropower dominated electricity market. Renew. Sustain. Energy Rev. 94, 682–693. doi:10.1016/j.rser.2018.06.033
China Southern Power Grid Co, L. (2021). The southern power grid company releases an action plan to support carbon peaking and carbon neutrality goals. Available online at: http://www.sasac.gov.cn/n2588025/n2588124/c17645421/content.html (Accessed July 05, 2025).
Comission, G. P. D. a.R. (2015). The key points of Guangdong province's national low-carbon pilot work in 2015. Available online at: http://drc.gd.gov.cn/gfxwj5633/content/post_865540.html (Accessed July 05, 2025).
Demetriou, E., and Hadjistassou, C. (2021). Can China decarbonize its electricity sector? Energy Policy 148, 111917. doi:10.1016/j.enpol.2020.111917
Duan, S., and Su, Q. (2021). Driving forces of seasonal migratory retirees in the context of aging: a case study of sanya. Trop. Geogr. 41, 441–448. doi:10.13284/j.cnki.rddl.003319
Feng, X. (2017). Analysis on dynamic characteristics and influencing factors of carbon emissions from electricity. Technovation (20), 2.
Government, G. P. P. s. (2024). Guangdong province 2024–2025 energy conservation and carbon reduction action plan. Available online at: http://www.gd.gov.cn/zwgk/wjk/qbwj/yf/content/post_4637336.html (Accessed July 05, 2025).
Guizhou Provincial Bureau of Statistics (2015). Guizhou statistical yearbook 2014/2022 (in Chinese). Beijing: China Statistics Press.
Jiang, X.-T., and Li, R. (2017). Decoupling and decomposition analysis of carbon emissions from electric output in the United States. Sustainability 9 (6), 886. doi:10.3390/su9060886
Karmellos, M., Kosmadakis, V., Dimas, P., Tsakanikas, A., Fylaktos, N., Taliotis, C., et al. (2021). A decomposition and decoupling analysis of carbon dioxide emissions from electricity generation: evidence from the EU-27 and the UK. Energy 231, 120861. doi:10.1016/j.energy.2021.120861
Kim, H., Kim, M., Kim, H., and Park, S. (2020). Decomposition analysis of CO2 emission from electricity generation: comparison of OECD countries before and after the financial crisis. Energies 13 (14), 3522. doi:10.3390/en13143522
Koval, V., Khaustova, V., Lippolis, S., Ilyash, O., Salashenko, T., and Olczak, P. (2023). Fundamental shifts in the EU’s electric power sector development: LMDI decomposition analysis. Energies 16 (14), 5478. doi:10.3390/en16145478
Li, X., Liao, H., Du, Y.-F., Wang, C., Wang, J.-W., and Liu, Y. (2018). Carbon dioxide emissions from the electricity sector in major countries: a decomposition analysis. Environ. Sci. Pollut. Res. 25, 6814–6825. doi:10.1007/s11356-017-1013-z
Li, M., Patiño-Echeverri, D., and Zhang, J. J. (2019). Policies to promote energy efficiency and air emissions reductions in China's electric power generation sector during the 11th and 12th five-year plan periods: achievements, remaining challenges, and opportunities. Energy Policy 125, 429–444. doi:10.1016/j.enpol.2018.10.008
Li, Y., Zhang, N., Du, E., Liu, Y., Cai, X., and He, D. (2022). Mechanism study and benefit analysis on power system low carbon demand response based on carbon emission flow. Proc. CSEE 42 (8), 12.
Li, Y., Yang, L., and Luo, T. (2023). Energy system low-carbon transition under dual-carbon goals: the case of Guangxi, China using the EnergyPLAN tool. Energies 16 (8), 3416. doi:10.3390/en16083416
Liu, J. (2022). Research on the influencing factors of china’s carbon emission and the countermeasures based on the LMDI model. Ind. Econ. (20), 146–148.
Liu, S., Cai, B., Gao, M., Wu, Y., Chen, K., Zhu, X., et al. (2023). Empirical evidence for the edge of a centralized regional market over a cross-province balancing market in allocating electricity resources: a case study of Yunnan in China. Energy Rep. 9, 911–921. doi:10.1016/j.egyr.2023.04.219
Luo, S., Hu, W., Liu, W., Zhang, Z., Bai, C., Huang, Q., et al. (2022). Study on the decarbonization in China's power sector under the background of carbon neutrality by 2060. Renew. Sustain. Energy Rev. 166, 112618. doi:10.1016/j.rser.2022.112618
Mai, L., Ran, Q., and Wu, H. (2020). A LMDI decomposition analysis of carbon dioxide emissions from the electric power sector in northwest China. Nat. Resour. Model. 33 (4), e12284. doi:10.1111/nrm.12284
Meng, G., Yang, K., Zhu, F., Mao, Y., Zeng, Z., and Dong, X. (2018). Hainan of China: the evolution from a special economic zone to a comprehensive and compound free trade port. Geogr. Res. 37 (12), 2363–2382.
Ministry of Foreign Affairs, t.P.s.R.o.C (2020). Statement by H.E. Xi jinping president of the People's Republic of China at the general debate of the 75th session of the united nations general assembly. Available online at: https://www.fmprc.gov.cn/eng/wjdt_665385/zyjh_665391/202009/t20200922_678904.html (Accessed July 05, 2025).
Mostafaeipour, A., Bidokhti, A., Fakhrzad, M.-B., Sadegheih, A., and Mehrjerdi, Y. Z. (2022). A new model for the use of renewable electricity to reduce carbon dioxide emissions. Energy 238, 121602. doi:10.1016/j.energy.2021.121602
National Energy Administration South China Regulatory Bureau (2023). Circular on energy-saving and emission-reduction performance of coal and gas power plants in Guangdong, Guangxi and Hainan, 2022.
Peng, X., and Tao, X. (2018). Decomposition of carbon intensity in electricity production: technological innovation and structural adjustment in China's power sector. J. Clean. Prod. 172, 805–818. doi:10.1016/j.jclepro.2017.10.236
Province, P. s.G. o.G. (2019). Regulations of Guangdong province on power supply and consumption. Available online at: https://www.gd.gov.cn/zwgk/wjk/zcfgk/content/post_2532508.html (Accessed July 05, 2025).
Van Vuuren, D. P., Hoogwijk, M., Barker, T., Riahi, K., Boeters, S., Chateau, J., et al. (2009). Comparison of top-down and bottom-up estimates of sectoral and regional greenhouse gas emission reduction potentials. Energy policy 37 (12), 5125–5139. doi:10.1016/j.enpol.2009.07.024
Wang, H., and Yang, Y. (2023). Decomposition analysis applied to energy and emissions: a literature review. Front. Eng. Manag. 10 (4), 625–639. doi:10.1007/s42524-023-0270-4
Wang, Y., Yan, Q., Yang, J., Komonpipat, S., and Zhang, Q. (2024). Can inter-provincial transmission reduce regional carbon emissions? Evidence from China. Energy Policy 184, 113915. doi:10.1016/j.enpol.2023.113915
Wang, Z., Li, J., Wang, B., Hui, N. S., Lu, B., Wang, C., et al. (2024). The decarbonization pathway of power system by high-resolution model under different policy scenarios in China. Appl. Energy 355, 122235. doi:10.1016/j.apenergy.2023.122235
Wei, H., Zhan, T., Yi, Z., Shuo, W., and Yan, L. (2023). A study on the drivers of carbon emissions in china’s power industry based on an improved PDA method. Systems 11 (10), 495. doi:10.3390/systems11100495
Yan, Q., Zhang, Q., and Zou, X. (2016). Decomposition analysis of carbon dioxide emissions in China's regional thermal electricity generation, 2000–2020. Energy 112, 788–794. doi:10.1016/j.energy.2016.06.136
Yan, J., Yang, W., Min, Z., and Yang, M. (2022). Innovation strategy for green development and carbon neutralization in Guizhou—An overview. Sustainability 14 (21), 14377. doi:10.3390/su142114377
Yang, S. (2020). Analysis of China's carbon emissions trajectory, driving factors and reduction measures. Environ. Sci. and Technol.
Yao, L., and Chang, Y. (2014). Energy security in China: a quantitative analysis and policy implications. Energy Policy 67, 595–604. doi:10.1016/j.enpol.2013.12.047
Yao, Y., Zhang, L., Salim, R., and Rafiq, S. (2021). The effect of human capital on CO2 emissions: macro evidence from China. Energy J. 42 (6), 91–120. doi:10.5547/01956574.42.6.yyao
Yunnan Provincial Energy Bureau (2022). Report on the impact of the 2021 severe drought on hydropower generation
Zhang, M., Liu, X., Wang, W., and Zhou, M. (2013). Decomposition analysis of CO2 emissions from electricity generation in China. Energy policy 52, 159–165. doi:10.1016/j.enpol.2012.10.013
Zhang, P., Cai, W., Yao, M., Wang, Z., Yang, L., and Wei, W. (2020). Urban carbon emissions associated with electricity consumption in beijing and the driving factors. Appl. Energy 275, 115425. doi:10.1016/j.apenergy.2020.115425
Zhang, Y., Lu, G., Wang, P., Weng, Y., Wu, S., Liu, J., et al. (2020). Analysis on the improvement path of non-fossil energy consumption proportion and terminal electrification rate under the new energy security strategy. Electr. Power 53 (2), 1–8.
Zhang, Y., Yu, Z., and Zhang, J. (2022). Research on carbon emission differences decomposition and spatial heterogeneity pattern of China’s eight economic regions. Environ. Sci. Pollut. Res. 29 (20), 29976–29992. doi:10.1007/s11356-021-17935-z
Zhao, J., Li, J., Pan, F., Yang, Y., Huang, J., Lin, G., et al. (2023). Current status and future prospects of electricity carbon emission measurement technology. Electr. Meas. and Instrum. 60 (3), 1–8.
Zheng, M., Wu, W., Li, Y., Zhang, Y., and Sun, H. (2023). Research on carbon emission peak path for power industry in Guangdong. GUANGDONG Electr. POWER 36 (1), 29–34.
Zhou, C., Lin, X., Wang, R., and Song, B. (2023). Real-time carbon emissions monitoring of high-energy-consumption enterprises in Guangxi based on electricity big data. Energies 16 (13), 5124. doi:10.3390/en16135124
Keywords: carbon emissions, power sector, decomposition analysis, driving factors, carbon neutrality
Citation: Huang Y, Wang Z, Zhang F, Tan J and Hu X (2025) Key factors influencing CO2 emissions in the southern power grid of China. Front. Environ. Sci. 13:1603809. doi: 10.3389/fenvs.2025.1603809
Received: 01 April 2025; Accepted: 25 July 2025;
Published: 25 August 2025.
Edited by:
Lin Zhang, City University of Hong Kong, Hong Kong SAR, ChinaReviewed by:
Guangnian Xiao, Shanghai Maritime University, ChinaZiqiao Zhou, Peking University, China
Copyright © 2025 Huang, Wang, Zhang, Tan and Hu. This is an open-access article distributed under the terms of the Creative Commons Attribution License (CC BY). The use, distribution or reproduction in other forums is permitted, provided the original author(s) and the copyright owner(s) are credited and that the original publication in this journal is cited, in accordance with accepted academic practice. No use, distribution or reproduction is permitted which does not comply with these terms.
*Correspondence: Yanlu Huang, aHVhbmd5YW5sdV8yMEAxNjMuY29t