 Leer Bao1
 Nan Xiao
- 1Meteorological Bureau of Alxa League, Inner Mongolia Autonomous Region, Bayanhot, Inner Mongolia, China
- 2College of Geographical Science, Inner Mongolia Normal University, Hohhot, Inner Mongolia, China
As a meteorological disaster, sandstorm largely impacts on the human society and the natural environment and has been receiving increasing attention. The planetary boundary layer is a key area connecting the surface and the free atmosphere, and its structure and change play a decisive role in the occurrence, development and dissipation of sandstorms. However, the theories and methods of synoptic and meteorological disciplines are mainly used to study the characteristics and causes of sandstorm process, while mesoscale analysis methods such as vertical variation characteristics of high-altitude wind field and atmospheric circulation characteristics are rarely used to study the process and causes of sandstorm. In this study, the change characteristics of planetary boundary layer of a sandstorm were analyzed by using vertical observation. The results showed that: 1) the downward transfer of momentum and the abrupt change in wind speed are the key indicators indicating the occurrence of sandstorms. The explosive downward movement of the cold advection in the lower layer strengthens the lifting of the warm advection, providing a powerful driving force for the occurrence of severe sandstorms. 2) Monitoring changes in the frontogenesis function provides a new perspective for predicting severe sandstorms. By analyzing the frontogenesis function, the dynamic and thermal conditions of the atmosphere can be understood. The potential for sandstorm occurrence can be assessed, and the severity of sandstorms can be predicted. 3) The formation of the dry atmospheric junction and the inversion layer affected the initiation, transportation, and deposition processes of sand and dust. The vertical distribution characteristics of the extinction coefficient and the depolarization ratio, showed the enhancement of turbulent activities during the sandstorm, which is another important characteristic of the changes in the PBL during the sandstorm. The results of the study will help to improve the understanding of sandstorms, provide a scientific basis for their monitoring, forecasting and prevention, and support the development of effective environmental management and mitigation strategies.
1 Introduction
Sandstorms, as a meteorological occurrence with significant environmental and health implications, are intense, wide-spread, and severe (Wang et al., 2025; Zhao et al., 2023). They not only directly impact local human society and the natural environment, but also can be transported over long distances, affecting a broader area (Li et al., 2025; Wang W. et al., 2024). Thus, it is necessary to accurately forecast and effectively monitor sandstorms in order to reduce their negative impacts (Wang N. et al., 2024; Zhang C. et al., 2022). The planetary boundary layer (PBL), as a crucial region linking the Earth surface to the free atmosphere, has a decisive influence on the occurrence, development, and dissipation of sandstorms (Li et al., 2014; Tu et al., 2022). The vertical distribution of meteorological parameters within the PBL, such as temperature, humidity, wind speed and wind direction, directly impacts the initiation mechanism, transport paths, and deposition process of sand and dust (Liu et al., 2013).
Sandy and dusty weather exhibits distinct regional characteristics (Zhang C. et al., 2024). The dust source is not only local but also involves cross-regional air flow transport, and the trajectory of the transport significantly impacts the spread and dispersion of dust (Li and Zhang, 2010; Wang et al., 2003). Since dust release is conditioned by the wind intensity to initiate sandblasting (Dupont et al., 2019), although vertical variations in wind fields near the surface during dust storms can be provided by combining multiple classic field measurement tool, the ultrasonic anemometer. Traditionally, research on the characteristics and causes of sandstorm process mainly relies on theories and methods from the fields of weather science and meteorology (Yang et al., 2022). In contrast, few studies have been conducted to analyze the process and causes of sandstorms using the vertical variation characteristics of large-scale wind fields (Baoler, 2021). With the development of vertical observation, such as the application of radiosonde, lidar, and wind profile radar, researchers can obtain more accurate data on the vertical structure of the atmosphere (Yu et al., 2022). This provides the possibility of in-depth study of the PBL changes during sandstorms.
Lidar technology is being increasingly applied in atmospheric science, especially in the detection and analysis of aerosol particles (Harm-Altstädter et al., 2024; Wang and Hua, 2024). The extinction coefficient serves as a crucial parameter in lidar-based investigations of atmospheric properties. It effectively reflects the concentration of particulate matter present within the atmosphere. During sandstorms, the sharp change in the extinction coefficient can reflect the variation in the concentration and distribution of sand and dust (Cai et al., 2022). This offers an opportunity to understand the vertical distribution characteristics of atmospheric particulate matter concentration during sandstorms and the impact of the inversion layer on the vertical dispersion of dust (Liao et al., 2023), and also serves as evidence for analyzing the intensity and influence range of sandstorms (Gulisitan et al., 2024). The polarization properties of aerosol particles provide a unique way to identify and distinguish different types of particles (Wang et al., 2020). The depolarization ratio, which measures the change in the polarization state of backscattered light, is important for identifying non-spherical particles in the atmosphere, such as cirrus clouds and dust aerosols (Liu et al., 2012). This provides a quantitative description for understanding the physical processes of sandstorms, the vertical structure and dynamics of non-spherical particles in the atmosphere, and offers strong support for future meteorological forecasting and disaster prevention (Bi et al., 2022). These metrics lay a solid foundation for understanding the physical changes in the PBL during sandstorms and assessing the impacts of sandstorms on air quality and human health (Wang et al., 2022). They are also important for improving the accuracy of sandstorm forecasting and for effective disaster prevention and emergency response (Wang and Hua, 2024). Nevertheless, due to the lack of systematic observation and analysis of the PBL changes during sandstorms, the current understanding of the sandstorm process remains limited (Bai et al., 2016; Li Y. et al., 2022; Li et al., 2011).
Alxa League in Inner Mongolia, China, is prone to sandstorms due to its windy spring and low surface vegetation cover. In recent years, it has experienced frequent sandstorms, which pose a major challenge to the lives and economic development of local residents (Baoler, 2021). In this study, based on the vertical observation (VO), taking the largest-scale and strongest-intensity sandstorm that occurred in Alxa League from the night of April 12 to April 13, 2024 since the beginning of the spring as an example, the changes of related indices in the PBL during this sandstorm process were analyzed in detail. These changes included in meteorological parameters, inversion phenomena, and turbulence activities, as well as other key meteorological features. The exploration was carried out on how to achieve the early warning of the occurrence and development of sandstorms by monitoring the PBL with the VO. The study results will contribute to a deeper understanding of sandstorms, provide a solid scientific basis for the monitoring, forecasting, and prevention of sandstorms, enabling more informed and effective decision-making in dealing with such meteorological phenomena.
2 Materials and methods
2.1 Data sources
The routine observation data mainly consisted of ground-based observation data and high-altitude detection data. Ground-based automatic station data were sourced from 9 basic meteorological stations in Alxa League. These stations provide fundamental meteorological elements such as air temperature, air pressure, wind speed, and visibility. All the times involved in this research are in Beijing time. The high-altitude meteorological sounding data were obtained from the Dalaihubu meteorological station (101.1°E, 42.0°N) in Alxa League at 08:00 and 20:00. The vertical observation of meteorological elements, including air pressure, temperature, wind direction, and wind speed, within an altitude range of 30 km from the ground was achieved through the deployment of sounding balloons and the integration of ground radar tracking.
The wind profile chart was derived from the wind profile radar. The wind profile radar of model YKD1, produced by Beijing Metstar Radar Co., Ltd., was selected. It operates in the CFL-06L band, with a resolution of 0.2 m·s−1 for wind speed, a resolution of 0.5° for wind direction, and a temporal resolution of 0.5 min. The PM10 concentration, extinction coefficient, and depolarization ratio were obtained through the aerosol radar detection. The data were retrieved from the Tianheng Tianyan Integrated Meteorological Observation Quality Control and Product Service System 1.0 on the internal website of the meteorological bureau. The aerosol radar of model YLJ1 manufactured by Wuxi CAS Photonics Co., Ltd., was employed. It operates at three wavelengths: 355 nm, 532 nm, and 1,064 nm, with a temporal resolution of 1 min. For a dry and clean atmosphere, its effective detection distance is ≥5 km during the day and ≥10 km at night. The extinction coefficient and depolarization ratio during this sandstorm were derived from aerosol measurements in 532 nm band. The extinction coefficient was retrieved by Fernald method (Fernald, 1984). The depolarization ratio is the ratio of the vertical component to the horizontal component of the backscattering signal.
The ERA5 atmospheric reanalysis dataset, released by the European Centre for Medium-Range Weather Forecasts (ECMWF), with a spatial resolution of 0.25°×0.25° and a temporal resolution of 1 h, was used for the analysis of the circulation background of the sandstorm process and the changes in physical-quantity fields. It served to compensate for the sparse distribution of observation stations and the limited number of meteorological elements in the study area. The Hybrid Single-Particle Lagrangian Integrated Trajectory Model (HYSPLIT) was applied to analyze the sand-dust transport trajectory (Chen et al., 2024; Fan et al., 2024). It employs the weather reanalysis data of the Global Data Assimilation System (GDAS), provided by the National Centers for Environmental Prediction (NCEP) of the United States, with a spatial resolution of 1°×1° and a temporal resolution of 6 h.
2.2 Research methods
In meteorology, the frontogenesis function is a physical quantity that describes the impact of temperature-gradient changes in the vicinity of fronts on the development of fronts. It predicts the development and movement of fronts by analyzing the inhomogeneity of the temperature field (Yao and Yu, 2001). The perfect Q vector (mesoscale numerical forecast, Equation 1) not only reflects the differential effects of the horizontal and vertical shear of the wind field, but also accounts for the non-adiabatic effects resulting from the change process of wind field.
Where, f represents the Coriolis parameter of the Earth. In the f-plane, P-coordinate system, Q* represents the vector sum of Qx* (pointing in the direction of the updraft area, as defined in Equation 2) and Qy* (pointing in the direction opposite to the downdraft area, as defined in Equation 3). ua denotes the latitudinal geostrophic deviation. va represents the meridional geostrophic deviation. ω is the vertical velocity, and σ is the parameter of static stability.
Under the action of non-adiabatic heating, the change of horizontal gradient of temperature affects the strengthening and weakening of the front zone, because of the heat exchange between the cold and warm air masses on both sides of the front and the underlying surface at any time. Therefore, the perfect Q vector frontogenesis function (Equation 4) can reflect the strengthening and weakening of the front region.
Where, θse represents the pseudo-equivalent potential temperature. When FQ*>0, it indicates that the perfect Q vector points towards the cold air, signifying frontal growth. This implies that the frontal area is predicted to be strengthened in the future. Conversely, when FQ*<0, it means that the perfect Q vector points towards the warm air, representing frontal cancellation, and suggesting that the frontal area will be weakened in the future.
The real-time monitored meteorological data from 20:00 on 12 April 2024 to 20:00 on 13 April 2024 in Alxa region were mainly processed and analyzed using the man-machine interactive meteorological information processing and weather forecast production system MICAPS 4.5 network platform. HYSPLIT was used to simulate the transport trajectories of sand and dust particles during this sandstorm, and to track the transport, sedimentation and diffusion process of aerosol particles in the atmosphere. The Dalaihubu station was chosen as the proposed receiving point. The transport trajectory of sand and dust was obtained by simulating the mixed layer for 120 h prior to the onset of the sandstorm.
The latest national standard for “Grades of Sandstorm Weather” in China (GB/T 20480-2017) specifies the grades of single-station and regional sandstorm weather. Among them, blowing sand refers to the weather phenomenon where wind blows up dust and sand from the ground, making the air rather turbid, with horizontal visibility within 1 km to 10 km. Sand and dust storm refers to the weather phenomenon where strong wind blows up dust and sand from the ground, making the air very turbid, with horizontal visibility less than 1 km. Severe sand and dust storm refers to the weather phenomenon where strong gale blows up dust and sand from the ground, making the air extremely turbid, with horizontal visibility less than 500 m.
3 Results
3.1 Preliminary weather characteristics and sandstorm conditions
3.1.1 Circulation
This sandstorm belongs to the cyclone-type. The sandstorm process commenced at night. At 20:00 on 12 April 2024 (figure omitted), an obvious stepped trough was present in the middle and high latitudes of Eurasia. The strong northerly wind jet behind the trough and in front of the ridge continuously transported cold air southward. At 08:00 on April 13 (figure omitted), the cold trough in the northern part of Xinjiang shifted southward and was pressurized eastward. It superimposed in phase on the short-wave trough in the southern branch over Alxa, enhancing its meridionality and providing more favorable conditions for dynamic lifting. During this process, the interaction between the positive vorticity advection in front of the trough and the negative vorticity advection behind the trough and in front of the ridge was conducive to the enhancement of low-level low pressure and high pressure.
The intensity of the surface low pressure increased from 997.5 hPa at 20:00 on April 12 (Figure 1a) to 995 hPa at 08:00 on April 13 (Figure 1c), and the scope of the low-pressure area extended southward. Simultaneously, the cold high-pressure in the area north of Xinjiang increased from 1,022.5 hPa to 1,025 hPa. The cold air from the west of Alxa League and the Gansu area to the southeast invaded the surface low pressure, intensifying it into a cyclone. With the strengthening of the surface cyclone, from 03:00 (Figure 1b) to 08:00 (Figure 1c) on April 13, gusty winds and sandstorms occurred in the western and central parts of Ejin Banner, Alxa League, and a strong sandstorm hit the Dalaihubu area.
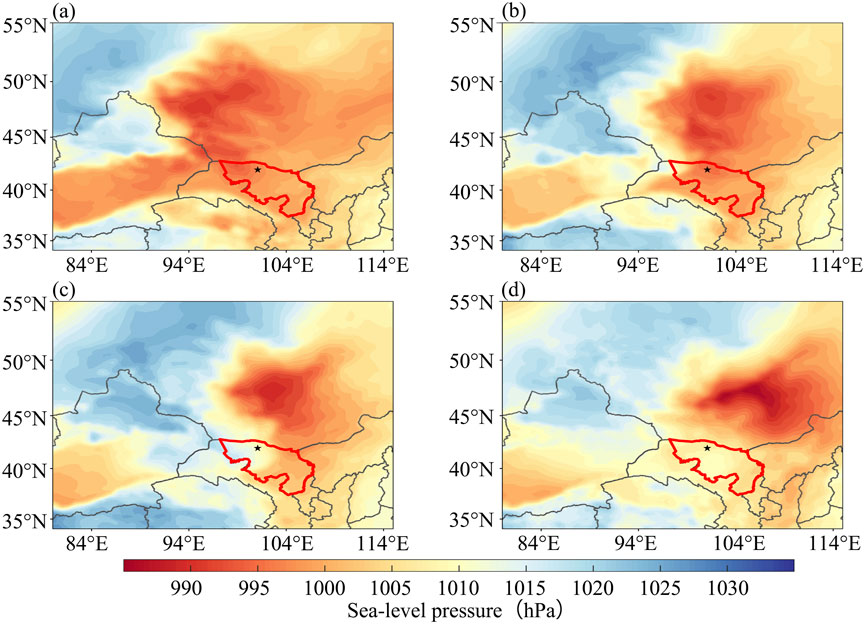
Figure 1. Color map of the sea level pressure field (unit: hPa) in Alxa region at 20:00 on April 12 (a), 03:00 on April 13 (b), 08:00 on April 13 (c), and 14:00 on April 13 (d) (★ in the figure is the Dalaihubu station).
This sandstorm process originated in eastern Xinjiang on the night of April 12 and reached Ejin Banner, Alxa League in the early morning of April 13. The continuous supplementary supply of sand sources led to a continuous strengthening of the concentration of sand and dust, escalating to sandstorm and strong sandstorm. At 14:00 on April 13 (Figure 1d), the surface cyclone was further strengthened to 990 hPa. Sandstorms were observed wherever the cyclonic cold front reached, with a strong sandstorm occurring at Bayannuoergong station. At 20:00 on April 13 (figure omitted), as the cold trough continued to move eastward to the Hetao area, most of Alxa League came under the control of the northwester air flow behind the trough. At this moment, the control range of the cyclone had basically moved out of most areas of Alxa League. The air pressure gradient decreased significantly, and the wind weakened. The eastern part of Alxa League transitioned from sandstorms and blowing sand to floating dust weather. The intensity of the cold high-pressure in the northern part of Xinjiang also weakened. These changes marked that the sandstorm in most parts of the Alxa League began to weaken and tended to end.
3.1.2 Frontogenesis function
At 20:00 on April 12, the 700 hPa circulation situation field (figure omitted) revealed that, the isotherms were approximately perpendicular to the height. The Q vector frontogenesis function plot at 850 hPa (about 1,500 m above the ground) indicated that, prior to the onset of the sandstorm process, there was no obvious frontogenesis and frontolysis phenomena in most parts of Alxa League (Figure 2a). At 03:00 on April 13, the strong frontogenesis center was located in the western part of Ejin Banner, with an evident frontogenesis. The strongest frontogenesis function reached up to 5.2 × 10⁻¹² K·m−1·s−1 (Figure 2b). Moreover, frontogenesis was accompanied by an equally intense frontolysis phenomena, with an intensity of up to −5.9 × 10⁻¹² K·m−1·s−1. This indicated the presence of a strong temperature gradient, which was caused by the northwestern wind jet moving horizontally through the isothermal intensive region. Under the influence of cold and warm air masses on both sides of the front, the horizontal temperature gradient of the front increased, and the intensity of the frontal area was strengthened. This was manifested by the occurrence of a force 9 gale in the frontogenesis area, and the temperature difference between the two sides of the front reached up to 18°C. With the intensification of the frontogenesis process, the pressure gradient increased before and after the cold front, and the isallobaric wind increased. Specifically, the movement of rising and sinking before and after the cold front was strengthened, accompanied by a decrease and increase in air pressure. In the lower-level frontal zone, the increase in temperature gradient and the enhancement of frontal secondary circulation provided favorable conditions for the occurrence of the sandstorm. With the eastward movement of the south-north oriented frontogenesis region, a strong sandstorm appeared in Dalaihubu at 03:40 on April 13, followed by a strong sandstorm wherever the strong frontogenesis region reached.
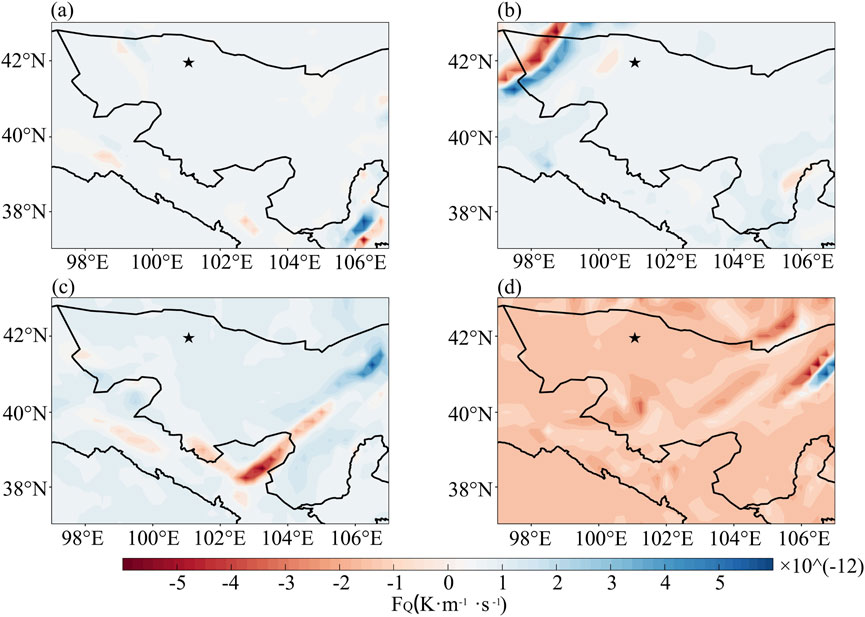
Figure 2. 850 hPa Q vector frontogenesis function distribution map (unit: K·m−1·s−1, ★ in the figure is the Dalaihubu station) in Alxa region at 20:00 on April 12 (a), 03:00 on April 13 (b), 08:00 on April 13 (c), and 14:00 on April 13 (d).
At 08:00 on April 13, as the frontal zone moved eastward, the strong frontogenesis zone shifted to the northeastern part of Alxa League, with an intensity of 5.0 × 10⁻¹² K·m−1·s−1. Most of Alxa League was under the control of the cold air behind the cold front (Figure 2c). This indicated that although the intensity of the frontogenesis weakened, the sandstorm persisted due to the continuous replenishment of cold air. The strong wind and sandstorm intensified in the areas passed by the strong frontogenesis zone. At 14:00 on April 13, the frontogenesis zone moved out, and most areas of Alxa League were in the frontolysis zone (Figure 2d), indicating that the intensity of the sandstorm would tend to weaken.
3.1.3 Atmospheric junction condition
Prior to the occurrence of the sandstorm at 20:00 on April 12, at the Dalaihubu station, the difference between the potential temperature and the pseudo-equivalent potential temperature was relatively small. Conversely, the difference between the saturated pseudo-equivalent potential temperature and the pseudo-equivalent potential temperature was considerably large (Figure 3a).
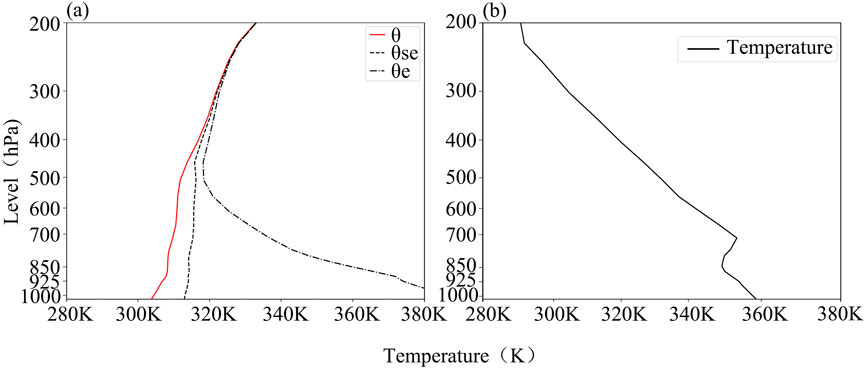
Figure 3. Vertical potential temperature map (a) at 20:00 on April 12 and vertical air temperature map (b) at 08:00 on April 13 at Dalaihubu station.
The potential temperature line and the pseudo-equivalent potential temperature line were approximately perpendicular to the horizontal axis below 400 hPa. At 08:00 on April 13 (Figure 3b), there was a temperature inversion layer within the range of 850–700 hPa. Meanwhile, within the range from the near surface to 600 hPa, the wind direction changed from a clockwise rotation at 20:00 on April 12 to a counterclockwise rotation at 08:00 on April 13 (figure omitted).
3.1.4 Surface meteorological elements
Dusty weather was observed at all the 9 national meteorological stations in Alxa League. Specifically, strong sandstorms occurred in Dalaihubu (with a minimum visibility of 241 m) and Bayannuur Gong (with a minimum visibility of 441 m). Sandstorms occurred in Guaizihu, Badain Jaran Town, Yabrai, Jartai and the High-tech Zone. Dust flying weather occurred in Bayan Hot and Luanjingtan. The sandstorm process developed from west to east. In the late afternoon of April 12, floating dust and sand first emerged in Xinjiang, the upstream region of the Alxa League. With the eastward movement of the cyclone cold front, in the early morning of April 13, the wind speed increased in the western part of the Alxa League, and the visibility decreased dramatically. The large-scale gusty wind sandstorm process broke out.
At Dalaihubu station, the extreme wind speed increased from 6.7 m·s−1–13.8 m·s−1 from 02:00 to 04:00 on April 13, and the minimum visibility plummeted to 400 m (Figure 4a). As the sandstorm process continued to develop, between 04:00 and 08:00, the air pressure rose from 895.2 hPa to 901.4 hPa. From 05:00 to 08:00, the temperature dropped by 6.5°C within 3 h. By 08:00, the temperature reached its lowest point, dropping to 5.8°C. At 08:00, the minimum visibility dropped to its lowest level, which was 241 m. From 08:00 to 11:00, the visibility improved slightly, and the extreme wind speed gradually decreased. Between12:00 and 17:00, the minimum visibility remained persistently low, staying below 2000 m, and it rebounded rapidly after 18:00.
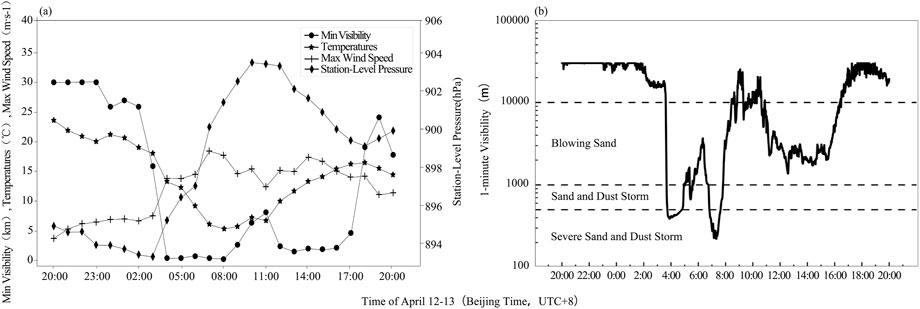
Figure 4. Temporal variation charts of meteorological elements at Dalaihubu station from 20:00 on April 12 to 20:00 on April 13: hourly meteorological observation elements (a) and visibility with a resolution of 1-minute (b).
According to the visibility at a height of 2.8 m at Dalaihubu station with a resolution of 1-minute, the visibility had been continuously decreasing since 01:26 on April 13 (Figure 4b). Blowing sand occurred from 03:38 to 03:40, and intensified into sand and dust storm from 03:41 to 03:44. Severe sand and dust storm began to occur at 03:45. It weakened to blowing sand from 07:50 and disappeared from 8:27. Blowing sand occurred again from 10:54 to 16:22, and began to disappear at 16:23.
3.2 Vertical observation characteristics of the PBL during sandstorm processes
3.2.1 Distribution characteristics of wind profile
Before the sandstorm occurred at 01:00 on April 13, the wind direction at Dalaihubu station was mainly southwest from the near surface to the 2000 m (Figure 5). At 02:00, the wind direction changed significantly to westerly and northwesterly. At 03:00, the wind speed from near the ground to around 600 m decreased to less than 10 m·s−1. At 04:00, the wind speed from near the ground to around 500 m suddenly increased to 14 m·s−1, and the wind direction changed to northwesterly.
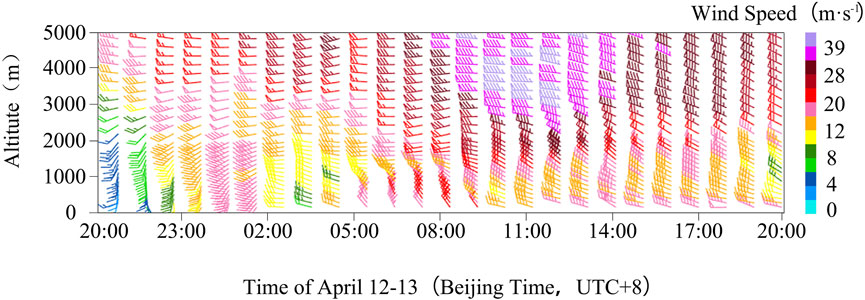
Figure 5. Altime-to-time wind plume chart of wind profile at Dalaihubu station from 20:00 on April 12 to 20:00 on April 13 (wind plume unit: m·s-1).
Between 10:00 and 11:00, the near-surface wind speed decreased to about 12 m·s−1. With the replenishment of cold air, the wind speed increased again to 17 m·s−1 at 12:00. Compared with the first phase of the sandstorm, the high-value area of the northwest wind (wind speeds ≥25 m·s−1) further expanded and showed the downward propagation in the second phase.
3.2.2 Vertical changes of the high-altitude wind field
In terms of the U-wind (Figure 6a), during this sandstorm, the entire atmosphere at the Dalaihubu station was under the control of westerly winds. From 20:00 on April 12 to 02:00 on April 13, the wind speed below 850 hPa was less than 15 m·s−1. At around 01:30 on April 13, there was a closed center of maximum wind speed of more than 15 m·s−1 around 775 hPa. From 03:00 to 08:00 on April 13, the wind speed of 850–300 hPa increased rapidly, and the strong wind speed band extended from the upper level to the lower level. At 04:00, the strong wind region propagated strongly downward. At around 08:00, a closed center of 40 m·s−1 was formed around 400–300 hPa. Below 600 hPa, the atmospheric iso-wind speed lines were dense, and the effect of downward propagation of momentum from the high-altitude was evident. From 08:00 to 17:00, the wind was strong in the middle and lower levels.
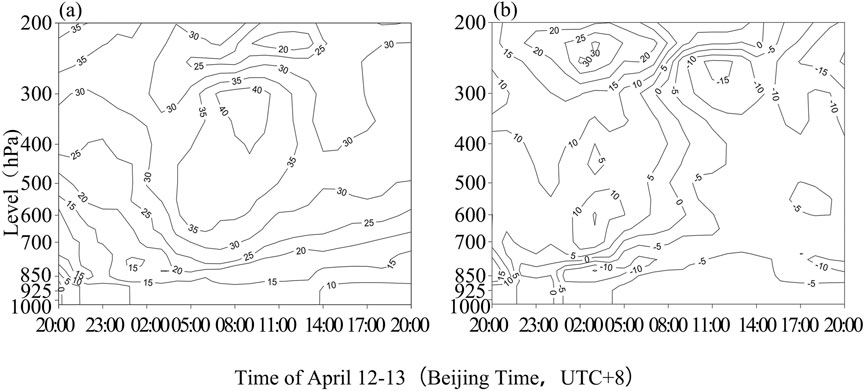
Figure 6. U (a), V (b) component level-time diagram at Dalaikhubu station from 20:00 on April 12 to 20:00 on April 13 (contour unit: m·s−1).
Regarding the V-wind (Figure 6b), before 00:00 on April 13 at Dalaikhubu station, the entire atmosphere was controlled by southerly winds. At about 01:30 on April 13, the region of strong southerly winds propagated strongly downward. At around 02:00 on April 13, the atmosphere below 850 hPa was rapidly replaced by northerly winds, with a sudden increase in wind speed. After 03:00, the entire atmosphere gradually changed from southerly winds to northerly winds, and the actual composite wind direction became northwesterly. At about 03:40, there was a closed center of maximum wind speed in the north near 825 hPa. At 08:00 and 11:00, a region of strong northerly winds propagated strongly downward. At 17:00, there was a closed center of maximum wind speed in the north near 750 hPa.
3.2.3 Vertical distributions of temperature advection
At 00:30 on April 13, a cold advection emerged near the ground at Dalaikhubu station (Figure 7). At 01:30, the cold advection subsided. At 04:00, both cold and warm advection showed a rapid intensification. In particular, the cold advection descended to the ground, and a high value center of −16.69 × 10⁻⁴ K·s−1 was observed at 406 m.
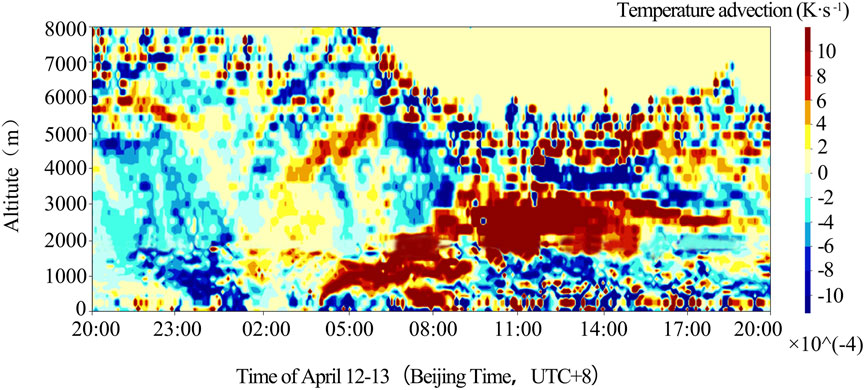
Figure 7. Temperature advection height-time diagram at Dalaihubu station from 20:00 on April 12 to 20:00 on April 13 (temperature advection unit K·s-1).
From 08:00 to 10:00, after the strong sandstorm occurred, the near surface was briefly under the control of warm advection. Between11:00 and 17:00, the low level was basically controlled by cold advection, while the warm advection was lifted to a height of more than 2000 m.
3.2.4 Vertical distributions of extinction coefficient
At 22:00 on April 12, the high value area of extinction coefficient over the Dalaihubu station was located at an altitude of approximately 5,000 m (Figure 8). At 01:00 on April 13, due to the triggering of the strong northwest wind behind the cold front, the atmospheric turbulence intensified, and the extinction coefficient near the surface began to increase. At 03:40, the concentration of dust aerosols increased sharply. The aggregation layer of dust aerosols was located at an altitude below 1,300 m. At this time, the recorded maximum extinction coefficient reached 11.01 km−1, indicating a severe sandstorm.
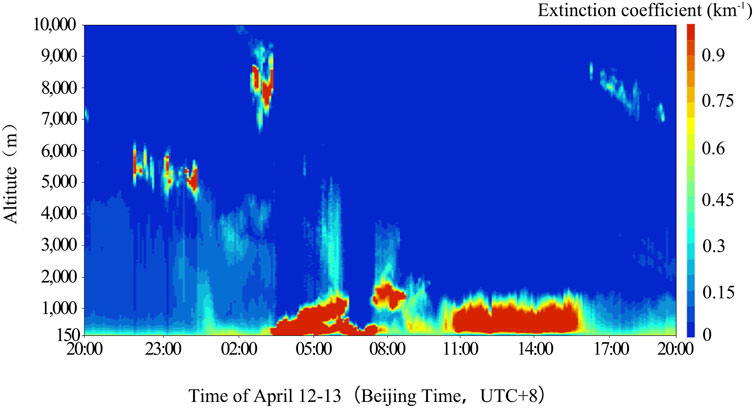
Figure 8. Height-time diagram of extinction coefficient at Dalaihubu station from 20:00 on April 12 to 20:00 on April 13 (unit: km−1).
From 08:00 to 10:00, the center of the dust layer was slightly elevated to a height of 1700 m. The extinction coefficient was relatively lower, and the extinction coefficient near the surface was weakened. Between 08:00 and 12:00, as the cold air moved eastward and southward as a supplement, the visibility briefly improved (6,000–8,000 m) and then declined again at 14:00 (below 2000 m).
From 11:00 to 17:00, the extinction coefficient increased sharply again. A dust layer with a thickness of about 1,000 m was continuously maintained at an altitude below 1,300 m. The observation results of the lidar showed that during this severe sandstorm process, due to the complete attenuation of the laser beam within the dust layer, the observation of the cloud system above the dust layer was severely affected.
3.2.5 Vertical distributions of depolarization ratio
At 03:40 on April 13, the depolarization ratio of aerosol particles at a height of 203 m at the Dalaihubu station was already as high as 0.18, and the extreme value area of the depolarization ratio was concentrated in the area below 570 m (Figure 9). From 08:00 to 10:00, the height of the maximum depolarization ratio was lifted, and the value was reduced to 0.14, with the near-surface depolarization ratio weakening.
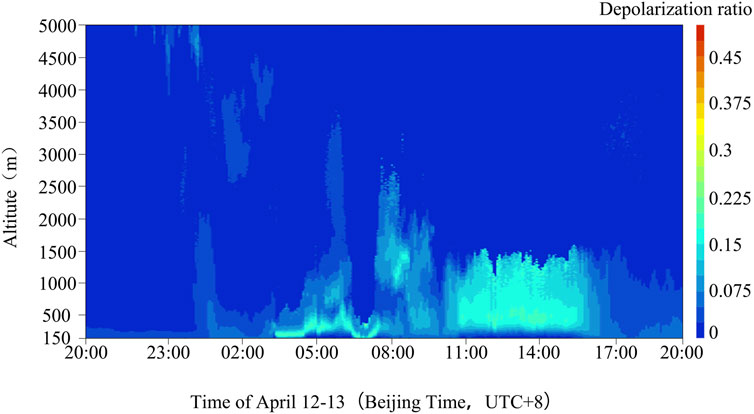
Figure 9. Height-time chart of depolarization ratio at Dalaihubu station from 20:00 on April 12 to 20:00 on April 13.
Between 11:00 and 17:00, the proportion of dust particles increased again, and the maximum depolarization ratio reached 0.18 again. After 17:00, the depolarization ratio decreased significantly to below 0.07.
4 Discussion
4.1 Response of the VO in the PBL to the sandstorm
Changes in the high-altitude air circulation directly affect the formation and evolution of the surface weather system. Sandstorms mainly occur in the PBL, and are mostly caused by violent disturbances in the wind field and the passage of frontal systems (Li et al., 2014; Li et al., 2011). The thickness and vertical structural characteristics of the PBL, such as temperature, humidity, and wind environment, directly affect the occurrence and development of sandstorms (Li Y. et al., 2022). However, there are relatively few studies on the vertical momentum transport mechanisms of sandstorms and their intensity, scope, and duration (Zhang C. et al., 2022).
4.1.1 Initial conditions
The evolution of the high-altitude and surface circulation played a decisive role in the occurrence, development, and dissipation of this sandstorm. Prior to the occurrence of the sandstorm at 20:00 on 12 April 2024, a stepped trough, a high-altitude air weather system usually associated with the activity and southward movement of cold air, appeared in the middle and high latitude of the Eurasia. It can be seen that the entire atmosphere was controlled by southwest wind (Figures 5, 6). Therefore, the in-phase superposition and intensification of the stepped trough at 500 hPa during its eastward movement served as the large-scale triggering system for this sandstorm process.
With the help of the VO, a high extinction coefficient area appeared above Dalaihubu station at 22:00 on April 12 (Figure 8), indicating that there were cloud coverings above, which was influenced by the short-wave trough of the southern branch.
From the perspective of the thermodynamic conditions, there was a small difference between the potential temperature and the pseudo-equivalent potential temperature at Dalaihubu station at 20:00 on April 12, while the difference between the saturated pseudo-equivalent potential temperature and the pseudo-equivalent potential temperature was relatively large (Figure 3a), indicating that the entire atmospheric layer was relatively dry.
The potential temperature and pseudo-equivalent potential temperature lines were approximately perpendicular to the horizontal axis below 400 hPa, suggesting that the atmosphere was almost in an adiabatic state. Such junction condition can promote the formation of a deep neutral junction (mixed layer), reducing the energy consumption during the upward movement of air parcels, thus facilitating the development of dry convection and the intensification of sandstorms. This is consistent with the view found in previous studies that the near-surface atmosphere is dry and hot before the occurrence of sandstorms (Zhang C. et al., 2022).
4.1.2 Sandstorm triggering mechanism
From 20:00 on April 12 to 02:00 on April 13, the U-wind speed below 850 hPa at Dalaihubu station was less than 15 m·s−1 (Figure 6a). At 01:30 on April 13, there was a closed center of the maximum U-wind speed of over 15 m·s−1 near 775 hPa. At 02:00, the wind direction changed significantly to westerly and northwesterly (Figure 5). And the atmosphere below 850 hPa was rapidly dominated by a northerly wind, and the wind speed increased suddenly (Figure 6b). After 03:00, the wind direction turned to the northwest. At 03:40, near 825 hPa the wind speed increased suddenly, indicating that strong winds are not a necessary condition for triggering a severe sand and dust storm, while the rapid changes of wind speed within a short period of time could serve as a signal indicating the occurrence of sand and dust weather.
At about 04:00, the strong U-wind area propagated strongly downward, and the cold advection sank to the ground (Figure 7), indicating that the cold air underwent a strong downward movement. The cold advection in the lower layer was sharply enhanced, which lifted the warm advection, thereby triggering the first stage of the severe sand and dust storm in this region from 03:40 to 08:00. This is consistent with the occurrence mechanism of sandstorms in the Hexi Corridor in spring, that is, the cold air behind the high-altitude trough sinks from the height of the sandstorm boundary layer, rapidly transmitting the strong wind downward to the ground, and resulting in gale and sandstorm (Li H. et al., 2022; Li et al., 2019; Zhang C. et al., 2022).
4.1.3 Sandstorm process and aerosol characteristics
The aerosol layer showed significant vertical fluctuations during the sandstorm. At 03:40, the planetary boundary layer height (Figure 10d) and the PM10 concentration, depolarization ratio and extinction coefficient at a height of 150 m (Figures 10a–c) also increased sharply. The depolarization ratio of aerosol particles at a height of 203 m had reached 0.18 (Figure 9), indicating that the proportion of non-spherical particles at this height had significantly increased. In addition, the extreme value area of the depolarization ratio was concentrated in the height range below 570 m, and the period of its appearance coincided with the period of the severe sandstorm, indicating that the high value of the depolarization ratio characterized the severity of the severe sand and dust storm.
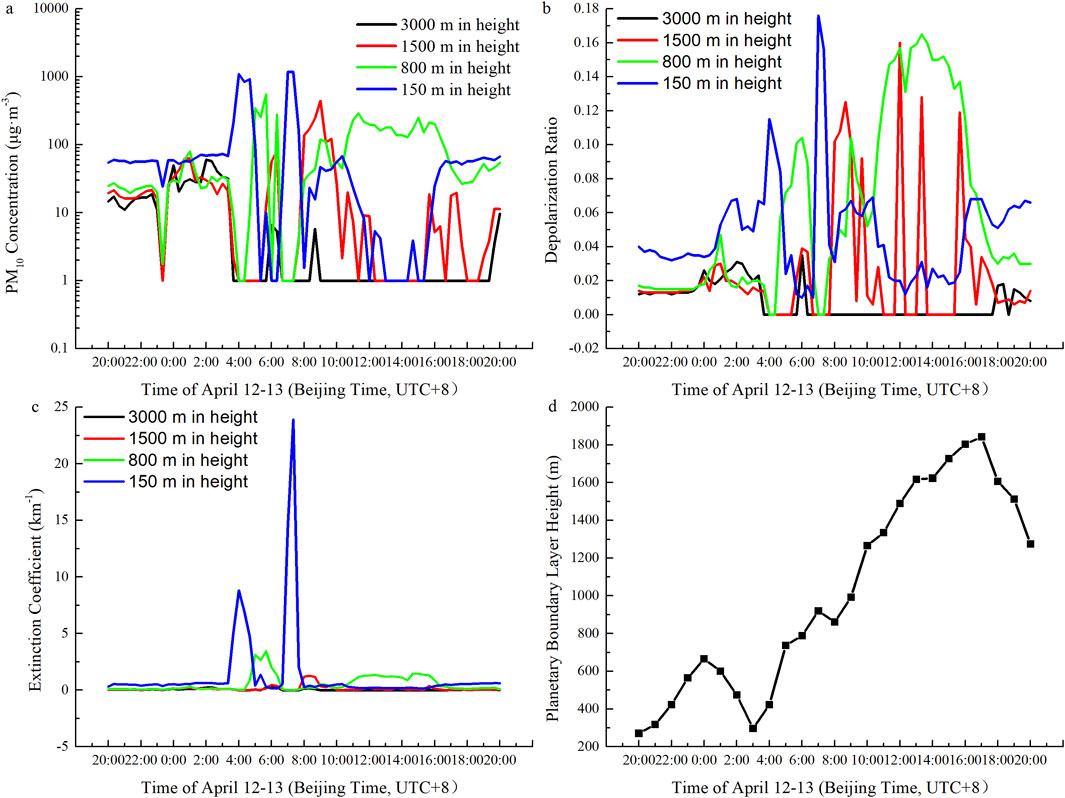
Figure 10. Distribution maps of the PM10 concentration (a), depolarization ratio (b), extinction coefficient (c), and PBL height (d) at Dalaihubu station from 20:00 on April 12 to 20:00 on April 13.
At 08:00 on April 13, the strong northwest wind area propagated strongly downward (Figure 6). The planetary boundary layer height (Figure 10d) and the PM10 concentration, depolarization ratio and extinction coefficient at a height of 150 m (Figures 10a–c) also decreased. In addition, the change in wind direction was also particularly obvious. Within the range from the near surface to the height of 600 hPa, the wind direction changed from clockwise rotation to counterclockwise rotation (Figure 5), indicating that the cold advection continuously invaded, leading to the generation of convection and the release of unstable energy. Due to the low atmospheric humidity and the lack of water vapor transport, a sandstorm dominated by dry convection occurred. This is consistent with the research results that the increase in wind speed and the decrease in humidity are conducive to the occurrence of sandy weather, and an obvious aerosol layer will appear during the occurrence of sandy weather, which has significant fluctuating changes in the vertical direction (Yin et al., 2023).
From 08:00 to 10:00 on April 13, the near-surface layer was briefly controlled by warm advection (Figure 3b), resulting in a decrease in the extinction coefficient (Figure 8) and an improvement in visibility (Figure 4b), and indicating a weakening of the sandstorm intensity.
With the replenishment of cold air, the area of strong northerly winds propagated strongly downward at Dalaihubu station at 11:00 on April 13 (Figure 6b). The wind speed increased again (Figure 5). The change in wind speed revealed the influence of cold air and high wind speed on the maintenance of the sandstorm. From 11:00 to 17:00, the lower layer was basically controlled by cold advection, while the warm advection rose to an altitude of over 2000 m (Figure 7). This vertical movement provided dynamic conditions for the suspension and diffusion of dust particles (Wang and Hua, 2024). The high-value area of the northwest wind (wind speed ≥25 m·s−1) further expanded and showed the downward propagation, indicating an obvious downward transfer of momentum. This is consistent with the phenomenon that in spring sandstorms in the Hexi Corridor, that is, the drier and colder the near-surface area is, the stronger the northwest wind will be, and the longer the severe sandstorm will last (Li et al., 2014; Li et al., 2011). For this sandstorm process, with the invasion of cold air at the surface, the surface low pressure developed and strengthened into a cyclone, which increased the pressure and temperature gradients before and after the cold front. Therefore, the strong wind behind the cold front is the fundamental cause for the generation and maintenance of severe sandstorms.
From 11:00 to 17:00, the planetary boundary layer height (Figure 10d) and the PM10 concentration, depolarization ratio and extinction coefficient at a height of 800 m was relatively high (Figures 10a–c). The extinction coefficient increased sharply again. The proportion of dust particles increased once more, and the maximum depolarization ratio reached 0.18 again (Figure 8).
At 17:00, there was a closed center of the maximum northerly wind speed near 750 hPa (Figure 6b). The planetary boundary layer height (Figure 10d) began to drop sharply. As the intensity of the sandstorm decreased, the depolarization ratio also decreased accordingly, dropping below 0.07 (Figure 9), indicating that the impact of the sandstorm on the local air quality was significantly reduced.
To sum up, due to the appearance of the stepped trough, the high-altitude circulation had led to changes in wind speed and direction. The severe sand and dust storm began at 03:40 on April 13 and ended at 17:00 (Figures 11b,c). In the first stage from 03:40 to 08:00 on April 13, the cold front at the surface and the high and low pressure centers continued to move southeastward. The PM10 concentration, depolarization ratio and extinction coefficient at a height of 150 m increased sharply (Figures 10a–c, 11a). The aerosols were concentrated near the surface, and showed significant vertical fluctuations. The PBL expanded upward, facilitating the vertical lifting and suspension of dust particles.
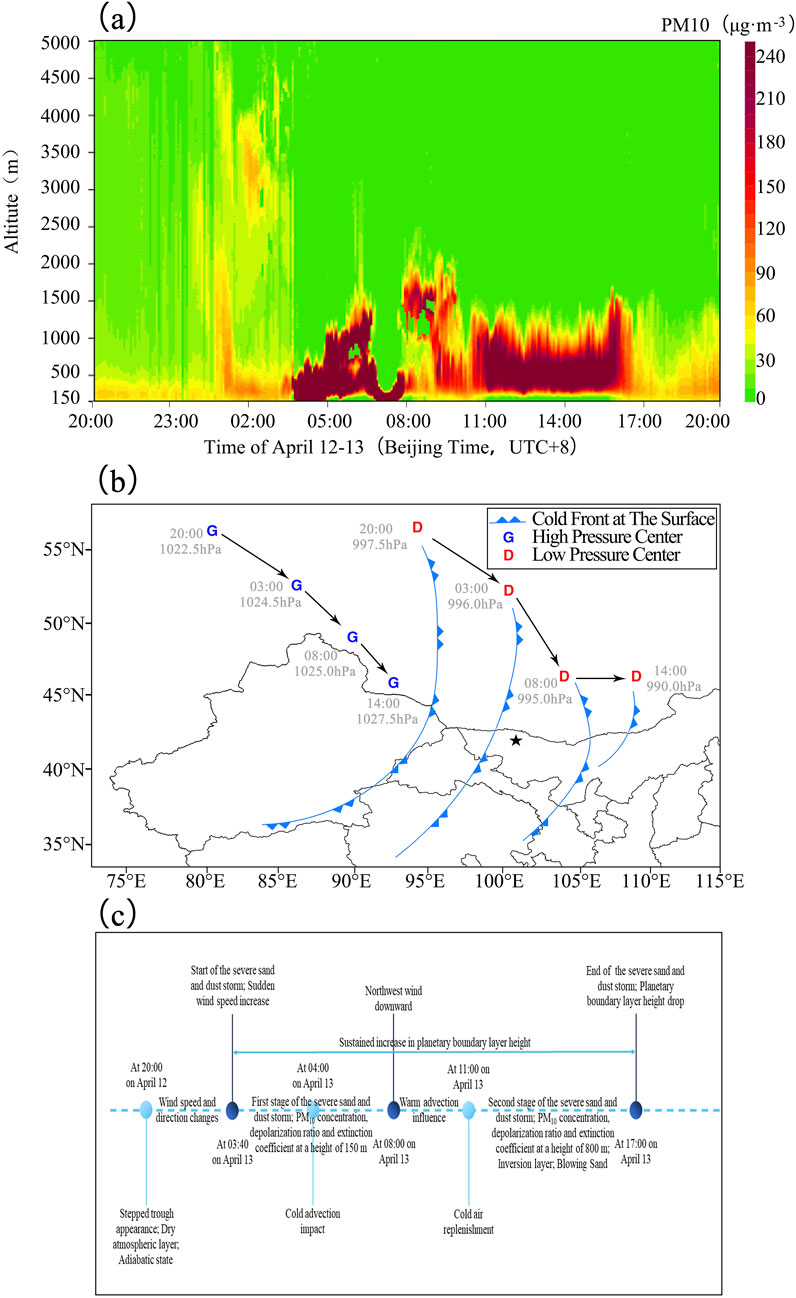
Figure 11. Evolution of the sand and dust event: height-time chart of PM10 concentration at Dalaihubu station from 20:00 on April 12 to 20:00 on April 13 (a), the movement paths of ground-influenced systems (b) and the development of the sand and dust event (c).
From 08:00 to 10:00 on April 13, the cold advection invasion, which triggered convection and unstable energy release (dry convection dominated due to low humidity).
In the second stage from 11:00 to 17:00 on April 13, the high pressure center continued to move southeastward, while the low pressure center turned eastward. Cold air replenishment led to strong northerly winds propagating downward, with wind speed increasing again. The lower layer was controlled by cold advection. This vertical circulation provided dynamic conditions for dust suspension. Surface low pressure strengthened into a cyclone, enhancing pressure/temperature gradients behind the cold front, and downward momentum transfer (from high wind speed areas) sustained strong winds.
With the support of the vertical expansion of PBL, dust particles in PBL and the upper lower atmosphere accumulated again. The PM10 concentration, depolarization ratio and extinction coefficient at a height of 800 m were high. As the aerosols were mainly concentrated at higher positions above the ground surface, this stage is classified as blowing sand based on the visibility with a resolution of 1-minute. Furthermore, during the whole sandstorm the boundary layer height continued to increase.
After 17:00 on April 13, the dust impact reduced. The PBL’s collapse coincided with the sandstorm’s dissipation, indicating its role in limiting dust suspension.
4.2 Formation of sandstorm and its monitoring and early warning
4.2.1 Necessary conditions
Sandstorms are the results of the coordinated development of the circulation in the upper and lower atmosphere (He et al., 2021). Dele et al. (2013) pointed out that the downward movement of the high-altitude jet stream to around 700 hPa and its good connection with the mixed layer below 700 hPa are necessary conditions for the downward transfer of momentum for sandstorms. In addition, the replenishment of cold air also has an important impact on the duration and intensity of sandstorms (Zong et al., 2012). According to the distribution of the wind profile, the vertical changes of the wind field, and the vertical distribution characteristics of the temperature advection, observed by the VO during this sandstorm process, there was a strong downward movement of cold air, and the cold advection in the lower layer was sharply strengthened, which had a lifting effect on the warm advection.
This study found that the vertical distribution characteristics of wind speed and wind direction can indicate the occurrence and evolution of sandstorms. The generation of sandstorms does not necessarily require a very high wind speed. The rapid and substantial change of wind speed is crucial for the formation of sandstorms (Figure 5), which is consistent with the research results of Baoler (2021). Additionally, some studies have shown that the triggering of severe sandstorm weather is often accompanied by drastic changes of surface meteorological elements, that is, a sudden increase of wind speed and air pressure, and a sharp drop of visibility and temperature (Li and Li, 2018), indicating that the change in wind speed is a feature of the occurrence of sandstorms. This affects the initiation, transportation and deposition of sand and dust. Therefore, the downward transfer of momentum and the abrupt change in wind speed are the key indicators indicating the occurrence of sandstorms.
The frontogenesis process is commonly observed during sandstorms (Sun and Yao, 2002). The downward development of strong cold air leads to the downward transfer of the momentum of the strong winds in the high-altitude troposphere, promoting frontogenesis (Banerjee et al., 2021), and increasing the pressure gradient before and after the cold front, which in turn causes the allobaric wind to increase. Specifically, the ascending and descending motion are strengthened respectively before and after the cold front, accompanied by a decrease and an increase in air pressure. The temperature gradient in the lower frontal zone increases, and the secondary circulation of the frontal surface is enhanced.
4.2.2 PBL and dust transport
Before the occurrence of a sandstorm, cold air in the high-altitude atmosphere invades and undergoes intense exchange with the warm air in the middle and lower layers, forming an unstable junction within the PBL (Zhang C. et al., 2022). In fact, the sandstorm process is a process in which the unstable junction of the atmosphere changes into a stable junction (Ablimitjan et al., 2019), and the occurrence of sandstorms is closely related to the changes in the height of the PBL (Li et al., 2011). The changes in the planetary boundary layer height directly affect the initiation mechanism and transportation path of dust.
Moreover, the presence of the inversion layer inhibits the vertical diffusion of dust particles, resulting in an increase in the concentration of dust in the lower atmosphere, thus strengthening the intensity of the sandstorm and prolonging its duration (Zhang L. et al., 2022). Since temperature advection plays a crucial role in the occurrence and development of the Mongolian cyclone (Li et al., 2024), during this sandstorm process, with the help of the VO, it was found that the inversion layer inhibited the diffusion of dust, causing the dust to mainly concentrate in the lower atmosphere, which is consistent with the views of previous researchers (Li et al., 2011; Yang et al., 2022). The formation of the dry atmospheric junction and the inversion layer affected the initiation, transportation, and deposition processes of sand and dust.
Sandstorms break out in the area of strong upward vertical movement (Yang et al., 2021). In fact, in the vertical direction the dust is mainly transported upward by convection and turbulence (Zhang and Wang, 2005). Turbulent activity refers to the complex, irregular and random vortex movement of air flow in the atmosphere caused by the non-uniformity of wind speed and direction, and the vertical distribution of meteorological elements such as temperature and humidity. It has a significant impact on the initiation, suspension, vertical diffusion, transport path and sedimentation process of sand and dust during sandstorms (Zhang J. et al., 2024).
At 20:00 on April 12 and 08:00 on April 13, the air temperature below an altitude of 2000 m at Dalaihubu station was above 0°C (Figure 3), indicating that the high depolarization ratio detected by the lidar (Figure 9) was caused by dust aerosol particles rather than ice crystals. This is consistent with the conclusion of Dong et al. (2007). In this study, the vertical distribution characteristics of the extinction coefficient and the depolarization ratio, showed the enhancement of turbulent activities during the sandstorm, which is another important characteristic of the changes in the PBL during the sandstorm.
Sandstorms that occur in desert areas are generally caused by local sand rising (Zhu et al., 1984). According to the ground-based observation data and high-altitude detection data, the regional sand and dust transport could not affect this sandstorm at Dalaihubu. The HYSPLIT model was used to invert this sandstorm process for better understanding of the impacts of the PBL on dust event (Figure 12). The results showed that the backward airflow at Dalaihubu station all originated from northern Central Asia, and the transport trajectory exhibited the characteristics of moving from the northwest to the southeast and from high latitudes to low latitudes.
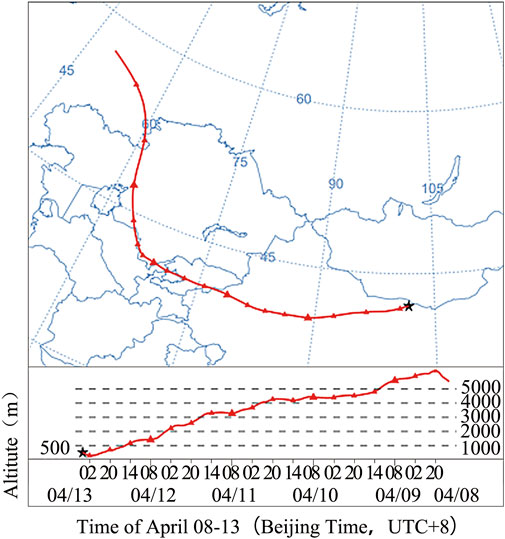
Figure 12. Simulation diagram of dust transport path of HYSPLIT backward track with Dalaihubu station as the intended receiving point (★ in the figure is the Dalaihubu station).
The mixed layer depth was constantly decreasing. It was transported eastward after passing through the Karamay Sand Sea in Xinjiang, indicating that the cross-regional airflow has an impact on the diffusion of dust.
4.2.3 Monitoring and early warning
Sandstorms are complex natural phenomena influenced by various factors. Among them, the downward transfer of momentum and abrupt changes in wind speed play crucial roles. In addition, the formation of the dry atmospheric junction and the inversion layer affected the initiation, transportation, and deposition processes of sand and dust. By closely monitoring the variations in momentum transfer and wind speed, and the formation of the dry atmospheric junction and the inversion layer through the VO, the occurrence time, location, and intensity of sandstorms can be accurately predicted. This enables relevant departments to take timely measures such as issuing warnings and initiating emergency response plans to minimize the damage caused by sandstorms to human life, property, and the environment.
Monitoring changes in the frontogenesis function provides a new perspective for predicting severe sandstorms. When a front forms and intensifies, it often accompanies strong winds, turbulence, and other weather phenomena that favor the occurrence of sandstorms. By analyzing the frontogenesis function, the dynamic and thermal conditions of the atmosphere can be understood The potential for sandstorm occurrence can be assessed, and the severity of sandstorms can be predicted. Therefore, incorporating the frontogenesis function into the sandstorm prediction indicator system can improve the accuracy and timeliness of predictions.
The VO is a powerful tool for detecting atmospheric aerosols. The extinction coefficient and depolarization ratio are two important parameters measured by the VO. By analyzing the vertical distribution characteristics of the extinction coefficient and depolarization ratio, the spatial distribution, transport pathways, and intensity of dust aerosols in the atmosphere can be understood, making up for the limitations of near-surface visibility detection. Monitoring these changes can not only identify the occurrence of sandstorms, but also provide information on their vertical structure and development trends, offering strong support for the early warning and forecast of sandstorms.
5 Conclusion
With the help of the VO, the sandstorm process can be presented in detail, clearly and comprehensively. Taking a sandstorm as an example in this study, the following conclusions were obtained through in-depth analysis:
(1) The downward transfer of momentum and the abrupt change in wind speed are the key indicators indicating the occurrence of sandstorms. The explosive downward movement of the cold advection in the lower layer strengthens the lifting of the warm advection, providing a powerful driving force for the occurrence of severe sandstorms.
(2) Monitoring changes in the frontogenesis function provides a new perspective for predicting severe sandstorms. By analyzing the frontogenesis function, the dynamic and thermal conditions of the atmosphere can be understood. The potential for sandstorm occurrence can be assessed, and the severity of sandstorms can be predicted.
(3) The formation of the dry atmospheric junction and the inversion layer affected the initiation, transportation, and deposition processes of sand and dust. The vertical distribution characteristics of the extinction coefficient and the depolarization ratio, showed the enhancement of turbulent activities during the sandstorm, which is another important characteristic of the changes in the PBL during the sandstorm.
Data availability statement
The raw data supporting the conclusions of this article will be made available by the authors, without undue reservation.
Author contributions
LB: Conceptualization, Formal Analysis, Funding acquisition, Investigation, Methodology, Project administration, Resources, Writing – original draft. JY: Data curation, Software, Visualization, Writing – original draft. NX: Supervision, Validation, Writing – review and editing.
Funding
The author(s) declare that financial support was received for the research and/or publication of this article. This work was supported by the Science and Technology Innovation Project of Inner Mongolia Autonomous Region Meteorological Bureau (nmqxkjcx202438); Third-level Candidate of the “Selection and Cultivation Project of Professional and Technical Talents in the New Era” in Inner Mongolia Autonomous Region in 2023; Scientific Research Support Project for the Introduction of High-level Talents in Public Institutions at the Autonomous Region Level of Inner Mongolia in 2022; Scientific Research Funding Project for Introduced High Level Talents of Inner Mongolia Normal University (2021YJRC007); Special Research Project on Strengthening the Construction of the Important Ecological Security Barrier in Northern China by Higher Education Institutions in Inner Mongolia Autonomous Region (STAQZX202319).
Acknowledgments
The authors would like to express the heartfelt gratitude to the Meteorological Data Center of Inner Mongolia Autonomous Region for the strong support in obtaining the meteorological data.
Conflict of interest
The authors declare that the research was conducted in the absence of any commercial or financial relationships that could be construed as a potential conflict of interest.
Generative AI statement
The author(s) declare that no Generative AI was used in the creation of this manuscript.
Publisher’s note
All claims expressed in this article are solely those of the authors and do not necessarily represent those of their affiliated organizations, or those of the publisher, the editors and the reviewers. Any product that may be evaluated in this article, or claim that may be made by its manufacturer, is not guaranteed or endorsed by the publisher.
References
Ablimitjan, A., Li, N., Zhao, K., Sun, M., and Min, Y. (2019). Characteristics of atmospheric boundary layer during an east irrigated sandstorm in tarim Basin (in Chinese with English abstract). Desert Oasis Meteorology 13 (5), 55–61. doi:10.12057/j.issn.1002-0799.2019.05.008
Bai, B., Zhang, Q., Lv, Q., Tan, D., and Wang, Y. (2016). Analysis of the vertical structure and transmission of the regional dust (in Chinese with English abstract). J. Arid Land Resour. Environ. 30 (9), 128–133. doi:10.13448/j.cnki.jalre.2016.294
Banerjee, P., Satheesh, S. K., and Moorthy, K. K. (2021). The unusual severe dust storm of May 2018 over northern India: genesis, propagation, and associated conditions. J. Geophys. Res. Atmos. 126 (7), e2020JD032369. doi:10.1029/2020JD032369
Baoler (2021). Process and causes of a regional gale and sand storm in Alxa League. J. Arid Land Resour. Environ. 35 (4), 112–119. doi:10.13448/j.cnki.jalre.2021.106
Bi, J., Li, Z., Zuo, D., Yang, F., Li, B., Ma, J., et al. (2022). Dust aerosol vertical profiles in the hinterland of Taklimakan Desert during summer 2019. Front. Environ. Sci. 10, 851915. doi:10.3389/fenvs.2022.851915
Cai, Z., Li, Z., Li, P., Li, J., Sun, H., Gao, X., et al. (2022). Vertical distributions of aerosol and cloud microphysical properties and the aerosol impact on a continental cumulus cloud based on aircraft measurements from the Loess Plateau of China. Front. Env. Sci. 9, 808861. doi:10.3389/fenvs.2021.808861
Chen, J., Guan, Y., Zhang, Y., Chen, Y., Bi, H., Lou, G., et al. (2024). Transport of dust from Gobi Desert to the Tibetan Plateau and its dynamic mechanism: a case study of a dust event in April of 2020 (in Chinese with English abstract). J. Desert Res. 44 (3), 158–171. doi:10.7522/j.issn.1000-694X.2023.00128
Dele, G., Cao, J., Li, Y., Si, Q., and Ying, C. (2013). Comprehensive analysis on a black storm event caused by Mongolian Cyclone in 2011 (in Chinese with English abstract). J. Desert Res. 33 (5), 1473–1482. doi:10.7522/j.issn.1000-694X.2013.00213
Dong, X., Qi, H., Ren, L., Wang, Y., Di, Y., Chen, Y., et al. (2007). Application and data demonstration of lidar in sandstorm observation (in Chinese with English abstract). Res. Environ. Sci. 20 (2), 106–111. doi:10.13198/j.res.2007.02.108.dongxh.021
Dupont, S., Rajot, J. L., Labiadh, M., Bergametti, G., Lamaud, E., Irvine, M. R., et al. (2019). Dissimilarity between dust, heat, and momentum turbulent transports during aeolian soil erosion. J. Geophys. Res. Atmos. 124 (2), 1064–1089. doi:10.1029/2018jd029048
Fan, L., Wang, Y., He, B., and Cao, C. (2024). Spatio-temporal distribution and transport pathways analysis of sand and dust weather in North China. Nat. Hazards. 121, 7425–7445. doi:10.1007/s11069-024-07044-8
Fernald, F. G. (1984). Analysis of atmospheric lidar observations: some comments. Appl. Opt. 23 (5), 652. doi:10.1364/ao.23.000652
Gulisitan, A., Ding, J., and Wen, M. (2024). Study on the influence of different types of dusty weather and related factors on aerosol optical thickness in South Xinjiang region (in Chinese with English abstract). Acta Sci. Circumstantiae 44 (6), 259–269. doi:10.13671/j.hjkxxb.2024.0009
Harm-Altstädter, B., Voß, A., Aust, S., Bärfuss, K., Bretschneider, L., Merkel, M., et al. (2024). First study using a fixed-wing drone for systematic measurements of aerosol vertical distribution close to a civil airport. Front. Environ. Sci. 12, 1376980. doi:10.3389/fenvs.2024.1376980
He, Y., Zhang, Y., and Gu, Z. (2021). Research progress of very strong sandstorm and its future research prospects (in Chinese with English abstract). China Environ. Sci. 41 (8), 3511–3522. doi:10.19674/j.cnki.issn1000-6923.2021.0324
Li, J., and Li, D. (2018). Analysis of the change of meteorological elements during a sandstorm (in Chinese with English abstract). Jiangxi Agric. (2), 48–49. doi:10.19394/j.cnki.issn1674-4179.2018.02.043
Li, X., and Zhang, H. (2010). Review on characteristics of micrometeorology and turbulent transfer during dust events in China (in Chinese with English abstract). J. Arid Meteorology 28 (3), 256–264.
Li, Y., Zhang, Q., Xue, X., and Wang, R. (2011). Relationship between atmosphere boundary layer characteristics and sand-dust weather climatology in Minqin (in Chinese with English abstract). J. Desert Res. 31 (3), 757–764.
Li, Y., Zhang, Q., Chen, Y., and Hu, X. (2014). Vertical structure of atmosphere boundary layer during wind-sandstorm process over sandstorm source in arid area of northwest China (in Chinese with English abstract). J. Desert Reserch 34 (1), 206–214. doi:10.7522/j.issn.1000-694X.2013.00301
Li, Y., Zhang, A., Li, H., Wang, F., Chen, Y., and Zeng, T. (2019). Relationship between boundary layer height and wind-sand intensities over Hexi Corridor, China (in Chinese with English abstrat). J. Desert Res. 39 (5), 11–20. doi:10.7522/j.issn.1000-694X.2018.00118
Li, H., Li, Y., Wang, Y., Yu, Y., Ma, X., and Liu, X. (2022a). Temporal and spatial differences and dynamic analysis of sandstorms in the west of Hexi Corridor (in Chinese with English abstract). J. Arid Land Resour. Environ. 36 (10), 104–112. doi:10.13448/j.cnki.jalre.2022.257
Li, Y., Zhang, C., Zhang, A., Yang, J., Chen, Y., and Nie, X. (2022b). Vertical structure characteristics of atmospheric boundary layer in spring sandstorm over Hexi Corridor (in Chinese with English abstract). Meteorol. Mon. 48 (9), 1171–1185. doi:10.13448/j.cnki.jalre.2022.257
Li, L., Li, T., Li, Y., and Hu, L. (2024). The influence of thermal interaction between land surface and atmospheric boundary layer on cold front sandstorm in Hexi Corridor (in Chinese with English abstract). Plateau Meteorol. 43 (2), 498–509. doi:10.7522/j.issn.1000-0534.2023.00055
Li, Y., Ma, X., Wang, F., Li, H., Nie, X., and Fu, Q. (2025). Climatic drivers and temporal dynamics of sandstorms in the Hexi Corridor, China. Clim. Serv., 37. doi:10.1016/j.cliser.2024.100532
Liao, J., Zhou, T., Han, B., Huang, Z., and Bi, J. (2023). Aerosol types discrimination in semi-arid region of Northwest China using ground-based lidar data (in Chinese with English abstract). J. Arid Meteorology 41 (4), 570–578. doi:10.11755/j.issn.1006-7639(2023)-04-0570
Liu, Q., Zheng, Y., Zhu, J., Feng, R., Zeng, X., Tan, J., et al. (2012). Ultraviolet Mie lidar observations of aerosol extinction in a dust storm case over Macao (in Chinese with English abstract). Spectrosc. Spectr. Analysis 32 (3), 625–629. doi:10.3964/j.issn.1000-0593(2012)03-0625-05
Liu, W., Liu, t., Huang, Z., Liu, Y., and Kuang, J. (2013). Study of a dust case in Guangzhou using polarization mie-scattering lidar (in Chinese with English abstract). China Environ. Sci. 33 (10), 1751–1757.
Sun, J., and Yao, X. (2002). Simulating diagnostic analyses for frontogenesis and surface sensible heat flux of a sand-dust storm process (in Chinese with English abstract). Plateau Meteorol. 21 (5), 488–494.
Tu, A., Wang, Z., Wang, Z., Zhang, W., Liu, C., Zhu, X., et al. (2022). Characterizing a heavy dust storm event in 2021: transport, optical properties and impact, using multi-sensor data observed in Jinan, China. Remote Sens. 14 (15), 3593. doi:10.3390/rs14153593
Wang, Y., and Hua, D. (2024). Research progress of laser remote sensing in slant visibility measurements (Invited) (in Chinese with English abstact). Acta Opt. Sin. 44 (6), 9–19. doi:10.3788/AOS231558
Wang, S., Wang, J., Zhou, Z., Shang, K., and Yang, D. (2003). Regional characteristics of dust events in China (in Chinese with English abstract). Acta Geogr. Sin. (2), 193–200.
Wang, H., Sun, H., and Zhang, Q. (2020). Analysis of extinction characteristics of sandstorm to infrared radiation (invited) (in Chinese with English abstract). Infrared Laser Eng. 49 (7), 44–52. doi:10.3788/IRLA20201022
Wang, C., Wei, X., Yang, J., and Ni, T. (2022). Observational study of the influences of thermal and dynamic boundary layer on the vertical distribution of black carbon aerosol in ShouXian county in wintertime, 2016. Front. Earth Sci. 10, 1012085. doi:10.3389/feart.2022.1012085
Wang, N., Sun, S., Wang, H., Fan, P., You, C., He, M., et al. (2024a). Quantifying the influence of dominant factors on the long-term sandstorm weather - a case study in the Yellow River Basin during 2000–2021. Atmos. Res. 311, 107717. doi:10.1016/j.atmosres.2024.107717
Wang, W., He, S., Guo, H., Abuduwaili, J., Samat, A., De Maeyer, P., et al. (2024b). Sand and dust storm risk assessment in arid central Asia: implications for the environment, society, and agriculture. Int. J. Disast. Risk Sci. 15 (5), 703–718. doi:10.1007/s13753-024-00591-5
Wang, Z., Yue, S., Bian, G., Deng, T., Kong, F., and Wang, X. (2025). Study on the influence of dusty weather natural wind on the dust characteristics of trough concentrator regions in alpine areas. Energ. Convers. manage. 332, 119689. doi:10.1016/j.enconman.2025.119689
Yang, M., Li, Y., Zhang, C., Yang, J., Luo, X., and Nie, X. (2021). Variation characteristics of spring sandstorm and its typical case analysis in the middle east of Hexi Corridor (in Chinese with English abstract). Arid. Land Geogr. 44 (5), 1339–1349. doi:10.12118/j.issn.1000-6060.2021.05.15
Yang, X., Li, Y., Chen, J., Guo, L., Chen, Y., and Zhao, H. (2022). Transmission of rare strong dust and its process continuous characteristics in Hexi Corridor (in Chinese with English abstract). Arid. Land Geogr. 45 (5), 1415–1425. doi:10.12118/j.issn.1000-6060.2021.604
Yao, X., and Yu, Y. (2001). Perfect Q-vector and its diagnoses (in Chinese with English abstract). Plateau Meteorol. 20 (2), 208–213.
Yin, L., He, Q., Li, J., Meng, L., Fu, G., Wu, C., et al. (2023). Ground-based ridar-based investigation of a sand and dust pollution process in Hotan City (in Chinese with English abstract). China Environ. Sci. 43 (12), 6290–6300. doi:10.19674/j.cnki.issn1000-6923.2023.0214
Yu, Y., Zhu, Q., He, Q., Gao, Y., Zhou, X., Zhang, R., et al. (2022). Variations of aerosol and cloud vertical characteristics based on aircraft measurements in upstream of Shanghai during the 2020 China international import expo. Front. Environ. Sci. 10, 1098611. doi:10.3389/fenvs.2022.1098611
Zhang, Q., and Wang, S. (2005). On physical characteristics of heavy dust storm and its climatic effect (in Chinese with English abstract). J. Desert Res. (5), 675–681.
Zhang, C., Li, Y., Ma, X., Li, X., and Nie, X. (2022a). Analysis of the vertical momentum transmission characteristics of different intensity trough type sandstorm along the Hexi Corridor, China (in Chinese with English abstract). Adv. Earth Sci. 37 (9), 925–936. doi:10.11867/j.issn.1001-8166.2022.052
Zhang, L., Li, Q., Meng, L., Zhang, Q., Zhang, H., He, Q., et al. (2022b). Research on the development of the deep atmospheric boundary layer, turbulent motion, and dust stagnation (in Chinese with English abstract). Adv. Earth Sci. 37 (10), 991–1004. doi:10.11867/j.issn.1001-8166.2022.067
Zhang, C., Li, Y., Wu, W., Ma, X., and Nie, X. (2024a). Comparative analysis of spatial transport characteristics of spring cold-front-type sandstorms in the Hexi Corridor. Theor. Appl. Climatol. 155 (7), 6623–6636. doi:10.1007/s00704-024-05025-2
Zhang, J., Wang, M., He, Q., Wang, Y., Pan, H., and Zhang, Z. (2024b). Comparative analysis of atmospheric boundary layer between sunny days and sandstorm weather in the hinterland of the Taklimakan Desert (in Chinese with English abstract). Desert Oasis Meteorology 18 (1), 50–58. doi:10.12057/j.issn.1002-0799.2024.01.006
Zhao, Z., Luo, Y., and Huang, J. (2023). Global warming and sand-dust storms (in Chinese with English abstract). Clim. Change Res. 19 (5), 667–671. doi:10.12006/j.issn.1673-1719.2023.149
Zhu, Z., Liu, S., and Di, X. (1984). Retrospect of the history of desert research and a few problems in the field in China (in Chinese with English abstract). 4(2), 7–11.
Keywords: sandstorms, planetary boundary layer, vertical observation, HYSPLIT, Alxa
Citation: Bao L, Yang J and Xiao N (2025) Analysis of planetary boundary layer characteristics of sandstorm based on vertical observation. Front. Environ. Sci. 13:1603925. doi: 10.3389/fenvs.2025.1603925
Received: 01 April 2025; Accepted: 31 July 2025;
Published: 14 August 2025.
Edited by:
Zhiyuan Hu, Sun Yat-sen University, ChinaReviewed by:
Chenglai Wu, Chinese Academy of Sciences (CAS), ChinaHongYou Liu, Lanzhou University, China
Copyright © 2025 Bao, Yang and Xiao. This is an open-access article distributed under the terms of the Creative Commons Attribution License (CC BY). The use, distribution or reproduction in other forums is permitted, provided the original author(s) and the copyright owner(s) are credited and that the original publication in this journal is cited, in accordance with accepted academic practice. No use, distribution or reproduction is permitted which does not comply with these terms.
*Correspondence: Nan Xiao, bnhpYW9AaW1udS5lZHUuY24=