 Princesa Joel M. Yumol
 Franz D. Santos
- Institute of Civil Engineering, College of Engineering, University of the Philippines Diliman, Quezon City, Philippines
In recent years, the Philippines has been experiencing more intense and frequent typhoons that often lead to damaging floods. Faced with the combined threat of climatic shifts and increasing urbanization, quantifying the effects of these future changes on flood risk to local communities is essential for effective disaster risk management efforts. This paper aims to assess the impacts of climate and land cover change on flood hazard parameters of the Pinacanauan de Ilagan River in Isabela using HEC-RAS (Hydraulic Engineering Center–River Analysis System). A comparison of model calculated flood depths and extents was performed using projected rainfall to represent future climate conditions and two different land cover estimates to represent changes in development of highly built-up areas. Results revealed that the change in land cover from 2015 to 2020 resulted in increases in maximum flood depths by as much as 12.83% with the greater depths found near the river confluences. Considering the increase in precipitation to represent future climate, maximum flood depths were found to increase by 19.79% signifying that climate has more pronounced effects on river flooding in the study area compared to change in land cover. These findings highlight the need for strategic planning of future developments to consider potential effects on flood risk along the Ilagan River. This study can also provide insights for local decision-makers on the potential impacts of climate change on flood risk management. Modelled flood parameters can be incorporated in the planning, design, and site selection of future evacuation facilities to improve disaster risk management strategies for local communities.
1 Introduction
The Philippines, being within the path of typhoons, is the third most exposed country to natural disasters. Because of its geographical location, it is often affected by hydro-meteorologic hazards such as typhoons and floods that make up about 80% of the country’s natural disasters and have brought about damage to life and property over the last half-century (Disaster Risk Reduction in the Philippines, 2019). With around 20 tropical cyclones entering the Philippine Area of Responsibility and about 8–9 making a landfall on the archipelago, the frequency of typhoons triggers the occurrence of intense flooding specifically at areas located near rivers as well as in highly built-up communities. In addition, the intense rainfall brought by these typhoons greatly affects the watersheds of the country which encompass 70% of the archipelago (Alfonso et al., 2019) causing streams to exceed their capacities and trigger more flood events. Floods bring about health-related issues such as epidemics, challenges to society such as infrastructure and property damage and even causing fatalities in many parts the world (Okaka and Odhiambo, 2018; Paterson et al., 2018; Ringo et al., 2025; Singh et al., 2018). Having around 35% of urban areas affected by flooding disasters, global flood losses have reached approximately $651 billion over the past decade (Dryden et al., 2021). Aside from direct damage, low-lying areas that had been affected by flood events resulted in indirect dangers like economic crises due to damage to electricity, gas, water supply, and transportation infrastructure, especially in urban areas with a high percentage of impervious areas and a high population density (Bae and Lee, 2020). Given these threats brought about by flooding and considering nature driven factors such as climate change and urban development, understanding the susceptibility and exposure of particular areas can contribute to lowering negative impacts on local communities.
The frequency and severity of flooding has been exacerbated by changing rainfall intensities and patterns driven by climate change. Studies have been done on river basins around the world to examine the effects of climate change on the river’s flow regime (Deng et al., 2025; Lewis et al., 2023; Ranjan et al., 2025), basin water balance (Sadyrov et al., 2025), and water supply (Dallison et al., 2021; Kifle Arsiso et al., 2017). Climate change also drives the increase in hydro-meteorological events' magnitude and frequency, leading to an increased threat of flood events in many regions (AlZaatiti et al., 2025; Hettiarachchi et al., 2018). Because of this increased risk of flooding brought about by changing precipitation patterns, incorporating climate change effects in the flood risk assessment of local communities is critical.
Understanding the mechanisms of the Earth’s changing climate and evaluating its future variability can be analyzed through the use of Global Climate Models (GCMs) (IPCC, 2013; Masson-Delmotte et al., 2019). GCMs have been used to assess the effects of climate change on the aquatic ecological environments through combined climate model downscaling and numerical simulations (Zhao et al., 2024) as well as characterize watershed response to changing climate (Zheng et al., 2018). However, GCMs still pose uncertainties and limitations as the area moves from the global to the regional or local scale (Luo et al., 2013). Having mentioned this, researchers have made efforts to improve downscaling of GCMs (Bulti and Yutura, 2025; Zhang et al., 2024) and apply bias correction techniques (Zha et al., 2024) with an objective of improving climate projections. In the Philippines, the national weather agency utilizes the PRECIS Regional Climate Model (RCM) to generate projections in temperature and changes in rainfall in the future (Climate Change Scenarios in the Philippines, 2011). This RCM led to the creation of the Climate Information Risk Analysis Matrix (CLIRAM) tool that contains the latest set of climate projections. CLIRAM can be used to assess the impact, vulnerability, and adaptation measures related to climate change. Given the capability of this tool, it has been used by local researchers to assess impacts of climate change to the hydrology (Benavidez et al., 2016), water supply and demand (Rosete et al., 2024), as well as for rice crop yields (Baltazar, 2024), but only few studies utilized this tool in parallel with numerical modeling to describe the effects of changing precipitation on the flood risk of a community.
In assessing the flood risk of communities, various methodologies have emerged to improve and augment traditional approaches in aims to build a more precise risk assessment and recommend more effective mitigation measures (FathiAzar et al., 2024). Among the methods that are gaining interest among researchers in the area of disaster risk management is the use of numerical modeling to determine the depth and extent of flooding as well as assess the effectiveness of proposed flood mitigation initiatives through scenario simulations. Flood hazard mapping and assessment have been performed using hydraulic modeling tools such as FLO-2D (Erena et al., 2018), MIKE21 (Huo et al., 2024), RRI Model (Sayama et al., 2017), HEC-RAS (Pili et al., 2024), and TUFLOW (Namgyal et al., 2023). Because of its accessibility as an open-source tool and user-friendly interface, the Hydraulic Engineering Center–River Analysis System (HEC-RAS) has been used for a wide range of applications which include testing the efficiency of structural flood control measures (Gül et al., 2010), assessing the effectiveness of an integration modeling and geographic information systems methodology for flood risk assessment (Cabral et al., 2014), and assessing the effects of other non-structural flood mitigation initiatives (Daigneault et al., 2016). Studies incorporating the effects of climate change in flood hazard assessments using hydraulic modeling have mostly focused on Global Climate Model (GCM) inputs (Sarchani and Tsanis, 2024; Towsif Khan et al., 2025). For the present study, the use of localized climate model predictions through the CLIRAM tool as an input to the hydraulic model was explored. HEC-RAS was chosen because of its capability to model two-dimensional (2D) flow and come up with satisfactory results for 2D rain-on-grid simulations of storm events when calibrated to an observed data set corresponding to the storm event of interest (Zeiger and Hubbart, 2021).
The Pinacanauan de Ilagan River in Isabela, the target area of this study, has always been susceptible to flooding and has been placed under the state of calamity various times due to many typhoons in the past. While climate and land use changes have effects on flooding, these have not yet been considered in the flood risk assessment of Ilagan, Isabela. For instance, a study on the Abuan Watershed, one of the watersheds that constitutes Pinacanauan de Ilagan River, considered the effects of land use and climate change on streamflow of the river (Araza et al., 2021) but it was not able cover the flood risk assessment due to the changes in stream discharges. Moreover, despite the need for the incorporation of future climate projections and land use changes in flood risk assessments, publicly available hazard maps used in the country are only based on single-scenario susceptibility maps (Besarra et al., 2025). This paper aims to investigate the effects of climate change and land cover change on the flood parameters of areas along the Pinacanauan de Ilagan River using numerical modeling. The study specifically aims to determine the depth and areas of inundation during a storm event while factoring in projected changes in precipitation using the CLIRAM tool and effects of changing land cover in the study area to generate decision-support information for more resilient disaster risk management initiatives for the area.
2 Materials and methods
2.1 Study area
The Pinacanauan de Ilagan River, with a catchment area of approximately 3000 km2, serves as a drain or outlet for the southeast region of the Cagayan catchment. The Pinacanauan de Ilagan River continues its stream as the Ilagan River and branches out into two channels—the Abuan and Bintacan catchments. Particularly, the Abuan and Bintacan rivers are located at the northeast portion of the Pinacanauan de Ilagan River. The Abuan catchment upstream of the Abuan bridge has an area of 490 km2, while the upper Bintacan catchment has an area of about 111 km2 (Dingle et al., 2019). Figure 1 shows the location of the study area and the discharge monitoring stations that were used in this study. A water level monitoring station located mid-stream was also used for the calibration of the hydraulic model using the river’s rating curve.
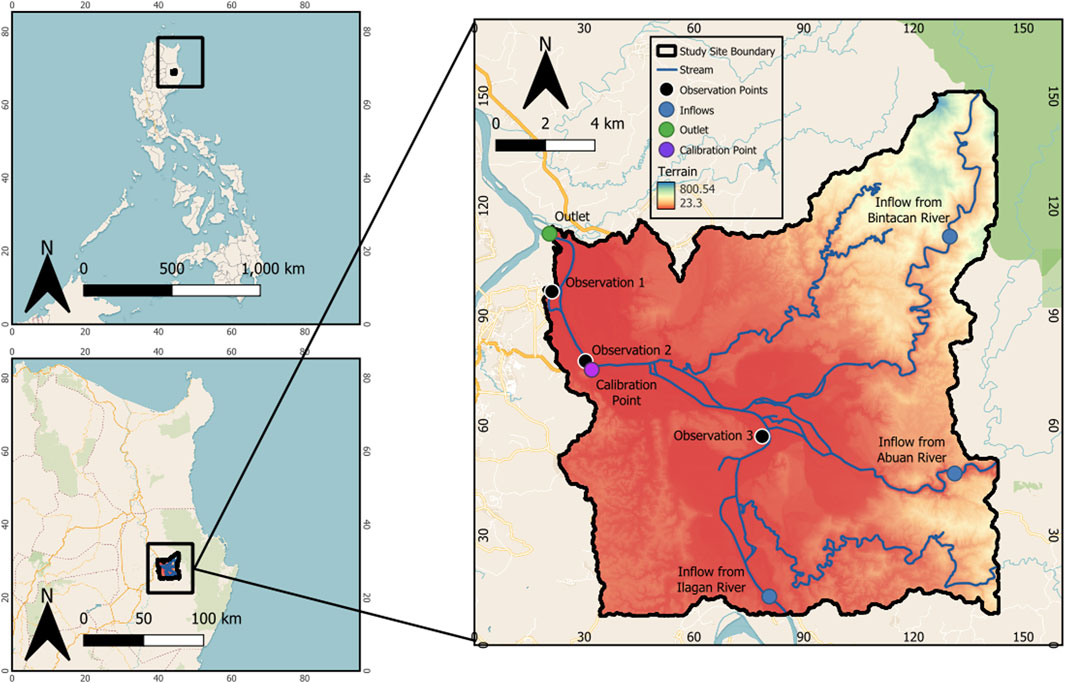
Figure 1. Map of the study area showing the locations of the observation stations, calibration station, river inlets from upstream, and boundary outlet.
The Abuan River Basin, located about 10 km upstream of the confluence of the Cagayan and Pinacanauan de Ilagan Rivers, has an upper watershed consisting of the Sierra Madre Mountain Range and a lower watershed containing foothills and floodplains at the merging point of the Abuan River and Pinacanauan de Ilagan River. For the whole Cagayan River basin which includes the Ilagan basin, the rainy season usually occurs from May to November, with maximum monthly rainfall typically present in the months of July or August due to the southwest monsoon, and in November due to typhoons. Near Ilagan, the average annual precipitation is about 1489.5 mm in the years 1976–1985 (Japan International Cooperation Agency, 2002) and flood events usually occur in the basin due to abundant rainfall brought about by these typhoons.
2.2 Data collection for hydraulic model
This study utilized numerical modeling to determine flood depths and inundated areas for storm events and the possible effects of climate and land cover change on the flood hazard of the area. The data needed for the study were categorized as either spatial data, meteorologic data, or hydraulic data. Table 1 summarizes the input data needed to set-up the model and how they were utilized to meet the study objectives.
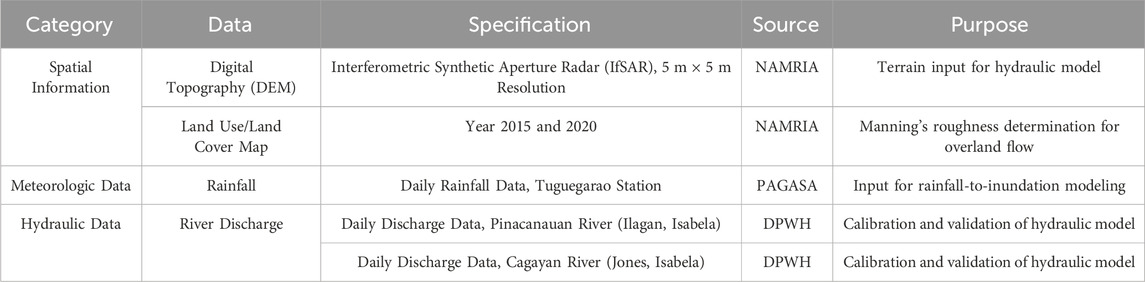
Table 1. Data used in the study.
The topography used as input in the hydraulic model was the Interferometric Synthetic Aperture Radar (IFSAR) digital elevation model of the National Mapping and Resource Information Authority (NAMRIA), the local mapping agency of the country. This was used to represent the geospatial conditions of the study area particularly to characterize the flow and inundation of the flood within the study site boundary given its 5-m-by-5-meter fine resolution as compared to other satellite-derived DEMS which are usually coarser. On the other hand, the land cover map was used to classify the land use of different areas within the region that serves as guide in assigning Manning’s roughness coefficient (n) corresponding for each land use during the calibration and scenario simulation stages. The daily rainfall from the Philippine Atmospheric Geophysical and Astronomical Services Administration (PAGASA) served as input to simulate the rainfall-runoff to inundation process for chosen storm events while the river discharge data from the Department of Public Works and Highways (DPWH) were used to fine-tune the model before carrying-out the climate change scenario analysis.
2.3 General modeling methodology
The numerical modeling tool HEC-RAS, created by the US Army Corps of Engineers, was used in this study because of its capability to simulate flood development in either one or two dimensions. Moreover, it has a considerably vast amount of documentation, tutorials, and manuals to aid the user in understanding and navigating through the software. Besides the significance of its functionalities for the study, this is also selected among other numerical modeling software because it is widely used in river hydraulic analysis in both research and practical applications in the Philippines. Shown in Figure 2 is the general flow of the study.
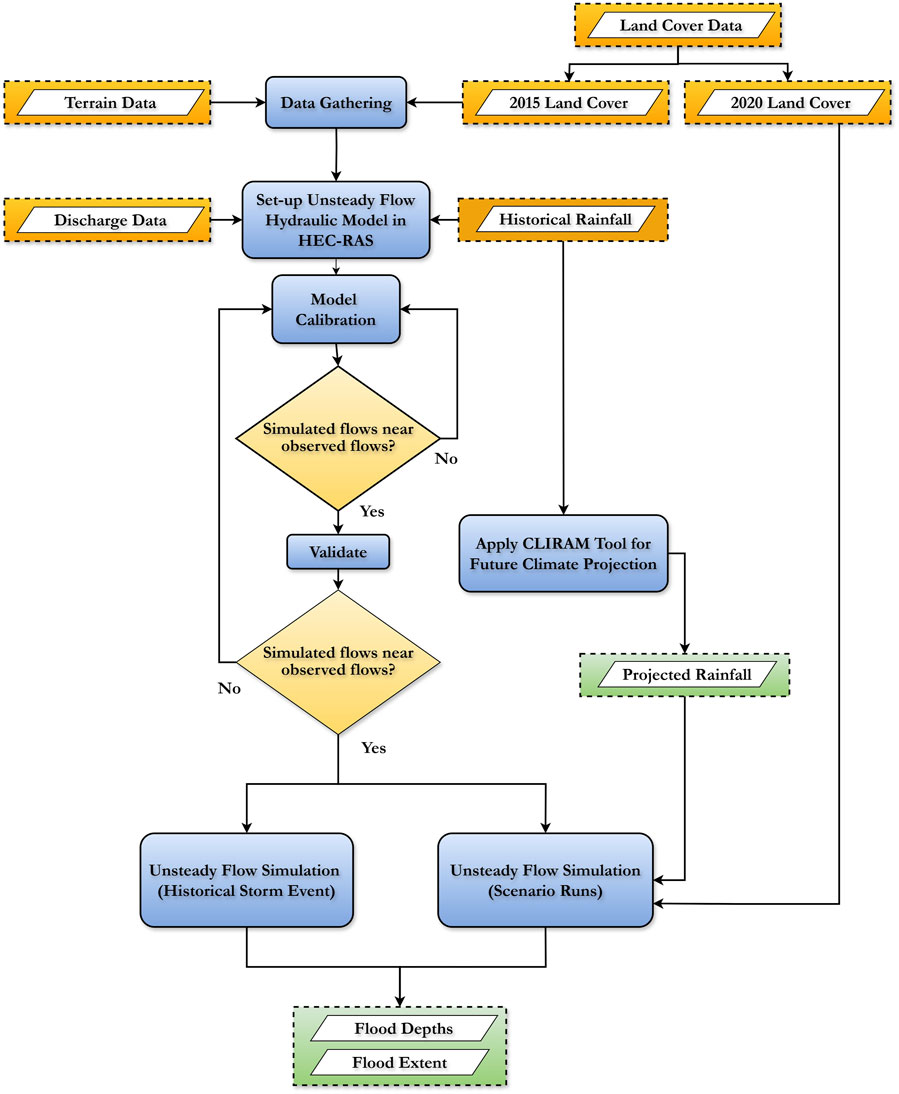
Figure 2. Methodological framework of the study.
The base geometric model of the river was first developed using the provided terrain and land cover maps of the area. Boundary conditions that act as forcings such as precipitation and river discharge were added into the model and unsteady flow analysis was performed. To ensure acceptable model performance and results, calibration and validation was done before carrying out scenario analysis on the effects of climate and land cover change to the flood hazard of the area.
2.4 Model calibration and validation
Calibration of the hydraulic model was done to ensure a realistic model behavior (Mostafaie et al., 2018). The main process of calibration was done by varying the Manning’s roughness coefficients incorporated into the area’s land use classification. The simulated discharges were compared against observed data for a historical storm event that has affected the study area namely Tropical Storm Mekkhala (local name “Amang”). During this stage, the roughness coefficients of the base model were further varied until the simulated flows are comparable with the selected observed data based on statistical parameters. For model validation, the resulting flows of the calibrated model were compared against observed data from two other storm events namely Typhoon Rammasun (local name “Glenda”) and Typhoon Kalmaegi (local name “Luis”) which were different storm events from the ones used during calibration. This evaluation of the model performance considering other storm events is necessary to ensure that the model will yield satisfactory results for all other simulations including scenario analyses. Summarized in Table 2 are the storm events used during model calibration and validation and their simulation periods.
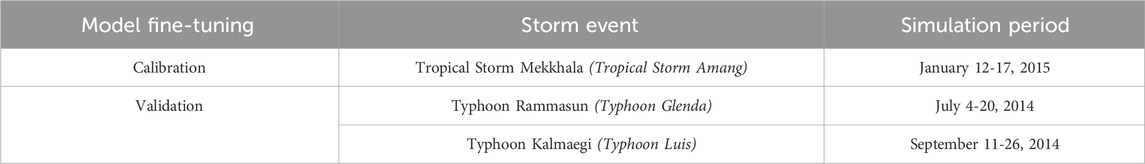
Table 2. Storm events used for model calibration and validation.
To quantify the sufficiency of the model’s performance, a series of efficiency and performance criteria were used such as the Nash-Sutcliffe efficiency (NSE), ratio of the root mean square error (RMSE) to the standard deviation of measured data (RSR), and percent bias (PBIAS). This method of calibration and evaluation was used in previous studies on coupled watershed and flood modeling such as that from (Puno et al., 2018), and it is also a part of the guidelines set for the quantification of accuracy in watershed simulations by (D. N. Moriasi et al., 2007).
The Nash-Sutcliffe efficiency (NSE) determines how well the observed versus the simulated data fits the 1:1 line. The difference between the observed and simulated data are considered acceptable if the NSE is between 0 and 1. Otherwise, the performance of the simulation will be considered unacceptable. More specifically, the acceptable value for NSE should be greater than 0.65 (D. N. Moriasi et al., 2007). The NSE value is calculated using Equation 1.
where: NSE: Nash-Sutcliffe efficiency value of the simulation.
n: total number of observations.
Root Means Square Error-observations standard deviation ratio (RSR) standardizes the RMSE using the standard deviation of the observations and includes error index statistics. For this parameter, lower RSR and RMSE values indicate better model simulation performance where RSR values of less than 0.60 are considered acceptable (D. N. Moriasi et al., 2007). The RSR is calculated using Equation 2.
where: RSR: RMSE-observations standard deviation ratio.
RMSE: Root Mean Square Error.
Lastly, the percent bias (PBIAS) evaluates the mean tendency of predicted simulated results to overestimate or underestimate the observed data. A PBIAS of 0 would mean an accurate model. A positive value pertains to underestimation while a negative means overestimation. For this parameter, a percent bias of less than 15% is deemed acceptable (D. N. Moriasi et al., 2007). The percent bias of the simulation is calculated using Equation 3.
where: PBIAS: Percent bias.
After satisfying the calibration and validation criteria, the calibrated model representing the Pinacanuaman de Ilagan river hydraulics was then used in generating a flood hazard map during Typhoon Haima (local name “Lawin”) with a simulation period of October 11-27, 2016, as the baseline condition.
2.5 Land cover change scenario
Using the calibrated river model, the effects of land cover change on the flood hazard parameters such as flood depth and extent in the area were examined using land cover from NAMRIA. Two land cover maps (2015 and 2020) were obtained and used as inputs in the hydraulic model to compare flood depths based on simulation results. Since the baseline condition will use Typhoon Haima that occurred in 2016, the 2015 land cover will serve as the baseline input for this scenario during the analysis of results.
2.6 Climate change scenario simulation using projected precipitation
The effect of climate change was also examined by applying the percent change in precipitation for the area based on the CLIRAM tool of PAGASA. The climate projection of the tool is derived from two prominent scenarios outlined by the Intergovernmental Panel on Climate Change (IPCC), the RCP 4.5 (moderate greenhouse gas emissions) and the RCP 8.5 (high-level greenhouse gas emissions). In assessing the corresponding effects of the change in precipitation for the most critical condition, only the projected scenario for the upper limit of the High-Emission Scenario (RCP8.5) was selected. In this study, it was assumed that the upper limit of the High-Emission Scenario (RCP8.5) scenario already simulate the worst flooding circumstance that will warrant risk management. Shown in Table 3 are the projected changes in rainfall in the mid-21st century for Isabela, Philippines.
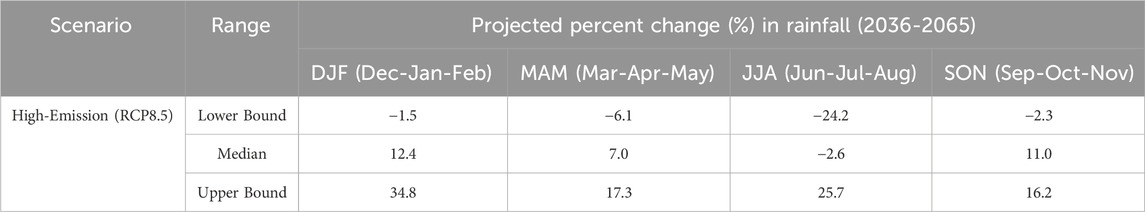
Table 3. Projected seasonal percent change in rainfall for Isabela, Philippines (PAGASA, 2018).
The percent change in precipitation was applied to the observed rainfall during Typhoon Haima to simulate the scenario of a projected storm with a higher intensity driven by climate change. The resulting flood hazard maps were then compared to the baseline condition for analysis.
3 Results
3.1 Hydraulic model accuracy
The hydraulic model of Pinacanauan de Ilagan River was calibrated to a medium-intensity storm event namely Tropical Storm Mekkhala. Channel roughness coefficients of the Abuan, Bintacan, Ilagan, and Cagayan Rivers were adjusted until the model simulated discharges were comparable to observed discharges and acceptable according to the statistical performance criteria. The river model was then tested for two other storm events (Typhoon Rammasun and Typhoon Kalmaegi) to further validate model results using the calibrated roughness coefficients of the channels. Figure 3 shows the visual comparison between the observed flow from the calibration point at midstream and the model simulated discharges for the calibration and validation runs.
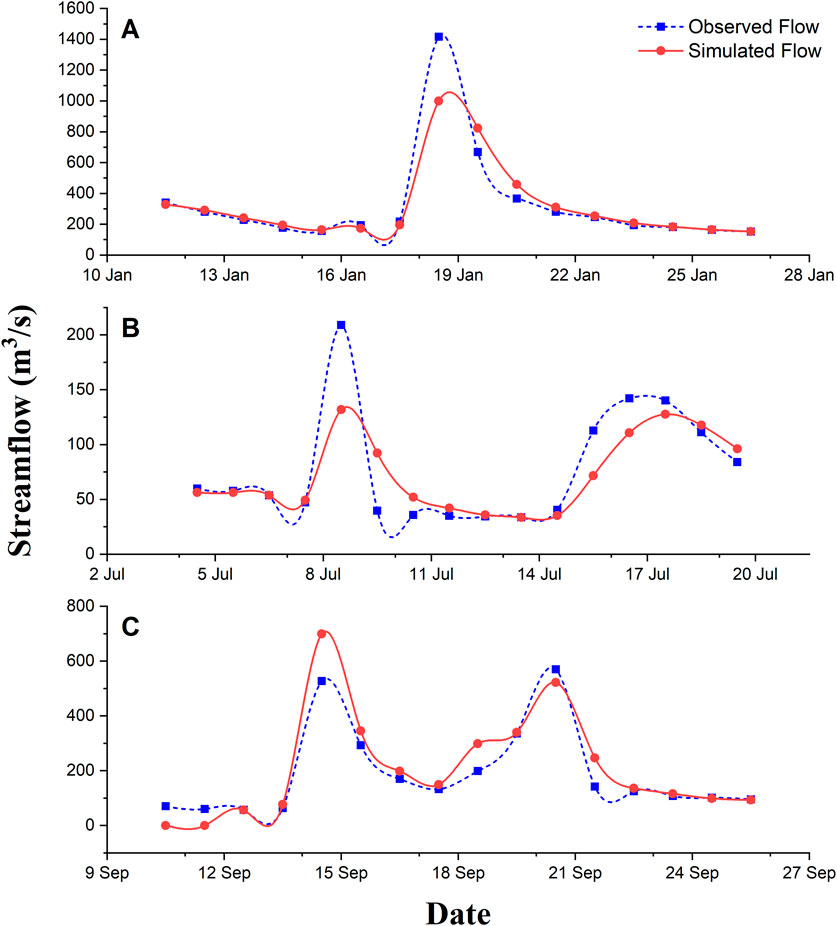
Figure 3. Model calibration results for (A) Tropical Storm Mekkhala, (B) Typhoon Rammasun and validation results for (C) Typhoon Kalmaegi.
Modeled and observed discharges were then used to calculate the Nash-Sutcliff Efficiency (NSE), Percent Bias (PBIAS), and the RMSE-observations standard deviation ratio (RSR) to further assess model performance. These criteria were satisfied with final channel roughness values of 0.035 for Abuan river, 0.025 for Bintacan, 0.045 for Ilagan, and 0.025 for Cagayan river. Table 4 shows the summary of the statistical parameters that were used to assess the model’s performance for this study.
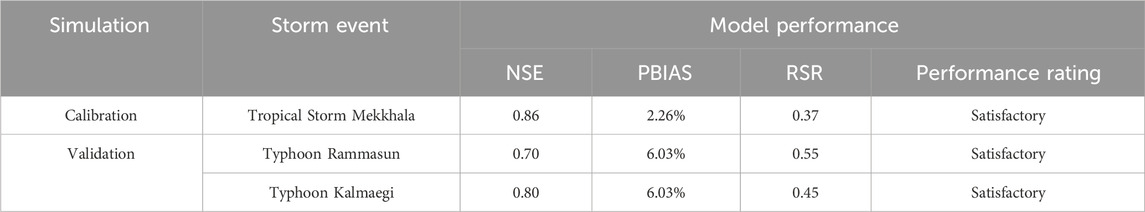
Table 4. Summary of model calibration and validation.
The calibrated manning’s roughness for the river channels produced model discharges that are identical to the observed discharges as shown in Figure 3. Successful model calibration is further shown by the calculated values of the statistical parameters shown in Table 4. Using the modeled and observed discharges, the NSE of the model was determined to be 0.86 and according to (D. N. Moriasi et al., 2007), the model is already acceptable when the NSE is greater than 0.65. In addition, PBIAS values of less than 15% and RSR values of less than 0.60 also indicate satisfactory model performance that were also exhibited by the model with PBIAS and RSR values of 2.26% and 0.37, respectively after calibration.
For model validation, the same channel roughness coefficients were used for the two other storm events and the same statistical parameters were used to evaluate the sufficiency of the model. The model was able to produce an NSE of 0.70, PBIAS of 6.03%, and RSR of 0.55 that were all indications of satisfactory model performance for simulation considering Typhoon Rammasun, while validation using Typhoon Kalmaegi also produced acceptable results having an NSE, PBIAS, and RSR values of 0.80, 6.03%, and 0.45 respectively. Overall, results show that the calibrated river model has an acceptable performance, with an underestimation of about 2%–6%. Having satisfied the statistical criteria for model performance in modeling the discharges which signifies no systematic errors in simulation (Shahid et al., 2018), the Pinacanauan de Ilagan River model was then used to analyze the flood hazard considering a historical storm (baseline) and the two other scenario analyses.
3.2 River flow characteristics
A high-intensity storm event, Typhoon Haima, was used as baseline condition for the hydraulic simulation. The choice of the event was based on the assumption that high-intensity storms may represent extreme cases of flooding specifically for areas that are located on floodplains or near the banks of the river. Depicted in Figure 4 is the results of hydraulic simulation for the baseline typhoon event.

Figure 4. Model calculated (A) discharges and (B) water level during Typhoon Haima.
Based on simulation results, the maximum precipitation that has fallen in the area during the simulation period was 24 mm on 15 October 2016. At around the same day, both the discharges and water level elevations started rising to values of 166.83 m3/s and 27.94 m, respectively. The hydrograph at the monitoring station mid-stream reached its peak discharge on the 20th of October where this date also corresponds to the highest water level elevation that was simulated which was 35.74 m. These peak values of discharge and water level occurred a day after the second highest rainfall during the simulation was recorded which is 14.5 mm.
The rainfall-runoff process in the upstream catchments has introduced flows going into the main river in addition to the precipitation that was transformed to streamflow which have resulted in a peak flow of 8250.99 m3/s as shown. The calibrated roughness of the main channel was determined to be 0.045 which could also have affected the flow. Furthermore, comparing the value of the peak discharge during Typhoon Haima to the other storm events used for calibration and validation shown in Figure 3, it can be seen that it is indeed a storm of higher intensity and is fit for the objective of determining the resulting flood hazard in the study area.
3.3 Baseline flood hazard
Considering the same storm event and the 2015 land cover as input to represent the surface roughness that affect the flow of water in the channel and floodplains as baseline, the inundated areas within the study site boundaries were analyzed. Three observation points within the study site boundary were selected and the flood depths were determined based on hydraulic simulation results. A summary of the selected observation points and description is provided in Table 5.
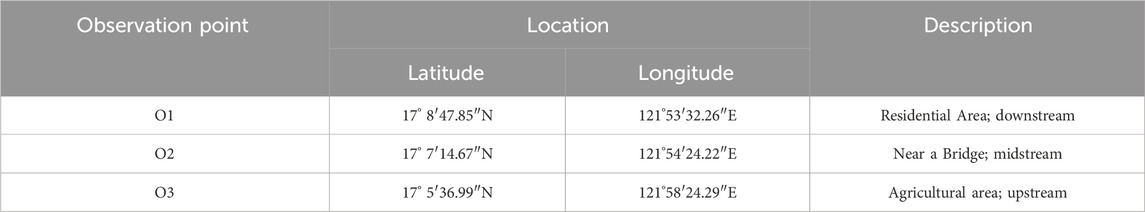
Table 5. Flood hazard observation points.
Figure 5 shows the flood inundation within the study area. The residential area (O1) which is adjacent to the river shows flood rising to a depth of about 1.25 m during the storm event. Aside from being close to the main tributary, this residential area is also located near the confluence of a smaller channel and the main river that could have added to the overflow volume reaching the banks. Meanwhile, the second observation point (O2) located at midstream shows that flood depths reach about 1.49 m. This point was chosen to be analyzed in the study since it is located near a bridge that serves as a route for evacuation in the event of natural disasters such typhoons and floods. Higher flood depths are observed at midstream as compared to O1 which can be attributed to the additional flood plain area southeast of this point as can be seen in the flood hazard map. The most upstream observation point (O3) was chosen since it is located in an agricultural area which is one of the primary livelihood sources in the area. Simulation results show that flood depths reach to about 1.87 m at this point which can be attributed to it being located in a low elevation area as shown in Figure 1. Moreover, this point is near the river confluence thus making it more susceptible to flooding once the river exceeds its capacity especially during typhoon events.

Figure 5. (A) Baseline flood hazard map for the study site showing water depths (including channel depths) and inundated areas for (B) Observation point 1, (C) Observation point 2, and (D) Observation point 3.
3.4 Land cover change analysis
To determine the changes in cover within the study area and its probable effects on the flood hazard, the 2015 and 2020 Land Cover Maps from NAMRIA are shown in Figure 6 and a summary for each cover is provided in Table 6. A simplistic approach of merging some covers such as Annual Crop and Perennial Crop into a single representative cover that is Agricultural was done for better visualization on the map and simpler analysis. From the figure shown, it can be observed that the concentration of built-up areas located near the river and downstream have decreased from the year 2015–2020. In terms of location, built-up areas can also be seen to have spread with greater proximity from the river in 2020 as compared to the historical 2015 land cover.
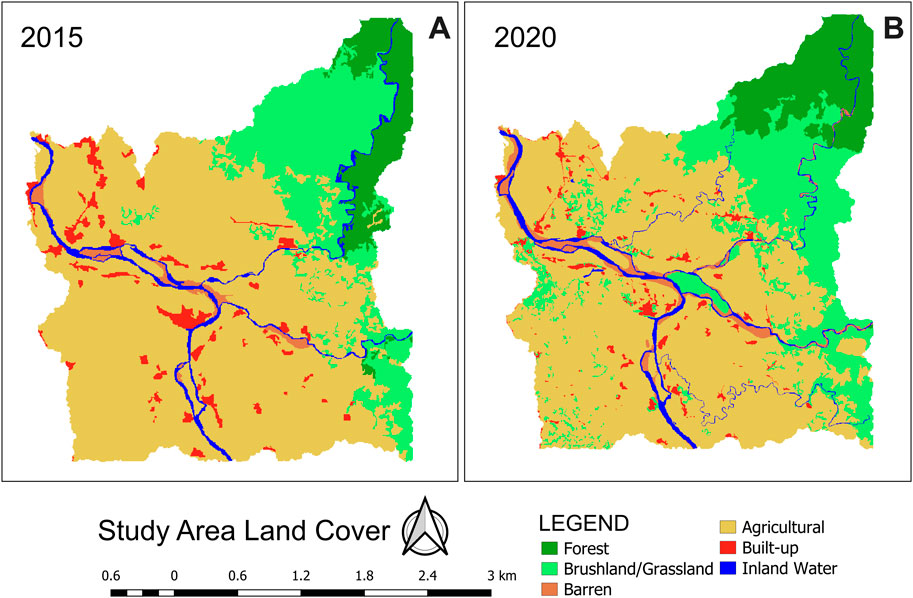
Figure 6. Land cover maps of the study area in (A) 2015 and (B) 2020.
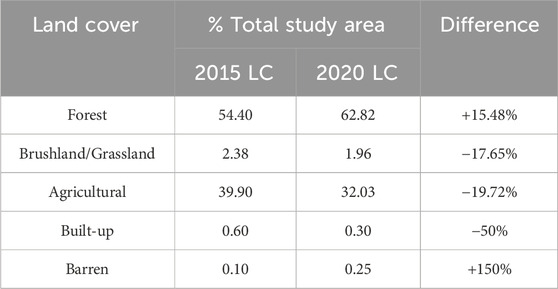
Table 6. Land cover change within the study area.
The forest cover upstream particularly on the side of the Bintacan River has shown to have increased by 15.48% from 2015 to 2020 while the grasslands and brushlands as well as agricultural areas have decreased by 17.65% and 19.72% respectively during the same period. The 2020 land cover also shows an increase in barren lands which are located primarily along the river. This increase in barren lands can be viewed as a result of sediments being transported by the natural river processes through time. Moreover, small creeks can also be seen in the land cover of the year 2020 that are not present in the 2015 available map. Because the change in land cover can cause an increase in the flood risk of an area (Ma et al., 2024), the resulting flood hazard in terms of flood depth considering these changes in cover in the study site was quantified in this study.
3.5 Land cover change effects on flooding
The calibrated model was again used to simulate the Typhoon Haima storm event now using the 2020 land cover to determine the flooding in the area. Table 7 contains summary of the flood depths at the observation points comparing the two different land covers used in the study.
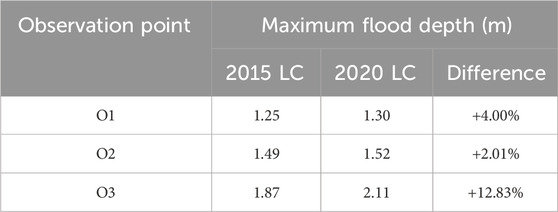
Table 7. Flood depth comparison based on land cover.
From the results of using the 2020 land cover, the flood depth at the residential area downstream reached 1.30 m as compared to 1.25 m depth of flood when using the 2015 cover. The 4% increase in depth can be attributed to the presence of barren land downstream as shown in Figure 6. On the other hand, a 2.01% increase in maximum flood depth was observed midstream at the second observation point where the flood depth increased from 1.49 to 1.52 m. Based on the land cover maps, there is also an increase in barren land near this observation point. Moreover, it can be noticed that some channels became narrower and thus could have also decreased the volume capacity. The largest increase in flood depth was determined in the upstream observation point where the depth increased from 1.87 to 2.11 m and a change in cover from agricultural to grasslands can be seen on the available maps.
3.6 Effect of climate change on flood hazard
The effects of climate change on the flood inundation within the study area were also examined by multiplying the projection factor from the Climate Risk Analysis Matrix (CLIRAM) of the local weather agency to the time-series rainfall of Typhoon Haima while maintaining the 2015 land cover as input. Depicted in Figure 7 is the flood hazard map of the site considering the effects of climate change.
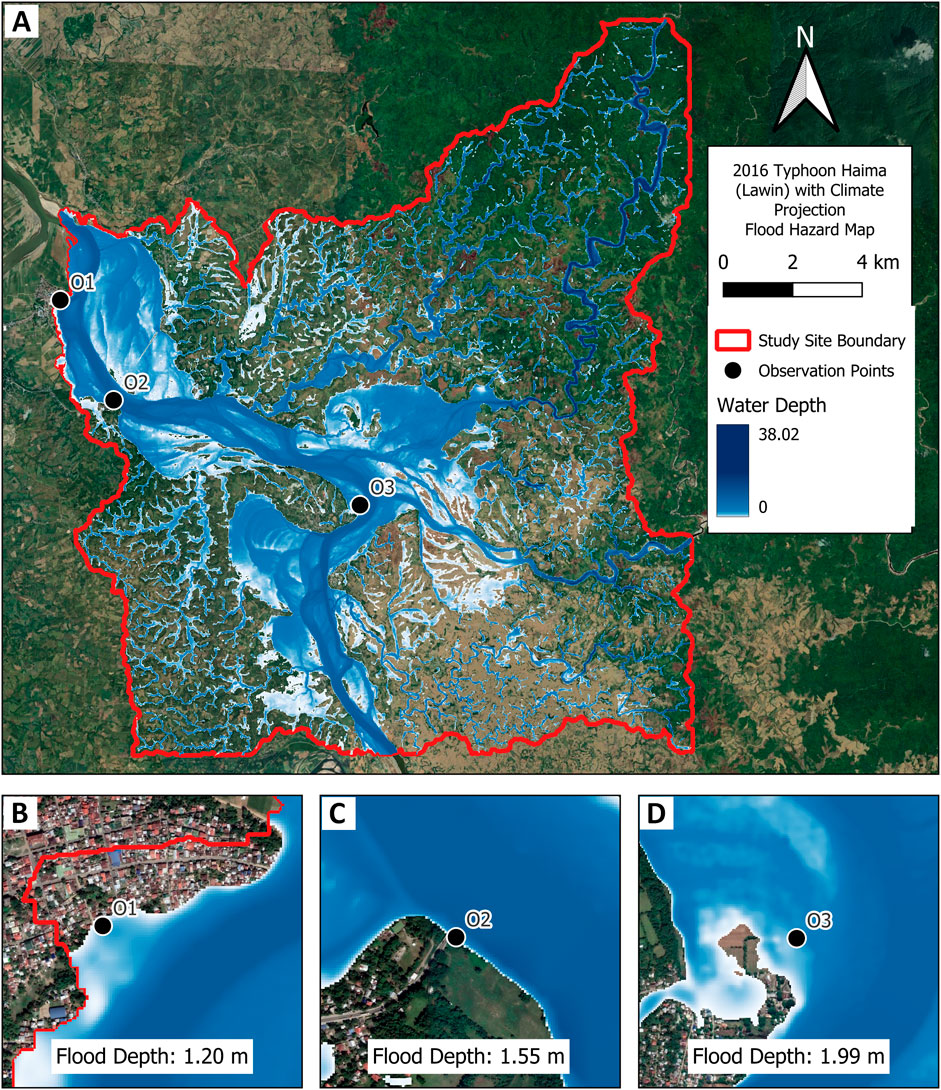
Figure 7. (A) Flood hazard map considering the climate change scenario for the study site showing water depths (including channel depths) and inundated areas for (B) Observation point 1, (C) Observation point 2, and (D) Observation point 3.
An increase of 0.23 m in the depth of flood for the residential area downstream was calculated while the midstream point increased its depth by 0.11 m considering the effect of climate change. Flood inundated areas near the upstream observation point can be seen to have increased compared to the baseline condition. Flood can also be seen to have propagated to more areas given the relatively level topography near this observation point. Aside from more areas being inundated, calculations show that maximum depths have reached 2.24 m which is about a 19.79% greater compared to the baseline peak flood depth. In general, the flood depths at the three observation points increased when factoring in an increase in precipitation over the area since more rainfall could be transformed to runoff and eventually ended up in the streams. Furthermore, since the capacity of the channels remain the same while the volume of water going into the streams is greater as a result of increased precipitation, higher flood depths are expected especially in areas near the river and at lower lying elevations.
4 Discussion
4.1 Importance of roughness calibration on hydraulic model performance
Quantifying and describing flood hazards considering the effects of climate change and urbanization is vital for proactive disaster risk management strategies. This study utilized numerical modeling to calculate the flood depths and identify inundated areas resulting from a historical storm event and perform scenario analyses considering the changes in precipitation and land cover within the study area. Performing roughness calibration for the channels has produced more comparable discharges when compared to the observed values. The graphical comparisons in 3.1 showed good agreement between simulated and measured discharges while calculated statistical parameters are all within acceptability according to the study of Moriasi et al. (2015). In relation to the main objective of this study, the roughness parameter calibration is significant in predicting inundation extent and flow as highlighted by (Pappenberger et al., 2005).
After achieving acceptable results based on statistical criteria, modeled peak discharges are still underestimated which could have been caused by the use of riverbed elevations from the digital topography rather than using this DEM in conjunction to actual river bathymetry which is a method that has proven to significantly improve model performance (Muthusamy et al., 2021). But aside from this underestimation of the peak flows, the model was able to capture the general trend in streamflow for the channels in the study site that is important in describing the flood hazard in the area. In addition, the final roughness values for the channels within the study area ranged from 0.025 to 0.045 that is within the range of natural channels with stones and some weeds based on (Chow, 1985). This may also be related to the barren lands and grasslands along channels depicted in the land covers in 3.4 while this can still be validated further by integrating details from actual field surveys.
4.2 Factors affecting river flow regime and flood hazard parameters
Results of the baseline hydraulic simulation revealed that the topography of an area plays a critical role in conveying streamflow resulting from a rainfall event. The timing of the peak discharge calculated at mid-stream came sometime after the peak precipitation fell into the area which could have been affected by the travel time of the stream flow coming from the upstream tributaries of Abuan, Bintacan, and Ilagan. This can also be described from the idea of higher-to-lower energy direction of free surface flow of open channels. In addition, the roughness in the main channel could also have caused the delay in the arrival of the flood wave (Asselman et al., 2022). This observation of river flow and water level is however limited to the calibration point located at midstream and incorporating additional observation points along the stream can help describe more the routing behavior of the river.
The generated flood map shown in 3.3 for the storm event also shows that existing stream networks can also aid in predicting areas that are likely to be inundated. The areas where the tributaries from the Abuan, Bintacan, and Ilagan Rivers form a confluence is where prominent swelling can be observed. This is primarily due to the flows coming from these different rivers combining in the main channel, but considering the same capacity, leads to overflow to the banks. In fact, according to the study of Osawa (2024), high flood frequencies are often experienced by areas within 1 km distance from a river confluence. Aside from this, the topography also significantly affects what areas are to be inundated as studies have also pointed out that topography-related factors highly influence flood occurrence (Zhao et al., 2024). Flood inundation maps from models were traditionally validated by comparing it to observed inundation areas. There had already been attempts on the use of satellite videos (Masafu and Williams, 2024) and crowd-sourced data (Songchon et al., 2023) to validate 2D flood simulation results. With reference to the scope of the study, since there is no available satellite image during the period of storm events simulated, the generated flood maps were not validated to check the flood extents spatially which can either underestimate or overestimate the total inundated areas of the study site. However, these maps can be further validated to improve their accuracy but are still deemed acceptable after completing satisfactory streamflow calibration.
4.3 Effect of land cover change and climate change
Findings from the flood maps generated considering the change in cover show the effects of the land cover-based surface roughness on the resulting flood depths in the area. The presence of barren lands along the channel as possibly an effect of the natural sediment transport at segments of the river often tend to decrease the volume capacity and thus results to river overflow and eventually flooding in the area. In addition, the change in land cover also has affected channels by making them narrower as shown in 3.4 which can have an effect on the river capacity. In relation to the change in land cover, the roughness of grasslands is lower compared to agriculture cover (Asante and Bandaragoda, 2007; Huang, 2009) that may lead to more water flowing from the surface into the stream resulting to overflow. Furthermore, flood peaks and stream flows also are affected by the change in land cover (Gao et al., 2018; Sanyal et al., 2014) that directly contributes to induced flood risks.
Using the local weather agency’s climate projection tool, it is estimated that there will be an increase in precipitation in the study area. This increase in precipitation is expected to exacerbate the flooding in the area and has shown that climate change has more pronounced effects on the flood risk of the study site as compared to the effect of land cover change. Although this study utilized only the RCP 8.5 (High emission) scenario to represent climate change effects, the resulting flood depths are idealized to be the most conservative that can aid future flood mitigation initiatives as also shown in the results of (Sarchani and Tsanis, 2024) where both RCP 4.5 and RCP 8.5 were compared in terms of flood depth and extent.
4.4 Application and limitations of the study
The model was able to calculate flood depths within its domain, however the flood inundation results are based on the primary influence of topography in the study area. This would imply that any development or alteration in the topography after its acquisition are not reflected. Furthermore, the digital topography (IFSAR) that was used as input cannot capture accurately the riverbed elevation since it usually reflects water surface and thus could affect the accuracy of the model calculated flood depths. Model results could further be improved by combining the digital topographic data with river bathymetry from field surveys as demonstrated by the study of Karim et al. (2013). The layout and impacts of existing drainage systems were also not factored into the hydraulic model that was used in this study. Moreover, the applied rainfall in the area was taken conservatively in hydraulic modeling and was not subjected to losses as it would have been accounted in hydrologic modeling. This may lead to overestimation of the runoff volume since hydrologic losses such as canopy interception, surface depressions, and losses due to infiltration play an important role on the rainfall-runoff process. The spatial accuracy of the model-generated flood maps can further be improved by comparing them to observed flood extents during the storm events simulated through available images from the local disaster management office or on-the-ground interviews from residents within the study areas.
The results of this study can help policymakers in updating the disaster risk reduction and management strategies of local government units. By factoring in the effects of their future developments as well as the effects of climate change, the risks associated with natural hazards can be reduced by limiting the exposure and managing vulnerabilities found within the community. In addition, the methodology that was used in this study can also serve as a framework in understanding behaviors of local systems that are subject to changing landscapes and varying hydraulic and meteorologic forcings for better management and planning.
5 Conclusion
This paper aimed to investigate the effects of climate change and land cover change on the flood risk of areas along the Pinacanauan de Ilagan River. A hydraulic model was set up and calibrated by comparing modeled to observed discharges and after reaching an acceptable accuracy, it was used to calculate flood depths at different points within the study area for both a historical and a future projected storm intensity. Baseline simulation results using a historical storm event show that flood depths at established observation points reach about 1.30–1.50 m downstream while flood depths reached as high as 1.90 m upstream. It was observed that majority of the inundated areas were located at low points in the topography signifying the role which topography plays in directing the flow of water in the study area. Despite topography dictating the areas where the water will go and pond, the location of river confluences has also been found to influence the location of even greater flood depths within the domain.
The effects of land cover change from 2015 to 2020 reveals an increase in flood depth by as much as 4% downstream and as high as 12% near the river confluence upstream. The noticeable increase in barren lands along the channel in the 2020 land cover can be inferred as driven by the natural erosion and deposition dynamics of the stream which is expected to reduce the river’s capacity and trigger an increase in flood depths near the banks of the river. The results of this scenario also highlight the importance of proper land use planning as the surface roughness corresponding to each land cover type also plays a crucial role in retarding or allowing water to flow freely from the surface to the stream. The effects of climate change as represented by increased precipitation have also been examined in this study. With the maximum flood depth increasing by as much as 19.79%, it can be concluded that climate change has a more pronounced effect on the flood risk in the study area as compared to the effects due to land cover changes.
These findings can be of aid to the local decision-makers in factoring the effects of both land cover and climate change in the site selection, planning, and design of future evacuation facilities as well as in updating the current evacuation schemes within their municipalities. With the threat of more intense floods triggered by climate change in conjunction with the nature of the country being exposed to multiple typhoons every year, updating the disaster risk adaptation, management, and preparedness strategies is crucial especially in developing countries where urbanization is essential to meet the demands of the growing population.
Data availability statement
The original contributions presented in the study are included in the article/supplementary material, further inquiries can be directed to the corresponding author.
Author contributions
PY: Writing – original draft, Writing – review and editing, Conceptualization, Data curation, Formal Analysis, Investigation, Methodology, Software, Visualization. FS: Conceptualization, Methodology, Supervision, Validation, Visualization, Writing – original draft, Writing – review and editing.
Funding
The author(s) declare that no financial support was received for the research and/or publication of this article.
Acknowledgments
The authors would like to acknowledge the assistance and support of the different local agencies such as the National Mapping and Resource Information Authority (NAMRIA) and the Philippine Atmospheric Geophysical and Astronomical Services Administration (PAGASA) for catering the data request that were essential in the conduct of this study and the online streamflow database of the Department of Public Works and Highways (DPWH) that was also used in this research.
Conflict of interest
The authors declare that the research was conducted in the absence of any commercial or financial relationships that could be construed as a potential conflict of interest.
Generative AI statement
The author(s) declare that no Generative AI was used in the creation of this manuscript.
Publisher’s note
All claims expressed in this article are solely those of the authors and do not necessarily represent those of their affiliated organizations, or those of the publisher, the editors and the reviewers. Any product that may be evaluated in this article, or claim that may be made by its manufacturer, is not guaranteed or endorsed by the publisher.
References
Alfonso, C. D. Q., Sundo, M. B., Zafra, R. G., Velasco, P. P., Aguirre, J. J. C., and Madlangbayan, M. S. (2019). Flood risk assessment of major river basins in the Philippines. Int. J. Geomate 17 (64), 201–208. doi:10.21660/2019.64.17155
AlZaatiti, F., Halwani, J., and Soliman, M. R. (2025). Climate change impacts on flood risks in the abou ali river basin, Lebanon: a hydrological modeling approach. Results Eng. 25, 104186. doi:10.1016/j.rineng.2025.104186
Araza, A., Perez, M., Cruz, R. V., Aggabao, L. F., and Soyosa, E. (2021). Probable streamflow changes and its associated risk to the water resources of abuan watershed, Philippines caused by climate change and land use changes. Stoch. Environ. Res. Risk Assess. 35 (2), 389–404. doi:10.1007/s00477-020-01953-3
Asante, K. O., and Bandaragoda, C. (2007). Technical manual for the geospatial stream flow model (GeoSFM). Available online at: https://www.researchgate.net/publication/264934494.
Asselman, N., de Jong, J. S., Kroekenstoel, D., and Folkertsma, S. (2022). The importance of peak attenuation for flood risk management, exemplified on the meuse river, the Netherlands. Water Secur. 15, 100114. doi:10.1016/j.wasec.2022.100114
Bae, C., and Lee, D. K. (2020). Effects of low-impact development practices for flood events at the catchment scale in a highly developed urban area. Int. J. Disaster Risk Reduct. 44, 101412. doi:10.1016/j.ijdrr.2019.101412
Baltazar, R. G. (2024). Forecasting the impact of climate change on rice crop yields under RCP4.5 and RCP8.5 scenarios in Central Luzon, Philippines, using machine learning algorithms. Environ. Ecol. Int. J. Agric. Nat. Resour 51 (1), 10–26. doi:10.7764/ijanr.v51i1.2494
Benavidez, R., Jackson, B., Maxwell, D., and Paringit, E. (2016). Improving predictions of the effects of extreme events, land use, and climate change on the hydrology of watersheds in the Philippines. IAHS-AISH Proc. Rep. 373, 147–151. doi:10.5194/piahs-373-147-2016
Besarra, I., Opdyke, A., Mendoza, J. E., Delmendo, P. A., Santiago, J., Evangelista, D. J., et al. (2025). The cost of flooding on housing under climate change in the Philippines: examining projected damage at the local scale. J. Environ. Manag. 380, 124966. doi:10.1016/j.jenvman.2025.124966
Bulti, A. T., and Yutura, G. A. (2025). Statistical downscaling of climate variables for local forecasts and applications to improve climate change prediction in upper Blue Nile basin. Phys. Chem. Earth 138, 103867. doi:10.1016/j.pce.2025.103867
Cabral, S. L., Campos, J. N. B., Silveira, C. da S., and Teixeira, F. A. de A. (2014). Hydrologic and hydraulic modelling integrated with gis: a study of the acaraú river basin – ce. J. Urban Environ. Eng. 8 (2), 167–174. doi:10.4090/juee.2014.v8n2.167174
Chow, V.Te (1985). Open-channel hydraulics. international student edition. McGraw-Hill civil engineering series. (21st print).
Daigneault, A., Brown, P., and Gawith, D. (2016). Dredging versus hedging: comparing hard infrastructure to ecosystem-based adaptation to flooding. Ecol. Econ. 122, 25–35. doi:10.1016/j.ecolecon.2015.11.023
Dallison, R. J. H., Patil, S. D., and Williams, A. P. (2021). Impacts of climate change on future water availability for hydropower and public water supply in Wales, UK. J. Hydrology Regional Stud. 36, 100866. doi:10.1016/j.ejrh.2021.100866
Deng, C., Zhang, H., Hamilton, D. P., and Hollingsworth, A. (2025). Impacts of changes in climate and water demand on flow in a subtropical river catchment below a major dam. J. Environ. Manag. 375, 124137. doi:10.1016/j.jenvman.2025.124137
Dingle, E. H., Paringit, E. C., Tolentino, P. L. M., Williams, R. D., Hoey, T. B., Barrett, B., et al. (2019). Decadal-scale morphological adjustment of a lowland tropical river. Geomorphology 333, 30–42. doi:10.1016/j.geomorph.2019.01.022
Dryden, R., Anand, M., Lehner, B., and Fluet-Chouinard, E. (2021). Do we prioritize floodplains for development and farming? Mapping global dependence and exposure to inundation. Glob. Environ. Change 71, 102370. doi:10.1016/j.gloenvcha.2021.102370
Erena, S. H., Worku, H., and De Paola, F. (2018). Flood hazard mapping using FLO-2D and local management strategies of Dire Dawa city, Ethiopia. J. Hydrology Regional Stud. 19, 224–239. doi:10.1016/j.ejrh.2018.09.005
FathiAzar, A., De Angeli, S., and Cattari, S. (2024). Towards integrated multi-risk reduction strategies: a catalog of flood and earthquake risk mitigation measures at the building and neighborhood scales. Int. J. Disaster Risk Reduct. 113, 104884. doi:10.1016/j.ijdrr.2024.104884
Gao, J., Kirkby, M., and Holden, J. (2018). The effect of interactions between rainfall patterns and land-cover change on flood peaks in upland peatlands. J. Hydrology 567, 546–559. doi:10.1016/j.jhydrol.2018.10.039
Gül, G. O., Harmancioǧlu, N., and Gül, A. (2010). A combined hydrologic and hydraulic modeling approach for testing efficiency of structural flood control measures. Nat. Hazards 54 (2), 245–260. doi:10.1007/s11069-009-9464-2
Hettiarachchi, S., Wasko, C., and Sharma, A. (2018). Increase in flood risk resulting from climate change in a developed urban watershed - the role of storm temporal patterns. Hydrology Earth Syst. Sci. 22 (3), 2041–2056. doi:10.5194/hess-22-2041-2018
Huang, Y. (2009). Rapid flood risk assessment using GIS technology. Int. J. River Basin Manag. 7 (1), 3–14. doi:10.1080/15715124.2009.9635365
Huo, F., Huang, J., Ma, Y., Guo, C., Zhang, W., and Deng, S. (2024). Modelling study on pedestrian evacuation dynamics considering exit selection behaviour under flood disaster. Phys. Lett. Sect. A General, Atomic Solid State Phys. 527, 129967. doi:10.1016/j.physleta.2024.129967
IPCC, (2013). Climate Change 2013: The Physical Science Basis. Contribution of Working Group I to the Fifth Assessment Report of the Intergovernmental Panel on Climate Change. Editors Stocker, T.F., Qin, D., Plattner, G.-K., Tignor, M., Allen, S.K., Boschung, J., Nauels, A., Xia, Y., Bex, V., and Midgley, P.M. Cambridge University Press, Cambridge, United Kingdom and New York, NY, USA,1535.
Japan International Cooperation Agency. (2002). The feasibility study of the flood control project for the lower Cagayan river in the republic of the Philippines. https://openjicareport.jica.go.jp/pdf/11871191_03.pdf
Karim, H., Hashim, M. G., and Bin Mohd Salleh, M. R. (2013). A blending technique of topographic and hydrographic DEMs for river alignment modelling. Int. Archives Photogrammetry, Remote Sens. Spatial Inf. Sci. - ISPRS Archives 42 (4W5), 113–119. doi:10.5194/isprs-archives-XLII-4-W5-113-2017
Kifle Arsiso, B., Mengistu Tsidu, G., Stoffberg, G. H., and Tadesse, T. (2017). Climate change and population growth impacts on surface water supply and demand of addis Ababa, Ethiopia. Clim. Risk Manag. 18, 21–33. doi:10.1016/j.crm.2017.08.004
Lewis, J. W., Lytle, S. E., and Tavakoly, A. A. (2023). Climate change projections of continental-scale streamflow across the mississippi river basin. Theor. Appl. Climatol. 151 (3–4), 1013–1034. doi:10.1007/s00704-022-04243-w
Luo, Y., Ficklin, D. L., Liu, X., and Zhang, M. (2013). Assessment of climate change impacts on hydrology and water quality with a watershed modeling approach. Sci. Total Environ. 450–451, 72–82. doi:10.1016/j.scitotenv.2013.02.004
Ma, S., Wang, L. J., Jiang, J., and Zhao, Y. G. (2024). Land use/land cover change and soil property variation increased flood risk in the Black soil region, China, in the last 40 years. Environ. Impact Assess. Rev. 104, 107314. doi:10.1016/j.eiar.2023.107314
Masafu, C., and Williams, R. (2024). Satellite video remote sensing for flood model validation. Water Resour. Res. 60 (1). doi:10.1029/2023WR034545
Masson-Delmotte, V., Zhai, P., Pörtner, H.-O., Roberts, D., Skea, J., Shukla, P. R., et al. (2019). “Global warming of 1.5°C an IPCC special report on the impacts of global warming of 1.5°C above pre-industrial levels and related global greenhouse gas emission pathways,” in The context of strengthening the global response to the threat of climate change, sustainable development, and efforts to eradicate poverty edited by science officer science assistant graphics officer working group I technical support unit. Available online at: www.environmentalgraphiti.org.
Moriasi, D. N., Arnold, J. G., Van Liew, M. W., Bingner, R. L., Harmel, R. D., and Veith, T. L. (2007). Model evaluation guidelines for systematic quantification of accuracy in watershed simulations. Trans. ASABE 50 (3), 885–900. doi:10.13031/2013.23153
Moriasi, D. N., Gitau, M. W., Pai, N., and Daggupati, P. (2015). Hydrologic and water quality models: performance measures and evaluation criteria. Trans. ASABE 58 (6), 1763–1785. doi:10.13031/trans.58.10715
Mostafaie, A., Forootan, E., Safari, A., and Schumacher, M. (2018). Comparing multi-objective optimization techniques to calibrate a conceptual hydrological model using in situ runoff and daily GRACE data. Comput. Geosci. 22 (3), 789–814. doi:10.1007/s10596-018-9726-8
Muthusamy, M., Casado, M. R., Butler, D., and Leinster, P. (2021). Understanding the effects of digital elevation model resolution in urban fluvial flood modelling. J. Hydrology 596, 126088. doi:10.1016/j.jhydrol.2021.126088
Namgyal, T., Thakur, D. A., D.S, R., and Mohanty, M. P. (2023). Are open-source hydrodynamic models efficient in quantifying flood risks over mountainous terrains? An exhaustive analysis over the hindu-kush-himalayan region. Sci. Total Environ. 897, 165357. doi:10.1016/j.scitotenv.2023.165357
Okaka, F. O., and Odhiambo, B. D. O. (2018). Relationship between flooding and out break of infectious diseasesin Kenya: a review of the literature. J. Environ. Public Health 2018, 1–8. doi:10.1155/2018/5452938
Osawa, T. (2024). Agricultural land around river confluences could strongly suppress floods occurrences. Environ. Sustain. Indic. 24, 100533. doi:10.1016/j.indic.2024.100533
Pappenberger, F., Beven, K., Horritt, M., and Blazkova, S. (2005). Uncertainty in the calibration of effective roughness parameters in HEC-RAS using inundation and downstream level observations. J. Hydrology 302 (1–4), 46–69. doi:10.1016/j.jhydrol.2004.06.036
Paterson, D. L., Wright, H., and Harris, P. N. A. (2018). “Health risks of flood disasters,”Clin. Infect. Dis. Issue 9, 67. 1450–1454. doi:10.1093/cid/ciy227
Pili, H. S., Santos, F. D., Baluyot, C. P., Manzanade, K. M., and Cruz, Y. A. P. (2024). “Coupled hydrologic-hydraulic modeling-based flood inundation mapping for a segment of the tullahan river in valenzuela city, Philippines,” in Proceedings of the 3rd international civil engineering and architecture conference. Editor M. Casini (Singapore: Springer Nature), 657–669.
Puno, G. R., Marin, R. A., Angelica Amper, R. L., and Allan Talisay, B. M. (2018). Flood simulation using geospatial models in manupali flood simulation using geospatial and hydrologic models in manupali watershed, Bukidnon, Philippines. Philipp. Article J. Biodivers. Environ. Sci. 294 (3), 294–303. Available online at: http://www.innspub.net.
Ranjan, R., Goswami, A., Ojha, C. S. P., Jain, S., and Singh, P. K. (2025). Climate change impact assessment on the river discharge of the upper ganga subbasin. Phys. Chem. Earth, Parts A/B/C 138, 103887. doi:10.1016/j.pce.2025.103887
Ringo, J., Sabai, S., and Mahenge, A. (2025). Contribution of flood early warning response measures in reducing flood effects in kilosa district, Tanzania. Clim. Serv. 37, 100534. doi:10.1016/j.cliser.2024.100534
Rosete, E., Alejo, L., Balderama, O., Bareng, J. L., Bartolome, C., Alejandro, A., et al. (2024). Mitigating future water scarcity through comprehensive assessment of climate and socio-environmental impacts in river basins. doi:10.21203/rs.3.rs-4250146/v1
Sadyrov, S., Isaev, E., Tanaka, K., Murata, A., and Sidle, R. C. (2025). High-resolution assessment of climate change impacts on the surface energy and water balance in the glaciated naryn river basin, central Asia. J. Environ. Manag. 374, 124021. doi:10.1016/j.jenvman.2024.124021
Sanyal, J., Densmore, A. L., and Carbonneau, P. (2014). Analysing the effect of land-use/cover changes at sub-catchment levels on downstream flood peaks: a semi-distributed modelling approach with sparse data. Catena 118, 28–40. doi:10.1016/j.catena.2014.01.015
Sarchani, S., and Tsanis, I. (2024). Climate change impact on flood inundation along the downstream reach of the humber river basin. J. Hydrology Regional Stud. 53, 101829. doi:10.1016/j.ejrh.2024.101829
Sayama, T., Tatebe, Y., and Tanaka, S. (2017). An emergency response-type rainfall-runoff-inundation simulation for 2011 Thailand floods. J. Flood Risk Manag. 10 (1), 65–78. doi:10.1111/jfr3.12147
Shahid, M., Cong, Z., and Zhang, D. (2018). Understanding the impacts of climate change and human activities on streamflow: a case study of the soan river basin, Pakistan. Theor. Appl. Climatol. 134 (1–2), 205–219. doi:10.1007/s00704-017-2269-4
Singh, P., Sinha, V. S. P., Vijhani, A., and Pahuja, N. (2018). Vulnerability assessment of urban road network from urban flood. Int. J. Disaster Risk Reduct. 28, 237–250. doi:10.1016/j.ijdrr.2018.03.017
Songchon, C., Wright, G., and Beevers, L. (2023). The use of crowdsourced social media data to improve flood forecasting. J. Hydrology 622, 129703. doi:10.1016/j.jhydrol.2023.129703
Towsif Khan, S., Sample, D. J., Wynn-Thompson, T., and Butcher, J. (2025). Impacts of climate change on storm event-based flow regime and channel stability of urban headwater streams. J. Environ. Manag. 374, 123994. doi:10.1016/j.jenvman.2024.123994
Zeiger, S. J., and Hubbart, J. A. (2021). Measuring and modeling event-based environmental flows: an assessment of HEC-RAS 2D rain-on-grid simulations. J. Environ. Manag. 285, 112125. doi:10.1016/j.jenvman.2021.112125
Zha, J. L., Chuan, T., Qiu, Y., Wu, J., Zhao, D. M., Fan, W. X., et al. (2024). Projected near-surface wind speed and wind energy over central Asia using dynamical downscaling with bias-corrected global climate models. Adv. Clim. Change Res. 15 (4), 669–679. doi:10.1016/j.accre.2024.07.007
Zhang, J., Li, C., Zhang, X., and Zhao, T. (2024). Improving simulations of extreme precipitation events in China by the CMIP6 global climate models through statistical downscaling. Atmos. Res. 303, 107344. doi:10.1016/j.atmosres.2024.107344
Zhao, G., Li, K., Tian, S., Liang, R., and Wang, Y. (2024). Applying a coupled model framework to assess global climate change impacts on the river-type harmful algal blooms in the middle and lower reaches of the hanjiang river, China. Ecol. Indic. 169, 112834. doi:10.1016/j.ecolind.2024.112834
Keywords: climate change, flooding, hydraulic modeling, HEC-RAS, Ilagan, land cover, Philippines
Citation: Yumol PJM and Santos FD (2025) Hydraulic investigation of the impacts of climate and land cover change on flooding of the Pinacanauan de Ilagan river in Isabela, Philippines. Front. Environ. Sci. 13:1604757. doi: 10.3389/fenvs.2025.1604757
Received: 02 April 2025; Accepted: 21 July 2025;
Published: 12 August 2025.
Edited by:
Maria João Feio, University of Coimbra, PortugalReviewed by:
Muhammad Shahid, Brunel University London, United KingdomMaurice Duka, University of the Philippines Los Baños, Philippines
Copyright © 2025 Yumol and Santos. This is an open-access article distributed under the terms of the Creative Commons Attribution License (CC BY). The use, distribution or reproduction in other forums is permitted, provided the original author(s) and the copyright owner(s) are credited and that the original publication in this journal is cited, in accordance with accepted academic practice. No use, distribution or reproduction is permitted which does not comply with these terms.
*Correspondence: Franz D. Santos, ZmRzYW50b3NAdXAuZWR1LnBo