 Yue-Yue Sui1
 Xing-Fu Zhang2*
- 1School of Finance, Anhui University of Finance and Economics, Bengbu, China
- 2School of Finance and Economics, Anhui Technical College of Industry and Economy, Hefei, China
Introduction: Under the current situation of increasingly severe environmental problems, carbon emission intensity (CEI) has become an essential indicator for evaluating the degree of environmental pollution, and sustainable development has become an eternal issue pursued by human beings. Along with the deepening of the concept of green sustainable development, green finance (GF) and digital economy (DIEC) have gradually become environmentally friendly and reliable tools that play an active role in controlling carbon emissions. Therefore, to promote sustainable economic development, it is necessary to promote GF, DIEC, and CEI in an integrated way, and there are relatively few studies on the synergistic promotion of these three aspects.
Methods: Using the entropy method, the coupling coordination degree model (CCDM), and the spatial analysis method, this study thoroughly examines the spatio-temporal pattern of the coupling and coordination of GF, DIEC, and CEI in the Yangtze River Economic Belt using panel data from 11 provinces in the region from 2013 to 2022.
Results: The findings demonstrate that: (1) The Yangtze River Economic Belt’s general extent of GF and DIEC advancement is increasing, and the DIEC’s level exhibits a pattern of a declining gradient from the downstream to the upstream areas. (2) The Yangtze River Economic Belt’s CEI is on the decline, with the upstream region having a higher CEI than the middle and downstream regions. (3) Although there is regional diversity, the Yangtze River Economic Belt’s three systems exhibit a growing trend in connection and coordination degree. (4) The Yangtze River Economic Zone shows a declining trend in the spatial difference in the coupling coordination degree (CCD) of the three systems(overall Gini coefficient reduced by 31% from 2013 to 2022), with the upstream showing the smallest discrepancy and the downstream showing the biggest. The discrepancy between upstream and downstream is mainly caused by the different economic structures as well as the levels of progress of the two regions. The source of the discrepancy is mainly interregional.
Discussion: This paper puts forward some suggestions in light of the advancement status of the three systems in the region, hoping that it can provide a reference basis for the sustainable development of the region.
1 Introduction
The Industrial Revolution greatly contributed to the advancement of science and technology around the world; however, it was followed by a steady climb in global carbon emissions. This situation has given rise to several serious problems, including global warming, the intensification of the greenhouse effect, the rapid deterioration of the environment, and irreversible harm to human health (Wang et al., 2023). The accelerating process of global warming poses a huge existential crisis and challenge to biodiversity and long-term human development (Figueiredo et al., 2022). Consequently, the problem of carbon emissions has turned into a focal point of global concern. Being the biggest developing nation and the second-largest economy in the world (Liang and Song, 2022). China’s carbon emissions from transport and other sectors, such as construction, should not be underestimated (Liu et al., 2024a; Liu et al., 2024b). Therefore, China must take countermeasures.
China has been a major force in the worldwide fight against climate change since President Xi Jinping said in 2020 that China needs to peak its carbon emissions by 2030 and become carbon-neutral by 2060 (Huang and Chen, 2022). By 2024, China has already made great strides in reducing carbon emissions through energy-saving and carbon-reducing retrofits in key sectors and industries. Action Programme on Energy Conservation and Carbon Reduction 2024–2025 emphasises green finance (GF). It guides financial institutions to support energy and carbon reduction projects by market principles and the law. It extends effective financing. Furthermore, regions are encouraged to support energy-saving and carbon-reducing renovation, energy-using equipment renewal, energy and carbon emission statistics, and accounting capacity enhancement through existing funding channels. GF describes a new paradigm of financial growth that promotes industrial enterprises to reform environmentally and focuses capital flow on low-carbon and sustainable sectors. The growth of GF and the enhancement of the effectiveness of carbon emissions are necessary to meet China’s carbon dioxide emission targets (Liang and Song, 2022). GF comprises many investment and financing programs. To put it into practice, investments must be moved from sectors that utilize much energy and bring about much pollution to those that use less energy and are more ecologically friendly (Zhang et al., 2022a). GF has been demonstrated to upgrade industrial structure and energy mix optimization at the macro level, which lowers carbon emissions (Wang et al., 2023). Through funding, innovation, and outside oversight, GF can lower carbon emissions on a micro level (Zhao et al., 2024).
Meanwhile, the digital economy (DIEC) is an emerging economic form. Its influence on carbon emissions should not be disregarded. Research has found that DIEC could affect carbon emissions in various ways, such as energy use intensity, the amount of energy usage, and the sustainability of cities (Zhang et al., 2022b). The importance of the DIEC in supporting a digital revolution of sectors is highlighted in detail in China’s Fourteenth Five-Year Plan for the Development of the DIEC. It highlights the utilization of DIEC to enhance energy utilization efficiency and production operations. The plan also underscores the imperative of greening digital infrastructure and encouraging the formation of novel industries and business operations. These measures are designed to curtail resource consumption and to assist in achieving targets for carbon emission reduction. It can be seen that GF and the DIEC have become important tools for controlling carbon emissions and actively promoting sustainable economic development. Reaching dual-carbon targets and fostering outstanding economic development now depend heavily on a seamless combination of DIEC and GF.
At present, there is a sizable body of published investigations about how GF affects carbon emissions. Furthermore, some scholars have studied the important role played by the DIEC in reducing carbon emissions. However, there is a lack of studies about how the DIEC and GF together affect carbon emissions. There is even less research about the intrinsic connection between the synergistic advancement of these three systems. Considering this, researching how advancing GF and DIEC could together decline carbon emissions, and how these three fields interact, is valuable in theory and practice for China and even the world’s low-carbon strategies.
Consequently, there is a compelling rationale for conducting further comprehensive and extensive studies in this domain. Drawing on the perspective of the synergistic advancement of these three aspects, our study takes the information from 11 provinces in the Yangtze River Economic Belt from 2013 to 2022 to measure the stage of development and coupling coordination degree (CCD) of the three systems of GF, DIEC, and carbon emission intensity (CEI), and further explores their spatial distribution characteristics, with a view to improving the extent of coordination among the three systems and fostering the deep convergence of these systems. This offers policy guidance for green and sustainable economic growth in China.
2 Literature review
Carbon emission is one of the key factors of environmental pollution, and it is crucial for environmentally friendly development to pay sustained attention to carbon emission and conduct research to measure it. Currently, there is a large amount of literature on carbon emissions, some from the perspective of different industries, such as construction (Huang et al., 2024), industry (Gao et al., 2021), power industry (Li et al., 2024), etc., to explore the current situation of carbon emissions in various industries, drivers, emission reduction potential and feasible emission reduction path. There are also scholars from the perspective of factors affecting carbon emissions, pointing out that economic growth (Xiao and Peng, 2023), sectoral structure (Yan and Ge, 2017), urbanization development (Xiao and Peng, 2023); (Tang et al., 2024), etc. have an important impact on carbon emissions, after understanding the factors affecting carbon emissions, we can be more purposeful and directional to explore the path of low-carbon emission reduction.
Existing literature on GF, DIEC, and carbon emissions mostly examines the respective impacts of GF and DIEC on carbon emissions from a single aspect. The first one concerns how GF affects carbon emissions. Many current researches have explored the environmental influence of GF from specific financial instruments. It has been argued that the issuance of green bonds effectively enhances the level of environmental performance of firms and significantly improves their ability to develop innovative environmental technologies (Benlemlih et al., 2023). Green credit policies can discourage investment activity in energy-intensive sectors (Liu et al., 2017). Mechanisms like green bonds can do this by reducing waste and pollutants. Some studies explore the impact of GF on the environment at a holistic level. It has been argued that GF is more effective in advanced credit locations and economies (Al Mamun et al., 2022). GF can promote green production (Tong et al., 2022), which is centered on energy saving and emission reduction, and can promote the development of the low-carbon economy. Along with the public’s growing concern for the environment, some studies have found that GF plays a positive regulatory role in the public’s concern for the environment and promotes carbon emission reduction (Wang et al., 2024). An argument that GF has spatial spill-over influence is also put forward. GF can lower carbon emissions in the area while additionally lowering carbon emissions in nearby areas (Chen and Chen, 2021).
The secondary aspect concentrates on the modus operandi through which the DIEC influences the decrease of carbon emissions. DIEC has the potential to markedly curtail carbon emissions, a process in which the enhancement of industrial structure assumes a pivotal moderating function (Chang et al., 2023). Li and Wang examined 274 Chinese cities and developed the view that the spatial influence of DIEC on carbon emissions is shaped like a reverse U (Li and Wang, 2022). The long-lasting spillover effect of DIEC on carbon dioxide emissions is supported by reliable evidence of technology spillover and the modernization of industrial frameworks; this effect is greater over the long run than it is over the short term. After studying 30 Chinese provinces, Ma et al. come to the conclusion that China’s DIEC, CO2 emissions, and energy consumption are linked in the long term (Ma et al., 2022). The long-term research data indicates that digitalization lowers CO2 emissions in many provinces. The third aspect concentrates on the consequences of the favourable cooperation between GF and DIEC with regard to carbon emissions. Liu and Zhu (2024) argued that DIEC could boost the influence of GF and help reduce carbon intensity. This assertion points to the potential for DIEC to make a meaningful contribution to supporting the decrease in carbon emissions. However, DIEC’s potential as a catalyst for advancing GF to cut carbon emissions is not fully realized. It is suggested that in an environment with great accomplishments of DIEC, the positive consequence of GF on urban carbon becomes less pronounced (Wu et al., 2025).
In summary, research shows that DIEC and GF can cut carbon emissions. Few scholars have studied the DIEC’s effect on GF. Few studies explore how the growth of these two systems affects carbon emissions, and even fewer have examined the synergistic growth of these three systems. In this study, we find this deficiency in existing research and try to explore the intrinsic mechanism of the coupled and coordinated development among the three systems of GF, DIEC, and CEI, with a view to providing richer theoretical support in the existing research on the development among the binary systems.
3 Material and approaches
3.1 Index system construction
We analyze the region using a fair and scientifically comparable approach to measure the degree of advancement of each of the GF, DIEC, and CEI in the upper, middle, and lower Yangtze River Economic Belt.
3.1.1 Construction of the GF indicator system
In constructing the green financial indicator system, this paper refers to the existing research (Chen and Chen, 2021; Liu et al., 2019) and divides the GF into five parts; these aspects can comprehensively reflect the development scale, capital flow, and risk guarantee ability of the GF in the Yangtze River economic belt. The entropy value approach is adopted to find the comprehensive GF indicators for each province, and the measurement results are listed in Table 1.
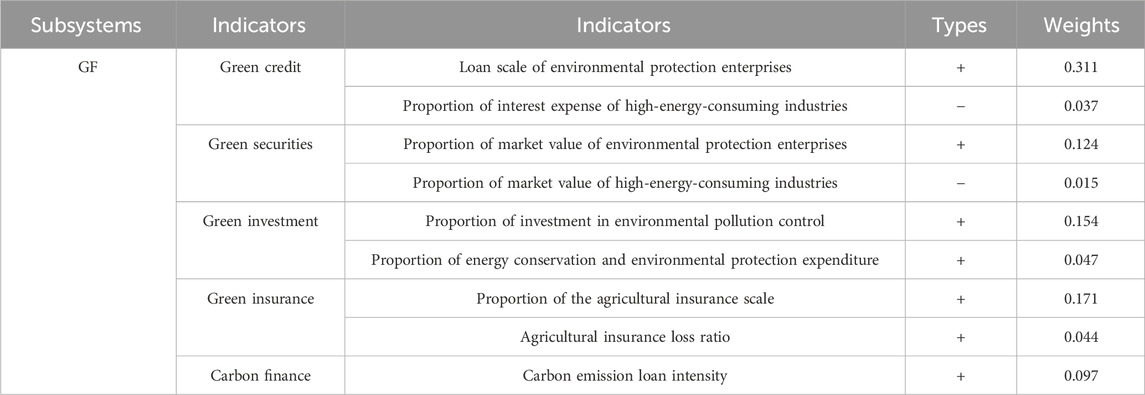
Table 1. GF measurement system.
3.1.2 Construction of the DIEC indicator system
This study utilizes previous scholars’ interpretations of the connotations of the DIEC (Zhu et al., 2022) and combines them with practical foundations. It uses four indicators: digital economic foundation, digitalization industrialization, industrial digitization, and DIEC penetration. We comprehensively measure the development level and characteristics of the DIEC from the aspects of facility support, industrial development, application scenarios, and popularity.
The entropy approach is adopted to calculate each province’s DIEC indicators. The measurement consequences are detailed in Table 2.
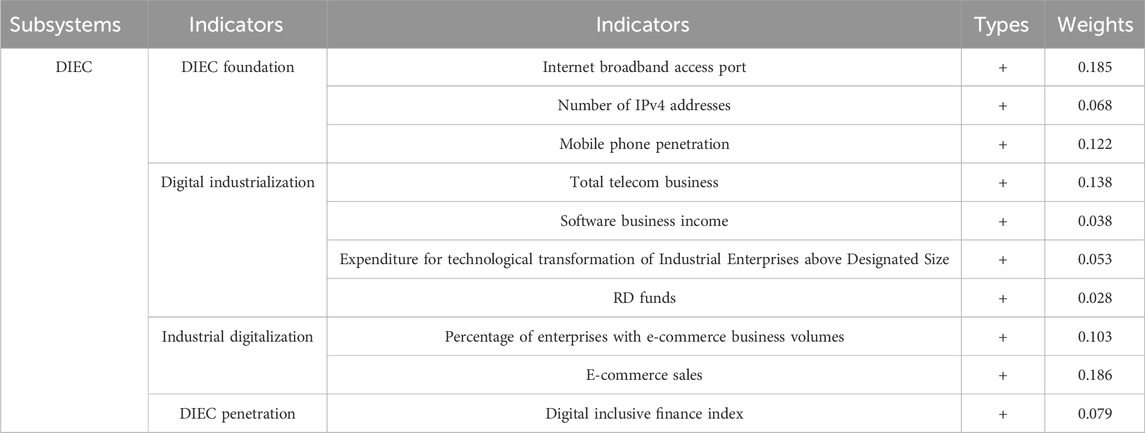
Table 2. DIEC measurement system.
3.1.3 Carbon emission indicator construction
Each province’s carbon emissions are measured in this research using the CEI, which is based on the existing studies (Yi et al., 2024), reflecting the level of carbon emissions corresponding to each unit of economic output and effectively measuring the association between economic development and carbon emissions. First, the calculation method relies on the 2006 edition of the IPCC Guidelines for National Greenhouse Gas Emission Inventories. We determine the total quantity of carbon emissions in each region. In our article, we measure the CO2 emissions for the end-use energy consumption data from the 11 provinces. The following Equation 1 provides the formula:
The carbon emissions of each of the 11 provinces are measured by the formula above. The CEI was calculated, and the regional CEI was denoted as the percentage of the carbon emissions of the province’s GDP.
3.2 Data source
This research uses data from 11 provinces in the Yangtze River Economic Belt between 2013 and 2022 to analyze regional differences. It is drawn on data from the China Statistical Yearbook, the China Energy Statistical Yearbook, and the official statistical yearbooks of these 11 provinces. Missing data were interpolated. Data for the Digital Inclusive Finance Index are from the Peking University Digital Inclusive Finance Index, published by the Digital Finance Research Centre at Peking University.
3.3 Methodology of the research
3.3.1 Entropy value approach
The entropy value technique is a multi-indicator weight determination strategy based on information entropy. It has the advantage of allowing you to realistically determine each indicator’s weight using the discrete degree of the data itself, removing the effect of subjective human variables. In light of this, we borrowed the research method of Liu et al. (2023) and adopted the entropy value approach to measure the GF and DIEC indicator system of the Yangtze River Economic Belt, which sequentially standardizes the acquired initial data, calculates the weights of the sample indicator values and calculates the information entropy and coefficient of variation accordingly, and ultimately derives the weights of the indicators to construct a comprehensive indicator system of GF and DIEC.
3.3.2 CCDM
We constructed a CCDM for the three systems; the formula is calculated as Equation 2 below (Dong et al., 2023):
U1, U2, and U3 denote the GF, DIEC, and CEI levels, respectively. C denotes the coupling level of the interaction among the three systems. In order to further investigate the interaction and equilibrium between the three systems, we need to calculate the degree of coordination. The following Equation 3 provides the formula:
D represents how well the three systems are connected, while C shows how well they are coupled, and U shows the overall composite score of system. U is calculated using U = αU1 + βU2 + λU3, where U1, U2, and U3 are the scores of the three systems. The weights of the three systems are set at 1/3 to make them equally important. The scale for measuring D varies from 0 to 1, with larger values denoting stronger coupling and coordination among the systems.
By extant literature practice (Dong et al., 2023), as listed in Table 3, the CCD is categorized into ten levels.
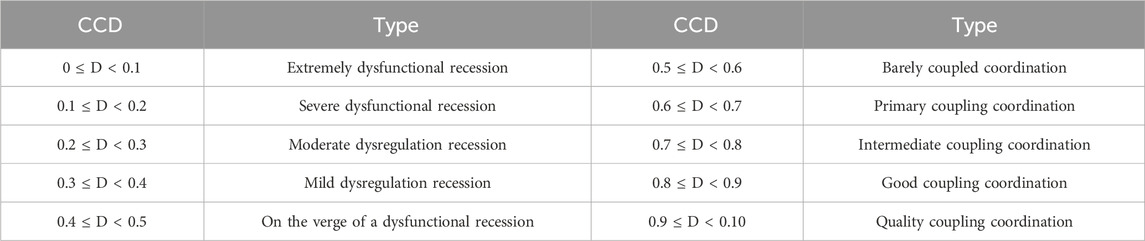
Table 3. Classification of CCD.
3.3.3 Dagum gini coefficient (D-Gini)
Our paper mainly chooses the D-Gini decomposition method proposed by related scholars in 1997 to decompose the spatial variations in the coordination of these three systems in the Yangtze River Economic Belt in 2013–2022 (Dagum, 1998; Yuan et al., 2024). This method has been extensively applied to depict the issue of regional disparities.
Based on the D-Gini decomposition, the total D-Gini is calculated according to the following Equation 4:
where
the formulas for calculating intra-area variations are Equations 6–11.
In Equations 12 and 13, we denote djh as the variations in the CCD of the three-system among subregions, pjh as the super covariance matrix, and Fj and Fh as the cumulated density functional of subregions j and h, respectively. We hope to calculate D-Gini to explore the regional discrepancy of CCD of upstream, midstream, and downstream GF, DIEC, and CEI, and analyze the source of regional discrepancy, and we hope to draw meaningful conclusions from it, which will provide a certain foundation for the coordinated advancement of the whole area.
4 Findings and interpretation
4.1 Analysis of measurement results for GF and DIEC
Table 4 shows the degree of GF and DIEC in each province (due to space limitations, only the data for 2013, 2017, and 2022 are shown). The concrete interpretation is below.
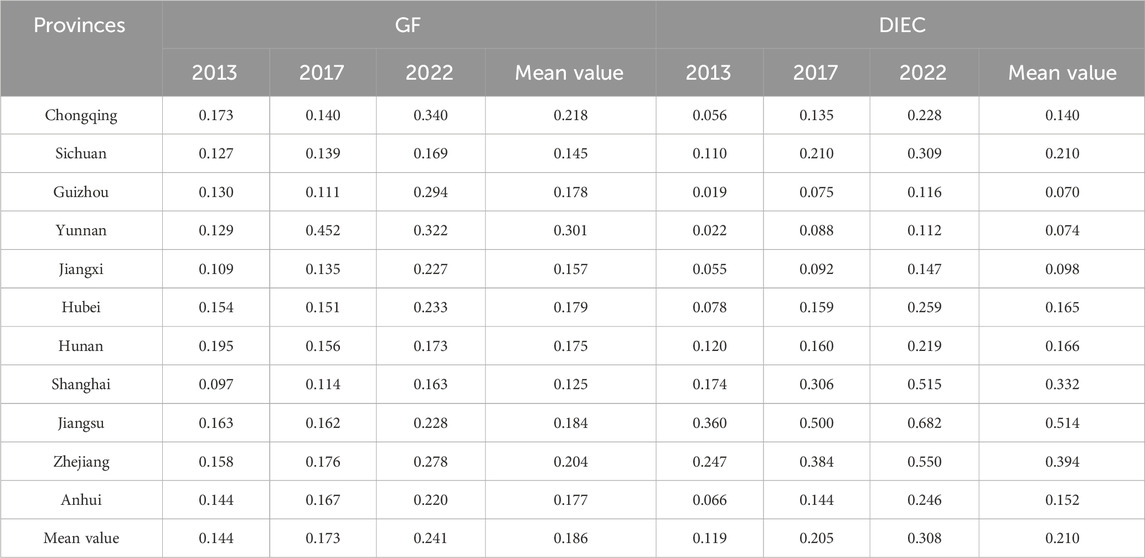
Table 4. Growth degree of GF and DIEC in 2013–2022.
With no discernible regional variations, the degree of advancement of GF in the 11 provinces over the study period demonstrated a general upward trend, suggesting that GF is gradually moving towards a more prominent and mature stage of development in the region and that GF is becoming increasingly important as a key force for sustainable advancement. Simultaneously, the degree of DIEC advancement in Yangtze River Economic Belt provinces also shows a general rising tendency, suggesting that the DIEC has progressively grown to be an essential driver of regional economic advancement. Specifically, the DIEC has a comparatively high extent of growth and stable growth in the downstream regions of Shanghai, Zhejiang, and Jiangsu. Among them, it is worth noting that the DIEC level of Jiangsu Province has exhibited a marked improvement, rising from 0.360 in 2013 to 0.682 in 2022, with a growth value of nearly 90%, which is partly attributed to the strategy of “strong province with digital integration” implemented by Jiangsu Province in recent years, which also gives us some insights into the need for the government to do a good job of policy guidance and long-term planning for regional development. Upstream areas such as Guizhou, Yunnan, and other provinces have a weaker starting point but a faster growth rate, showing greater development potential. From the standpoint of geographical distribution, the level of DIEC advancement in this area exhibits a declining distribution pattern from the downstream to the upper and middle reaches. This discrepancy could be caused by the downstream region’s robust economic base, cutting-edge technology, and wealth of human resources, all of which create supportive conditions for the growth of the DIEC, while the middle and upper reaches region’s development lags behind, which limits the rate of growth. To mitigate this situation, upstream and midstream need to strengthen digital infrastructure and enterprise introduction, and focus on industrial digital transformation and technological innovation to improve synergistic regional advancement.
4.2 Analysis of the measurement results of CEI
As shown in Figure 1, between 2013 and 2022, CEI fell in 11 provinces. This displays that the area is successfully reducing and controlling its carbon emissions, likely due to the decoupling of CO2 emissions from social progress in diverse parts of the Yangtze River Economic Belt. The upstream zone has the highest CEI, while the rest have similar levels. This is because the upstream zone’s economic advancement is behind, and its industry structure favors traditional sectors, resulting in lower efficiency and higher emissions. Policy support and coordinated efforts are helping to narrow the gap. With the tilting of policies at the national level, such as the promotion of strategies such as the coordinated advancement of this area and the establishment of coordination mechanisms such as industrial collaboration and technical assistance between upstream and downstream areas, the upstream regions are receiving more support for ecological protection, industrial upgrading, and other aspects, and the gap in CEI between regions is gradually narrowing.
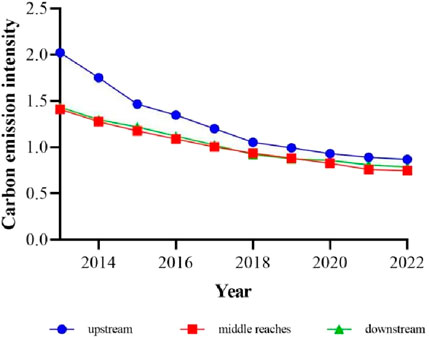
Figure 1. Average CEI of three regions
4.3 Analysis of the spatio-temporal pattern of CCD of the three systems
4.3.1 Characterization of the temporal pattern of CCD of the three systems
The CCD of the three systems from 2013 to 2022 is calculated using the CCDM to determine the CCD of the three systems in the Yangtze River Economic Belt (see Table 5). This area’s three-system CCD demonstrates an overall upward trend; however, unbalanced characteristics are evident between regions.
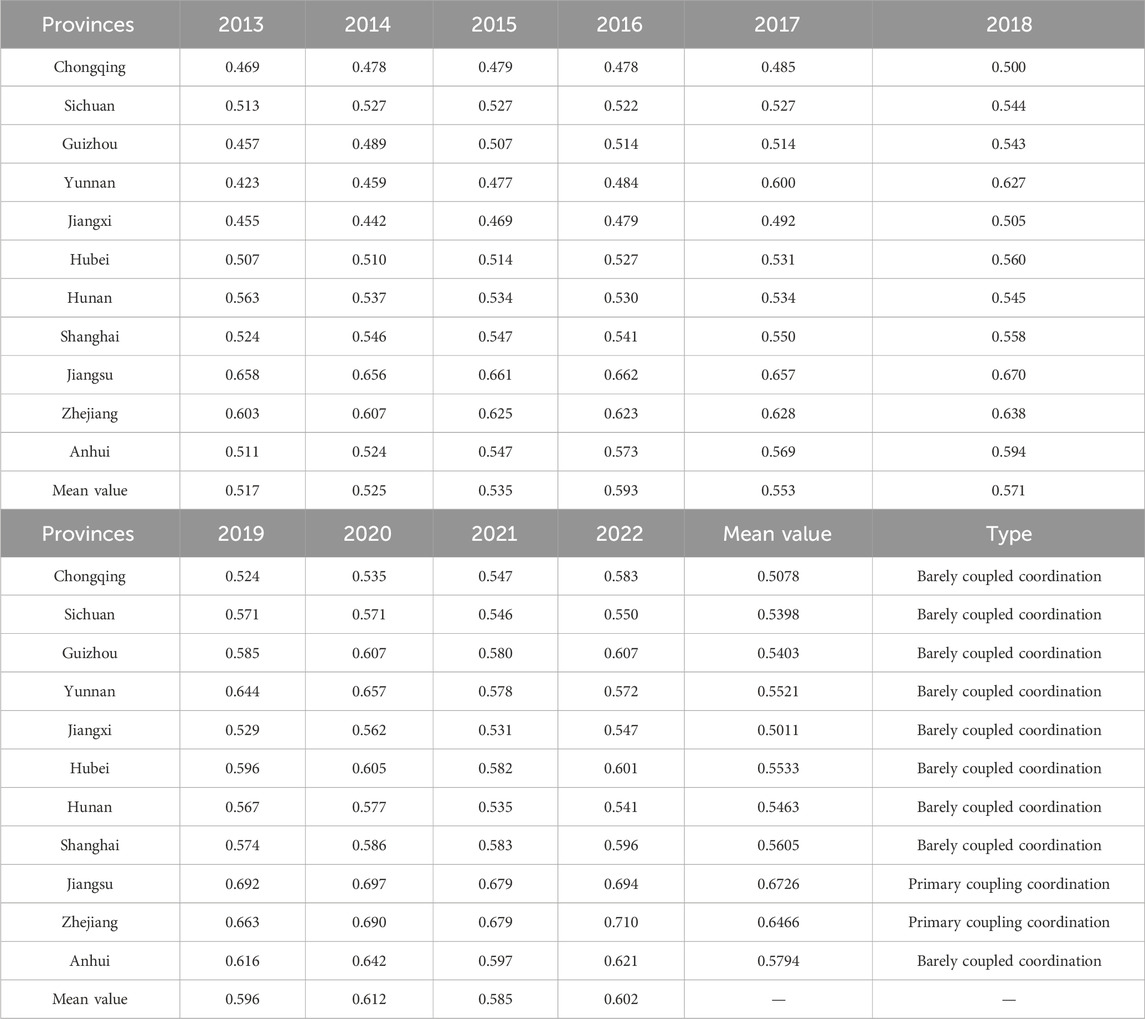
Table 5. 2013–2022: three systems’ coupling coordination scheduling.
Specifically, there was a development from barely coupled to primarily coupled coordination in the 11 provinces, with an average increase from 0.517 in 2013 to 0.602 in 2020. This shows improved coordination in the whole area among the three systems. This is because these regions are seeking ways to cut CEI while enhancing financial support for low-carbon economy projects and pushing technological innovation and digital transformation to enhance energy efficiency and boost industrial upgrading, which may be tied to the policy direction in the last several years.
At the regional level, the CCD of the provinces shows an upward trend, with a decreasing gradient from downstream to upstream. This is due to differing locations, energy endowments, economic growth, policy implementation, and industrial structure. These factors affect the advancement process in each region.
Jiangsu, Zhejiang, and Shanghai, located downstream, show higher levels of CCD than the average Yangtze River Economic Belt region. These economically advanced areas have a more developed financial market and technology, providing a good foundation for GF and the DIEC. Governments in these regions are also focusing increasingly on these areas and introducing strategies and actions that could accelerate the deep integration of these systems. The upstream region, which is comparatively less developed and favors traditional sectors, could limit the DIEC and GF. It must have an arduous task in controlling carbon emissions, so it needs to strengthen the planning and deployment of GF and the DIEC and promote the integration of the two.
4.3.2 Spatial characterization of the CCD of the three systems
To clarify the spatial variations and causes of the degree of coordination associated with these systems, this research calculated the D-Gini of the CCD related to these three systems with the help of Stata software, and the consequences are displayed in Table 6 and Figure 2.
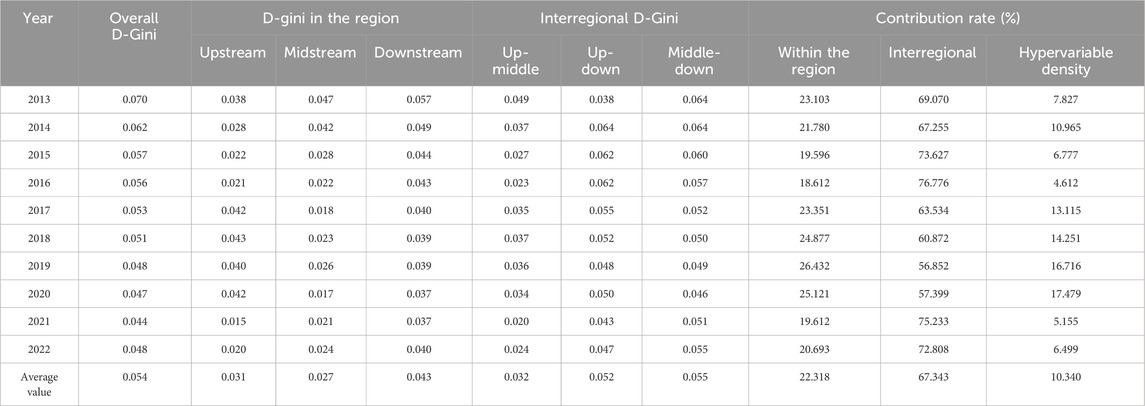
Table 6. Three system coupling coordination D-Gini.
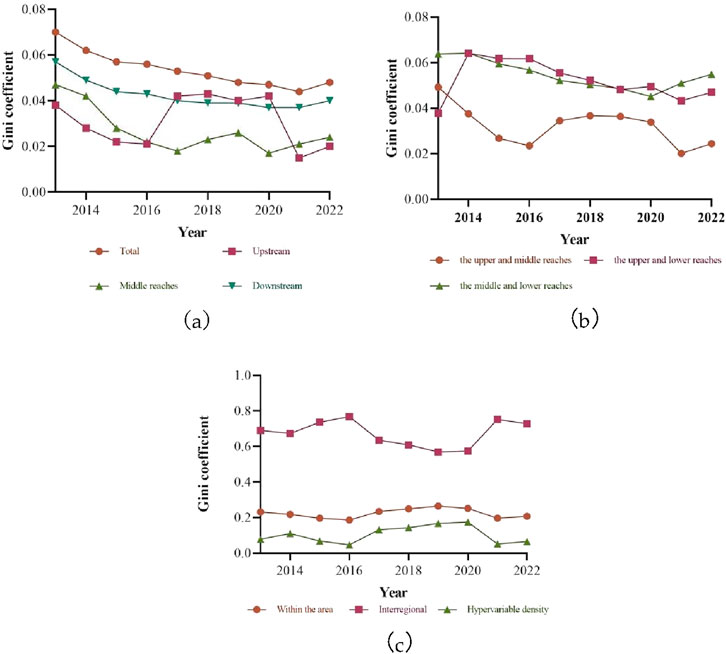
Figure 2. Three system coupling coordination D-Gini. (a) Intra-regional differences (b) Interregional differences (c) Source of difference.
4.3.2.1 Distinctions between regions and overall
Figure 2a displays the tendency of the D-Gini of the CCD of the region as a whole, as well as the upper, middle, and lower zones over the research period. From the overall level, the D-Gini indicates a wavering downward tendency from 0.07 in 2013 to 0.048 in 2020, indicating that the spatial gaps in CCD of these three systems in the Yangtze River Economic Belt are generally shrinking. The D-Gini of these three zones is not higher than the overall coefficient, and the downstream region’s sample mean is 0.043 (the highest of the three). This region’s coefficient is trending down, possibly due to its advanced economy and complex industry, and different cities’ varying speeds in promoting GF and DIEC, also controlling carbon emissions, causing greater discrepancy in coupling and coordination. The variation in the central zone is the second highest, and the overall trend is fluctuating downward. The variation in the upstream zone is more fluctuating, showing a downward trend, then an upward trend, then a downward trend. This may be because of the late start of the growth of GF and the DIEC in this area, but it may also be due to the abundance of resources and the urgent need to protect the ecosystem, which is progressing faster in controlling carbon intensity, leading to fluctuations in the extent of coupling coordination.
4.3.2.2 Interregional differences
Figure 2b displays the change in the D-Gini of interregional CCD in these three main areas in the study period. Regarding the tendency of change, the degree of spatial disparity among the three main areas, namely, upstream, midstream, and downstream, displays a declining evolution. This could be seen in the overall situation, where the difference in CCD between upstream and downstream areas is the greatest, while the gap between upstream and midstream areas is the least. This may be due to the fact that downstream areas, like Jiangsu, Shanghai, and Zhejiang, have developed economies, mature digital economies, green financial markets, and strict controls on carbon emissions, and thus have a greater CCD. On the flip side, the upstream sector is relatively backward in economic progress, with an industrial structure that favors resource-based and traditional industries, limited innovation and application of GF, and challenges in controlling carbon emissions, resulting in a lower CCD. The midstream region’s industrial structure and degree of economic growth are more evenly distributed than those of the upstream region. These local variations are a reflection of this place’s unbalanced green advancement and digital transition process, which calls for the improvement of coordinated regional growth through strengthening regional cooperation, optimizing the industrial layout, and increasing policy support.
4.3.2.3 Sources of discrepancy
Figure 2c demonstrates the causes of spatial discrepancy in CCD over the study period. It is not difficult to find that interregional variance contributes the most, with its average contribution rate of 67.343 percent, followed by within-region variance and ultimately hypervariable density. From the trend of change, the contribution of interregional and hypervariable density displays an overall decreasing tendency. It shows that promoting coordinated regional development is still the direction of future development, as the variations in the CCD of the three systems are mainly due to inter-regional variations.
5 Conclusion, policy proposals, and discussion
5.1 Conclusion
The research uses information from 11 provinces in the Yangtze River Economic Belt from 2013 to 2022. By calculating each province’s CEI, it investigates this area’s potential for emission reduction and green development. We chose CCDM to analyze the coordinated evolution connection among the three systems. Finally, the spatial and time-based distribution of the CCD among the three systems is explored, and the conclusions are drawn: There is a general rising trend in the progress level of the DIEC and GF across all provinces. Additionally, the advancement level of the DIEC exhibits a geographic distribution typical of a diminishing gradient from downstream to upstream locations. This area’s CEI is on the decline, with the upstream region having a higher CEI than the middle and downstream regions. There is a clear gradient from the lower to the upper reaches, although the degree of coordination between the provinces demonstrates an increasing tendency. The spatial disparities in CCD are shrinking, and the primary source of these disparities is inter-regional. Within the region, the extent of variation within the lower basin is the greatest, and the extent of variation in the upper basin is the least, but there is a large amplitude of variation in 2016–2021. There is a varying declining tendency in the midstream area. The level of geographic difference between the three main areas—upstream, midstream, and downstream—all exhibit a declining tendency when viewed from an interregional perspective. The upstream and downstream areas have the greatest discrepancy in the CCD, while the upstream and midstream zones have the smallest variation.
5.2 Policy proposals
The subsequent policy proposals are outlined in our article in light of the above conclusions: (1) It is imperative to enhance the synergy between DIEC and GF. The promotion of low-carbon growth requires the connection between the DIEC and GF. Through technological innovation and policy incentives, the two should be deeply integrated. GF should support the sustainable growth of the DIEC while utilizing digital technology to increase the reliability and efficacy of green financial offerings. (2) The implementation of regionally specific development initiatives is imperative. A diversified development strategy must be implemented, reflecting the differences in industry structure and level of economic advancement among the zones of the Yangtze River Economic Belt. (3) Boost collaboration and coordination between regions. To close the development gap and make progress together, interregional coordination and collaboration must be strengthened. Create a platform for cross-regional cooperation to encourage the exchange of knowledge and resources in the DIEC and GF, to work together to address the problems caused by carbon emissions, and to support the low-carbon and green growth of this place as a whole. (4) With the continuous advancement of big data and cloud computing, the synergistic relationship between the network structure and various elements within the system has become more and more critical (Liu et al., 2025a; Liu et al., 2025b), and the various types of network systems involved in GF and DIEC have become more complex and intertwined, and their roles are gradually emerging, so we should make full use of the dividends of the times and give full play to the advantages of the technology and the application of algorithms so as to maximize the function of GF and DIEC in reducing carbon emissions.
5.3 Discussion
Existing studies mostly focus on the impacts of individual GF and DIEC systems on carbon emissions or the local correlation between GF and DIEC, while this study is innovative in analyzing the relationship between the three systems from the perspective of their coupled and coordinated advancement. We find that the development levels of GF and DIEC in all provinces show an upward trend from 2013 to 2022, which strengthens the findings of (Peng et al., 2023 and Fu et al., 2022) to a certain extent. Meanwhile, we are also concerned that the advancement level of DIEC shows a gradient downward trend from downstream to upstream, which further illustrates that factors such as the level of economic development and regional advantages have a certain influence on the development of DIEC. After analysis, the CEI of the upper reaches is higher than that of the middle and lower streams, which has a certain correlation with the conclusion that the upper areas have a lower carbon emission efficiency, as mentioned in (Liu and Hao, 2022).
This study reveals the potential mechanism of the synergistic development of GF, DIEC, and CEI on the reduction of CEI through the analysis of coupling coordination. We find that the CCD of the three systems is on the rise, but there is still room for increase, indicating that the development of GF and DIEC can jointly promote low-carbon development to a certain extent, but this driving force has not yet been fully released and needs to be further explored. In addition, there are geographical differences in this coordinated development, with the largest intra-regional differences in the downstream and the smallest in the upstream, and the inter-regional discrepancy constitutes the main source of the overall differences. Therefore, in the future, we need to focus on strengthening regional coordinated advancement, bridging the differences, optimizing resource allocation, and promoting the synergy of the three systems.
In the future, if the study can be refined and more accurate and detailed data can be obtained, we expect to be able to analyze the role of a green financial product or digital economic tool in the whole process. At the same time, the scope of the study can be expanded to cover the whole country and even the world to propose more universally applicable policy recommendations to better promote sustainable development.
Data availability statement
The raw data supporting the conclusions of this article will be made available by the authors without undue reservation.
Author contributions
Y-YS: Resources, Project administration, Writing – original draft, Data curation, Software, Methodology, Conceptualization, Validation. X-FZ: Investigation, Writing – review and editing, Formal Analysis, Visualization, Funding acquisition, Validation, Methodology, Conceptualization, Supervision.
Funding
The author(s) declare that financial support was received for the research and/or publication of this article. This research is supported by the Provincial Quality Engineering Project of Colleges and Universities (2023cxtd193).
Conflict of interest
The authors declare that the research was conducted in the absence of any commercial or financial relationships that could be construed as a potential conflict of interest.
Generative AI statement
The author(s) declare that no Generative AI was used in the creation of this manuscript.
Publisher’s note
All claims expressed in this article are solely those of the authors and do not necessarily represent those of their affiliated organizations, or those of the publisher, the editors and the reviewers. Any product that may be evaluated in this article, or claim that may be made by its manufacturer, is not guaranteed or endorsed by the publisher.
References
Al Mamun, M., Boubaker, S., and Nguyen, D. K. (2022). Green finance and decarbonization: evidence from around the world. Finance Res. Lett. 46, 102807. doi:10.1016/j.frl.2022.102807
Benlemlih, M., Jaballah, J., and Kermiche, L. (2023). Does financing strategy accelerate corporate energy transition? Evidence from green bonds. Bus. Strategy Environ. 32 (1), 878–889. doi:10.1002/bse.3180
Chang, H., Ding, Q., Zhao, W., Hou, N., and Liu, W. (2023). The digital economy, industrial structure upgrading, and carbon emission intensity——empirical evidence from China's provinces. Energy Strategy Rev. 50, 101218. doi:10.1016/j.esr.2023.101218
Chen, X., and Chen, Z. (2021). Can green finance development reduce carbon emissions? Empirical evidence from 30 Chinese provinces. Sustainability 13 (21), 12137. doi:10.3390/su132112137
Dagum, C. (1998). “A new approach to the decomposition of the Gini income inequality ratio,” in A new approach to the decomposition of the Gini income inequality ratio, HD. Physica-Verlag, 47–63. doi:10.1007/978-3-642-51073-1_4
Dong, Q., Zhong, K., Liao, Y., Xiong, R., Wang, F., and Pang, M. (2023). Coupling coordination degree of environment, energy, and economic growth in resource-based provinces of China. Resour. Policy 81, 103308. doi:10.1016/j.resourpol.2023.103308
Figueiredo, J., Thomas, C. J., Deleersnijder, E., Lambrechts, J., Baird, A. H., Connolly, S. R., et al. (2022). Global warming decreases connectivity among coral populations. Nat. Clim. Change 12 (1), 83–87. doi:10.1038/s41558-021-01248-7
Fu, L., Liu, B., Zhu, Z., Cao, J., Sun, C., and Yu, Z. (2022). Analysis of the coupling coordinated development and evolutionary trend of digital economy and ecological environment. Front. Environ. Sci. 10, 1006354. doi:10.3389/fenvs.2022.1006354
Gao, P., Yue, S., and Chen, H. (2021). Carbon emission efficiency of China’s industry sectors: from the perspective of embodied carbon emissions. J. Clean. Prod. 283, 124655. doi:10.1016/j.jclepro.2020.124655
Huang, Y., and Chen, C. (2022). The spatial spillover and threshold effect of green finance on environmental quality: evidence from China. Environ. Sci. Pollut. Res. 29, 17487–17498. doi:10.1007/s11356-021-16892-x
Huang, Z., Zhou, H., Miao, Z., Tang, H., Lin, B., and Zhuang, W. (2024). Life-cycle carbon emissions (LCCE) of buildings: implications, calculations, and reductions. Engineering 35, 115–139. doi:10.1016/j.eng.2023.08.019
Li, Y., Yang, X., Du, E., Liu, Y., Zhang, S., Yang, C., et al. (2024). A review on carbon emission accounting approaches for the electricity power industry. Appl. Energy 359, 122681. doi:10.1016/j.apenergy.2024.122681
Li, Z., and Wang, J. (2022). The dynamic impact of digital economy on carbon emission reduction: evidence city-level empirical data in China. J. Clean. Prod. 351, 131570. doi:10.1016/j.jclepro.2022.131570
Liang, J., and Song, X. (2022). Can green finance improve carbon emission efficiency? Evidence from China. Front. Environ. Sci. 10, 955403. doi:10.3389/fenvs.2022.955403
Liu, J. B., Guan, L., Cao, J., and Chen, L. (2025b). Coherence analysis for a class of polygon networks with the noise disturbance. IEEE Trans. Syst. Man, Cybern. Syst., 1–10. doi:10.1109/TSMC.2025.3559326
Liu, J. B., Liu, B. R., and Lee, C. C. (2024a). Social network analysis of regional transport carbon emissions in China: based on motif analysis and exponential random graph model. Sci. Total Environ. 954, 176183. doi:10.1016/j.scitotenv.2024.176183
Liu, J. B., Wang, X., Hua, L., Cao, J., and Chen, L. (2025a). The coherence and robustness analysis for a family of unbalanced networks. IEEE Trans. Signal Inf. Process. over Netw. 11, 378–387. doi:10.1109/TSIPN.2025.3555164
Liu, J. B., Yuan, X. Y., and Lee, C. C. (2024b). Prediction of carbon emissions in China's construction industry using an improved grey prediction model. Sci. Total Environ. 938, 173351. doi:10.1016/j.scitotenv.2024.173351
Liu, J. Y., Xia, Y., Fan, Y., Lin, S. M., and Wu, J. (2017). Assessment of a green credit policy aimed at energy-intensive industries in China based on a financial CGE model. J. Clean. Prod. 163, 293–302. doi:10.1016/j.jclepro.2015.10.111
Liu, Q., and Hao, J. (2022). Regional differences and influencing factors of carbon emission efficiency in the Yangtze River economic belt. Sustainability 14 (8), 4814. doi:10.3390/su14084814
Liu, R., Wang, D., and Zhang, L. (2019). Can green financial development promote regional ecological efficiency? A case study of China. Nat. Hazards 95, 325–341. doi:10.1007/s11069-018-3502-x
Liu, W., and Zhu, P. (2024). The impact of green finance on the intensity and efficiency of carbon emissions: the moderating effect of the digital economy. Front. Environ. Sci. 12, 1362932. doi:10.3389/fenvs.2024.1362932
Liu, Y., Jiang, Y., Pei, Z., Xia, N., and Wang, A. (2023). Evolution of the coupling coordination between the marine economy and digital economy. Sustainability 15 (6), 5600. doi:10.3390/su15065600
Ma, Q., Tariq, M., Mahmood, H., and Khan, Z. (2022). The nexus between digital economy and carbon dioxide emissions in China: the moderating role of investments in research and development. Technol. Soc. 68, 101910. doi:10.1016/j.techsoc.2022.101910
Peng, G., Wang, T., Ruan, L., Yang, X., and Tian, K. (2023). Measurement and spatial–temporal analysis of coupling coordination development between green finance and environmental governance in China. Environ. Sci. Pollut. Res. 30 (12), 33849–33861. doi:10.1007/s11356-022-24657-3
Tang, X., Liu, S., Wang, Y., and Wan, Y. (2024). Study on carbon emission reduction countermeasures based on carbon emission influencing factors and trends. Environ. Sci. Pollut. Res. 31 (9), 14003–14022. doi:10.1007/s11356-024-31962-6
Tong, L., Jabbour, C. J. C., Najam, H., and Abbas, J. (2022). Role of environmental regulations, green finance, and investment in green technologies in green total factor productivity: empirical evidence from Asian region. J. Clean. Prod. 380, 134930. doi:10.1016/j.jclepro.2022.134930
Wang, J., Tian, J., Kang, Y., and Guo, K. (2023). Can green finance development abate carbon emissions: evidence from China. Int. Rev. Econ. and Finance 88, 73–91. doi:10.1016/j.iref.2023.06.011
Wang, Y., Zhao, Z., Shi, M., Liu, J., and Tan, Z. (2024). Public environmental concern, government environmental regulation and urban carbon emission reduction—analyzing the regulating role of green finance and industrial agglomeration. Sci. Total Environ. 924, 171549. doi:10.1016/j.scitotenv.2024.171549
Wu, Z., Xu, X., and He, M. (2025). The impact of green finance on urban carbon emission efficiency: threshold effects based on the stages of the digital economy in China. Sustainability 17 (3), 854. doi:10.3390/su17030854
Xiao, M., and Peng, X. (2023). Decomposition of carbon emission influencing factors and research on emission reduction performance of energy consumption in China. Front. Environ. Sci. 10, 1096650. doi:10.3389/fenvs.2022.1096650
Yan, X., and Ge, J. (2017). The economy-carbon nexus in China: a multi-regional input-output analysis of the influence of sectoral and regional development. Energies 10 (1), 93. doi:10.3390/en10010093
Yi, M., Chen, D., Wu, T., Tao, M., Sheng, M. S., and Zhang, Y. (2024). Intelligence and carbon emissions: the impact of smart infrastructure on carbon emission intensity in cities of China. Sustain. Cities Soc. 112, 105602. doi:10.1016/j.scs.2024.105602
Yuan, Y., Qu, M., Li, Q., and Umer, M. (2024). Analysis of the non-equilibrium and evolutionary driving forces of carbon emissions in China's construction industry. J. Build. Eng. 97, 110834. doi:10.1016/j.jobe.2024.110834
Zhang, W., Liu, X., Wang, D., and Zhou, J. (2022b). Digital economy and carbon emission performance: evidence at China's city level. Energy Policy 165, 112927. doi:10.1016/j.enpol.2022.112927
Zhang, W., Zhu, Z., Liu, X., and Cheng, J. (2022a). Can green finance improve carbon emission efficiency? Environ. Sci. Pollut. Res. 29, 68976–68989. doi:10.1007/s11356-022-20670-8
Zhao, X., Benkraiem, R., Abedin, M. Z., and Zhou, S. (2024). The charm of green finance: can green finance reduce corporate carbon emissions? Energy Econ. 134, 107574. doi:10.1016/j.eneco.2024.107574
Keywords: green finance, digital economy, carbon emissions, coupling coordination, spatio-temporal pattern
Citation: Sui Y-Y and Zhang X-F (2025) Spatio-temporal evolution analysis of coupling coordination of green finance, digital economy, and carbon emission intensity in the Yangtze River Economic Belt. Front. Environ. Sci. 13:1606017. doi: 10.3389/fenvs.2025.1606017
Received: 04 April 2025; Accepted: 20 May 2025;
Published: 20 June 2025.
Edited by:
Otilia Manta, Romanian Academy, RomaniaReviewed by:
Kamal Gnanaweera, University of Sri Jayewardenepura, Sri LankaHiranya Dissanayake, Wayamba University of Sri Lanka, Sri Lanka
Jiayi Zhang, Tianjin University of Commerce, China
Copyright © 2025 Sui and Zhang. This is an open-access article distributed under the terms of the Creative Commons Attribution License (CC BY). The use, distribution or reproduction in other forums is permitted, provided the original author(s) and the copyright owner(s) are credited and that the original publication in this journal is cited, in accordance with accepted academic practice. No use, distribution or reproduction is permitted which does not comply with these terms.
*Correspondence: Xing-Fu Zhang, MTIwNjAyMUBhaGllYy5lZHUuY24=