 Xiaoping Zhang
 Lu Yu2
- 1College of Architecture and Urban Planning, Tongji University, Shanghai, China
- 2School of Architecture and Urban Planning, Shandong Jianzhu University, Jinan, China
- 3Zibo Urban Planning Design Institute Co., Ltd., Zibo, China
Focusing on the core issue of the multi-scale characteristics and driving mechanisms of spatial differentiation of rural settlements (RS) in the middle-lower Yellow River Basin (ML-YRB), this study aims to provide a scientific basis for the development and protection of regional RS. Using nearest neighbor analysis, kernel density estimation and spatial autocorrelation, the study systematically reveals the spatial distribution patterns and scale-dependent differences of RS in ML-YRB at city, county, and town scales. Furthermore, geographic detectors are employed to quantitatively evaluate the explanatory power of natural geographical and socio-economic factors for RS spatial differentiation. The results show that: (1) In ML-YRB, RS shows clear spatial clustering, concentrating in areas with gentle slopes, low altitudes, favorable thermal humid conditions, and high agricultural potential. (2) RS clustering varies across scales. The Moran’s I values are 0.79, 0.75, and 0.81 at city, county, and town scales. (3) Geographical environment, location conditions, and socio-economic factors together shape the spatial pattern of RS in ML-YRB. Specifically, lower and flatter terrain, soil more suited to farming, and proximity to rivers and lakes are linked to denser settlements. Also, areas near cities and roads show a clear RS agglomeration effect. (4) Key factors affecting the spatial distribution of RS have been quantitatively identified: soil type, population density, water proportion, topographic undulation, road network density, and distance from the central town. These findings offer a direct basis for creating tailored spatial policies for RS development in ML-YRB.
1 Introduction
Rural settlements (RS) refer to various forms of living space for rural residents (Song and Li, 2020). The spatial layout of RS is mainly affected by ecological, social and economic factors (Lin et al., 2023). Studies on the spatial characteristics and influencing factors of RS can reveal the mechanism of human activities and ecological formation, and is also conducive to optimizing and reorganizing the spatial layout of RS in the process of urbanization development (Li et al., 2022). In the Middle-Lower Yellow River Basin (ML-YRB), the ecological conditions are fragile, the resources are scarce, the social economy is relatively backward, the contradiction between social and economic development and natural resources is prominent, and the development of agriculture and rural areas is limited (Bi et al., 2022). The scattered distribution of RS in space intensifies the destruction of ecological environment and reduces the quality of human living environment (Li et al., 2021). The RS is an important research object of ecological protection and high-quality development in the ML-YRB, and the efficient development of the RS determines the level of ecological protection and high-quality development in the region (Jiang et al., 2021; Rao et al., 2023). Therefore, under the background of China’s rural revitalization strategy, exploring the spatial distribution and type characteristics of RS in ML-YRB is crucial. It provides a handle for solving rural problems, and provides theoretical and practical references for promoting the economic and social development of rural areas.
Rural Settlements (RS), a key carrier of the human land relationship, has become a research hotspot in geography and rural studies (Aria and Cuccurullo, 2017; Deng et al., 2021). The existing studies mainly focus on four aspects: the spatial distribution characteristics of RS (Guo et al., 2022; Kong et al., 2021), the driving mechanism, spatial optimization and reconstruction (Kohler et al., 2015), and population mobility and settlement evolution (Zou et al., 2023). These studies provide an important basis for understanding the universal laws of RS. Firstly, in terms of spatial distribution characteristics, international scholars have paid extensive attention to the spatio-temporal distribution differences of RS and their influencing factors. For example, Gorbenkova et al. analyzed the characteristics of the transformation of the RS system in Belarus and identified two modes of RS transformation: “development” and “degradation” (Gorbenkova and Shcherbina, 2020). Similarly, the research conducted by Ferchichi et al. in the agricultural regions of the Midwestern United States indicates that agricultural policies and market changes significantly affect the spatiotemporal distribution of RS (Ferchichi et al., 2022). In China, Luo et al.'s research on poverty-stricken mountainous areas pointed out that the allocation of cultivated land is a key factor affecting the spatial agglomeration of RS (Luo et al., 2020), while Yang et al. further confirmed the significant impact of economic development on the distribution of RS through multi-model analysis (Yang et al., 2015). These studies jointly emphasize the significant role of natural and human factors in shaping the spatial distribution of RS. Secondly, Scholars both domestically and internationally have explored the driving mechanisms of RS from ecological, economic, and social perspectives. On one hand, natural environmental conditions such as topography, climate and hydrological characteristics have been confirmed to have a fundamental influence on the spatial distribution of RS (Guo et al., 2022). On other hand, socio-economic factors, including population mobility, land use changes and policy intervention, have also played a key role in the evolution of RS. For example, Song et al. found that in Beijing’s Tongzhou District, the spatial pattern of RS exhibits clear phased and dynamic changes as urbanization advances (Song et al., 2020). International research has highlighted the impact of “rural gentrification” on RS differentiation and emphasized the importance of institutional analysis in understanding this phenomenon (Wang S. Q. et al., 2022). Thirdly, in terms of spatial optimization and reconstruction, scholars attempt to provide strategic suggestions for the sustainable development of RS through different methods and models. For example, Li et al. proposed spatial optimization schemes for RS under different tillage conditions based on iterative calculations of spatial competition and cooperation (Li H. Y. et al., 2024). Li et al. utilized a new RS transformation (RST) quantification method to reveal the transformation of the coupling relationship between RS and rural development during the urbanization process (Li and Song, 2020). Internationally, the “Rural Morphological Typology” project of the European Union (2016–2020) established a global RS classification system, providing a tool for cross-regional comparative studies (Ruslanjari et al., 2025). These studies not only enrich the theoretical framework of RS optimization, but also provide important references for spatial planning in practice (Thinh et al., 2024). Fourthly, the impact of population mobility on RS is also one of the focuses of research. Yu et al. pointed out that the problems of population outflow and expansion of residential land faced by rural China urgently need to be solved, and an appropriate development model needs to be selected according to local conditions (Yu et al., 2022). The research on the process of rural hollowing out by Liu et al. indicates that this phenomenon is jointly influenced by factors at the family and community levels (Liu et al., 2021). Similarly, in regions such as the Middle East and Latin America, rural hollowing out and its coping strategies have also received extensive attention (Tripathi, 2024). These studies highlight the core position of population mobility in the evolution of RS and provide a basis for formulating targeted policies.
The Yellow River, as the mother river of the Chinese nation, has nurtured Chinese civilization and is a hub for excellent traditional Chinese culture. Many well-preserved traditional villages are spread across this basin, drawing extensive scholarly research. Although significant progress has been made in the spatial differentiation and driving mechanism of RS in existing studies, the systematic research on ML-YRB still needs to be further carried out. Most existing studies focus on the Yellow River’s main stem, tributaries like the Fen and Huangshui Rivers, or specific provinces within the nine province Yellow River Basin (YRB). These studies often center on spatial distribution, influencing factors, village forms, and house types but are limited to single provinces or basins. For example, Gao et al. took 1,222 RS within the YRB as the research objects. They identified the RS by constructing a landscape gene identification index system to form a gene information database. On this basis, they standardized the identification results of data-type genes and completed K-modes clustering. Combined with the identification results of descriptive data, the regional range was further determined, and the traditional village zoning in the Yellow River Basin was completed (Gao et al., 2023). Wang et al. studied eight provincial areas in the YRB, using GIS, O-ring functions, and geographic detectors to analyze RS spatial distribution and identify influencing factors like natural resources and economic conditions (Wang et al., 2024). Jiang et al. investigated 550 RS in Shanxi Province with ArcGIS 10.2, combining quantitative and qualitative methods such as average nearest neighbor index, kernel density estimation, and buffer zone analysis to reveal the spatial and characteristics of these RS (Jiang et al., 2025). Feng analyzed 231 RS in Henan’s YRB, finding that RS spatial patterns show large central concentrations, smaller western concentrations, and eastern dispersion. In plain areas with dense road networks, RS are fewer, while in mountainous areas with sparse road networks, RS are more numerous and concentrated, clustering along the YRB at plain - mountain junctions (Feng et al., 2023). Wang has extensively studied northwest China’s cave dwellings, summarizing their types and characteristics in northern China (Wang et al., 2023).
In summary, RS research has made great progress in understanding distribution patterns, influence mechanisms, and optimization paths. Nevertheless, regarding RS research in the ML-YRB, further work is needed to carry out systematic analyses of multi-scale spatial differentiation characteristics. Additionally, the comprehensive driving mechanisms involving natural and human factors merits deeper exploration. Firstly, current RS studies in the YRB mainly focus on the mainstream, specific tributaries like the Fen and Huangshui Rivers, and individual provinces. The existing studies have not fully carried out the systematic analysis of ML-YRB as an organic whole. In particular, studies on the “water-soil-RS” coupling mechanism at the basin scale still needs to be further expanded and deepened. Therefore, in this study, the entire ML-YRB region is taken as the unified research object, and the data at the city, county and town levels are integrated to reveal the spatial pattern law of RS across administrative boundaries. Secondly, the current research still needs to be further expanded and deepened in terms of technology integration and method application. Internationally, technologies such as GIS, deep learning, and multi-agent simulation have been integrated. However, the research of Chinese scholars on ML-YRB mostly focuses on traditional spatial statistics and morphological description methods. The potential of in-depth mining and integrated application of high-resolution remote sensing data and multi-source geospatial big data has not been fully exploited. Also, the spatial expression of socio-economic factors and their interaction with natural geographical elements are often overlooked, weakening the explanation of the complex human-land relationship. This study quantitatively analyzes the influence of natural factors, social factors and economic factors on the spatial distribution of RS and the intensity of their interaction through the geographic detector model. Combining multi-dimensional spatial analysis methods such as spatial autocorrelation and kernel density estimation, it constructs a comprehensive “pattern-process-mechanism” framework. This framework integrates spatial pattern identification, driving mechanism quantification, and interaction effect detection, significantly enhancing research quantification, accuracy, and mechanism analysis depth. Thirdly, domestic research mostly focuses on the physical measurement of RS forms such as pattern, density, and shape, while neglecting the profound impact of social structure, economic capital, and institutional policies on RS spatial reconstruction. The application of cutting-edge theoretical perspectives like “institutionalism” and “political ecology” in RS research is clearly insufficient, limiting dialogue with international academic frontiers. Although international research leads in theoretical construction (e.g., “rural gentrification,” institutional framework) and technological application, it pays little attention to typical river basins in developing countries, especially regions with acute human-land contradictions and drastic transitions like the ML-YRB. This study attempts to incorporate institutional and policy considerations into the analysis, explore the spatial embedding effect of socio-economic transformation forces, provide a richer social science perspective for understanding RS spatial pattern evolution, and seek theoretical dialogue points with international rural geography research frontiers.
This study is dedicated to analyzing the multi-scale coupling mechanism of RS spatial differentiation in the ML-YRB. By applying advanced spatial analysis methods like geographic detectors and multi-scale spatial statistics, we’ve systematically characterized the multi-dimensional features of RS spatial differentiation. Our study quantitatively reveals how the complex interplay between the natural geographic foundation and economic and social activities drives the formation and evolution of RS spatial patterns at different scales. This work provides a robust scientific basis for enhancing the living environment in this ecologically fragile region and advancing the coordinated development of urban and rural areas. The core objectives are: (1) To systematically reveal the spatial distribution patterns and typological characteristics of RS using multi-scale (city, county, township) high-precision data. (2) To apply quantitative models, notably the geographic detector, to deeply integrate natural geographical elements with socio-economic spatial data. This will accurately quantify the main effects and interaction effects of various BEF on RS spatial distribution. (3) To propose RS spatial layout optimization strategies aligned with the dual goals of ecological protection and high-quality development. This study seeks to advance the integration of multi-source data and the application of advanced spatial analysis techniques, while expanding the analysis of socio-economic and institutional factors. Ultimately, it aims to provide new theoretical insights and practical solutions for understanding human-land relationships in the ML-YRB and guiding RS spatial governance under the rural revitalization strategy. The study is structured as follows. The first section emphasizes the significance of studying RS in ML-YRB and elaborates on the knowledge gaps in previous studies and literature. The second section elaborates in detail on the study area, data sources and methodology. The third section presents the spatial distribution characteristics, aggregation patterns, and quantitative analysis results of multi-scale RS in the ML-YRB. The fourth section delves deeply into the core findings, explains the driving mechanism, and puts forward suggestions for space optimization; The last section summarizes the main conclusions.
2 Data and methods
2.1 Study area
According to the “Comprehensive Plan for the Yellow River Basin (2012–2030)” approved by The State Council of China, the Yellow River originates from the Yuguzonglie Basin at an altitude of 4,500 m in the northern foot of the Bayan Har Mountains on the Qinghai-Tibet Plateau. It flows through nine provinces including Qinghai, Sichuan, Gansu, Ningxia, Inner Mongolia, Shanxi, Shaanxi, Henan and Shandong, with a drainage area of 795,000 km2. Among them, the area above Hekou Town is the upper reaches of the Yellow River, with a drainage area of 428,000 km2. The area from Hekou Town to Taohuayu in Zhengzhou, Henan Province is the middle reaches of the Yellow River, with a drainage area of 344,000 km2. The area below Taohuayu to the estuary is the lower reaches of the Yellow River, with a drainage area of 23,000 km2 (Feng et al., 2025). Statistics show that the study area of MD-YRB includes Kaifeng, Luoyang, Sanmenxia, Xinxiang, Zhengzhou, Puyang, Jiaozuo, Jiyuan, Binzhou, Dezhou, Dongying, Heze, Jinan, Jining, Liaocheng, Taian, Zibo, Linfen, Changliang, Xinzhou, Yuncheng, Weinan, Yan’an, and Yulin, with a total of 85,347 RS (Figure 1).
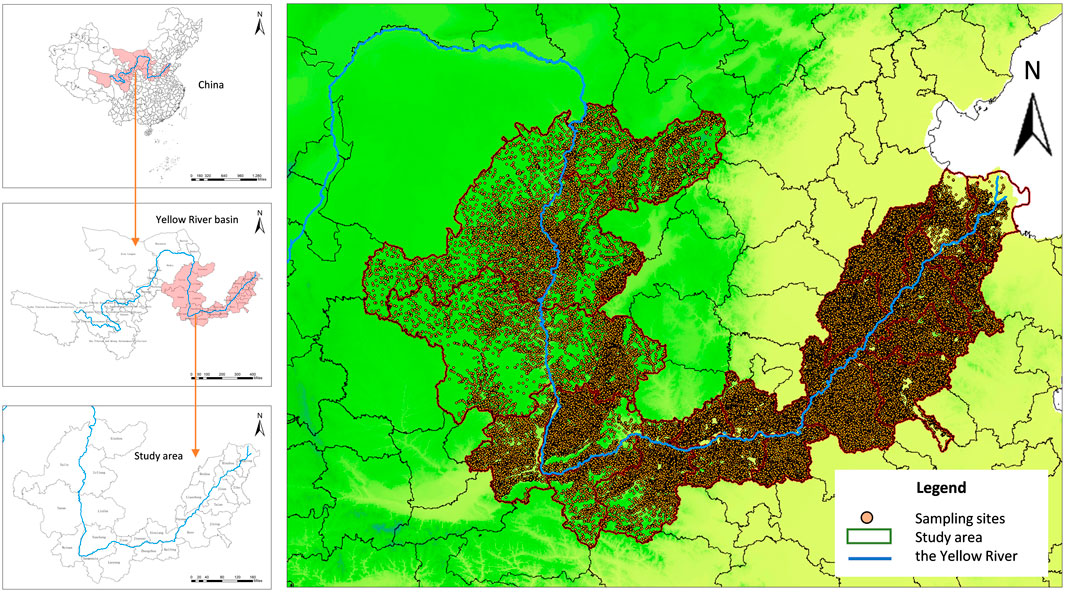
Figure 1. Overview of study area.
The spatial distribution of RS in the ML-YRB is emblematic of geographical environment, socio-economy and cultural history. Firstly, the ML-YRB span China’s second and third ladders, featuring diverse landforms, including mountains, plateaus, basins and plains. This geographical milieu provides rich and diverse spatial conditions for the formation and evolution of RS. Secondly, the ML-YRB is a crucial agricultural production region and economic area in China, with a substantial population and dense RS. Studying the spatial distribution of RS in this region can profoundly comprehend the correlation between RS and socio-economic development. Thirdly, the ML-YRB is one of the cradles of ancient Chinese civilization, possessing rich historical and cultural heritage. Finally, compared with the upper reaches, the ML-YRB are confronted with more severe environmental problems such as water shortage, soil erosion, and unreasonable industrial structure. Therefore, the study is conducive to strengthening the collaborative cooperation among regions and forming a unified and coordinated governance mechanism.
2.2 Data source
The data utilized in the study primarily encompasses two categories: geospatial data and socio-economic data within the study area for 2023 (Table 1).
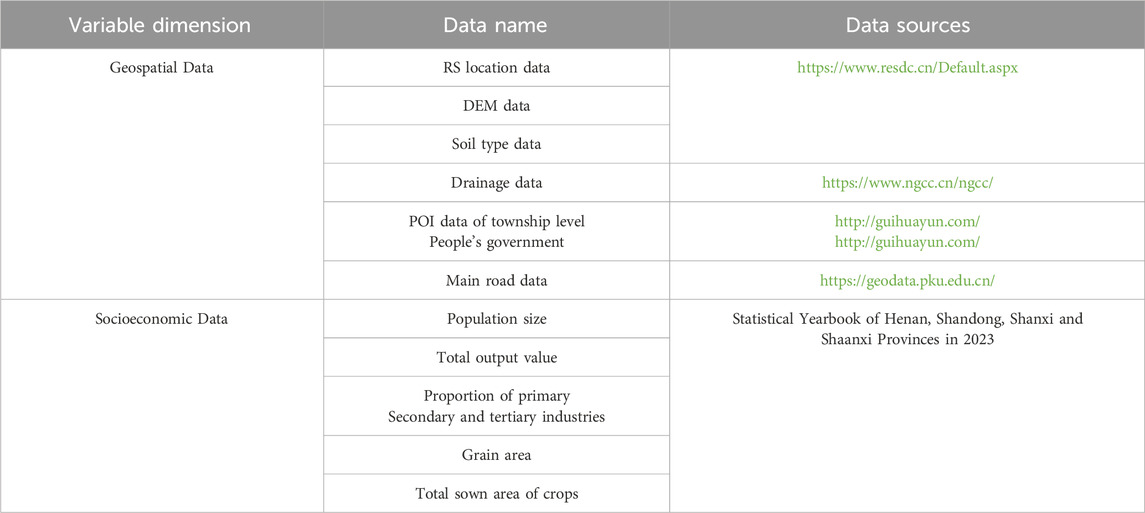
Table 1. Research data sources.
2.3 Study methods
This study aims to systematically reveal the spatial distribution pattern and formation mechanism of RS in ML-YRB. To achieve this goal, we comprehensively utilized methods such as kernel density estimation, spatial autocorrelation analysis, hotspot analysis, nearest neighbor analysis, and geographical detectors. The specific process is shown in Figure 2. The selection of these methods is based on their core functions and their relevance to addressing the study’s key questions. Firstly, RS are point-like geographical elements. Kernel density estimation visualizes their spatial - distribution density and core agglomeration areas by calculating local village density to generate a continuous density surface. This identifies high density zones and low-density areas, revealing regional spatial heterogeneity. Secondly, Spatial autocorrelation analysis measures the overall spatial correlation of RS distribution. Local Moran’s I further reveals local spatial patterns like high-high and low-low clusters, as well as high-low and low-high anomalies, identifying specific locations of these patterns. Thirdly, compared to local spatial autocorrelation, hotspot analysis using the Getis-Ord Gi* statistic accurately identifies statistically significant spatial hotspots and cold spots. It demarcates the core areas of these clusters, verifying the spatial autocorrelation analysis results and detailing the local spatial structure of RS distribution. Fourth, the nearest neighbor analysis is good at quantitatively determining the overall spatial distribution pattern of point elements. It calculates the ratio (R value) of the actual average nearest neighbor distance between villages to the expected distance of a theoretical random distribution, along with its statistical significance. Finally, to profoundly explain the formation mechanism of the RS spatial pattern and quantify the influence of natural and socio-economic factors, this study employs geographic detectors. Unlike geographically weighted regression (GWR), which mandates that all explanatory variables share the same spatial bandwidth, or multiscale geographically weighted regression (MGWR), which primarily captures linear relationships and lacks interaction analysis, geographic detectors offer distinct advantages. They naturally accommodate categorical variables and do not rely on linear assumptions, enabling the capture of nonlinear interactions, such as threshold effects. Additionally, geographic detectors feature key modules like the factor detector (q-statistic) and interaction detector. The factor detector quantifies each factor’s explanatory power regarding RS spatial distribution differences, pinpointing primary influencing factors. The interaction detector reveals whether the explanatory power of different factors on RS distribution is enhanced, diminished, or remains independent after pairwise interactions. This facilitates a comprehensive understanding of how natural (topography, hydrology), economic (industrial structure, transportation), and social (population density, policy) factors jointly shape the multi-scale spatial distribution of RS in the ML-YRB.
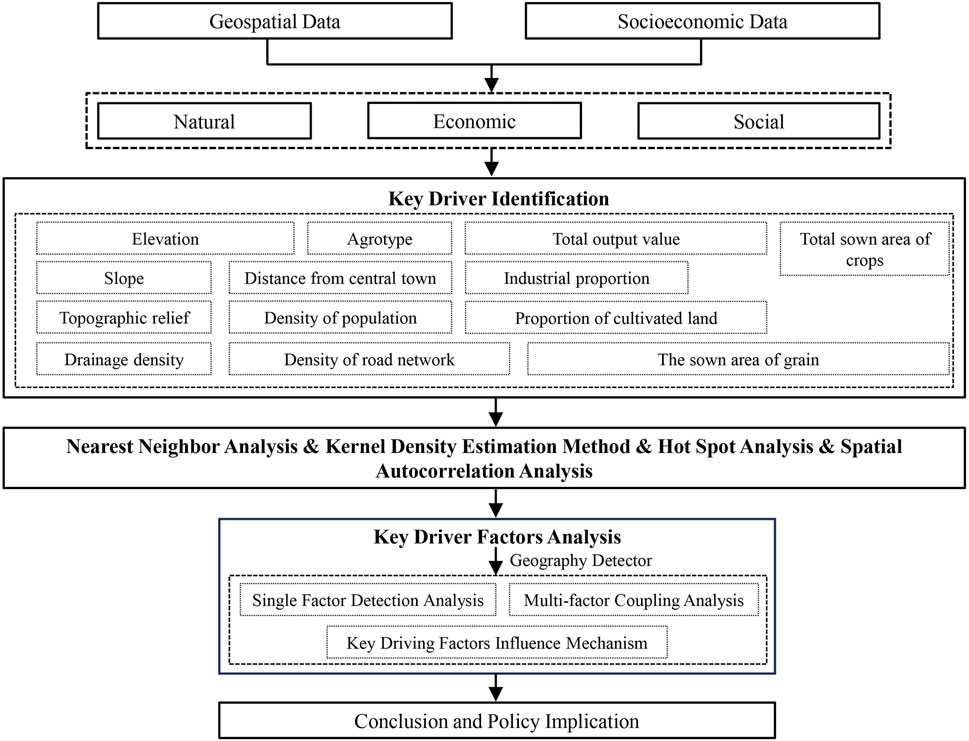
Figure 2. Flowchart of the study.
Furthermore, by comparing the results of the above research methods with the actual data and the results of existing research, it can be used as a test of the effectiveness of the research methods. For example, when analyzing the distribution density of RS, the kernel density estimation results can be compared with the census data. If the kernel density estimation can reasonably reflect the distribution of densely and sparsely populated areas, it indicates that it has high validity. The reliability of the analysis results can also be verified by comparing the nuclear density analysis results with the existing research results. If the result of the kernel density estimation is consistent with the existing spatial distribution theory or the widely recognized research results, it indicates that it has high validity. For reliability testing in kernel density estimation, selecting the right bandwidth is key. A bandwidth that’s too small can cause overfitting, while one that’s too large can lead to underfitting. Cross-validation is a good way to find the optimal bandwidth. In this study, the dataset was randomly divided into K equally sized subsets. Density was estimated using K-1 subsets, with the remaining subset used for prediction and evaluation. By comparing predictions from different bandwidths, the optimal bandwidth was chosen to enhance kernel density estimation reliability. Research suggests a 500 m–5,000 m bandwidth for urban scale analysis and a 50 km–100 km bandwidth for basin scale analysis. Through comparison, this study determines that the bandwidth of nuclear density estimation is 60 km.
2.3.1 Kernel density estimation method
The kernel density estimation method assumes that geographical events can occur anywhere in space, but the probability of occurrence varies at different locations. The probability of events occurring in regions with dense points is high, and the probability of events occurring in regions with sparse points is low (Li et al., 2023). The formula is (Equation 1):
where
2.3.2 Spatial autocorrelation analysis
Spatial autocorrelation analysis is a spatial statistical method that reflects the correlation degree of natural or social elements in space and reveals their spatial distribution law through spatial autocorrelation index (Carlucci et al., 2020). The formula is (Equation 2):
where
2.3.3 Hot spot analysis
Getis-Ord Gi index method is also known as hot spot analysis. The principle is to analyze the spatial distribution of the research data through the comparison of Z-score and P-value in statistics, and obtain the cold spots and hot spots. The cold spot is the low value cluster, while the hot spot is the high value cluster (Rao et al., 2023). The formula is (Equation 3):
where
2.3.4 Nearest neighbor analysis
Nearest neighbor analysis evaluates the spatial distribution pattern of points by comparing the distribution of points in real space with the pattern of assumed random distribution (Zhang and Zhang, 2022). Through the nearest neighbor analysis, we can judge whether RS are randomly distributed, clustered or dispersed, which helps to understand the formation mechanism and development law of RS (Huo et al., 2023). When the point elements in the study area are distributed with the model, the nearest proximity can be expressed as (Equation 4):
where
Therefore, the closest proximity distance of the uniform distribution is the largest, followed by the random distribution, and the agglomeration distribution is the smallest. The nearest point index R is the ratio of the actual nearest distance r1 to the theoretical nearest distance
when R = 1,
2.3.5 Geography detector
Geographic detector is a statistical method to detect the explanatory power of environmental factors to spatial heterogeneity variables. Based on traditional statistics, spatial differentiation of detection factors is added to measure this explanatory power, which has clear physical implications (Tan et al., 2021). The formula is (Equation 6):
where the range of
3 Results
3.1 Spatial distribution of RS
To determine the main areas of RS aggregation, the kernel density estimation method was used to calculate the spatial distribution density of RS (Figure 3). On the watershed scale, RS in the ML-YRB predominantly exhibit agglomeration, which aligns with the flow trajectory of the Yellow River. Notably, the area of the lower reaches of the Yellow River is extensive, and the RS density of the basin diminishes progressively from three steps to two steps due to the cumulative impact of the number of RS. The number of traditional RS in the Loess Plateau in the middle reaches of the Yellow River is particularly concentrated, with high density, particularly in the south of Shanxi, the north of Shanxi and the central and southern regions of Inner Mongolia.
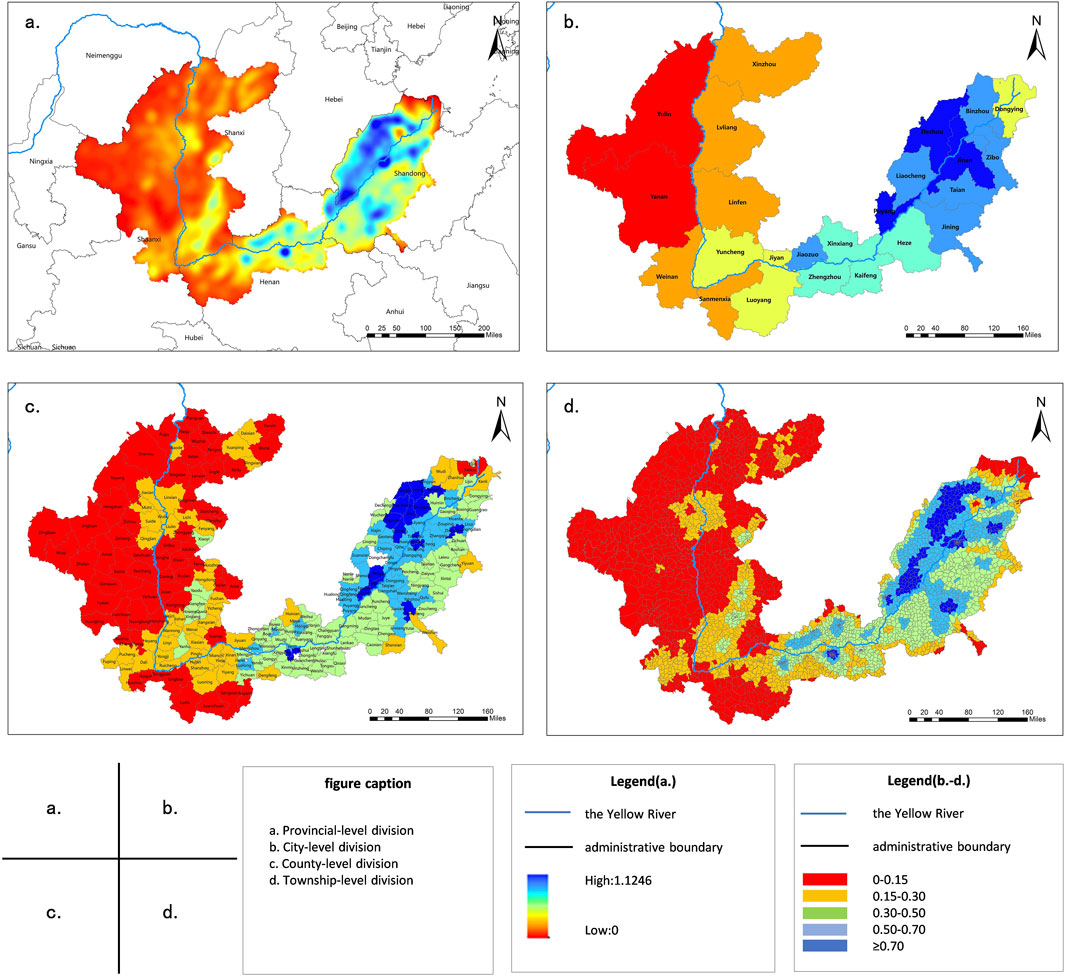
Figure 3. Nuclear density map of RS. (a) Provincial-level division. (b) City-level division. (c) County-level division. (d) Township-level division.
On the provincial scale, the RS density of Shandong Province is the highest (1.12/km2), followed by Henan Province, Shanxi Province and Shaanxi Province at 1.00/km2, 0.49/km2 and 0.34/km2 respectively. This is attributed to Shandong Province’s location in China’s eastern coastal zone, featuring a unique geographical position and natural environment. The province boasts a flat terrain, expansive plain area, numerous rivers and advanced water system, which fosters favourable conditions for agricultural production. Owing to historical factors and the influence of natural conditions, a significant number of natural RS and administrative RS have emerged in the rural areas of Shandong Province. These RS are relatively compact yet densely distributed, reflecting the population distribution and economic development attributes of the rural areas of Shandong Province to a certain extent.
On the city scale, the RS density in Dezhou is the highest (0.69/km2), followed by Liaocheng (0.66/km2), Puyang (0.60/km2), Jinan (0.57/km2), Jining (0.50/km2) and Jiaozuo (0.45/km2). Most of these cities are situated in the ML-YRB, with flat terrain, fertile soil and conducive to agricultural cultivation. This robust agricultural foundation enables these areas to accommodate more rural populace. For instance, Puyang is positioned on the bank of the Yellow River in the northeast of Henan Province. The Yellow River traverses the county for 61 km and the beach area is extensive. Such geographical circumstances provide a natural foundation for the dense distribution of RS. Concurrently, Puyang is located at the intersection of the Central Plains Economic Zone and Bohai Economic Circle, serving as the conduit and bridgehead of the Central Plains Economic Zone.
On the county scale, the number of medium density counties and districts is substantial, while the number of high- and low-density counties and districts is minimal. The RS density of Lixia District (0.95/km2), Tianqiao District (0.92/km2) and Shizhong District (0.82/km2) is the highest. The rationale is that these four districts collectively constitute the central urban area of Jinan, which possesses a high level of economic development and exerts a potent radiation and driving effect on the surrounding rural areas, stimulating the development of the rural areas and attracting more population and RS. Moreover, the RS nuclear density of thirty-nine county units in the study area is lower than 0.10/km2, accounting for 16.25%, among which the RS density of Wuqi County (0.02/km2), Dingbian County (0.02/km2), Huanglong County (0.03/km2) and Zhidan County (0.03/km2) is the lowest. Most of these counties are located in the Loess Plateau, renowned for its intricate topography, gullies and diverse landforms. Additionally, due to the arid and semi-arid climatic zones, the region experiences scant precipitation and relatively limited water resources, which further constrains the development of agriculture and concentration of population. Compared with other areas in the ML-YRB, these counties possess a relatively inferior economic development level, monolithic industrial structure, primarily reliant on agriculture and lack of diversified industrial support, leading to a relatively underdeveloped rural economy. Consequently, subject to the dual influence of the natural environment and socio-economic circumstances, the RS within these counties exhibit general characteristics of miniature scale, minimal population density, and vast distances between RS, which portends challenges in cultivating a high density of RS distribution.
3.2 Spatial agglomeration characteristics of RS
Despite the discernible regularity in the placement of RS within the YRB, it remains to be further elucidated whether they exhibit clustered spatial arrangement and whether there exists correlation among cities, counties, and towns and RS. In this study, the GeoDa software and univariate Moran’s I index were employed to conduct comprehensive spatial autocorrelation analysis of RS density in the three administrative units of city, county, and township, respectively. Subsequently, ArcGIS software was utilized to examine the nearest neighbour and hot spot of RS in the ML-YRB. Figure 4 illustrates the Moran scatter plot of RS core density values at the city, county, and township scales. The first quadrant (H-H) and the third quadrant (L-L) signify that RS core density values exhibit a positive correlation, whereas the second quadrant (L-H) and the fourth quadrant (H-L) suggest that RS core density values exhibit a negative correlation (Table 2). The Moran’ I of RS core density in the three administrative units of city, county, and township was 0.79, 0.75, and 0.81, respectively. By comparing the Z- scores (multiple of the standard deviation) and p-value (probability) of each unit output by the global Moran’s I and the local LISA, the Z-scores were all greater than 1.96, the p-values were less than 0.01, and both passed the Monte Carlo simulation (999 permutations). Furthermore, by applying different spatial weight matrices to the data set for spatial autocorrelation analysis and observing the changes of Moran’s I index, it was found that the values fluctuated within a reasonable range and the trend was consistent, indicating that the reliability of the method was relatively high. Quantitatively, the majority of scattered points were predominantly distributed in the first and third quadrants, with fewer located in the second and fourth quadrants. In essence, the distribution of RS in the ML-YRB exhibited a tendency towards spatially-positive correlation between high-value clusters and low-value clusters on distinct spatial scales (Figure 5).
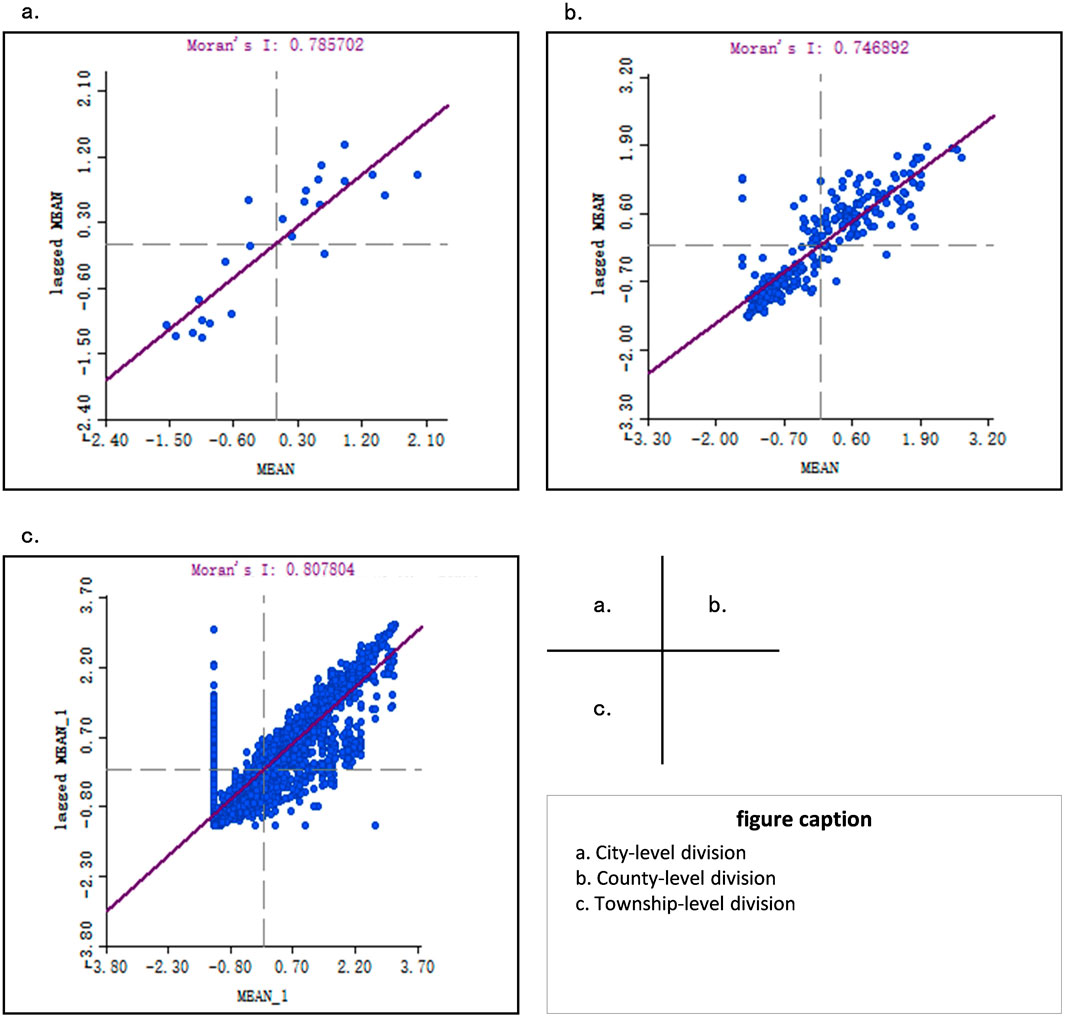
Figure 4. Moran exponential scatter plots of regional kernel density values. (a) City-level division. (b) County-level division. (c) Township-level division.
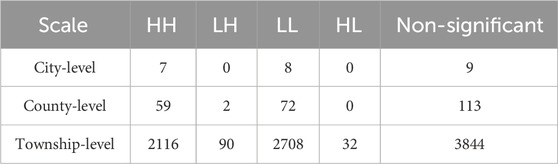
Table 2. Distribution of cluster cities in different spatial scales.
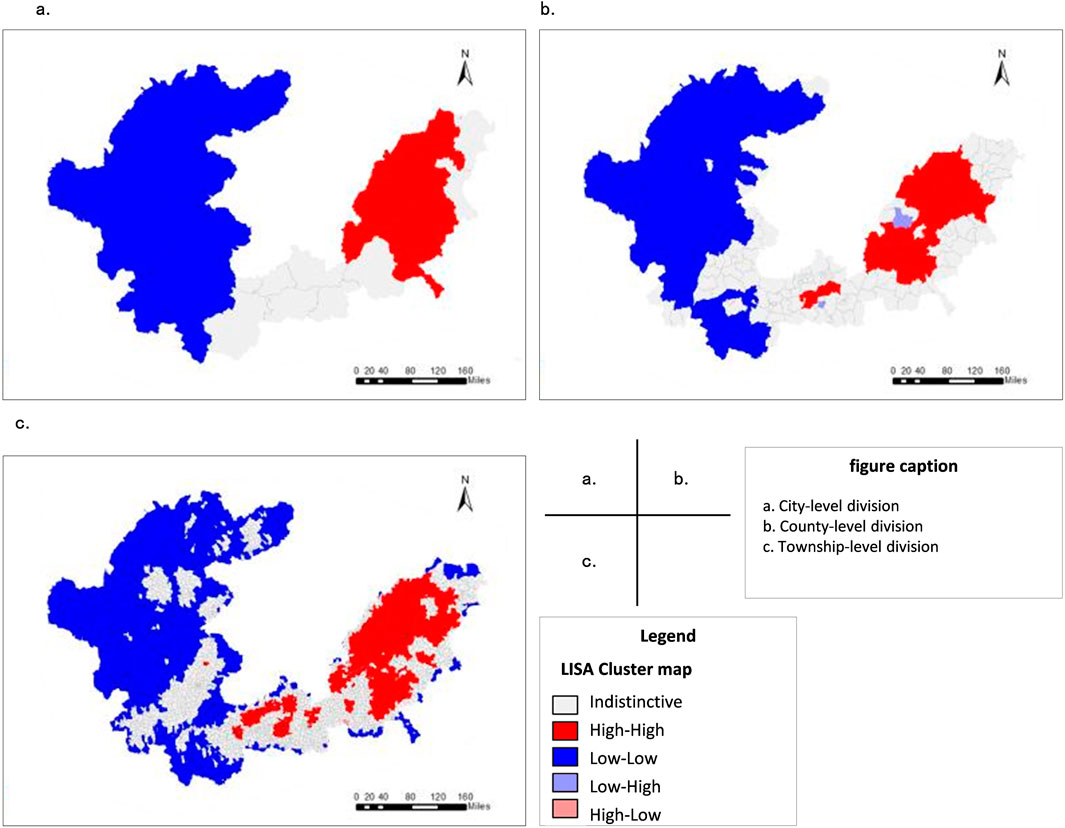
Figure 5. LISA polygraph for studying regional kernel density values. (a) City-level division. (b) County-level division. (c) Township-level division.
The hot spot analysis indicates that the thermal variations in RS density within the ML-YRB manifest significant spatial clustering, demonstrating the attributes of a “one hot and one cold” phenomenon (Figure 6). The thermal zones are concentrated in the sub-humid zone, situated at the convergence of western Shandong Province and Henan Province, whereas the cold zones are located in the arid and semi-arid region, positioned at the junction of Henan Province and Shanxi Province. Generally, regional topography, socio-economic status, climatic conditions, and transportation infrastructure are the factors contributing to the emergence of RS density thermal hot spots (Tan et al., 2021).
Figure 6. Spatial distribution of hot and cold areas in the study area. (a) City-level division. (b) County-level division. (c) Township-level division.
The RS can be regarded as point-like elements, and their geographical locations can be represented by coordinate points. Point elements usually have three spatial distribution types: random, uniform and condensed. In order to identify the spatial distribution type of RS, the geographic coordinates of RS in the study area were introduced into the Arc GIS 10.6 software platform, and the nearest neighbor point index of RS in the study area was calculated using the nearest neighbor analysis (Table 3). The R value was less than 1, the critical value z was less than −2.58, and the significance level p < 0.01. It shows that there is only 1% or less probability that the clustering model is the result of random process, indicating that the spatial distribution of RS in the study area has a significant agglomeration level.

Table 3. The average nearest neighbor index of RS.
3.3 Analysis of influencing factors
The concept of RS represents the interrelationship and evolution of the two subsystems of “human” and “land” in the regional ecosystem of human-land interaction within a single area. The emergence and distribution of RS are comprehensively influenced by natural, social and economic variables. Considering the particularity of the RS spatial natural terrain and social regional environment in the ML-YRB, and referring to the relevant literature on the influencing factors of the rural spatial distribution in the ML-YRB (Liu et al., 2023; Shi and Wang, 2021; Zhang et al., 2024), the index factors were selected from three dimensions of natural conditions, social progress and economic status to explore the formation mechanism of the RS spatial distribution pattern in the ML-YRB.
When selecting influencing factors, Geodetectors have an advantage as they do not require linear assumptions. Multicollinearity among factors does not directly affect the q-value calculation of Geodetectors, which is based on variance decomposition rather than regression models. However, highly correlated factors can dilute each other’s explanatory power and distort the analysis of driving mechanisms. To address this, the study calculates the Pearson correlation coefficients of the selected factors to obtain a correlation coefficient matrix. This helps determine the linear correlations among factors. If the absolute values of correlation coefficients between some factors are close to or exceed 0.8, it suggests strong collinearity (Figure 7). In such cases, the factor with the most direct driving force is retained to ensure independence. For example, the correlation coefficient between slope aspect and slope direction is 0.82. Based on relevant research, the more influential slope aspect is retained, and slope direction is excluded. After eliminating some factors, the correlation coefficient matrix of the remaining factors is recalculated. This ensures that the collinearity among the remaining factors is within an acceptable range. It is also crucial to verify whether the remaining factors still comprehensively cover the main aspects affecting village spatial distribution. This guarantees the integrity and scientific nature of the research. In summary, the factor analysis shows that the selected factors effectively capture the core characteristics of natural conditions, social progress, and economic status in the ML-YRB. An example of this is the incorporation of soil types to highlight the region’s unique “soil-and water-disaster” features. Through these steps, we have identified 13 representative and independent factors, including: Elevation (X1), Slope (X2), Topographic relief (X3), Drainage density (X4), Density of road network (X5), Agrotype (X6), Density of population (X7), Distance from central town (X8), Total output value (X9), Industrial proportion (X10), Proportion of cultivated land (X11), The sown area of grain (X12), Total sown area of crops (X13).
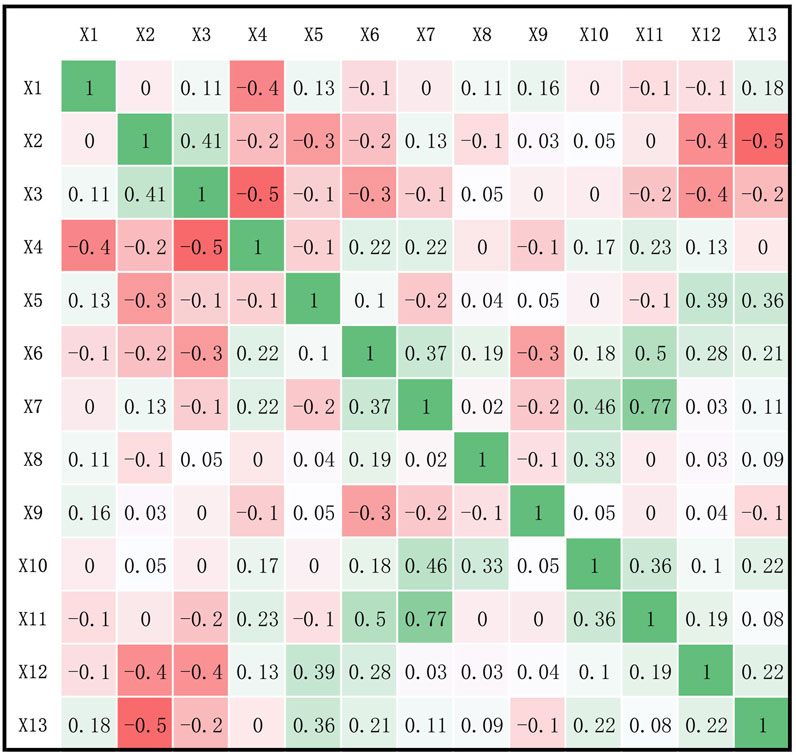
Figure 7. Pearson correlation analysis of the impact factor.
3.3.1 Single factor detection analysis
The findings of the geography detector reveal that the 13 independent variables surpass the significance threshold of 1%. In essence, these 13 variables are substantial contributors impacting the spatial distribution of RS in the ML-YRB, signifying that the spatial distribution of RS in the ML-YRB is influenced by innate, societal, and economic factors (Table 4). According to the apex of impact factor, it can be classified into primary impact factor and secondary impact factor. The primary influencing factors encompass soil type (X6), population density (X7), cultivated land area proportion (X11) and river network density (x4), with q values of 0.3807, 0.2816, 0.2454 and 0.1902 respectively. The secondary influencing factors encompass slope (X2), distance from central town (X8), yield ratio of one to two to three (X10) and total sown area of crops.
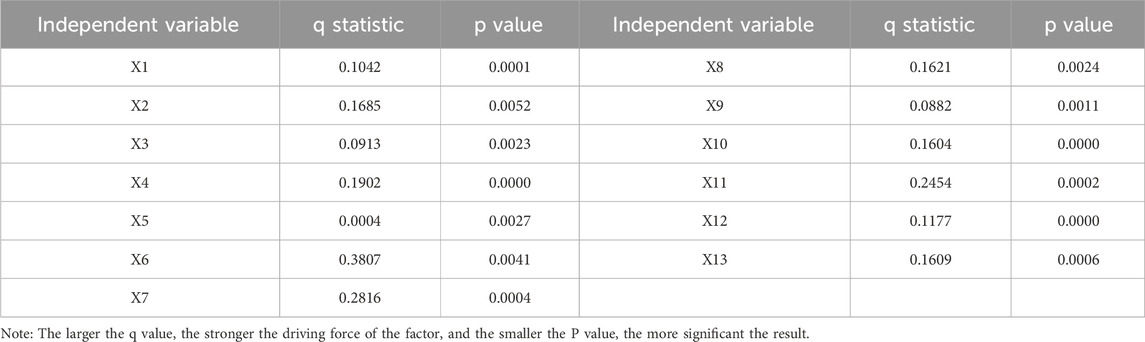
Table 4. Result of spatial distribution factors of RS.
Among these thirteen independent variables, the largest factor is soil type (0.3807), which is because the site selection of most RS in the early stage is centred on cultivated land, which is the lifeblood of production.
3.3.2 Multi-factor coupling analysis
In this study, the interplay between diverse determinants within the spatial distribution of RS in the ML-YRB is discerned utilizing the interactive detection technique in the geography detector (Table 5). The outcomes illustrate that each significant determinant possesses a synergistic enhancement effect. The impact of some determinants post interaction is superior to that of each determinant independently, which is delineated as a two-factor enhancement effect. Post partial interaction, the influence surpasses the sum of the two determinants, which is nonlinear enhancement effect. It can be observed that the influence of any two independent variables post interaction is more potent than the original independent factors, indicating that the spatial distribution of RS in the ML-YRB is indeed the consequence of the collective influence of numerous determinants. As the socio-economic conditions that influence the spatial distribution of RS, the examination of regional demographics, regional economy, and transportation network play a certain role in fostering and catalysing the RS, which is the intrinsic motivation for the evolution of settlement scale and spatial pattern.
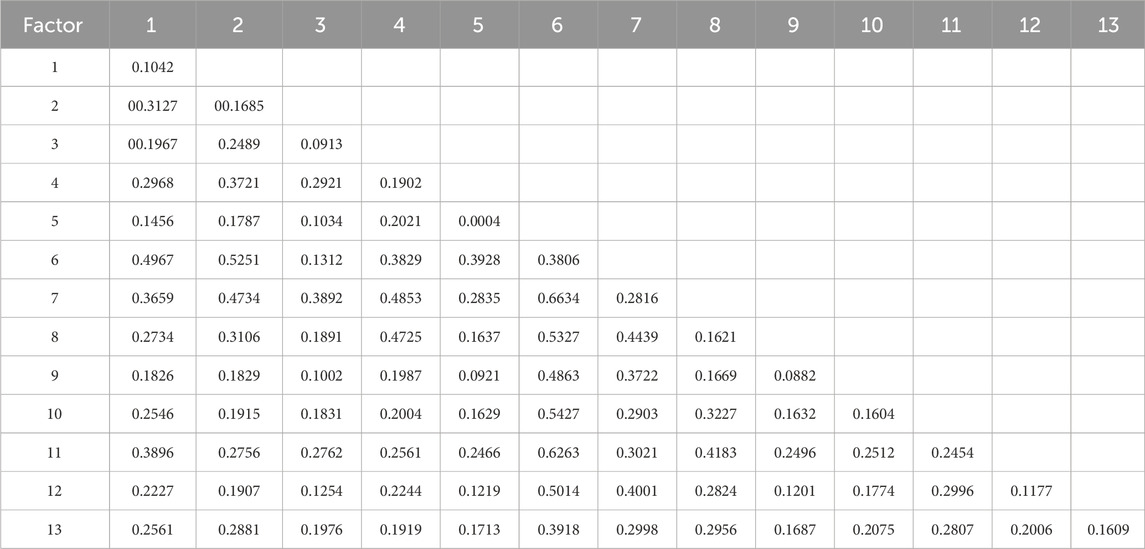
Table 5. Score of spatial distribution interaction factors of RS.
From the value of q, the interrelationship between soil type and population density is most significant (q = 0.6634), subsequently soil type and cultivated land area proportion (q = 0.6263), soil type and distance from central town (q = 0.5327) and terrain relief degree and soil type (q = 0.392), highlighting the integral role that the combination of soil type, population density and distance from central town plays in influencing the spatial distribution of RS in the ML-YRB. The terrain undulation degree does not exert a substantial interpretive effect on the spatial distribution of RS, but it can interact synergistically with soil type and population density. As evident from the nuclear density analysis chart, the RS in the research area is situated in a plain with flat terrain, favourable agricultural conditions and a long history of development (Liu et al., 2023). The influence of the river network density on the spatial distribution of RS in the ML-YRB possesses a certain explanatory power (q = 0.1902). The interactive detection reveals that the river network density and the distance factor from the central town exhibit a nonlinear augmented explanatory power (q = 0.4725) (Wang J. Y. et al., 2022). The distance factor from the central town possesses a certain explanatory power (q = 0.1621) to the spatial distribution of RS, and its interaction with most variables displays a nonlinear enhancement effect, while the interaction with population density exhibits a robust two-factor enhancement effect (q = 0.4439), indicating a more concentrated RS distribution in areas with high population density and proximity to the central town (Zhang and Wang, 2023). Thus, it can be concluded that 13 driving factors are all crucial factors that influence the distribution of RS, but these factors are more intimately linked to the spatial distribution of RS after integrating the soil type, population density and distance from the central town, further demonstrating that the spatial distribution disparity of RS in the ML-YRB fundamentally differs from the production conditions, yet the number of RS in different cities still hinges on their social and economic conditions.
4 Discussions
4.1 Influence mechanisms
The spatial dependence of the nine factors most relevant to the spatial distribution of RS was analysed in ArcGIS (Figure 8), and the influence mechanisms were further explored.
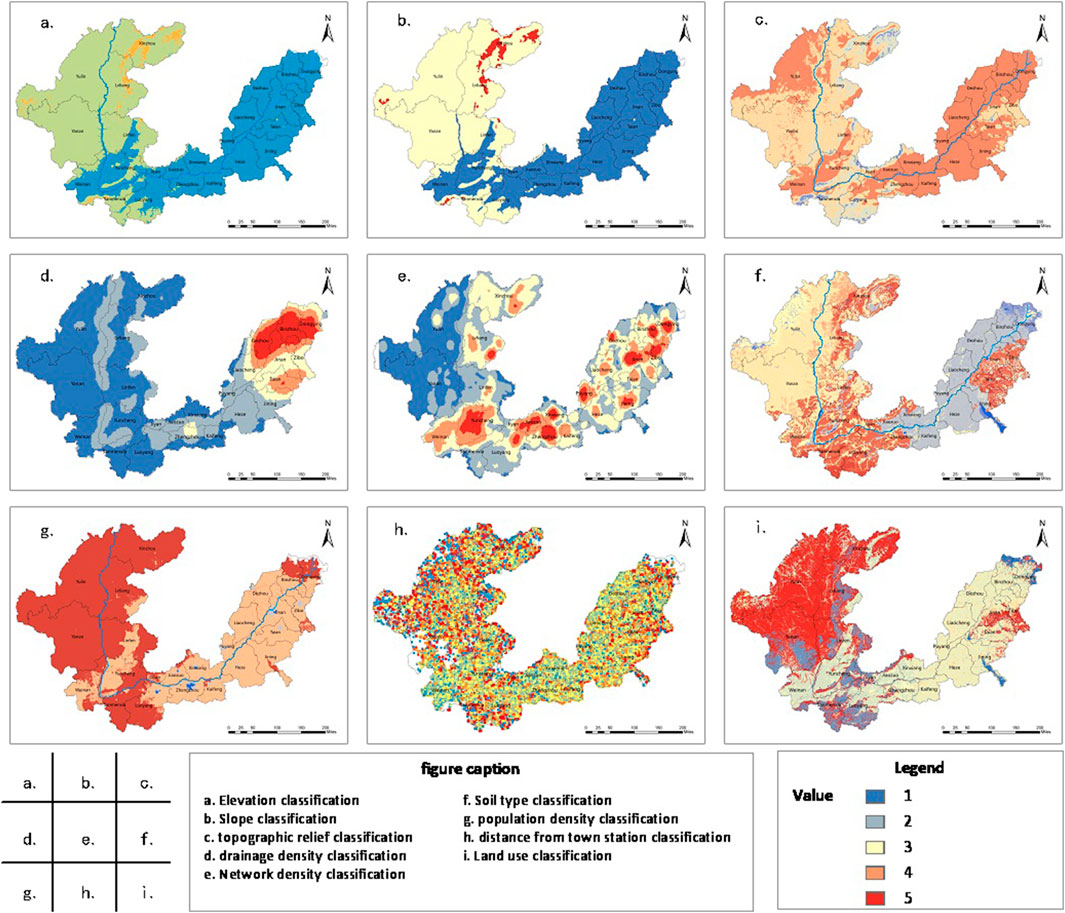
Figure 8. Variable spatial distribution. (a) Elevation classification. (b) Slope classification. (c) Topographic relief classification. (d) Drainage density classification. (e) Network density classification. (f) Soil type classification. (g) Population density classification. (h) Distance from town station classification. (i) Land use classification.
4.1.1 Natural factors
4.1.1.1 Topography and landform
Topography and landforms, as long-term and stable base elements, profoundly shape the RS spatial pattern. Previous studies generally support the “vertical habitable zone” theory, and point out that gentle slopes (such as 0°–2° in the Yangtze River Basin) are usually more conducive to RS aggregation (Shen et al., 2025). This study precisely quantified on the ML-YRB scale and revealed that an altitude of 1 km is a significant inflection point for RS density (Figure 8b), which is significantly lower than the 1.5 km threshold commonly found in other regions. This study innovatively attributes this phenomenon to the coupling effect of the unique warm temperate semi-arid climate of the ML-YRB. The region’s extended frost period and sudden drop in agricultural suitability, combined with the limitations of mountainous terrain, together explain the particularity of the lower limit of the “vertical habitable zone” here (Qian et al., 2025). This offers new evidence for comprehending the human - land relationship in climate change sensitive areas. It challenges the traditional perception of the optimal livable slope zone. This study found that the peak of RS density occurred in the specific slope range of 6°–12° (rather than the generally believed <2° gentle slope area), and this phenomenon was quantified on the ML-YRB regional scale. And it is linked to the unique agricultural model of the ML-YRB. This slope can not only effectively avoid the risk of salinization in low-slope land, but also provide better farming safety and stability than steep slopes, thus forming the unique “marginal optimal farming and settlement zone” of ML-YRB (Bi et al., 2024). This discovery significantly challenges the traditional perception that “gentle slopes are more livable” (such as in the case of the Yangtze River Basin), and provides crucial regional empirical evidence for the scientific assessment and optimization of the human settlement environment on the ML-YRB. Furthermore, the research results (RS sharply decreases at slopes above 25°) strongly support the ecological theoretical basis of the “25° farmland return red line”, providing a solid spatial empirical support for regional ecological protection policies.
4.1.1.2 Hydrologic conditions
At present, the theory of “alluvial plain advantage” is widely accepted, which holds that areas near water (especially the main streams of major rivers) are conducive to the development of RS. Studies in the Yangtze River Basin and others show a high density of RS in the main stream area (Cai et al., 2025). This study clearly reveals and quantifies the significant alienation phenomenon of RS distribution around the main stream of the Yellow River on the large regional scale of ML-YRB, revealing the complex pattern of “disaster-avoiding alienation from the main stream” and “pro-tributary”. It was found that within a radius of 1 km of the water system buffer zone, there were 772 RS, accounting for 0.9% of the total number of the study area. There were 5,361 locations within a radius of 5 km (6.3%) and 11,435 locations within a radius of 10 km (13.4%). Cantered on a 20 km radius, it reached 22,611 households (26.5%), and centered on a 50 km radius, it reached 49,744 households (58.3%). It can be seen that the proportion of RS in the 1 km buffer zone is extremely low (only 0.9%), which is much lower than 15.2% in similar areas of the Yangtze River Basin (Omirou et al., 2023). This is innovatively interpreted as an active spatial avoidance strategy for the historical and frequent flood risks of the Yellow River, which is a prominent manifestation of the disaster adaptation mechanism in the human-land interaction of ML-YRB. Meanwhile, 26.5% of RS is located within the 20-km buffer zone of the main stream, which reflects the spatial response of residents to the historical maximum flood range (Chabib et al., 2025).
The dominant model of “pro-tributary”. The study further reveals and explains that the RS distribution shows a strong “pro-tributary” characteristic (tertiary rivers > secondary rivers > buffer zone density of primary rivers). This is innovatively attributed to the frequent changes in the river course of the lower reaches of the Yellow River, which leads to poor land stability along the main stream. In contrast, the tributaries flow slowly, have fewer disasters and are more suitable for the development of irrigation agriculture, thus becoming more reliable distribution points. This finding enhances our understanding of the complex hydrophilic patterns of RS in major river delta regions. It highlights the crucial role of tributaries in sustaining the RS system of the ML-YRB, which contrasts sharply with the “disaster-avoidance” pattern observed in the main stream. Moreover, the study delivers a comprehensive quantitative map of RS density across buffer zones of different level water systems throughout the ML-YRB region (Gebru et al., 2025). This offers valuable regional benchmark data for comprehending the water settlement relationship.
4.1.2 Social factors
4.1.2.1 Population density
Population density is the core driving force of RS distribution. It is generally believed that high density leads to compact layout, while low density leads to dispersed layout (Zhang and Wang, 2023; Liu et al., 2022). This study has innovatively identified and explained three heterogeneous relationship patterns between population density and the spatial distribution of RS, transcending the linear relationship and revealing the spatial heterogeneity pattern: (1) RS is dense in low-density areas (such as Jiyang-Qihe County in the outer suburbs of Jinan central city). (2) RS is concentrated in high-density areas (such as Xingyang area of Zhengzhou City). (3) Large-scale independent distribution in medium-density areas (such as Zhencheng-Puyang-Mudan County). This clearly reveals that population density is not an isolated effect, and its effect strongly depends on the interaction with other factors at the local scale. Based on the above findings, this study further proposes that in ecologically fragile areas such as ML-YRB, the “density-morphology” relationship of RS follows the “scale differentiation law”. That is, there is a statistical correlation at the macro scale, but at the medium and micro scales, significant spatial heterogeneity and pattern differentiation are exhibited (Leroy et al., 2012). This concept deepens our understanding of complex human - land systems in ecologically fragile areas and underscores that policies and spatial optimization must consider multi-scale effects and local contexts.
4.1.2.2 Soil classification
Soil resources are the fundamental foundation for human subsistence, significantly correlating with the spatial configuration of RS. As presented in Figure 6c, the density of RS is most pronounced within the zones exhibiting hemi hydric soil and anthropogenic soil types, followed by hemi eluvial soil types. The semi-aqueous soil is primarily tidal soil, typically found in regions possessing flat terrain, deep soil layer and abundant hydrological and thermal resources. It is the main arid soil type in China, renowned for its richness in grain and cotton crops. Anthropogenic soil is predominantly paddy soil and irrigated silt, both soil types shaped by prolonged anthropogenic activities. Semi-eluviated soil is primarily brown soil, typically found in areas boasting favourable light and heat conditions, deep soil and moderate soil texture, and is highly suitable for cultivating food and cash crops (Sun et al., 2022). It is apparent that RS in the ML-YRB is predominantly located on fertile soil conducive to agricultural productivity, whereas zones exhibiting hydrogenic soil, arid soil, saline-alkali soil and alpine soil types with relatively inferior physical and chemical properties exhibit a low degree of RS aggregation. This discovery is consistent with the existing literature, indicating that soil fertility and agricultural suitability are important factors influencing the distribution of RS. For instance, Musasa et al. pointed out that areas with high soil fertility can support higher population density and larger settlement scale because these areas can provide sufficient food and resources. This study further refined the influence of soil types on the distribution of RS, revealing the specific distribution characteristics of different soil types in ML-YRB and their mechanism of action on RS site selection (Musasa et al., 2025).
4.1.2.3 Transportation infrastructure
It is a consensus that traffic convenience promotes RS aggregation, and the road buffer zone effect has been widely studied. This study further precisely quantified and compared the differences in the attractiveness of different grades of roads (Grade I, Grade II, and Grade III) to the RS distribution on the ML-YRB scale. It is innovatively found that secondary roads (especially county roads) have the strongest effect on increasing RS density within a 2 km buffer zone (> primary roads > tertiary roads). Furthermore, the study further clearly explains and emphasizes the unique core hub position of secondary roads (such as county roads) in the ML-YRB rural system. This is attributed to its crucial connecting role in the daily production and life of farmers. It is more densely distributed and has a higher usage frequency, and is the most important channel connecting the village with external markets, services and resources (Singh and Sarkar, 2022). This discovery goes beyond the general description of “transportation convenience” and precisely identifies the “key handle” for optimizing the spatial configuration of RS, that is, giving priority to improving and optimizing the county-level road network, providing a more targeted scientific basis for rural transportation planning and RS optimization (Li L. et al., 2024).
4.1.3 Economic factors
4.1.3.1 Economic development level
The influence of economic factors on the geographic distribution of RS in the ML-YRB is considerable and extensive. Initially, the level of economic development is the fundamental factor influencing the geographic distribution of RS. In the ML-YRB, the non-concentration of cultivated land resources and the constrained radius of agricultural labour on which conventional agriculture depends have led to the dispersion of the geographic distribution of RS. As the economy evolves to a specific level, the level of agricultural modernization and mechanization are enhanced, and the farming radius of farmers is expanded, which significantly increases the likelihood of RS site selection in alternative areas. Conversely, the economy can influence the economic attributes and industrial structure of the RS. For instance, economically developed regions may be more inclined to cultivate modern agriculture, tourism and other industries, and the corresponding RS will progressively shift in these directions (Dong et al., 2025). This study discovered and quantified a significant nonlinear relationship between the level of economic development (GDP) and RS density. The key innovation point lies in identifying that when GDP is in a relatively low range (0–100 million yuan), the RS density is the lowest (0.3/km2, but the proportion is as high as 70%), reflecting the pattern dominated by the traditional decentralized small-scale peasant economy. Once economic development exceeds a certain “threshold”, the density and scale of RS increase significantly (>0.4/km2). This is the first empirical revelation on the threshold effect of economic development on the spatial agglomeration of RS at the ML-YRB scale. Furthermore, the study has deepened the understanding of the evolution mechanism of RS in economically developed regions (Chen et al., 2025). After exceeding the threshold, the increased demands of residents for ecology and quality of life have driven the spatial optimization and functional transformation of RS, forming positive feedback between the economy and the environment, providing a new spatiotemporal perspective and empirical basis for understanding the spatial reconstruction of rural areas during the economic transformation period.
4.1.3.2 Industrial structure
The industrial structure significantly impacts the geographical distribution of RS in ML-YRB. As the primary industry in RS, agriculture has long dominated the industrial functional layout of RS. With economic development, some areas have gradually transformed from traditional agriculture to industry and services, reshaping the economic foundation of RS and triggering population mobility and spatial changes. Industrial growth has attracted rural labor, promoting local settlement expansion and development, enhancing infrastructure and services (Zhan et al., 2024). However, traditional agricultural areas have experienced population outflow, leading to decreasing settlement population and idle resources (Pan et al., 2024). This study combines literature and spatial analysis to explore how industrial structure adjustments differentially reshape the spatial patterns of RS in the ML-YRB: (1) Industrial/service growth areas: These regions attract labor, driving local RS expansion through population aggregation and improved facilities. (2) Traditional agricultural areas: Population outflow leads to RS contraction and resource idleness. (3) Characteristic industry transformation areas (e.g., specialty agriculture, processing, tourism). By optimizing the industrial structure here enhances RS vitality and appeal, improving its spatial distribution. The study highlights that developing specialty non-agricultural industries is crucial for the sustainable development of ML-YRB RS and for optimizing its spatial socio-economic conditions. This offers a way to prevent “industrial hollowing out” and achieve “industrial village development” in rural revitalization.
4.1.3.3 Cultivated land area
As an essential foundation for agricultural production, cultivated land area has a significant impact on the geographic distribution of RS in the ML-YRB (Tan et al., 2021). Initially, the size of cultivated land directly determines the agricultural production capacity and potential of RS. In the ML-YRB, areas with extensive arable land are typically capable of supporting larger-scale agricultural production and richer types of agricultural products, thus attracting more individuals engaged in agricultural activities. These areas often form large-scale, well-functioning RS. Additionally, the distribution of cultivated land area also affects the spatial layout and form of cultivated land. Concentrated and contiguous cultivated land often leads to the distribution of RS along the edge of cultivated land or water systems, forming a compact agricultural settlement pattern, optimizing resource allocation, improving agricultural production efficiency, strengthening economic connections and collaboration among RS, and promoting the coordinated development of the rural economy. This deepens the understanding of the self-organization laws of agricultural settlement systems and highlights the profound spatial significance of cultivated land protection and layout optimization (such as the construction of high-standard farmland) for maintaining the stability of RS systems and promoting the coordinated development of the rural economy. Relevant literature indicates that a reasonable layout of cultivated land can reduce agricultural production costs, improve land use efficiency, and thereby affect the stability and sustainability of RS (Zheng et al., 2021). This indicates that the cultivated land area is not only a fundamental variable in agricultural production, but also a key factor shaping the spatial pattern of RS. The mechanism of its effect on the development of RS deserves in-depth study (Cao et al., 2017).
4.2 Policy applications
The study concerning the spatial distribution of RS in the ML-YRB serves a crucial role in stimulating economic and societal advancement in rural regions, fostering the preservation and safeguarding of rural culture, and refining the spatial distribution and planning of rural areas. Firstly, the spatial distribution of RS in the ML-YRB aids in comprehending the social and economic progression of rural areas. Secondly, the study holds immense significance in propelling the evolution of rural tourism. There exist abundant natural and cultural resources in the ML-YRB. By examining the spatial distribution and types of RS, potential rural tourism destinations can be pinpointed, and the development of rural tourism sector can be catalysed. Furthermore, the spatial distribution of RS also contributes to preserving rural cultural heritage. It can safeguard and perpetuate rural cultural heritage and foster the prosperity and development of rural culture by studying the attributes of RS such as form, architecture and culture. Concurrently, the study also possesses the steering function to refine the rural spatial layout and planning. Lastly, the spatial distribution of RS in the ML-YRB can also serve as a benchmark. For instance, the study can provide abundant empirical data and case studies for geography, history, sociology and other disciplines to stimulate the development and cross-integration of pertinent disciplines.
4.3 Limitations and prospects
The spatial distribution of RS is the product of the long-term development of social and economic history, and its formation has its own development law, which needs to be analyzed and studied by many years of data. Firstly, due to the limitations of RS data in ML-YRB over the years, the spatial distribution characteristics of RS in the ML-YRB in the respective years of the data were only analyzed, without revealing the spatial-temporal evolution of villages in the Yellow River Basin over the years. Secondly, RS are based on village-level administrative districts, and it is difficult to obtain village-scale data, which makes it difficult to conduct systematic research on the uniqueness of different RS. Macro analysis is only conducted from the perspective of river basin, province, city, and county, without involving small-scale micro analysis such as specific case places, which reduces the accuracy of influencing factors. Thirdly, the differences in the spatial distribution of RS are not only determined by the number of RS, but also influenced by multiple factors such as local culture, social and economic factors and policies. Future study can further combine international cases and adopt a multidisciplinary approach to explore the global issues of RS and their local solutions. Therefore, future research should focus on how to carry out multi-stage and multi-level comprehensive research on RS, in order to deeply reveal the complex laws behind the development of RS and the deep natural and social economic factors. The studies in this direction will contribute to a more comprehensive understanding of the evolution mechanism of RS, and provide more scientific and systematic theoretical support and practical guidance for the protection, inheritance and development of RS.
5 Conclusion
ML-YRB was selected as the main research area. By using nearest neighbor analysis, kernel density estimation and spatial autocorrelation methods, the spatial distribution pattern and scale-dependent differences of RS of ML-YRB at the three scales of city, county, and town were systematically revealed. The following innovative conclusions are drawn.
(1) Multi-scale spatial distribution characteristics. The study reveals the aggregation and distribution pattern of RS in ML-YRB at multiple scales such as city, county, and town. By quantifying the changing trend of RS density on different terrain gradients, the law of RS density decreasing from the third step to the second step was discovered. It was precisely identified that the central and western parts of Shandong and the eastern part of Henan were high-high-type RS aggregation areas, and the eastern part of Shanxi was low-low-type RS aggregation areas. This “hot and cold” spatial pattern provides a key targeted area for the targeted protection of RS.
(2) Precise influence mechanism of micro-geographical environment. The study has clarified the refined relationship between natural factors such as slope, soil type, and water system and the distribution of RS. Firstly, the study broke through the linear cognition that “the lower the slope, the denser the settlement”, and identified the slope zone of 6°–12° in ML-YRB as the peak area of RS density. Secondly, it was found that the RS density was significantly dominant in the distribution areas of semi-aquatic soil and artificial soil, revealing the anchoring effect of high-quality cultivated land on population distribution. Thirdly, contrary to the traditional “pro-mainstream” model in river basins, ML-YRB shows a density inversion of “tertiary tributaries > secondary tributaries > mainstream”, presenting a unique settlement distribution pattern of “avoiding the mainstream and tending to the branches”. This precise quantification of the influence of natural geographical elements on RS provides a scientific basis for the protection of RS in ecologically fragile areas.
(3) Distribution laws under complex interactions. By using geographic detectors, it was found that there is a significant interaction between soil types and socio-economic factors such as population density and urban distance, and the influence on the spatial distribution of RS far exceeds the sum of individual factors. This discovery has broken through the previous linear understanding of the influencing factors of RS and provided a brand-new perspective for the comprehensive regulation of RS.
Overall, through multi-method collaborative innovation, multi-dimensional detailed analysis and cross-disciplinary comprehensive perspective, this study not only enriches the theoretical connotation of RS spatial distribution research, but also provides all-round practical guidance for the precise protection, scientific inheritance and sustainable development of RS.
Data availability statement
The original contributions presented in the study are included in the article/supplementary material, further inquiries can be directed to the corresponding author.
Author contributions
XZ: Writing – original draft, Validation, Methodology, Conceptualization. LY: Project administration, Visualization, Funding acquisition, Writing – original draft. XW: Writing – review and editing, Data curation, Validation, Software. LL: Project administration, Writing – review and editing, Visualization, Conceptualization, Methodology. HX: Writing – review and editing, Methodology, Supervision, Validation, Investigation. XY: Writing – review and editing, Investigation, Resources, Project administration.
Funding
The author(s) declare that financial support was received for the research and/or publication of this article. This research was funded by the Humanities and Social Sciences Research Youth Fund Project of the Ministry of Education, grant no. 23YJCZH306, the Anhui Province University Science and Engineering Teachers’ Internship Program in Enterprises, grant no. 2024JSQYGZ102, the Youth fund of Shandong Natural Science Foundation, grant no. ZR2022QE151, and the Jinan Philosophy Social Science Project, grant no. JNSK2025B031.
Acknowledgments
The authors would like to thank all the experts, scholars and partners who gave us their support and help in the study. In addition, I would also like to extend my highest respect to all my colleagues who have been silently contributing to the academic cause. It is your wisdom and sweat that have forged the academic glory and future together.
Conflict of interest
Author XY was employed by Zibo Urban Planning Design Institute Co., Ltd.
The remaining authors declare that the research was conducted in the absence of any commercial or financial relationships that could be construed as a potential conflict of interest.
Generative AI statement
The author(s) declare that no Generative AI was used in the creation of this manuscript.
Publisher’s note
All claims expressed in this article are solely those of the authors and do not necessarily represent those of their affiliated organizations, or those of the publisher, the editors and the reviewers. Any product that may be evaluated in this article, or claim that may be made by its manufacturer, is not guaranteed or endorsed by the publisher.
References
Aria, M., and Cuccurullo, C. (2017). bibliometrix: an R-tool for comprehensive science mapping analysis. J. Informetr. 11, 959–975. doi:10.1016/j.joi.2017.08.007
Bi, G. H., Yang, Q. Y., and Yan, Y. (2022). Rural settlement reconstruction integrating land suitability and individual difference factors: a case study of pingba village, China. Land 11, 1724. doi:10.3390/land11101724
Bi, S., Du, J., Tian, Z., and Zhang, Y. (2024). Investigating the spatial distribution mechanisms of traditional villages from the human geography region: a case study of Jiangnan, China. Ecol. Inf. 81, 102649. doi:10.1016/j.ecoinf.2024.102649
Cai, H., Yu, J., and Guo, Y. (2025). Spatial and temporal distribution and evolution of traditional villages in Xin ’an River Basin of China based on geographic detection and remote sensing technology. Ecol. Indic. 171, 113239. doi:10.1016/j.ecolind.2025.113239
Cao, Y. G., Bai, Z. K., Sun, Q., and Zhou, W. (2017). Rural settlement changes in compound land use areas: characteristics and reasons of changes in a mixed mining-rural-settlement area in Shanxi Province, China. Habitat Int. 61, 9–21. doi:10.1016/j.habitatint.2017.01.002
Carlucci, M., Zambon, I., and Salvati, L. (2020). Diversification in urban functions as a measure of metropolitan complexity. Env. Plan. B-Urban Anal. CIty Sci. 47, 1289–1305. doi:10.1177/2399808319828374
Chabib, L., Nurbillah, A., Lubis, A. A., Batubara, A. W., Purwanti, E., Armi, N., et al. (2025). Assessment of stream quality and health risks in Indonesian river systems: a social analysis and water quality index approach. Case Stud. Chem. Environ. Eng. 11, 101200. doi:10.1016/j.cscee.2025.101200
Chen, W., Duan, B., Bian, J., and Zeng, J. (2025). Decoding the formation mechanisms of rural settlements expansion patterns in transitional China. Land Use Policy 154, 107561. doi:10.1016/j.landusepol.2025.107561
Deng, X. Z., Jin, G., He, S. J., Wang, C. X., Li, Z. H., Wang, Z. Q., et al. (2021). Research progress and prospect on development geography. J. Geogr. Sci. 31, 437–455. doi:10.1007/s11442-021-1852-x
Dong, X., Jiang, G., Xing, Y., Chen, T., and Qu, Y. (2025). Integrating global and local goals: decoding dynamic evolution and influencing factors of rural settlement sustainable development. Habitat Int. 162, 103435. doi:10.1016/j.habitatint.2025.103435
Feng, J., Qin, T., Lv, X., Liu, S., Wen, J., and Chen, J. (2025). Frequent drought and flood events in the Yellow River Basin, increasing future drought trends in the middle and upper reaches. Int. J. Appl. Earth Observation Geoinformation 139, 104511. doi:10.1016/j.jag.2025.104511
Feng, Y., Wei, H., Huang, Y., Li, J. W., Mu, Z. Q., and Kong, D. Z. (2023). Spatiotemporal evolution characteristics and influencing factors of traditional villages: the Yellow River Basin in Henan Province, China. Herit. Sci. 11, 97. doi:10.1186/s40494-023-00939-y
Ferchichi, A., Abbes, A. B., Barra, V., and Farah, I. R. (2022). Forecasting vegetation indices from spatio-temporal remotely sensed data using deep learning-based approaches: a systematic literature review. Ecol. Inf. 68, 101552. doi:10.1016/j.ecoinf.2022.101552
Gao, C. G., Wu, Y., Bian, C. L., and Gao, X. X. (2023). Spatial characteristics and influencing factors of Chinese traditional villages in eight provinces the Yellow River flows through. River Res. Appl. 39, 1255–1269. doi:10.1002/rra.3880
Gebru, M., Tadesse, T., and Berhe, M. (2025). Reliability of irrigation water and farm-level productivity: evidence from semi-arid farming systems in northern Ethiopia. Agric. Syst. 223, 104193. doi:10.1016/j.agsy.2024.104193
Gorbenkova, E., and Shcherbina, E. (2020). Historical-genetic features in rural settlement system: a case study from mogilev district (mogilev oblast, Belarus). Land 9, 165. doi:10.3390/land9050165
Guo, B., Bian, Y., Pei, L., Zhu, X. W., Zhang, D. M., Zhang, W. C., et al. (2022). Identifying population hollowing out regions and their dynamic characteristics across Central China. Sustainability 14, 9815. doi:10.3390/su14169815
Huo, X. L., Xu, X. W., Tang, Y., and Zhang, Z. (2023). An analysis of the spatial evolution and influencing factors of rural settlements along the Shandong section of the Grand Canal of China. River Res. Appl. 39, 1283–1299. doi:10.1002/rra.3874
Jiang, G., Guo, Q., Wang, Y., Guo, L., Wei, M., Hu, J., et al. (2025). Imaging near-surface thermal anomalies for cost-effective detection of hidden geothermal resources: a case study in Shanxi province, North China. Geothermics 131, 103386. doi:10.1016/j.geothermics.2025.103386
Jiang, L., Zuo, Q. T., Ma, J. X., and Zhang, Z. Z. (2021). Evaluation and prediction of the level of high-quality development: a case study of the Yellow River Basin, China. Ecol. Indic. 129, 107994. doi:10.1016/j.ecolind.2021.107994
Kohler, F., Marchand, G., and Negrao, M. (2015). Local history and landscape dynamics: a comparative study in rural Brazil and rural France. Land Use Pol. 43, 149–160. doi:10.1016/j.landusepol.2014.11.010
Kong, X. S., Liu, D. F., Tian, Y. S., and Liu, Y. L. (2021). Multi-objective spatial reconstruction of rural settlements considering intervillage social connections. J. Rural. Stud. 84, 254–264. doi:10.1016/j.jrurstud.2019.02.028
Leroy, G., Kayang, B. B., Youssao, I. A. K., Yapi-Gnaoré, C. V., Osei-Amponsah, R., Loukou, N. E., et al. (2012). Gene diversity, agroecological structure and introgression patterns among village chicken populations across North, West and Central Africa. BMC Genet. 13, 34. doi:10.1186/1471-2156-13-34
Li, H. B., Yuan, Y., Zhang, X. L., Li, Z., Wang, Y. H., and Hu, X. L. (2022). Evolution and transformation mechanism of the spatial structure of rural settlements from the perspective of long-term economic and social change: a case study of the Sunan region, China. J. Rural. Stud. 93, 234–243. doi:10.1016/j.jrurstud.2019.03.005
Li, H. H., and Song, W. (2020). Evolution of rural settlements in the Tongzhou District of Beijing under the new-type urbanization policies. Habitat Int. 101, 102198. doi:10.1016/j.habitatint.2020.102198
Li, H. Y., Ma, H. L., Zhang, J. C., Chen, X. Y., and Hong, X. F. (2024a). Surface water resource accessibility assessment of rural settlements in the yellow River Basin. Water 16, 708. doi:10.3390/w16050708
Li, J. F., Peng, B., Liu, S. Q., Ye, H. P., Zhang, Z. Y., and Nie, X. W. (2023). An accurate fringe extraction model of small- and medium-sized urban areas using multi-source data. Front. Environ. Sci. 11, 11. doi:10.3389/fenvs.2023.1118953
Li, J. S., Sun, W., Li, M. Y., and Meng, L. L. (2021). Coupling coordination degree of production, living and ecological spaces and its influencing factors in the Yellow River Basin. J. Clean. Prod. 298, 126803. doi:10.1016/j.jclepro.2021.126803
Li, L., Zhang, T., and Yang, Y. (2024b). Unveiling nonlinear effects of transport development on rural settlement transitions along the “southern Jiangsu - northern shaanxi” transect in China. Ecol. Indic. 159, 111712. doi:10.1016/j.ecolind.2024.111712
Lin, F. F., Cheng, P., and Kong, X. S. (2023). Spatiotemporal interaction between rural settlements and cultivated land in karst mountainous area, China. Chin. Geogr. Sci. 33, 946–965. doi:10.1007/s11769-023-1373-x
Liu, J. Y., Song, Q., and Wang, X. M. (2023). Spatial morphology evolution of rural settlements in the lower Yellow River plain: the case of menggang town in changyuan city, China. Land 12, 1122. doi:10.3390/land12061122
Liu, S. C., Ma, L. B., Yao, Y., and Cui, X. J. (2022). Man-land relationship based on the spatial coupling of population and residential land - a case study of Yuzhong County in Longzhong Loess Hilly Region, China. Land Use Policy 116, 106059. doi:10.1016/j.landusepol.2022.106059
Liu, Y., Shu, L. Q., and Peng, L. (2021). The hollowing process of rural communities in China: considering the regional characteristic. Land 10, 911. doi:10.3390/land10090911
Luo, G. L., Wang, B., Luo, D. Q., and Wei, C. F. (2020). Spatial agglomeration characteristics of rural settlements in poor mountainous areas of southwest China. Sustainability 12, 1818. doi:10.3390/su12051818
Musasa, T., Shoko, C., Marambanyika, T., and Dube, T. (2025). Modelling soil erosion risk in rural sub-catchments of Zimbabwe using RUSLE, remote sensing and machine learning. J. Arid Environ. 229, 105407. doi:10.1016/j.jaridenv.2025.105407
Omirou, M., Clouvas, A., Leontaris, F., and Kaissas, I. (2023). In-depth study of radon in water in a Greek village with enhanced radon concentrations. J. Environ. Radioact. 264, 107210. doi:10.1016/j.jenvrad.2023.107210
Pan, Y. P., Zhao, X., Zhang, Y. Q., and Luo, H. F. (2024). A large-scale village classification model for tailored rural revitalization: a case study of Hubei province, China. J. Geogr. Sci. 34, 2364–2392. doi:10.1007/s11442-024-2296-x
Qian, T., Su, X., Wu, H., Singh, V. P., and Zhang, T. (2025). An agricultural drought early warning threshold model with considering copula combined with diminishing marginal benefit theory: a case study in the Yellow River basin. Agric. Water Manag. 316, 109582. doi:10.1016/j.agwat.2025.109582
Rao, Y. F., Zou, Y. F., Yi, C. F., Luo, F., Song, Y., and Wu, P. Q. (2023). Optimization of rural settlements based on rural revitalization elements and rural residents' social mobility: a case study of a township in western China. Habitat Int. 137, 102851. doi:10.1016/j.habitatint.2023.102851
Ruslanjari, D., Putri, R. A. P., Puspitasari, D., Djatmiko, R. H., Tanaka, R., Alvionita Hasan, H., et al. (2025). From vulnerability to resilience: examining the Sister Village program's approach to volcanic disaster risk reduction using the DROP model. Prog. Disaster Sci. 26, 100439. doi:10.1016/j.pdisas.2025.100439
Shen, J., Zhao, M., Tang, X., and Wu, C. (2025). Ecological restoration zoning and strategy based on ecosystem service supply and demand relationships: a case study of the Yellow River Basin. J. Nat. Conservation 84, 126837. doi:10.1016/j.jnc.2025.126837
Shi, L. N., and Wang, Y. S. (2021). Evolution characteristics and driving factors of negative decoupled rural residential land and resident population in the Yellow River Basin. Land Use Pol. 109, 105685. doi:10.1016/j.landusepol.2021.105685
Singh, S. S., and Sarkar, B. (2022). Cumulative opportunity-based accessibility measurement framework in rural India. Transp. Policy 117, 138–151. doi:10.1016/j.tranpol.2022.01.009
Song, W., and Li, H. H. (2020). Spatial pattern evolution of rural settlements from 1961 to 2030 in Tongzhou District, China. Land Use Pol. 99, 105044. doi:10.1016/j.landusepol.2020.105044
Song, Y. Z., Wang, J. F., Ge, Y., and Xu, C. D. (2020). An optimal parameters-based geographical detector model enhances geographic characteristics of explanatory variables for spatial heterogeneity analysis: cases with different types of spatial data. GISci Remote Sens. 57, 593–610. doi:10.1080/15481603.2020.1760434
Sun, D. B., Li, Y. Z., Yu, J. B., Li, B. Q., Guan, B., Zhou, D., et al. (2022). Spatial distribution of soil quality under different vegetation types in the Yellow River Delta wetland. Front. Ecol. Evol. 10, 13. doi:10.3389/fevo.2022.977899
Tan, S. K., Zhang, M. M., Wang, A. O., and Ni, Q. L. (2021). Spatio-temporal evolution and driving factors of rural settlements in low hilly region-A case study of 17 cities in hubei province, China. Int. J. Environ. Res. Public Health 18, 2387. doi:10.3390/ijerph18052387
Thinh, N. K., Kamalipour, H., and Peimani, N. (2024). Morphogenesis of forgotten places: a typology of villages-in-the-city in the Global South. Habitat Int. 153, 103184. doi:10.1016/j.habitatint.2024.103184
Tripathi, R. (2024). Impact of restricted public transport since COVID-19 on women in rural India: a qualitative study. Res. Transp. Bus. and Manag. 56, 101167. doi:10.1016/j.rtbm.2024.101167
Wang, J. Y., Wang, X. Y., Du, G. M., and Zhang, H. N. (2022b). Temporal and spatial changes of rural settlements and their influencing factors in northeast China from 2000 to 2020. Land 11, 1640. doi:10.3390/land11101640
Wang, S. Q., Liu, Y., Feng, Y. J., and Lei, Z. K. (2022a). Spatially-explicit prediction of low-density peri-urban development: comparison between urban and rural scenarios in the Moreton Bay Region in South East Queensland, Australia. Environ. Plan. B-Urban Anal. City Sci. 49, 1820–1837. doi:10.1177/23998083211069382
Wang, X., Zhang, T., Duan, L., Liritzis, I., and Li, J. (2024). Spatial distribution characteristics and influencing factors of intangible cultural heritage in the Yellow River Basin. J. Cult. Herit. 66, 254–264. doi:10.1016/j.culher.2023.11.024
Wang, Z., Fan, Z., and Liu, J. (2023). Thermal environment optimisations of cave dwellings for the elderly in heating season among cold regions of China. Build. Environ. 244, 110656. doi:10.1016/j.buildenv.2023.110656
Yang, B. H., Meng, F., Ke, X. L., and Ma, C. X. (2015). The impact analysis of water body landscape pattern on urban heat island: a case study of wuhan city. Adv. Meteorology 2015, 1–7. doi:10.1155/2015/416728
Yu, S. K., Miao, Y., Li, M. C., Ding, X. M., Wang, C. X., and Dou, W. S. (2022). Theoretical development model for rural settlements against rural shrinkage: an empirical study on pingyin county, China. Land 11, 1238. doi:10.3390/land11081238
Zhan, Y. J., Ji, Y. X., Huang, J. J., Ma, C. Y., and Ma, C. Q. (2024). Land-population-industry based village evolution and its influencing factors in the upper Tuojiang River. J. Mt. Sci. 21, 2790–2809. doi:10.1007/s11629-023-8508-5
Zhang, B. L., Zhai, J. H., Zhai, B. Q., and Qu, Y. B. (2024). Understanding the “conflict-coordination” theoretical model of regional land use transitions: empirical evidence from the interconversion between cropland and rural settlements in the lower yellow river, China. Habitat Int. 148, 103072. doi:10.1016/j.habitatint.2024.103072
Zhang, Q. H., and Wang, J. B. (2023). Spatial differentiation and driving factors of traditional villages in jiangsu province. Sustainability 15, 11448. doi:10.3390/su151411448
Zhang, R. T., and Zhang, X. L. (2022). Distribution characteristics and influencing factors of rural settlements in metropolitan fringe area: a case study of nanjing, China. Land 11, 1989. doi:10.3390/land11111989
Zheng, X. Y., Wu, J. H., and Deng, H. B. (2021). Spatial distribution and land use of traditional villages in southwest China. Sustainability 13, 6326. doi:10.3390/su13116326
Keywords: middle-lower Yellow River Basin, rural settlements, multi-scale, spatial distribution, influencing factors
Citation: Zhang X, Yu L, Wen X, Li L, Xiao H and Yin X (2025) Multi-scale spatial differentiation and formation mechanisms of rural settlements (RS): a Geodetector-based analysis in the middle-lower yellow river basin (ML-YRB), China. Front. Environ. Sci. 13:1606333. doi: 10.3389/fenvs.2025.1606333
Received: 05 April 2025; Accepted: 20 June 2025;
Published: 07 July 2025.
Edited by:
Merja H. Tölle, University of Kassel, GermanyCopyright © 2025 Zhang, Yu, Wen, Li, Xiao and Yin. This is an open-access article distributed under the terms of the Creative Commons Attribution License (CC BY). The use, distribution or reproduction in other forums is permitted, provided the original author(s) and the copyright owner(s) are credited and that the original publication in this journal is cited, in accordance with accepted academic practice. No use, distribution or reproduction is permitted which does not comply with these terms.
*Correspondence: Xunxi Yin, eGllemk4ODI2QDE2My5jb20=