 Viera Ivanková
 Marcela Taušová
 Michal Cehlár
 Samer Khouri
- Institute of Earth Resources, Faculty of Mining, Ecology, Process Control and Geotechnologies, Technical University of Košice, Košice, Slovakia
Introduction: The transition toward a greener and more circular economy has become a strategic priority within the European Union (EU), prompting a need to better understand the economic and energy implications of sustainable investment and fiscal instruments. The aim of this study was to examine the relationships between private investment to circular economy sectors, environmental and energy tax revenues, and selected economic and energy-related indicators in EU countries from 2014 to 2021.
Methods: A variability analysis using the Kruskal-Wallis test was first applied to assess cross-country differences in indicator values. This was followed by pairwise correlation analysis to examine the strength and direction of associations among the indicators. Finally, a series of simple linear regression models was used to identify the extent to which green investment and fiscal variables were statistically associated with labor productivity, gross domestic product (GDP) per capita, energy intensity, and energy productivity.
Results: The results showed that higher levels of green investment and fiscal revenues tented to co-occur with better economic performance, especially in terms of increased labor productivity and higher GDP per capita. However, the explanatory power of models concerning energy intensity and productivity remained limited, indicating the presence of other influencing factors. A variability analysis further revealed substantial disparities among EU countries, with Western and Northern European states consistently outperforming Eastern and Southern counterparts in terms of investment and tax levels.
Discussion: The findings indicated that both circular economy investment and environmental taxation were statistically related to economic and energy objectives, but their associations varied depending on broader institutional, policy, and structural conditions. These findings may provide useful insights for policymakers seeking to develop balanced strategies that align sustainability goals with economic performance.
1 Introduction
The European Union (EU) has positioned itself as a global leader in environmental policy, aiming to foster sustainable economic growth through improved energy efficiency and the expansion of the green sector (Lel, 2024). These efforts rely on a strategic combination of environmental and energy taxes and targeted green investments to support the transition to a low-carbon economy (Cigu et al., 2020). Taxation plays a key role in shaping economic and investment decisions, influencing production, employment, innovation, and savings (Almeida, 2021; Yusuf and Mohd, 2020). Specifically, environmental and energy taxes are designed to internalize external environmental costs and incentivize cleaner behavior by firms and consumers (Nilsson, 1993). Revenues from these taxes can be redirected into the green economy—such as renewable energy, energy-efficient technologies, and sustainable infrastructure—contributing to both environmental and economic progress (Surugiu and Surugiu, 2014). While these taxes can positively impact energy efficiency and emissions reduction, their design must carefully consider economic competitiveness and social equity, as they may place a disproportionate burden on vulnerable groups or energy-intensive industries (Surugiu and Surugiu, 2014; Ono, 2003). Therefore, complementary support measures and appropriate regulation are essential. As such, the relationship between green investment, environmental taxation, and key economic and energy indicators in the EU represents an important area of study within the broader agenda of green transformation and policy effectiveness.
To strengthen the analytical foundation, this study is conceptually grounded in the Environmental Kuznets Curve (EKC) hypothesis, the Porter Hypothesis, and the Ecological Modernization Theory. The EKC posits a nonlinear relationship between environmental degradation and economic growth, where environmental impacts worsen in the early stages of economic development but improve after surpassing a certain income threshold, often due to technological advancement and regulatory improvements (Grossman and Krueger, 1995; Dinda, 2004). The Porter Hypothesis suggests that well-designed environmental regulations can spur innovation that offsets the costs of compliance and boosts competitiveness (Porter and van der Linde, 1995). Ecological Modernization Theory highlights how economic development and environmental protection can be complementary through technological innovation, institutional reform, and market-based instruments like green taxes and sustainable investment (Mol and Sonnenfeld, 2000; Jänicke, 2008). Together, these frameworks offer valuable lenses for analyzing how fiscal tools and circular economy investments interact with energy and economic performance across EU Member States.
Although the role of green investment and environmental taxation in sustainable development has gained growing attention, the existing literature lacks a comprehensive examination of how these instruments relate to both economic and energy-related dimensions of sustainability within the EU context. Previous studies have often treated investment and taxation separately or have focused on narrow subsets of indicators, without considering their combined relevance to broader sustainability objectives. Moreover, cross-country comparisons that reflect the internal diversity of EU Member States remain underexplored, particularly in relation to differences in investment intensity, fiscal capacity, and policy orientation. This study addresses this gap by providing a more integrated understanding of how circular economy investment and environmental taxation align with national performance in economic and energy domains.
2 Literature review
This relationship has been examined within theoretical frameworks such as the Environmental Kuznets Curve (EKC), which posits an inverted U-shaped relationship between environmental degradation and economic growth (Grossman and Krueger, 1995), and the Porter Hypothesis, which suggests that properly designed environmental regulation can trigger innovation that leads to improved economic and environmental performance (Porter and van der Linde, 1995). These theories, along with Ecological Modernization Theory, help explain the mechanisms through which green taxation and investment drive improvements in productivity, efficiency, and ecological outcomes (Mol and Sonnenfeld, 2000; Spaargaren and Mol, 1992).
2.1 The role of green taxes in driving economic performance
This section resonates strongly with the Porter Hypothesis, which contends that well-crafted environmental regulation—such as green taxation—can stimulate innovation and enhance competitiveness, ultimately contributing to long-term economic growth (Porter and van der Linde, 1995).
Taxes represent an integral component of modern economies, and as such, they must be carefully considered when assessing broader economic dynamics and policy impacts (Kneller et al., 1999). Theoretical contributions indicate that a shift in the tax structure from output to pollution may stimulate economic growth by enhancing capital productivity and mitigating distortions in investment decisions (Bovenberg and de Mooij, 1997). Thus, the importance of green taxes in the EU context lies in their potential to not only increase environmental benefits, but also influence labor productivity and economic development through various channels (Beladi et al., 2021; Hassan et al., 2021; Ignjatijević et al., 2020). In this context, green tax revenues can be reinvested in green technologies, infrastructure, and education programs, stimulating innovation, creating jobs, and enhancing long-term competitiveness (Umar and Safi, 2023). Through this process, environmental and energy tax revenues further stimulate green technology innovation, leading to new products, processes, and markets that drive economic growth, while also enhancing human capital and boosting labor productivity (Ignjatijević et al., 2020). The implementation of green regulations also has far-reaching implications, strengthening the demand for environmentally friendly technology research and development within companies (Cigu et al., 2020).
The effective design and implementation of environmental tax policies, coupled with strategic revenue recycling, can unlock their potential to drive sustainable economic growth and create a more environmentally responsible economy (Umar and Safi, 2023; Cigu et al., 2020; de Mooij, 2020; Ignjatijević et al., 2020). In this context, it can be argued that the relationship between ecological environment protection and economic development is not contradictory and antagonistic, but dialectical and unified (Zheng et al., 2022). The significance of tax-based environmental regulations in enhancing productivity and supporting economic growth is well established in the literature (Cao et al., 2024; Mirović et al., 2023). Several studies have explored the relationship between environmentally related tax revenues and economic growth, examining their interactions, mechanisms and broader economic and environmental implications (Çelebi Boz and Örs Onur, 2024; Zhao and Yuan, 2024; Mirović et al., 2023; Hassan et al., 2020a). Based on their findings, it can be argued that environmental taxes have a positive effect on economic growth. More specifically, a recent study on EU countries confirmed a positive effect of environmental tax revenues on gross domestic product (GDP) between 2014 and 2021, underscoring their economic potential (Suhányi et al., 2024). Abdullah and Morley (2014), using a sample of The Organization for Economic Cooperation and Development (OECD) countries from 1995 to 2006, identified a long-run causality from economic growth to increased environmental tax revenues, along with some evidence of short-run causality in the opposite direction. It is well known that environmental pollution poses a significant burden on public health (Wang et al., 2015; Pope et al., 2002). This provides a strong rationale for examining the potential of environmental taxes to enhance labor productivity, especially given evidence that better health significantly increases labor market participation for both men and women (Cai, 2010). In line with this, Mathieu-Bolh and Pautrel (2011) examined the health effects of environmental taxes on economic activity and found that pollution reductions due to environmental taxes improve public health and increase labor productivity. These findings are consistent with those of Williams (2002), who suggested that pollution reduction can enhance labor productivity and mitigate the economic burden of environmental regulations through improved health and efficiency. However, the effects of environmental taxes on labor productivity are not uniform across the economy, highlighting the need to consider the structural characteristics of firms and the workforce (Wei et al., 2023). At the same time, stricter environmental regulations have been shown to drive firms to innovate in clean technologies, change the division of labor, increase labor productivity and expand green market opportunities (Tang et al., 2019). This suggests that, although the transition may involve short-term adjustment costs, it can ultimately generate long-term gains in efficiency and economic performance.
Empirical evidence on the relationship between energy taxes and economic growth is mixed, with some studies finding a positive correlation and others finding a negative or insignificant relationship (Mirović et al., 2023; Hassan et al., 2021; Hassan et al., 2020b; Lin and Jia, 2018; Nong, 2018). The inconsistencies may reflect differences in data, methodologies, and country-specific circumstances, highlighting the complexity of the issue. The relationship between energy taxes, economic growth, and labor productivity is therefore best understood as a complex interplay of economic, environmental, and institutional factors, with both direct and indirect effects, including impacts on investment, innovation, and human capital formation (Mirović et al., 2023; Hassan et al., 2021). Empirical evidence further suggests that the impact of energy-based taxes on economic growth may depend on a country’s structural characteristics, particularly its reliance on polluting energy sources (Hassan et al., 2020b). For instance, in a study of 31 OECD countries, energy taxes were found to negatively affect growth rates in economies with high dependence on polluting energy, while in wealthier countries, higher energy taxes were associated with improved growth outcomes (Hassan et al., 2020b). This may imply that energy consumption reduction policies aimed at lowering emissions are likely to have a greater impact on the GDP of developed countries (Chontanawat et al., 2008). Nevertheless, there is also evidence supporting a positive and statistically significant relationship between energy tax revenues and economic growth (Mirović et al., 2023). Energy taxes can indirectly influence human capital by reducing polluting emissions, which negatively affect skill development and labor productivity in both the short and long term (Hassan et al., 2021). Moreover, they can stimulate eco-innovation over time, further reinforcing their potential to support sustainable economic growth (Hassan et al., 2021). However, the positive impact on productivity may be limited to firms with the highest energy costs, as these firms are more likely to see an economic return on their green technology investments (Stucki, 2019). Ultimately, firms will only invest in green energy technologies if the investments provide a favorable economic outcome for them (Stucki, 2019).
2.2 The role of green taxes in driving energy performance
From the perspective of the Ecological Modernization Theory, green taxes are seen not merely as fiscal tools, but as instruments of institutional and technological transformation, capable of driving cleaner energy use and structural energy transitions (Mol and Sonnenfeld, 2000).
Green taxation has increasingly been recognized as a key policy instrument in addressing the dual challenge of high energy intensity and environmental degradation (Savranlar et al., 2024; Nilsson, 1993). In an era of growing energy demand and climate concerns, green taxes offer a market-based approach to reducing energy consumption while simultaneously promoting cleaner and more efficient energy use (Domguia et al., 2024). Their implementation reflects a shift towards integrating environmental objectives into economic decision-making, particularly in the context of sustainable energy transitions (Chatzistamoulou and Koundouri, 2024; Ahmed et al., 2022). As part of broader climate and energy strategies, green taxation contributes to reshaping production and consumption patterns in favor of lower energy intensity (Fatur Šikić and Hodžić, 2023; Sackitey, 2023; Ahmed et al., 2022; Adetutu et al., 2020). Consequently, green taxation plays a crucial role in decoupling energy use from economic growth and in supporting long-term climate and energy goals (He et al., 2019).
The relationship between environmental tax revenues and energy intensity has gained increasing attention in the context of sustainable development and climate policy. Several studies have confirmed that environmental taxation can be an effective tool in reducing energy intensity by encouraging cleaner production and more efficient energy use (Sackitey, 2023; Yasmeen et al., 2023; Bashir et al., 2021). For instance, Sackitey (2023) found a significant long-run negative relationship between environmental tax revenues and energy intensity in OECD countries, with results supporting the existence of bidirectional causality. Similarly, Bashir et al. (2021) reported that environmental taxes contribute to lowering energy intensity by fostering innovation in environmentally friendly technologies. Máté et al. (2023) also found that environmental taxation has a mitigating effect on carbon intensity, a closely related indicator, particularly when combined with changes in the energy mix, highlighting its role in sustainable energy transitions. In the European context, Ahmad et al. (2025) found significant associations between energy intensity, environmental tax revenues, and environmental management efforts in major EU economies, emphasizing the importance of efficient revenue use and policy coordination to enhance energy efficiency. Moreover, Yasmeen et al. (2023) emphasized that environmental taxes, together with green technologies, are among the most effective tools for improving energy efficiency and reducing energy intensity. These findings support the view that environmental taxation contributes not only to fiscal goals but also to structural shifts toward low-carbon, energy-efficient economies. Closely related, energy productivity has become a key indicator in assessing the impact of such taxation. Environmental taxes have been shown to enhance total factor energy productivity by promoting green innovation and reducing inefficiencies (Xie and Jamaani, 2022). Evidence from G7 countries highlights a strong, bidirectional causal link between environmental taxation, energy productivity, and renewable energy, underscoring the importance of coordinated policy design. In OECD economies, taxes have had a greater impact on improving energy productivity than green technologies alone, particularly when implemented within strong institutional frameworks that ensure regulatory compliance and support sustainable development (Yasmeen et al., 2023).
The effect of energy taxes specifically on energy intensity has also been explored in empirical research, often with similarly favorable outcomes (Wei et al., 2022; He et al., 2019; Borozan, 2018; Fang et al., 2013). He et al. (2019) demonstrated that energy taxes significantly improve the efficiency of coal, oil, and natural gas consumption in OECD countries, both when accounting for and excluding undesirable outputs. Their results support the double dividend hypothesis, whereby energy taxes not only reduce environmental harm but also enhance economic performance through improved energy use. By increasing the cost of fossil fuels and electricity, energy taxes encourage firms and households to minimize energy waste, adopt energy-efficient technologies, and optimize their resource use, ultimately lowering energy intensity and associated costs (Nilsson, 1993). Likewise, Borozan (2018) found that energy taxes in EU countries are more effective when implemented alongside policies that influence electricity consumption behavior, rather than relying solely on price mechanisms. In a Chinese context, Fang et al. (2013) showed that the introduction and timing of carbon taxes can directly shape energy intensity trajectories within a dynamic system, confirming their utility in controlling energy demand. Furthermore, Wei et al. (2022) highlighted the potential of even modest carbon tax rates to reduce energy intensity while maintaining economic stability. In addition, energy taxes can support the shift towards renewable energy sources, thereby not only lowering dependence on fossil fuels but also enhancing long-term energy efficiency (Woerter et al., 2017). Supporting these findings, Sackitey (2023) concluded that among various forms of environmental taxation, energy taxes—including carbon dioxide (CO2) taxes—have the strongest impact on reducing both energy consumption and energy intensity, outperforming pollution and transport taxes. This further underlines the relevance of energy taxation as a practical and targeted instrument in national energy efficiency strategies. Beyond energy intensity, energy productivity offers another important lens through which the effectiveness of energy taxation can be assessed. Energy taxes contribute to higher energy productivity by incentivizing firms to optimize resource use and invest in efficiency-enhancing technologies (Liu and Xia, 2023; Xie and Jamaani, 2022). Additionally, they can counteract the rebound effect from energy efficiency improvements, helping preserve real energy savings, while still allowing the economy to benefit from gains in energy productivity (Freire-González, 2020).
2.3 The role of private investment to the circular economy in driving economic and energy performance
The rationale for exploring the role of private investment in this context is grounded in the Ecological Modernization Theory, which highlights how market-based mechanisms—such as green finance and private capital—can align environmental goals with economic modernization and efficiency (Spaargaren and Mol, 1992).
Fostering green innovation and reducing environmental pollution are critical drivers for cleaner economic growth and a healthier environment, highlighting the importance of green finance in achieving sustainable development (Umar and Safi, 2023). In this context, Qi et al. (2023) demonstrated that green finance, including private investments in renewable technologies and circular production systems, can significantly improve green total factor productivity while reducing environmental degradation. On this basis, green investments, often measured in terms of private investments, jobs, and gross value added related to circular economy sectors, have been empirically shown to positively influence both environmental and economic performance (Lyeonov et al., 2019). These findings stress that fostering private investment within a robust regulatory framework is essential not only for financing circular initiatives but also for ensuring their effectiveness in terms of both environmental and economic outcomes.
Green finance and innovation are significant in achieving sustainable development (Umar and Safi, 2023). Also, green investments can create new business opportunities, stimulate economic growth, and enhance environmental sustainability (Umar and Safi, 2023; Ma et al., 2022). Enterprises can simplify the production process through innovations to reduce production inputs and costs, simultaneously reducing the cost of pollution treatment by reducing emissions of wastewater, flue gas, and solid waste (Ouyang et al., 2020). Empirical evidence confirms a positive relationship between private green investment and economic growth. For instance, Lyeonov et al. (2019) found that in the EU, private investment in circular economy sectors (PICE) could increase GDP per capita by 6.4%, while simultaneously contributing to emission reduction and renewable energy uptake. Similarly, Wan and Sheng (2022) demonstrated that in Chinese provinces, green investment significantly promotes clean energy consumption and boosts economic growth, even though its impact on carbon emissions is less direct. According to Qi et al. (2023), green finance initiatives stimulate innovation in clean production technologies and resource efficiency, which ultimately leads to higher economic productivity and growth. Their study found that increases in green finance indicators are positively associated with improvements in GDP and employment levels, particularly when supported by complementary policy instruments. Similarly, Ahmad et al. (2025) showed that environmental management efforts—of which private investment is an integral component—are closely associated with improved economic outcomes in major EU economies. Their study suggested that mobilizing private capital toward environmental goals not only fosters environmental sustainability but also enhances competitiveness by supporting technological upgrading and structural transformation. These findings emphasize the dual benefit of green investments: driving economic performance while aligning with environmental goals.
In addition to its macroeconomic effects, private investment in the green sector also plays a pivotal role in improving energy performance indicators such as energy intensity and energy productivity (Ahmad et al., 2025; Panait et al., 2022). There is clearly evidence about a positive association between green investment and energy efficiency (Dong et al., 2023). Panait et al. (2022) confirmed a bidirectional causality between foreign direct investment and energy efficiency in European countries, underscoring the strategic role of investment flows in shaping energy transition. The study further argues that investment in renewable energy enhances national energy independence and supports sustainable development. Qi et al. (2023) argued that green finance promotes the adoption of energy-efficient technologies and low-carbon infrastructure, which directly contributes to enhanced energy productivity and reduced energy consumption per unit of output. Their analysis confirmed a robust relationship between green finance indicators and improvements in green total factor productivity, particularly in regions where environmental regulation and institutional capacity support sustainable investments. Furthermore, Ahmad et al. (2025) highlighted that in European economies, the interplay between private investment, energy intensity, and environmental management is critical for achieving energy efficiency targets. This implies that private financial flows, when effectively guided by environmental policy and market incentives, can serve as a powerful tool for transforming the energy structure and reducing dependence on fossil fuels.
3 Methodology
3.1 Aim
The aim of this study was to examine the relationships between private investment to circular economy sectors, environmental and energy tax revenues, and selected economic and energy performance indicators in EU countries from 2014 to 2021. Special attention was given to identifying the strength and direction of these associations and evaluating the extent to which sustainable fiscal and investment measures contribute to improved labor productivity, economic growth, and energy efficiency and productivity.
3.2 Data structure
The data used in the analyses were obtained from publicly available databases published by Eurostat. A total of 8,822 data were collected for the years 1995–2023 (Table 1). Each indicator was monitored annually over the available time span, which varies for each indicator, consequently limiting the analyses performed and hence the findings.
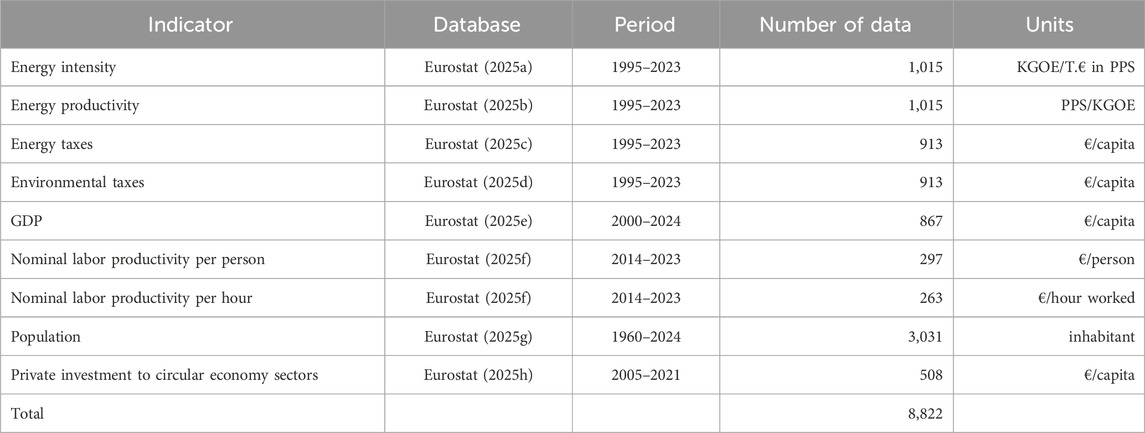
Table 1. Data structure.
3.3 Methods
3.3.1 Descriptive statistics
Each indicator was analyzed using descriptive statistics, calculating basic indicators such as mean, standard deviation, minimum and maximum values.
3.3.2 Trend analysis
The trend of the indicators for the whole EU was analyzed using time series and mathematically expressed through a linear regression model.
3.3.3 Comparative analysis
Using non-parametric ANOVA via Kruskal–Wallis test, the variance of the values was analyzed by the influence of countries. Through Kruskal–Wallis test, the null hypothesis (H0) was tested at alpha = 0.05 level of significance. The null hypothesis defines the equality of the achieved values of an indicator regardless of the country of observation.
H0 (country influence) = There are no statistically significant differences in indicator values by country influence.
At a p-value <0.05, H0 is rejected in favor of the alternative hypothesis HA. HA is defined as follows:
HA (country influence) = There are statistically significant differences in the values of the indicator due to country influence.
3.3.4 Pairwise correlation analysis
This approach was applied to assess the linear relationships between the variables in the JMP software environment. All indicators were analyzed against each other and examined to determine whether there is a linear correlation between them, defined by the correlation coefficient r:
where:
Xi–variable X observed at time i,
Yi–variable Y observed at time i,
n–the range of the time series under study.
The correlation coefficient measures the strength and direction of the linear relationship between two variables and takes values from the interval < -1,1>. A value of r = 1 indicates a perfect positive linear relationship, while r = −1 indicates a perfect negative linear relationship. If the correlation coefficient is 0, no linear relationship exists between the variables X and Y. Other values of r can be interpreted according to following classification:
0 < |r| < 0.3 low level of relationship between variables.
0.3 ≤ |r| < 0.5 medium level of relationship between variables.
0.5 ≤ |r| < 0.7 moderate level of relationship between variables.
0.7 ≤ |r| < 1 strong level of relationship between variables.
3.3.5 Regression analysis
Following the findings of the correlation analysis, the confirmed relationships between the indicators were mathematically expressed by a linear regression model.
4 Results
4.1 Distribution analysis
4.1.1 Distribution analysis–Private investment to circular economy sectors
The analysis of private investment to circular economy sectors expressed in euros per capita and presented in the form of a histogram, boxplot and basic statistical characteristics revealed the following patterns. It is evident from the results presented that the distribution of green investments was strongly right-skewed, meaning that most countries had relatively low investments to circular economy sectors, and on the other hand, a few countries showed extremely high values. The median investment to circular economy sectors was 124.17 EUR per capita, indicating that half of the countries surveyed had investment below this value. The mean, which was higher than the median, was at 222.29 EUR per capita, indicating the influence of outliers on the overall distribution (Figure 1).
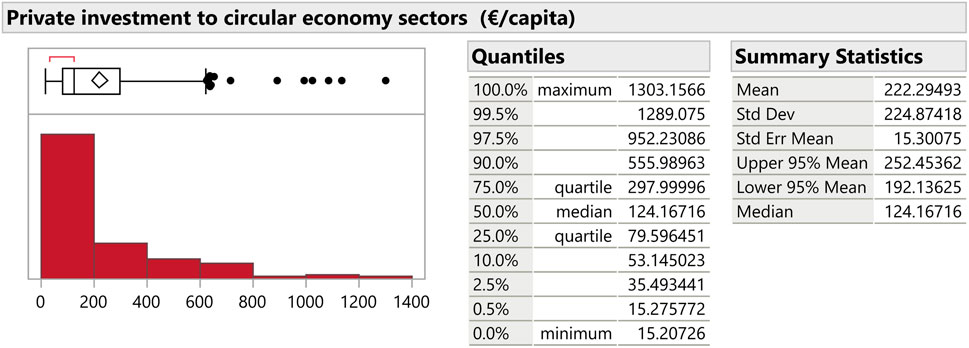
Figure 1. Distribution analysis–Private investment to circular economy sectors (€/capita).
The quantile analysis shows that 75% of countries had investments of less than 297.99 EUR per capita, with a maximum of 1,303.16 EUR per capita. This high value, together with other extreme observations, was associated with considerable dispersion in the data, as evidenced by the high standard deviation (224.85). Given the skewed distribution, it may be misleading to rely on the arithmetic mean alone when interpreting the average values, as it does not reflect the true situation of most countries. To understand more precisely the factors associated with varying levels of investment, it would be useful to complement the analysis by examining in more detail the reasons for the uneven distribution and identifying the factors leading to outliers.
4.1.2 Distribution analysis–Environmental taxes
A distribution analysis of environmental tax revenues in absolute per capita terms led to the following findings.
The distribution of values showed a high variability, which was confirmed by the standard deviation of 438.55 EUR per capita, meaning that the values deviated significantly from the mean (765.5 EUR per capita). The lowest environmental tax revenue per capita was 171.51 EUR per capita, while the highest was 1,941.75 EUR per capita, representing a difference of more than ten times between countries (Figure 2). The median value (685.37 EUR per capita) was lower than the mean, further confirming a right-skewed distribution with several countries recording very high environmental tax revenues that elevated the overall mean. Overall, the data indicate substantial cross-country variation in environmental tax revenues, which was examined further in the comparative analysis.
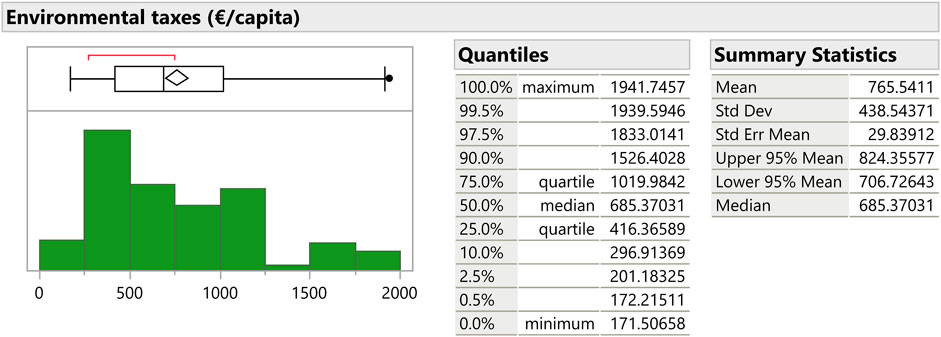
Figure 2. Distribution analysis–Environmental taxes (€/capita).
4.1.3 Distribution analysis–Energy taxes
Energy tax revenues in EUR per capita also showed considerable variability across EU countries. The mean energy tax revenue per capita was 569.30 EUR. The median value of 522.89 EUR per capita indicates that half of the countries reported lower energy tax revenues, while some countries had substantially higher values, which influenced the overall mean (Figure 3).
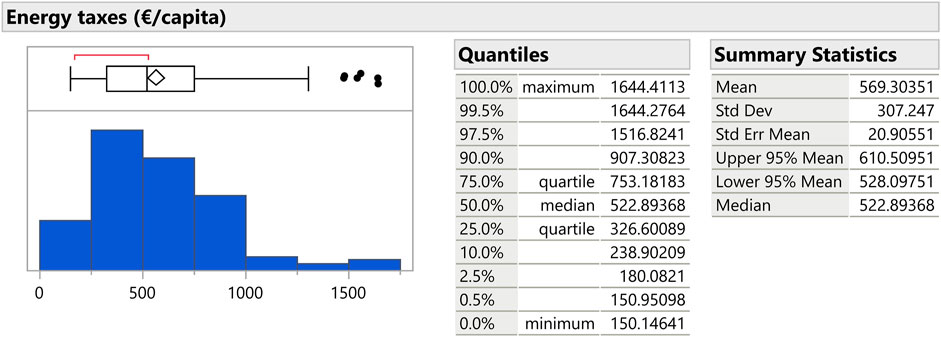
Figure 3. Distribution analysis–Energy taxes.
The high value of the standard deviation (307.25) indicates that there was a large variability in energy tax revenues across countries. The maximum value of energy tax revenue was as high as 1644.41 EUR per capita, which is more than 10 times the minimum value (150.15 EUR per capita). These differences may be linked to a combination of factors such as economic structure, energy consumption levels, and fiscal policy design.
4.2 Comparative analysis
4.2.1 Variability analysis–Private investment to circular economy sectors
By comparing the data at EU level, it was possible to identify the countries with the highest values and the most substantial growth in values (Figure 4). Luxembourg had the highest mean value of private investment to circular economy sectors (975.73 EUR per capita) and the highest increase in such investment, while Bulgaria (51.92 EUR per capita) and Romania (53.35 EUR per capita) were among the countries with the lowest private investment to circular economy sectors.
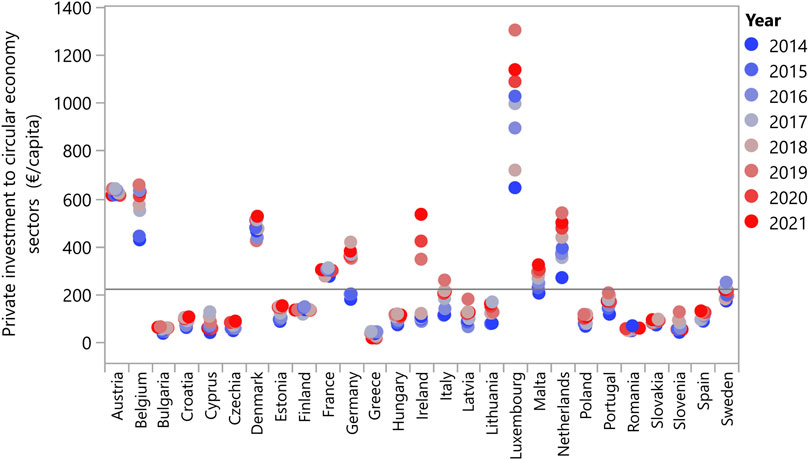
Figure 4. Comparison of mean values of private investment to circular economy sectors (€/capita) between EU countries (2014–2021).
The variation in values between countries was significant, indicating substantial differences in private investment to circular economy sectors. The variability analysis using the Kruskal–Wallis test confirmed statistically significant differences in the observed values at the level of EU countries, which was also evident in Figure 4 above.
By analyzing the means, it was possible to rank the countries from the highest value of private investment to circular economy sectors per capita to the lowest (Figure 5, left). The highest mean values were achieved by Luxembourg, Austria, Belgium, Denmark and the Netherlands, and these values were significantly higher than the EU average for the observed period, which was found to be 222.29 EUR per capita (Figure 5, right). The lowest values were recorded in Greece, Romania, Cyprus, Slovenia, and Bulgaria, with levels reaching up to approximately 70 EUR per capita, which reflects a relatively low level of investment compared to the EU average.
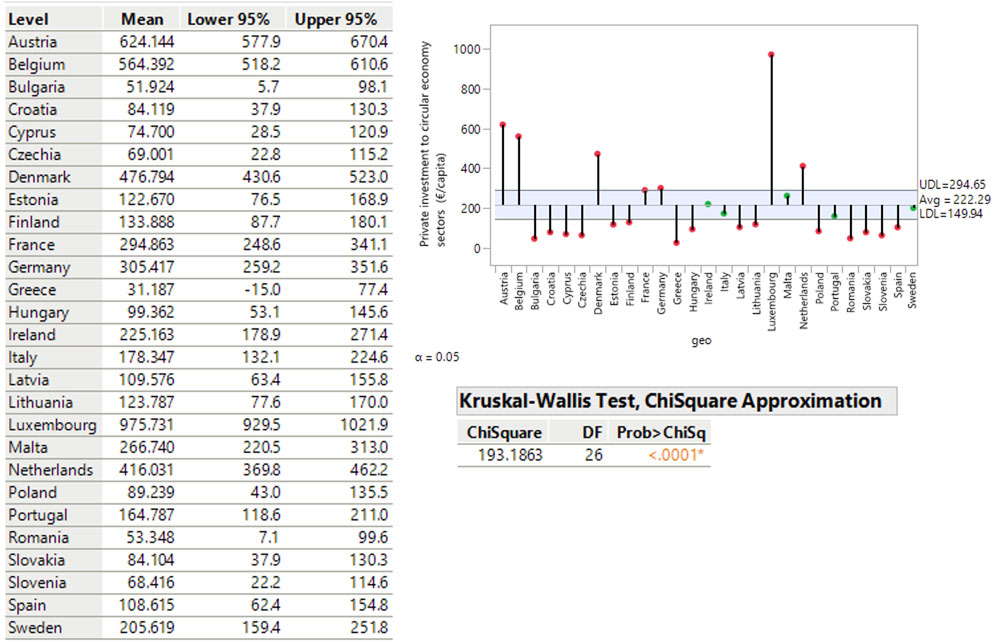
Figure 5. Cross-country differences in investment to circular economy sectors (€/capita) based on the Kruskal–Wallis test.
4.2.2 Variability analysis–Environmental taxes
The results of the variability analysis showed differences in the mean values of the analyzed indicator between EU countries. EU countries with the highest environmental tax revenues per capita included Denmark and Luxembourg, with more than 1000 EUR per capita annually (Figure 6). These outcomes may reflect more developed fiscal systems and the higher purchasing power of the population. In contrast, EU countries such as Bulgaria and Romania recorded low environmental tax revenues and were positioned at the lower end of the ranking, with values below 200 EUR per capita annually. This contrast may indicate differences in tax bases, income levels, or environmental priorities. For some countries, such as the Netherlands and Lithuania, a relatively stable trend was observed—in the case of these countries, an increasing trend—during the analyzed period, suggesting gradual change in environmental taxation practices. Some countries, such as Malta or Estonia, showed significant variability between individual years. These fluctuations could be related to shifts in policy direction, fiscal adjustments, or macroeconomic factors.
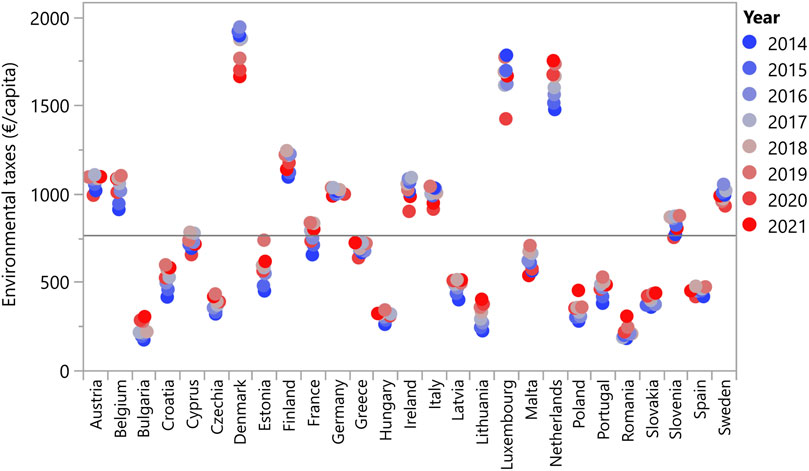
Figure 6. Comparison of mean values of environmental taxes (€/capita) between EU countries (2014–2021).
The analysis of variability using the Kruskal–Wallis test confirmed statistically significant differences in the observed values at the level of individual EU countries, which also confirmed previous findings. These differences may be linked to national differences in tax policies, economic structures, and the implementation of environmental tax systems.
The data clearly indicate that environmental taxes tended to be higher in countries such as Luxembourg, Denmark, and Sweden (Figure 7). These countries not only recorded the highest values of environmental tax revenues per capita, but also appeared to have more established legislative frameworks and higher levels of environmental engagement. The level of environmental taxation in these countries may also reflect purchasing power, which potentially enables wider acceptance of sustainability measures.
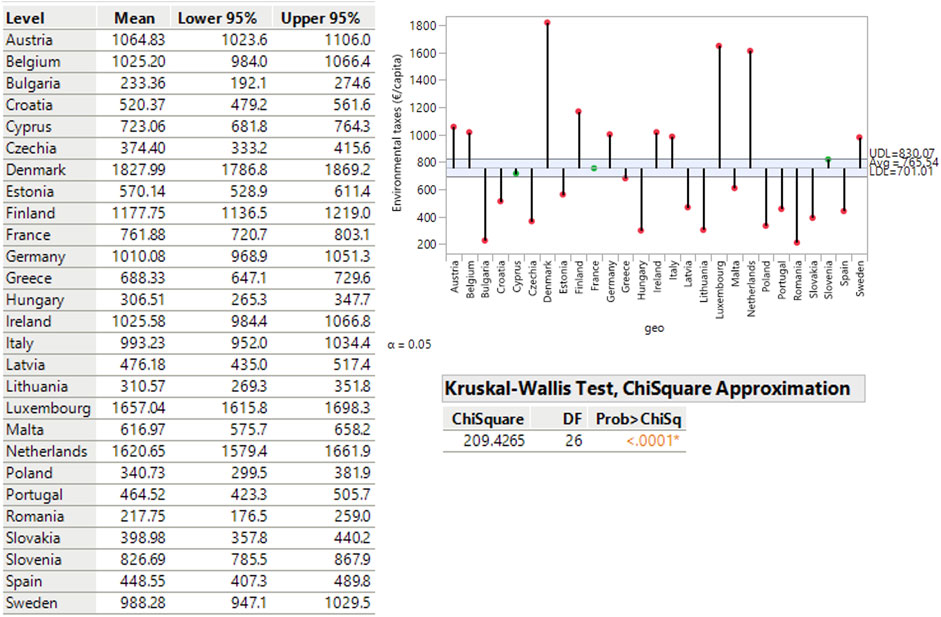
Figure 7. Cross-country differences in environmental taxes (€/capita) based on the Kruskal–Wallis test.
On the other hand, countries with lower values, such as Bulgaria, Romania, or Croatia, reported environmental tax revenues of less than 200 EUR per capita. These values may i nfluenced by factors such as lower average incomes, fiscal capacity constraints, or different policy priorities regarding environmental taxation. This variation may point to opportunities for gradual policy alignment, including legal reforms, incentive structures, and awareness-raising initiatives.
The findings suggest that while environmental taxes are widely used, their design and outcomes differ considerably across countries. Their observed statistical relationships with sustainability goals appear to depend on national conditions.
4.2.3 Variability analysis–Energy taxes
The results of the variability analysis revealed differences in the mean values of the examined indicator across EU countries. The data clearly showed a diversity between countries, with energy tax revenues ranging from very low levels in some Eastern European countries to significantly higher values in the Nordic and Western European regions. The highest revenues were recorded in countries such as Luxembourg and Denmark, where energy tax revenues exceeded 1000 EUR per capita annually (Figure 8). This may reflect robust tax administration, higher consumption volumes, or broader fiscal structures involving energy taxation. In these countries, energy taxes may serve not only as revenue instruments, but also as part of wider environmental strategies.
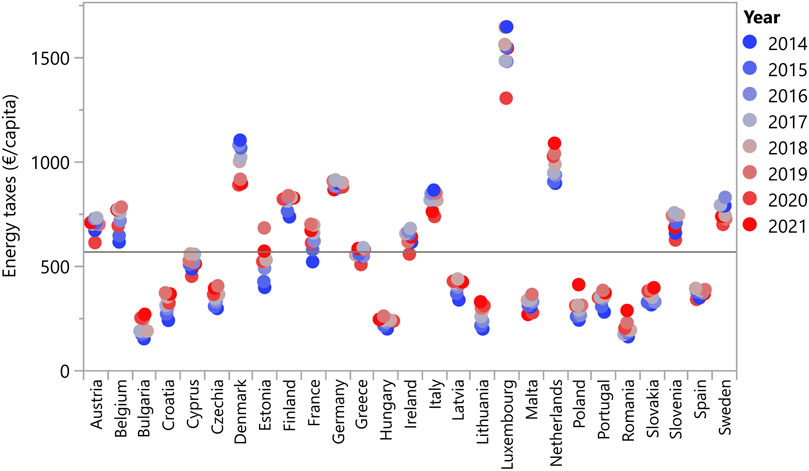
Figure 8. Comparison of mean values of energy taxes (€/capita) between EU countries (2014–2021).
On the other hand, countries such as Bulgaria and Romania reported low revenues from energy taxes, often falling below 200 EUR per capita annually. This disparity may be associated with differences in consumption, prices, tax capacity, or energy demand patterns. Such countries could consider reassessing the role of energy taxation within their broader fiscal and environmental frameworks.
In terms of time, it was interesting to observe the stability in countries such as Sweden and Germany, where energy tax revenues did not show significant annual fluctuations. This trend may reflect long-standing institutional frameworks and stable policy environments. Conversely, countries such as Estonia and Malta showed greater variation over the years, which may suggest exposure to macroeconomic shifts or reactive policymaking.
The statistical analysis using the Kruskal–Wallis test confirmed that there were statistically significant differences between the evaluated countries, which was further supported by the subsequent analysis of means.
The results illustrated in the graph highlight not only the differences in the absolute values of energy tax revenues, but also their potential policy relevance as part of broader environmental governance (Figure 9). Higher revenues from such taxes may be used to support sustainable energy transitions. Countries with lower energy tax revenues might look to other Member States for inspiration when considering energy tax reforms adapted to their national contexts.
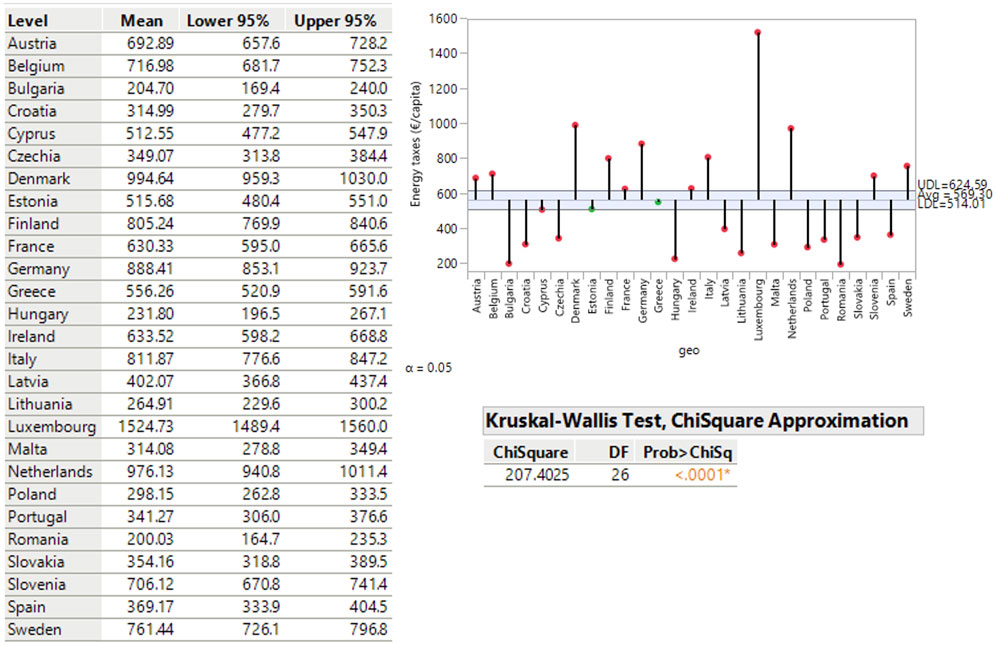
Figure 9. Cross-country differences in energy taxes (€/capita) based on the Kruskal–Wallis test.
Overall, the analysis suggests that energy taxation practices vary widely across the EU, and that their association with environmental or economic goals appears to be conditioned by national economic development levels and institutional readiness.
4.3 Relationship analysis
Building on the previous findings, the subsequent section explored the relationships between private investment to circular economy sectors, environmental and energy tax revenues, and selected economic and energy-related indicators. The analysis focused on examining how these variables are statistically associated with measures of energy efficiency and economic performance, particularly energy intensity, energy productivity, labor productivity, and GDP per capita, across EU countries. The following indicators were incorporated into the analyses:
• energy productivity (PPS/KGOE),
• energy intensity (KGOE/thousand € PPS),
• GDP per capita (€/capita),
• nominal labor productivity per worked hour (€/person),
• nominal labor productivity per employee (€/hour).
4.3.1 Correlation analysis
Correlation analysis was used to examine whether there was a linear relationship between the selected indicators. The graphical analysis suggested certain associations between the indicators (Figure 10), which were confirmed using the pairwise correlation presented below (Figure 11).
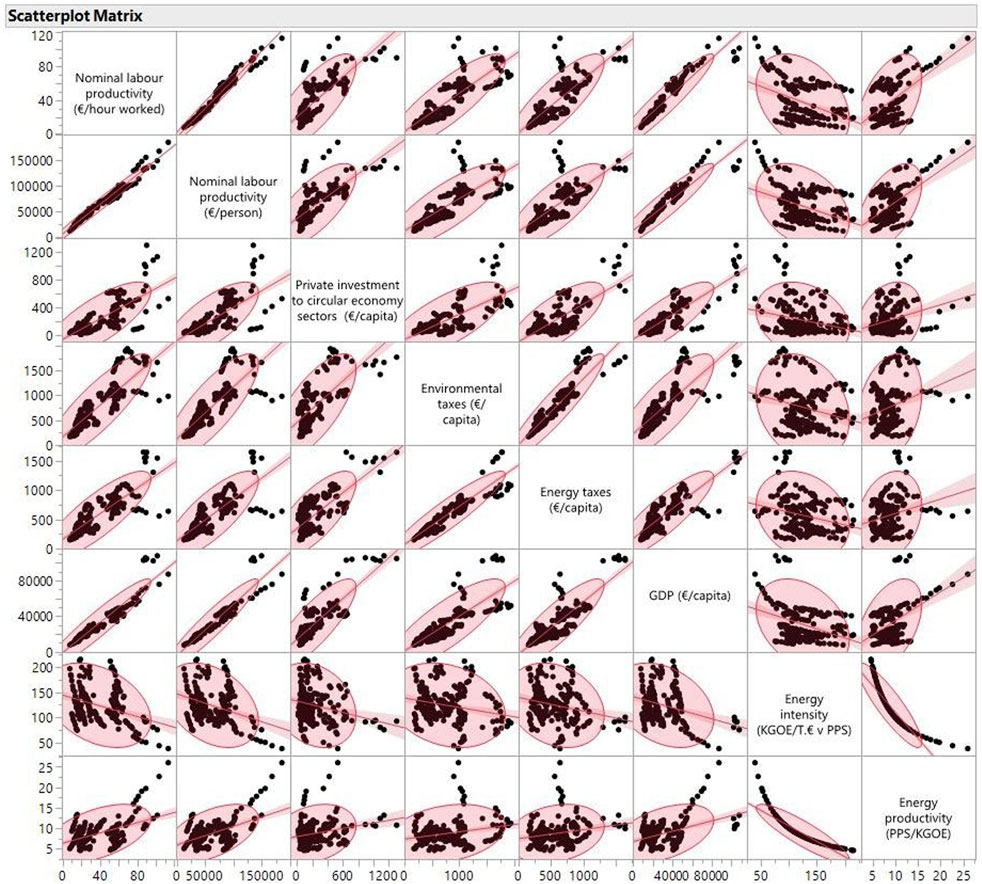
Figure 10. Correlation analysis–graphical matrix.
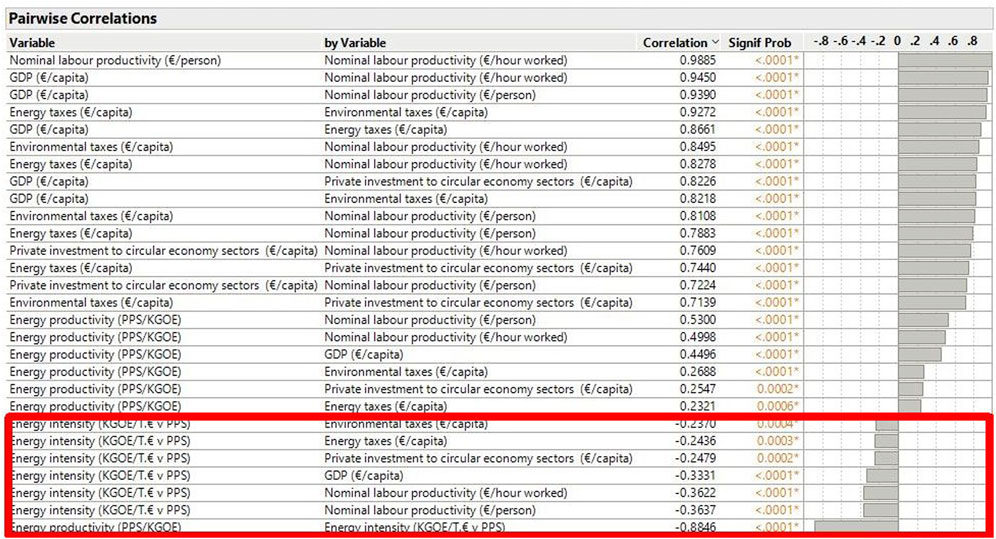
Figure 11. Results of pairwise correlation analysis. Note: Negative statistically significant relationships are highlighted in the red box.
The analysis of linear relationships for each pair of variables identified several pairs with statistically significant correlations (Figure 11). The results showed that all combinations of the selected indicators exhibited statistically significant linear correlations.
To provide a more precise overview of linear relationships, a pairwise Pearson correlation analysis was conducted. Statistically significant correlations were observed between multiple indicators, with p-values lower than 0.05 in all reported cases.
A very strong positive correlation was identified between nominal labor productivity per person and per worked hour (r = 0.9885), reflecting the close conceptual relationship between these two measures. Additionally, GDP per capita was strongly correlated with labor productivity per person (r = 0.9390) and per hour (r = 0.9450), indicating that economic development tends to be associated with increased labor efficiency.
Strong positive correlations were also found between GDP per capita and energy taxes (r = 0.8661), GDP per capita and environmental taxes (r = 0.8218), as well as GDP per capita and private investment to circular economy sectors (r = 0.8226). These results indicate that countries with stronger economic performance tend to also display higher levels of environmental fiscal effort and financial engagement in circular economy initiatives.
Furthermore, environmental taxes and energy taxes were positively correlated (r = 0.9272), and both variables showed significant positive correlations with labor productivity and GDP indicators. These patterns suggest that a group of economic and fiscal variables tends to cluster in countries characterized by stronger economic performance and more developed environmental fiscal frameworks.
In contrast, energy intensity showed negative correlations with all variables, implying that better energy efficiency tends to co-occur with more favorable economic and environmental characteristics. The strongest negative correlation was found between energy intensity and energy productivity (r = −0.8846). Moderate negative correlations were also found with labor productivity per person (r = −0.3637) and GDP per capita (r = −0.3331).
Lastly, energy productivity exhibited weak to moderate positive correlations with economic and environmental indicators, such as GDP (r = 0.4496), environmental taxes (r = 0.2688), and private investment to circular economy sectors (r = 0.2547). Despite being weaker, these relationships remained statistically significant and consistent with theoretical expectations.
Overall, the results of the pairwise correlation analysis revealed the presence of strong interconnections between economic prosperity, environmental fiscal instruments, and investment in sustainable sectors. The negative associations with energy intensity further highlight the relevance of energy efficiency as a component of the circular economy performance and environmental outcomes.
4.3.2 Regression analysis–Private investment to circular economy sectors
Table 2 presents the results of a linear regression analysis examining the relationships between private investment to circular economy sectors and selected economic and energy indicators across EU countries.
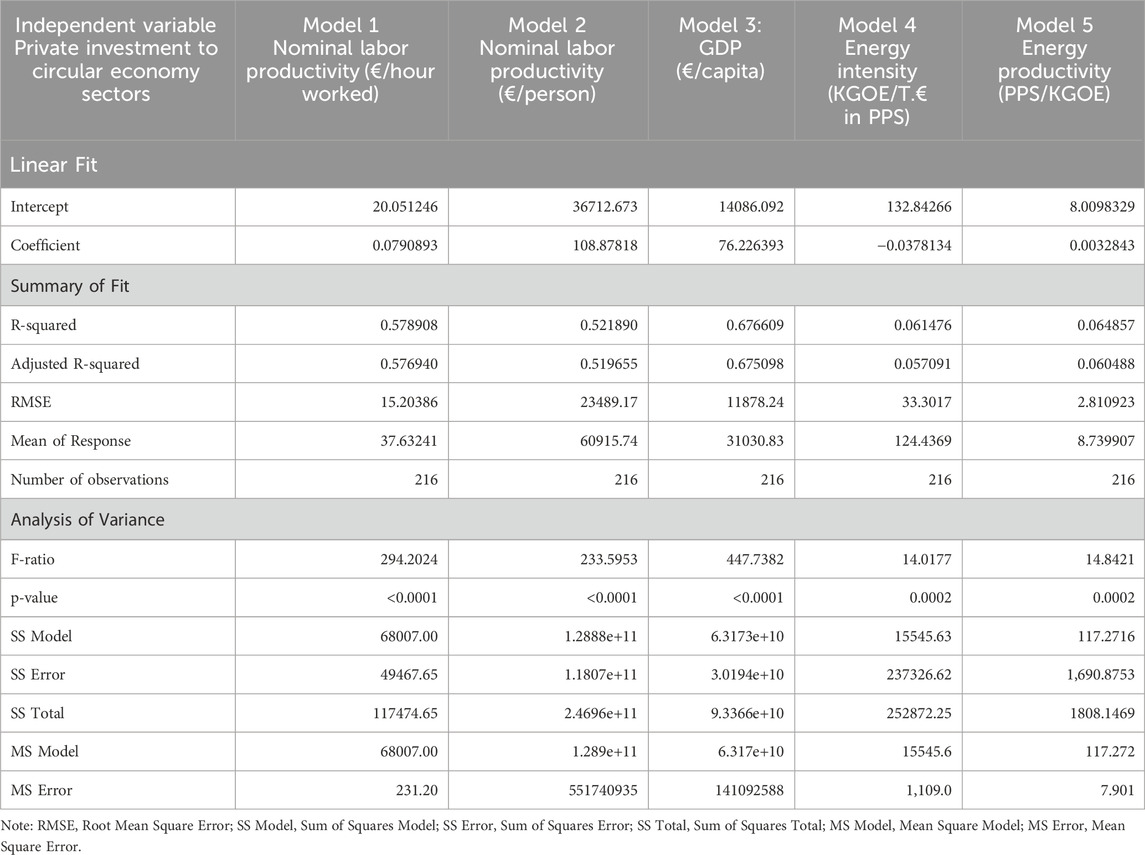
Table 2. Regression analysis–private investment to circular economy sectors (€/capita) and selected economic and energy indicators.
Model 1: A simple linear regression model confirmed a statistically significant and moderately strong relationship between private investment to circular economy sectors and nominal labor productivity per hour. The model was found to be statistically significant, as evidenced by the F-test (F (1, 214) = 294.2024, p < 0.0001), indicating that the independent variable significantly related to variation in the dependent variable. The coefficient of determination (R2 = 0.578908) indicated that approximately 57.89% of the variance in nominal labor productivity was statistically associated with differences in private investment to circular economy sectors. The adjusted R2 value (0.57694) suggested that the explanatory power of the model remained stable after accounting for the number of observations. In summary, a moderately strong and statistically significant positive relationship was identified between private investment to circular economy sectors and nominal labor productivity per worked hour. These findings reflect a statistical pattern in which higher levels of investment in sustainable sectors tend to co-occur with higher labor productivity.
Model 2: Another statistically significant relationship was confirmed between private investment to circular economy sectors and nominal labor productivity per employed person. Evidence of a significant association was found, as demonstrated by the F-statistic (F (1, 214) = 233.5953) and the corresponding p-value below 0.0001. The model explained a substantial portion of the variation in the dependent variable, with an R2 value of 0.52189, indicating that 52.19% of the variation in labor productivity per person was statistically related to private investment to circular economy sectors. The adjusted R2 value of 0.519655 confirmed that this relationship remained robust after accounting for sample size and model complexity. The results pointed to a moderately strong and statistically significant positive relationship between the level of private circular economy investment and labor productivity per employed person. This is in line with the observation that green investment strategies may be aligned with higher levels of labor efficiency and economic performance.
Model 3: The strongest association in the set of models was identified between private investment to circular economy sectors and GDP per capita, as confirmed by the F-test (F (1, 214) = 447.7382, p < 0.0001). The coefficient of determination (R2 = 0.676609) indicated that approximately 67.66% of the variability in GDP per capita corresponded statistically with variation in private investment to circular economy sectors. The adjusted R2 (0.675098) further supported the model’s consistency and its suitability for generalization within the observed sample. Overall, the results revealed a strong and statistically significant positive association between private investment to circular economy sectors and economic output per capita. This finding aligns with theoretical expectations that investment in sustainable sectors may be observed more frequently in economically stronger countries.
Model 4: A significant but weaker relationship was found between private investment to circular economy sectors and energy intensity. The model was found to be statistically significant, as indicated by the F-statistic value (F (1, 214) = 14.0177, p = 0.0002). The analysis results showed a coefficient of determination (R2 = 0.061476) suggesting that only 6.15% of the variance in energy intensity was statistically associated with variation in private investment to circular economy sectors. The adjusted R2 value (0.057091) confirmed the limited explanatory power of the model. Despite the low R2 value, the negative direction of the relationship and its statistical significance indicated that higher private investment to circular economy sectors tends to co-occur with lower energy intensity. This suggests a possible association between sustainable investment and energy intensity, although the relationship remains relatively weak. In conclusion, while the analysis identified a statistically significant inverse relationship between private circular economy investment and energy intensity, the model’s limited explanatory power indicated that other contextual or structural factors may more effectively account for differences in energy efficiency across countries or time periods.
Model 5: The analysis further revealed a positive, though weak, relationship between private investment to circular economy sectors and energy productivity. The results showed that the model was statistically significant, as evidenced by the F-statistic (F (1, 214) = 14.84, p = 0.0002). The coefficient of determination (R2 = 0.064857) indicated that approximately 6.48% of the variability in energy productivity was statistically related to investment levels in circular economy sectors. The adjusted R2 value (0.060488) confirmed the model’s low but statistically significant explanatory capacity. Despite the limited explanatory power, the positive direction of the relationship and its statistical significance suggested that higher levels of private investment to circular economy sectors tend to be observed alongside higher energy productivity. This finding reflects a weak statistical association between sustainable investment and energy productivity, although other variables are likely to play a more substantial role in shaping these outcomes.
4.3.3 Regression analysis–Environmental taxes
Table 3 shows the results of a linear regression analysis examining the relationships between environmental tax revenues and selected economic and energy indicators.
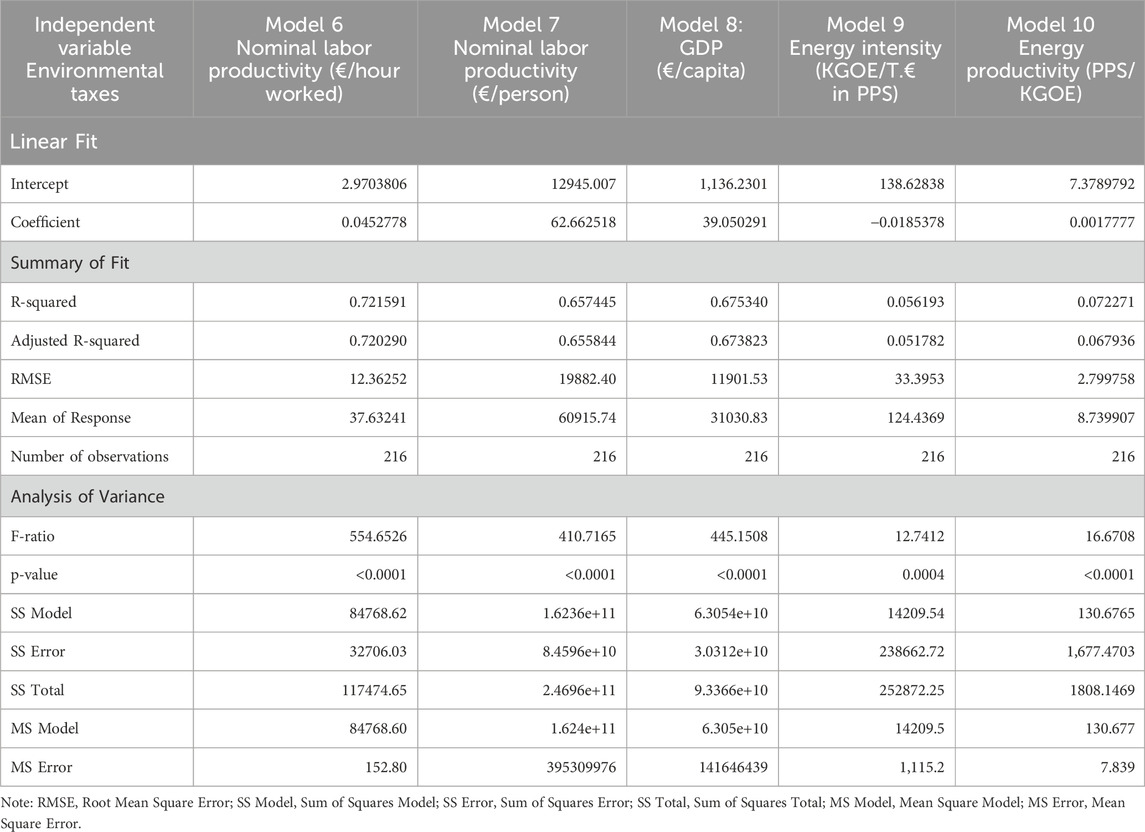
Table 3. Regression analysis–environmental tax revenues (€/capita) and selected economic and energy indicators.
Model 6: A strong and statistically significant relationship was observed between environmental tax revenues and nominal labor productivity per worked hour. The model achieved high explanatory power (R2 = 0.721591; Adjusted R2 0.720290), indicating that over 72% of the variability in hourly labor productivity was statistically associated with variation in environmental tax revenues. The F-statistic (F (1, 214) = 554.6526, p < 0.0001) confirmed the overall significance of the model. These results indicate that countries with higher environmental tax revenues tend to also report more efficient use of labor resources, which may coincide with the presence of cleaner technologies and innovation-oriented production environments.
Model 7: The second model confirmed a similarly strong relationship between environmental tax revenues and nominal labor productivity per employed person. With an R2 of 0.657445 and an adjusted R2 of 0.655844, the model explained over 65% of the observed variation in labor productivity per person. The model was statistically significant (F (1, 214) = 410.7165, p < 0.0001), suggesting that higher fiscal revenues from environmental taxation tend to be associated with broader productivity patterns across the labor force. This association may correspond to structural developments that emerge alongside environmental taxation, such as the rise of more productive sectors or investments in technological upgrading.
Model 8: A strong positive association was also identified between environmental tax revenues and GDP per capita. The regression model explained 67.53% of the variability in economic output (R2 = 0.675340; Adjusted R2 = 0.673823) and was statistically significant (F (1, 214) = 445.1508, p < 0.0001). These findings suggest that environmental taxes may be present more frequently in countries with higher economic development levels, potentially reflecting the use of tax revenues for green investment or a general alignment with resource-efficient growth models. However, as with other economic indicators, this association likely reflects deeper institutional and structural characteristics that shape both taxation and economic performance.
Model 9: A weak but statistically significant relationship was found between environmental tax revenues and energy intensity. The model’s R2 reached only 0.056193 (Adjusted R2 = 0.051782), indicating that just over 5% of the variation in energy intensity was statistically associated with variation in tax revenues. The regression was statistically significant (F (1, 214) = 12.7412, p = 0.0004), indicating a small but relevant link. The negative coefficient suggested that higher environmental tax revenues tend to be observed alongside slightly lower energy intensity, though the limited explanatory power pointed to the dominant influence of other factors such as industrial structure, energy mix, and regulatory frameworks.
Model 10: Lastly, a modest but statistically significant positive relationship was observed between environmental tax revenues and energy productivity. The model explained approximately 7.23% of the variation in energy productivity (R2 = 0.072271; Adjusted R2 = 0.067936) and was supported by a significant F-statistic (F (1, 214) = 16.6708, p < 0.0001). Although the strength of the association was limited, the results indicate that higher environmental tax revenues may correspond with more favorable energy productivity outcomes. This may be interpreted as being statistically consistent with broader patterns of cleaner technologies, improved energy use management, or pricing systems that internalize environmental considerations.
4.3.4 Regression analysis–Energy taxes
Table 4 offers the results of a linear regression analysis examining the relationships between energy tax revenues and selected economic and energy indicators across EU countries.
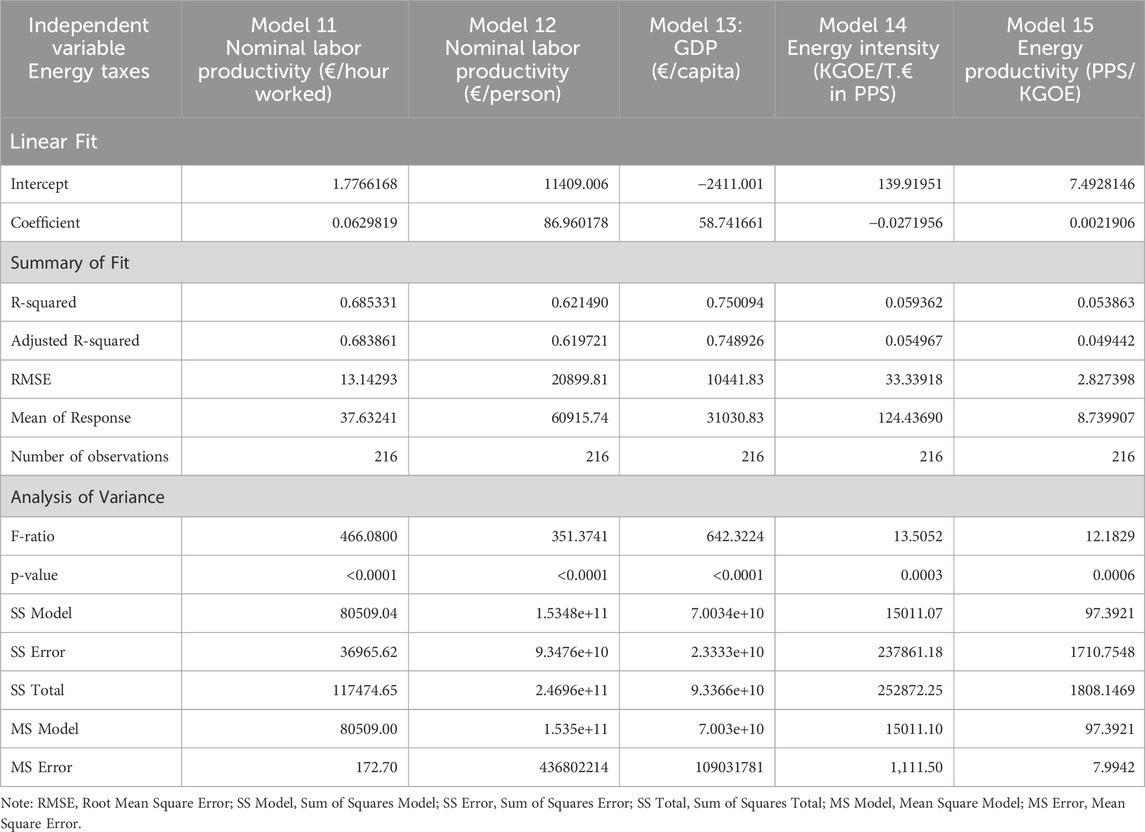
Table 4. Regression analysis–energy tax revenues (€/capita) and selected economic and energy indicators.
Model 11: A statistically significant and moderately strong relationship was found between energy tax revenues and nominal labor productivity per worked hour. The model explained approximately 68.5% of the variation in the dependent variable (R2 = 0.685331; Adjusted R2 = 0.683861), and the F-statistic (F (1, 214) = 466.0800, p < 0.0001) confirmed its significance. The results indicate that countries collecting more energy taxes tend to also report higher labor productivity per hour, potentially reflecting a broader alignment with more efficient and less energy-intensive production structures.
Model 12: The association between energy taxes and labor productivity per employed person was also statistically significant, with an R2 of 0.62149 and an adjusted R2 of 0.619721. The model explained over 62% of labor productivity variation and was supported by a strong F-statistic (F (1, 214) = 351.3741, p < 0.0001). These findings suggest that higher energy tax revenues tend to be observed in countries with higher aggregate labor productivity, which may correspond to broader structural changes such as improvements in resource efficiency or technology adoption.
Model 13: The strongest association among these five models was observed between energy tax revenues and GDP per capita. The regression explained 75% of the variation in GDP (R2 = 0.750094; Adjusted R2 = 0.748926), with a highly significant F-value (F (1, 214) = 642.3224, p < 0.0001). This reflects a strong statistical association between energy taxation and national economic performance. While causality cannot be inferred directly, the results align with the idea that fiscal environmental instruments may co-occur with economic growth under specific institutional or policy conditions.
Model 14: A weak but statistically significant negative relationship was found between energy tax revenues and energy intensity. The model’s explanatory power was low (R2 = 0.059362; Adjusted R2 = 0.054967), though the regression was statistically significant (F (1, 214) = 13.5052, p = 0.0003). The negative coefficient indicated a co-occurrence between higher energy tax revenues and slightly lower energy intensity, which may be statistically consistent with more favorable energy performance characteristics. However, the limited variance explained implied that other variables, such as industrial structure or regulatory design, likely played a more dominant role.
Model 15: Finally, the analysis revealed a weak but significant positive association between energy tax revenues and energy productivity. With an R2 of 0.053863 and adjusted R2 of 0.049442, the model explained a small share of variability in energy productivity, yet the F-statistic (F (1, 214) = 12.1829, p = 0.0006) confirmed the model’s statistical significance. These results suggest that energy tax revenues may co-occur with slightly better energy productivity, possibly reflecting environments with greater emphasis on energy efficiency measures or shifts in market behavior.
5 Discussion
The conducted analyses revealed several statistically significant relationships between private investment to circular economy sectors, environmental and energy tax revenues, and key macroeconomic and energy-related indicators across the EU. Notably, a moderately strong positive association was identified between private circular economy investment and both labor productivity and GDP per capita. This suggests that such investment may be more than symbolic, as it tends to co-occur with stronger economic performance across Member States. The findings suggest that countries investing more intensively in sustainable sectors tend to also report stronger economic performance. This pattern underscores the role of investment as a potential enabler of broader development. While some previous research has noted similar tendencies (Agrawal et al., 2024; Zhongping et al., 2023; Wan and Sheng, 2022; Lyeonov et al., 2019), the present analysis adds value by highlighting specific disparities within the EU context. However, the strength of this association varied substantially across Member States, reflecting deeper structural and institutional differences. For example, countries such as Luxembourg, Austria, and the Netherlands—characterized by higher investment levels—also benefit from stronger administrative capacities, more developed capital markets, and strategic frameworks for promoting green sectors. In contrast, countries with lower investment levels, such as Bulgaria and Romania, may face systemic limitations, including constrained access to private financing, regulatory uncertainty, and weaker infrastructure for supporting circular innovation. These differences were also confirmed by descriptive analysis and Kruskal–Wallis test results (Figures 4, 5), which showed statistically significant disparities in private investment levels across EU Member States. These disparities suggest that targeted policy measures are needed to help lower-income Member States overcome structural barriers. Expanding access to green finance, supporting local capacity building, and integrating circular economy principles into national development plans may help improve both investment effectiveness and economic outcomes. The current analysis thus reinforces earlier empirical findings while highlighting how national context conditions the observed relationships across the EU.
Additionally, a statistically significant negative association was found between private investment to circular economy sector and energy intensity, along with a positive link to energy productivity. Despite these statistically significant results, the explanatory power of the models was relatively weak (R2 < 0.07), suggesting that other structural or technological factors likely play a more prominent role in shaping energy-related outcomes. This limited predictive strength may reflect the fact that energy intensity and productivity are influenced by a complex mix of variables, including the national energy mix, industrial structure, technological readiness, and levels of regulatory enforcement. For instance, countries with similar investment levels may show different energy performance trajectories depending on how efficiently energy is used in key sectors, or whether investment flows into genuinely transformative innovations. These nuances are important when formulating policy recommendations: in lower-income EU countries, improving the effectiveness of green investment may require complementary reforms in energy infrastructure, innovation support systems, and sectoral modernization. While earlier studies reported similar associations between green investment and energy efficiency improvements (e.g., Dong et al., 2023; Rasoulinezhad and Taghizadeh-Hesary, 2022), the results of this study highlight the need to interpret such associations in light of national-level constraints and policy contexts.
The second part of the regression analysis explored the relationship between environmental tax revenues and economic and energy-related outcomes. A significant and positive relationship was found between environmental taxes and indicators such as labor productivity, GDP per capita. This co-occurrence supports the notion that environmental taxation may reflect broader institutional strength, as also reflected in the literature (Cao et al., 2024; Mirović et al., 2023). This suggests that countries with higher environmental tax revenues tend to exhibit stronger economic performance, which may reflect more advanced fiscal frameworks, higher administrative efficiency, and greater capacity for strategic reinvestment of public resources. However, the strength of this relationship is not uniform across the EU. As illustrated in Figures 6, 7, there are substantial disparities in environmental tax revenues per capita, with countries such as Denmark, Luxembourg, and the Netherlands collecting over four times more per capita than countries like Bulgaria, Romania, or Hungary. These differences may stem from structural variations in tax bases, economic composition, energy consumption patterns, and enforcement capacity. For lower-income Member States, strengthening the role of environmental taxation may require foundational reforms in tax administration, increased transparency in revenue use, and integration of green fiscal measures into broader economic development strategies. While previous studies have emphasized the economic benefits of green taxation (e.g., Suhányi et al., 2024; Hassan et al., 2020a), the current findings reinforce these arguments by demonstrating that labor productivity and GDP per capita tend to co-occur with higher levels of environmental tax revenue. These results underline the broader relevance of green fiscal tools for promoting economically sustainable transitions across EU Member States.
The current study also revealed a weak but statistically significant positive relationship between environmental tax revenues and energy productivity, as well as a weak negative association with energy intensity. These results indicate that higher levels of green taxation tend to co-occur with slightly better energy performance, though the relationships remain limited in strength and consistency. The low explanatory power of the models (R2 < 0.07) suggests that energy-related outcomes are shaped by a more complex interplay of structural, institutional, and technological factors. For example, countries with comparable tax levels may exhibit differing energy trajectories depending on how fiscal resources are allocated, the extent of technological uptake, or the presence of supportive governance frameworks. Energy productivity is also conditioned by national energy mixes—countries relying heavily on fossil fuels or coal-based power generation may find it more difficult to improve energy performance metrics, regardless of tax levels. Similarly, economies dominated by energy-intensive industries, such as metallurgy or heavy manufacturing, typically face structural constraints in reducing energy intensity, compared to service-oriented or digitally advanced economies. As visualized in Figures 6, 7, considerable cross-country variation in environmental tax revenues may contribute to these heterogeneous patterns. These findings underscore the importance of situating environmental taxation within a broader strategic context that includes innovation support, infrastructure development, and administrative strengthening—particularly in Member States with limited fiscal capacity. The results are in line with earlier research suggesting that environmental taxation may accompany broader structural shifts and long-term improvements in energy productivity when embedded within comprehensive policy packages (e.g., Li et al., 2023; Yasmeen et al., 2023; Xie and Jamaani, 2022; Bashir et al., 2021). In this context, environmental taxes should be seen not as isolated levers, but as one part of an integrated policy landscape oriented toward sustainable energy transition.
Finally, the last set of regression models focused on energy tax revenues and their association with economic and energy indicators. The strongest association was observed between energy tax revenues and GDP per capita, suggesting that higher fiscal contributions from energy-related taxation tend to co-occur with more prosperous economies. This relationship may reflect broader institutional and structural conditions, including tax policy design, administrative effectiveness, and the degree of economic diversification. These findings illustrate a potentially complex and context-sensitive relationship between energy taxation and economic performance. This interpretation is broadly aligned with insights from earlier research (Mirović et al., 2023; Hassan et al., 2021). These patterns may reflect structural asymmetries across EU Member States. Countries with lower income levels and greater reliance on fossil fuels for industrial production may face challenges in generating substantial energy tax revenues, whereas wealthier and more diversified economies are typically better positioned to implement and sustain comprehensive fiscal measures in the energy sector. Differences in policy coordination, administrative capacity, and the elasticity of energy demand likely contribute to these observed variations. In this study, a statistically significant positive relationship was also found between energy tax revenues and labor productivity. Although research on this specific link remains limited, existing evidence suggests that in settings with targeted tax incentives or reinvestment into innovation, improvements in energy use may coincide with gains in productivity (e.g., Liu and Xia, 2023). Overall, the results reinforce the idea that the observed patterns are shaped by multiple country-specific variables, such as the structure of the tax base, the composition of energy consumption, and the degree of reliance on energy-intensive industries. The wide disparities in energy tax revenues across the EU, as shown in Figures 8, 9, further underline the need to view these associations within a differentiated policy framework.
A significant negative relationship was identified between energy tax revenues and energy intensity, indicating that higher levels of energy taxation tend to co-occur with lower energy input per unit of economic output. While this relationship was statistically significant, its strength was limited, and the overall explanatory power of the model remained low. This limited explanatory strength suggests that improvements in energy efficiency are likely shaped by a wider array of interrelated factors. Among these, industrial specialization, the structure of energy consumption, and the prevailing energy mix appear particularly relevant. For instance, countries with a high share of energy-intensive industries or dependence on coal-based power generation may face persistent challenges in reducing energy intensity, regardless of the level of taxation. In contrast, economies with more diversified sectoral profiles or cleaner energy portfolios may be better positioned to align fiscal instruments with energy performance goals. These observations are consistent with the broader literature on energy taxation and efficiency (e.g., Sackitey, 2023; He et al., 2019; Adetutu et al., 2020), and reflect the idea that energy taxation is often part of a wider set of conditions rather than a standalone mechanism. In this study, a weak positive association was also identified between energy tax revenues and energy productivity. Although the relationship was weak, it may indicate that more extensive taxation frameworks tend to co-occur with marginal improvements in how efficiently economies utilize energy resources. This notion has also been explored in earlier study (Freire-González, 2020). Together, these findings underscore the relevance of national regulatory contexts, structural economic profiles, and technological capacities, which may either enable or constrain the realization of more favorable energy outcomes in connection with fiscal measures.
In sum, the findings of this study confirmed that private investment to circular economy sectors and environmental fiscal instruments, particularly environmental and energy taxes, tended to co-occur with stronger performance across several macroeconomic and energy-related indicators indicators in the EU context. However, the explanatory power of these variables differed substantially across models, underscoring the importance of including broader institutional, technological, and policy-related factors in future analyses. The most consistent patterns were observed in relation to economic output and labor productivity, while the statistical associations with energy-related metrics were weaker, likely due to a more complex set of structural and contextual conditions that shape energy performance across Member States.
5.1 Implications
The results of this study carried several important implications for economic policy, fiscal design, and future research on sustainable development in the EU. First, a statistically significant association was found between private investment to circular economy sectors and labor productivity as well as GDP per capita. This suggests that policy instruments such as public support schemes, incentives, or co-financing mechanisms aimed at circular economy investment may be aligned with both environmental goals and broarder economic development. Policymakers may therefore consider treating investment in circularity as a strategic area with potential for positive co-occurrence with productivity and income growth.
Second, environmental and energy tax revenues were found to be positively associated with labor productivity and GDP per capita, and negatively—though weakly—with energy intensity. These results indicate that environmental fiscal instruments, when appropriately designed and consistently implemented, may correspond with multiple economic and energy-related objectives. However, the limited explanatory power of the models related to energy indicators suggests that taxation alone is unlikely to drive energy performance, and that such instruments should be embedded within broader frameworks involving innovation policy, infrastructure modernization, and institutional strengthening.
Furthermore, the observed heterogeneity of results across countries and variables indicated that contextual differences played a crucial role in shaping the statistical relationships between green investment, taxation, and performance outcomes. This highlights the importance of tailoring environmental fiscal strategies to the specific characteristics of each Member State, including national economic structure, energy mix, and institutional administrative capacity. In this regard, the substantial cross-country differences identified through variability analysis suggest that countries with lower levels of green investment and environmental taxation—particularly in Eastern and Southern Europe—may benefit from targeted interventions such as technical assistance for fiscal reform, improved access to green finance, and gradual alignment with EU best practices. Policymakers in these countries could also explore mechanisms to reduce the administrative burden of tax compliance, strengthen institutional enforcement, and build capacity in local governance to ensure effective policy delivery. Such targeted measures may support convergence and enhance the feasibility of common sustainability objectives within the EU.
In addition, the evidence points to the limitations of uniform policy templates. One-size-fits-all approaches may yield uneven outcomes if local economic or institutional conditions are not taken into account. Environmental fiscal design should therefore be considered part of a differentiated and adaptive policy toolkit.
In summary, the findings of this study suggest that both green investment and environmental taxation are statistically associated with multiple dimensions of economic and energy performance. However, their potential contribution to sustainability objectives may depend on integration into broader, well-coordinated national policy environments.
6 Conclusion
This study investigated the relationship between private investment in circular economy sectors, environmental and energy tax revenues, and selected economic and energy indicators across EU countries. The findings confirmed several statistically significant associations, particularly between the examined fiscal variables and labor productivity or GDP per capita. These relationships suggest that green investment and taxation mechanisms tent to be associated with both microeconomic efficiency and broader economic development patterns. The results are consistent with the view that both investment and taxation in the context of the green economy may be linked to more favorable economic outcomes.
At the same time, weaker relationships were identified for energy intensity and energy productivity, and the overall explanatory power of certain models remained limited. This indicated that fiscal and investment variables alone may not sufficiently explain variation in energy-related outcomes across countries. It was therefore concluded that while green investment and fiscal tools represent important elements of sustainable development strategies, their observed statistical relationships appear to vary depending on broader institutional, technological, and regulatory frameworks.
In addition to the regression results, the variability analysis revealed substantial cross-country differences in the levels of private circular economy investment, environmental taxes, and energy tax revenues. Countries such as Luxembourg, Denmark, and the Netherlands consistently ranked among the highest performers across all indicators, highlighting their advanced fiscal systems and strong commitment to sustainability. In contrast, countries like Bulgaria and Romania recorded significantly lower values, pointing to structural and institutional limitations in implementing green financial mechanisms. These disparities suggest that the relevance of investment and taxation tools is shaped not only by policy design but also by the broader economic, political, and administrative context of each country. The results therefore indicate that strategies for promoting sustainable development in the EU may need to be adapted to national conditions, with attention given to capacity-building and the harmonization of fiscal and environmental objectives across Member States.
From a policy perspective, the findings suggest that support for circular investment and the strategic design of environmental taxes may be aligned with both environmental and economic goals. Greater attention should also be paid to the role of complementary policy instruments and contextual factors, which may shape the outcomes associated with green economic measures.
6.1 Limitations
This study faced several limitations. Causality was not examined, and although significant relationships were identified, no conclusions about causal effects could be drawn. Potential endogeneity may have influenced the results, as some explanatory variables could have been simultaneously affected by the dependent variables. This might have introduced bias into the estimated coefficients. Moreover, despite statistical significance, the explanatory power of some models remained low, suggesting that the independent variables captured only a limited portion of the variability in the dependent variables. In particular, models related to energy intensity and energy productivity showed R2 values below 0.07, indicating a limited ability to explain variance in energy-related outcomes. This should be taken into account when interpreting the findings, as the results may reflect partial associations rather than comprehensive explanatory patterns. As such, the statistical relationships presented in the study should be interpreted as indicative rather than definitive. Finally, the analysis relied on macro-level indicators, which may not fully capture cross-country differences in institutional or sectoral structures.
6.2 Future research
Future research should aim to address the limitations identified in this study by applying advanced econometric techniques such as dynamic panel models or instrumental variable approaches to better account for endogeneity and explore causality. It is also recommended that future analyses incorporate additional explanatory variables, including institutional quality, technological readiness, or sectoral structure, to enhance the explanatory power of the models. Expanding the time horizon and using longitudinal data may also help to capture delayed effects and better assess the long-term impacts of sustainable fiscal and investment strategies.
Data availability statement
The original contributions presented in the study are included in the article/Supplementary Material, further inquiries can be directed to the corresponding author.
Author contributions
VI: Writing – original draft, Conceptualization, Visualization, Investigation, Formal Analysis, Resources, Writing – review and editing. MT: Methodology, Visualization, Formal Analysis, Data curation, Writing – review and editing, Writing – original draft, Software. MC: Supervision, Project administration, Validation, Writing – review and editing, Visualization, Conceptualization. SK: Validation, Project administration, Supervision, Investigation, Funding acquisition, Writing – review and editing, Resources.
Funding
The author(s) declare that financial support was received for the research and/or publication of this article. This research was supported by the Scientific Grant Agency of the Ministry of Education, Research, Development and Youth of the Slovak Republic and the Slovak Academy Sciences as a part of the research project VEGA 1/0328/25: Strategy for effective and sustainable use of Earth Resources within the Slovak Republic with an emphasis on the Raw Materials Policy of the EU.
Acknowledgments
The authors thank the journal editor and reviewers for their guidance and constructive suggestions.
Conflict of interest
The authors declare that the research was conducted in the absence of any commercial or financial relationships that could be construed as a potential conflict of interest.
Generative AI statement
The author(s) declare that no Generative AI was used in the creation of this manuscript.
Publisher’s note
All claims expressed in this article are solely those of the authors and do not necessarily represent those of their affiliated organizations, or those of the publisher, the editors and the reviewers. Any product that may be evaluated in this article, or claim that may be made by its manufacturer, is not guaranteed or endorsed by the publisher.
Supplementary material
The Supplementary Material for this article can be found online at: https://www.frontiersin.org/articles/10.3389/fenvs.2025.1607573/full#supplementary-material
References
Abdullah, S., and Morley, B. (2014). Environmental taxes and economic growth: Evidence from panel causality tests. Energy Econ. 42, 27–33. doi:10.1016/j.eneco.2013.11.013
Adetutu, M. O., Odusany, K. A., and Weyman-Jones, T. G. (2020). Carbon tax and energy intensity: assessing the channels of impact using UK microdata. Energy J. 41 (2), 143–166. doi:10.5547/01956574.41.2.made
Agrawal, R., Agrawal, S., Samadhiya, A., Kumar, A., Luthra, S., and Jain, V. (2024). Adoption of green finance and green innovation for achieving circularity: an exploratory review and future directions. Geosci. Front. 15 (4), 101669. doi:10.1016/j.gsf.2023.101669
Ahmad, F., Abid, N., Aftab, J., and Javed, A. (2025). Tracing the trajectories of energy intensity, environmental tax revenues, and environmental neutrality in major European economies. Energy Strategy Rev. 58, 101650. doi:10.1016/j.esr.2025.101650
Ahmed, N., Sheikh, A. A., Hamid, Z., Senkus, P., Borda, R. C., Wysokińska-Senkus, A., et al. (2022). Exploring the causal relationship among green taxes, energy intensity, and energy consumption in Nordic countries: dumitrescu and Hurlin causality approach. Energies 15 (14), 5199. doi:10.3390/en15145199
Almeida, D. (2021). Tax changes, budgetary effect, and economic growth. Cad. Financ. Públicas 20 (3). doi:10.55532/1806-8944.2020.97
Bashir, M. F., Ma, B., Shahbaz, M., Shahzad, U., and Vo, X. V. (2021). Unveiling the heterogeneous impacts of environmental taxes on energy consumption and energy intensity: empirical evidence from OECD countries. Energy 226, 120366. doi:10.1016/j.energy.2021.120366
Beladi, H., Chen, P., Chu, H., Hu, M., and Lai, C. (2021). Environmental taxes and economic growth with multiple growth engines. B.E. J. Macroecon. 21 (2), 629–658. doi:10.1515/bejm-2020-0108
Borozan, D. (2018). Efficiency of energy taxes and the validity of the residential electricity environmental Kuznets curve in the European Union. Sustainability 10 (7), 2464. doi:10.3390/su10072464
Bovenberg, A. L., and de Mooij, R. A. (1997). Environmental tax reform and endogenous growth. J. Public Econ. 63 (2), 207–237. doi:10.1016/S0047-2727(96)01596-4
Cai, L. (2010). The relationship between health and labour force participation: evidence from a panel data simultaneous equation model. Labour Econ. 17 (1), 77–90. doi:10.1016/j.labeco.2009.04.001
Cao, Y., Lin, S., Li, M., Shan, Y., and Wang, P. (2024). Green taxes: productivity effects of tax-based environmental regulations on heavily polluting firms. Econ. Model. 140, 106834. doi:10.1016/j.econmod.2024.106834
Çelebi Boz, F., and Örs Onur, T. (2024). Çevre vergileri, karbon emisyonu ile ekonomik büyüme arasındaki i̇lişki: OECD ülkeleri üzerine bir analiz. Sosyoekonomi 32 (59), 325–342. doi:10.17233/sosyoekonomi.2024.01.14
Chatzistamoulou, N., and Koundouri, P. (2024). Is green transition in Europe fostered by energy and environmental efficiency feedback loops? The role of eco-innovation, renewable energy and green taxation. Environ. Resour. Econ. 87 (6), 1445–1472. doi:10.1007/s10640-024-00849-y
Chontanawat, J., Hunt, L. C., and Pierse, R. (2008). Does energy consumption cause economic growth? Evidence from a systematic study of over 100 countries. J. Policy Model. 30 (2), 209–220. doi:10.1016/j.jpolmod.2006.10.003
Cigu, E., Petrişor, M.-B., Nuță, A.-C., Nuță, F.-M., and Bostan, I. (2020). The nexus between financial regulation and green sustainable economy. Sustainability 12 (21), 8778. doi:10.3390/su12218778
de Mooij, R. A. (2020). Tax policy and inclusive growth. IMF Work. Pap. 2020 (271). doi:10.5089/9781513561561.001
Dinda, S. (2004). Environmental Kuznets curve hypothesis: a survey. Ecol. Econ. 49 (4), 431–455. doi:10.1016/j.ecolecon.2004.02.011
Domguia, E. N., Ngounou, B. A., Pondie, T. M., and Bitoto, F. E. (2024). Environmental tax and energy poverty: an economic approach for an environmental and social solution. Energy 308, 132935. doi:10.1016/j.energy.2024.132935
Dong, K., Zeng, S., Wang, J., and Taghizadeh-Hesary, F. (2023). Assessing the role of green investment in energy efficiency: does digital economy matter? Energy explor. Exploit. 42 (4), 1450–1471. doi:10.1177/01445987231216763
Eurostat (2025a). Energy intensity. Available online at: https://ec.europa.eu/eurostat/databrowser/view/nrg_ind_ei/default/table?lang=en&category=nrg.nrg_quant.nrg_quanta.nrg_ind (Accessed March 2, 2025).893–895. doi:10.1007/978-981-97-4036-9_422
Eurostat (2025b). Energy productivity. Available online at: https://ec.europa.eu/eurostat/databrowser/view/nrg_ind_ep/default/table?lang=en&category=nrg.nrg_quant.nrg_quanta.nrg_ind (Accessed March 2, 2025).193–195. doi:10.4337/9781035310371.00055
Eurostat (2025c). Energy taxes. Available online at: https://ec.europa.eu/eurostat/databrowser/view/ten00139/default/table?lang=en&category=t_env.t_env_eta (Accessed March 2, 2025).
Eurostat (2025d). Environmental tax revenues. Available online at: https://ec.europa.eu/eurostat/databrowser/view/env_ac_tax/default/table?lang=en&category=env.env_eta (Accessed March 2, 2025).
Eurostat (2025e). GDP per capita. Available online at: https://ec.europa.eu/eurostat/databrowser/view/sdg_08_10/default/table?lang=en (Accessed March 2, 2025).
Eurostat (2025f). Labour productivity and unit labour. Available online at: https://ec.europa.eu/eurostat/databrowser/view/nama_10_lp_ulc/default/table?lang=en&category=na10.nama10.nama_10_prod.nama_10_lpc (Accessed March 2, 2025).
Eurostat (2025g). Population. Available online at: https://ec.europa.eu/eurostat/databrowser/view/demo_pjan/default/table?lang=en&category=demo.demo_pop (Accessed March 2, 2025).
Eurostat (2025h). Private investment to circular economy sectors. Available online at: https://ec.europa.eu/eurostat/databrowser/view/cei_cie012__custom_15540027/default/table?lang=en (Accessed March 2, 2025).
Fang, G., Tian, L., Fu, M., and Sun, M. (2013). The impacts of carbon tax on energy intensity and economic growth – a dynamic evolution analysis on the case of China. Appl. Energy 110, 17–28. doi:10.1016/j.apenergy.2013.04.041
Fatur Šikić, T., and Hodžić, S. (2023). Can environmental taxes decrease final energy consumption in the old and new EU countries? Econ. Res.-Ekon. Istraživanja 36 (3), 2271968. doi:10.1080/1331677X.2023.2271968
Freire-González, J. (2020). Energy taxation policies can counteract the rebound effect: analysis within a general equilibrium framework. Energy Effic. 13, 69–78. doi:10.1007/s12053-019-09830-x
Grossman, G. M., and Krueger, A. B. (1995). Economic growth and the environment. Q. J. Econ. 110 (2), 353–377. doi:10.2307/2118443
Hassan, M., Oueslati, W., and Rousselière, D. (2020a). Environmental taxes, reforms and economic growth: an empirical analysis of panel data. Econ. Syst. 44 (3), 100806. doi:10.1016/j.ecosys.2020.100806
Hassan, M., Oueslati, W., and Rousselière, D. (2020b). Exploring the link between energy-based taxes and economic growth. Environ. Econ. Policy Stud. 22 (1), 67–87. doi:10.1007/s10018-019-00247-5
Hassan, M., Oueslati, W., and Rousselière, D. (2021). Energy taxes and economic growth in OECD countries: a simultaneous equations approach. J. Environ. Econ. Policy 11 (2), 172–195. doi:10.1080/21606544.2021.1937326
He, P., Sun, Y., Shen, H., Jian, J., and Yu, Z. (2019). Does environmental tax affect energy efficiency? An empirical study of energy efficiency in OECD countries based on DEA and logit model. Sustainability 11 (14), 3792. doi:10.3390/su11143792
Ignjatijević, S., Aničić, A., Vapa–Tankosić, J., and Belokapić-Čavkunović, J. (2020). Determining relationship between economic growth and environmental protection. Oditor 6 (1), 38–48. doi:10.5937/oditor2001036i
Jänicke, M. (2008). Ecological modernisation: new perspectives. J. Clean. Prod. 16 (5), 557–565. doi:10.1016/j.jclepro.2007.02.011
Kneller, R., Bleaney, M. F., and Gemmell, N. (1999). Fiscal policy and growth: evidence from OECD countries. J. Public Econ. 74 (2), 171–190. doi:10.1016/S0047-2727(99)00022-5
Lel, U. (2024). Green revenues, greener margins: the global financial impact of eco-friendly products. Eur. Corp. Gov. Inst. Finance Work. Pap. 2024 (980). doi:10.2139/ssrn.4823664
Li, Y., Zhou, M., Sun, H., and Liu, J. (2023). Assessment of environmental tax and green bonds impacts on energy efficiency in the European Union. Econ. Change Restruct. 56 (2), 1063–1081. doi:10.1007/s10644-022-09465-6
Lin, B., and Jia, Z. (2018). The energy, environmental and economic impacts of carbon tax rate and taxation industry: a CGE based study in China. Energy 159, 558–568. doi:10.1016/j.energy.2018.06.167
Liu, Q., and Xia, Y. (2023). The energy-saving effect of tax rebates: the impact of tax refunds on corporate total factor energy productivity. Energies 16 (23), 7795. doi:10.3390/en16237795
Lyeonov, S., Pimonenko, T., Bilan, Y., Štreimikienė, D., and Mentel, G. (2019). Assessment of green investments’ impact on sustainable development: linking gross domestic product per capita, greenhouse gas emissions and renewable energy. Energies 12 (20), 3891. doi:10.3390/en12203891
Ma, N., Liu, P., Xiao, Y., Tang, H., and Zhang, J. (2022). Can green technological innovation reduce hazardous air pollutants? an empirical test based on 283 cities in China. Int. J. Environ. Res. Public Health 19 (3), 1611. doi:10.3390/ijerph19031611
Máté, D., Török, L., and Kiss, J. T. (2023). The impacts of energy supply and environmental taxation on carbon intensity. Technol. Econ. Dev. Econ. 29 (4), 1195–1215. doi:10.3846/tede.2023.18871
Mathieu-Bolh, N., and Pautrel, X. (2011). Environmental tax, morbidity and productivity profile. Rev. Econ. 62 (3), 501–509. doi:10.3917/reco.623.0501
Mirović, V., Kalaš, B., Andrašić, J., and Milenković, N. (2023). Implications of environmental taxation for economic growth and government expenditures in Visegrad Group countries. Polit. Ekon. 71 (4), 422–446. doi:10.18267/j.polek.1391
Mol, A. P. J., and Sonnenfeld, D. A. (2000). Ecological modernization around the world: perspectives and critical debates. New York: Routledge. doi:10.4324/9781315877808
Nilsson, L. J. (1993). Energy intensity trends in 31 industrial and developing countries 1950–1988. Energy 18 (4), 309–322. doi:10.1016/0360-5442(93)90066-m
Nong, D. (2018). General equilibrium economy-wide impacts of the increased energy taxes in Vietnam. Energy Policy 123, 471–481. doi:10.1016/j.enpol.2018.09.023
Ono, T. (2003). Environmental tax policy and long-run economic growth. Jpn. Econ. Rev. 54 (2), 203–217. doi:10.1111/1468-5876.00254
Ouyang, X., Li, Q., and Du, K. (2020). How does environmental regulation promote technological innovations in the industrial sector? Evidence from Chinese provincial panel data. Energy Policy 139, 111310. doi:10.1016/j.enpol.2020.111310
Panait, M., Apostu, S. A., Vasile, V., and Vasile, R. (2022). Is energy efficiency a robust driver for the new normal development model? A Granger causality analysis. Energy Policy 169, 113162. doi:10.1016/j.enpol.2022.113162
Pope, C. A., Burnett, R. T., Thun, M. J., Calle, E. E., Krewski, D., Ito, K., et al. (2002). Lung cancer, cardiopulmonary mortality, and long-term exposure to fine particulate air pollution. JAMA 287 (9), 1132–1141. doi:10.1001/jama.287.9.1132
Porter, M. E., and van der Linde, C. (1995). Toward a new conception of the environment-competitiveness relationship. J. Econ. Perspect. 9 (4), 97–118. doi:10.1257/jep.9.4.97
Qi, J., Song, Y., and Zhang, Y. (2023). Environmental protection tax and energy efficiency: evidence from Chinese city-level data. Energies 16 (24), 8104. doi:10.3390/en16248104
Rasoulinezhad, E., and Taghizadeh-Hesary, F. (2022). Role of green finance in improving energy efficiency and renewable energy development. Energy Effic. 15 (2), 14. doi:10.1007/s12053-022-10021-4
Sackitey, G. L. (2023). Do environmental taxes affect energy consumption and energy intensity? An empirical analysis of OECD countries. Cogent Econ. Finance 11 (1), 2156094. doi:10.1080/23322039.2022.2156094
Savranlar, B., Ertas, S. A., and Aslan, A. (2024). The role of environmental tax on the environmental quality in EU counties: evidence from panel vector autoregression approach. Environ. Sci. Pollut. Res. Int. 31 (24), 35769–35778. doi:10.1007/s11356-024-33632-z
Spaargaren, G., and Mol, A. P. J. (1992). Sociology, environment, and modernity: ecological modernization as a theory of social change. Soc. Nat. Resour. 5 (4), 323–344. doi:10.1080/08941929209380797
Stucki, T. (2019). Which firms benefit from investments in green energy technologies? – The effect of energy costs. Res. Policy 48 (3), 546–555. doi:10.1016/j.respol.2018.09.010
Suhányi, L., Suhányiová, A., and Kočišová, M. (2024). Relationship between GDP and government expenditure on environmental protection and environmental tax revenues. Acta Montan. Slovaca 29 (2), 489–499. doi:10.46544/AMS.v29i2.20
Surugiu, M.-R., and Surugiu, C. (2014). Some considerations regarding the effects of taxation on the economy. Procedia Econ. Finance 8, 688–695. doi:10.1016/s2212-5671(14)00146-4
Tang, J., Zhong, S., and Xiang, G. (2019). Environmental regulation, directed technical change, and economic growth: theoretic model and evidence from China. Int. Reg. Sci. Rev. 42 (5–6), 519–549. doi:10.1177/0160017619835901
Umar, M., and Safi, A. (2023). Do green finance and innovation matter for environmental protection? A case of OECD economies. Energy Econ. 119, 106560. doi:10.1016/j.eneco.2023.106560
Wan, Y., and Sheng, N. (2022). Clarifying the relationship among green investment, clean energy consumption, carbon emissions, and economic growth: a provincial panel analysis of China. Environ. Sci. Pollut. Res. 29, 9038–9052. doi:10.1007/s11356-021-16170-w
Wang, M., Zhao, J., and Bhattacharya, J. (2015). Optimal health and environmental policies in a pollution-growth nexus. J. Environ. Econ. Manag. 71, 160–179. doi:10.1016/j.jeem.2015.02.006
Wei, R., Ayub, B., and Dagar, V. (2022). Environmental benefits from carbon tax in the Chinese carbon market: a roadmap to energy efficiency in the post-COVID-19 era. Front. Energy Res. 10, 832578. doi:10.3389/fenrg.2022.832578
Wei, X., Jiang, F., and Chen, Y. (2023). Who pays for environmental protection? The impact of green tax reform on labor share in China. Energy Econ. 125, 106862. doi:10.1016/j.eneco.2023.106862
Williams, R. C. (2002). Environmental tax interactions when pollution affects health or productivity. J. Environ. Econ. Manag. 44 (2), 261–270. doi:10.1006/jeem.2001.1237
Woerter, M., Stucki, T., Arvanitis, S., Rammer, C., and Peneder, M. (2017). The adoption of green energy technologies: the role of policies in Austria, Germany, and Switzerland. Int. J. Green Energy 14 (14), 1192–1208. doi:10.1080/15435075.2017.1381612
Xie, P., and Jamaani, F. (2022). Does green innovation, energy productivity and environmental taxes limit carbon emissions in developed economies: implications for sustainable development. Struct. Change Econ. Dyn. 63, 66–78. doi:10.1016/j.strueco.2022.09.002
Yasmeen, R., Zhang, X., Tao, R., and Shah, W. U. H. (2023). The impact of green technology, environmental tax and natural resources on energy efficiency and productivity: perspective of OECD rule of law. Energy Rep. 9, 1308–1319. doi:10.1016/j.egyr.2022.12.067
Yusuf, A., and Mohd, S. (2020). An econometric analysis of the impact of taxation on domestic investment in Nigeria. Int. J. Finance Manag. Econ. 3 (1), 32–38. doi:10.33545/26179210.2020.v3.i1.44
Zhao, Q., and Yuan, C. H. (2024). Environmental protection tax and China’s economic growth: boost or slowdown? Sustainability 16 (23), 10203. doi:10.3390/su162310203
Zheng, Y., Wang, B., Sun, X., and Li, X. (2022). ESG performance and corporate value: analysis from the stakeholders’ perspective. Front. Environ. Sci. 10, 1084632. doi:10.3389/fenvs.2022.1084632
Keywords: circular economy, green investment, environmental taxation, energy taxes, labor productivity, economic growth, energy efficiency, European Union
Citation: Ivanková V, Taušová M, Cehlár M and Khouri S (2025) Assessing the economic and energy dimensions of circular economy investment and green taxation in the European Union. Front. Environ. Sci. 13:1607573. doi: 10.3389/fenvs.2025.1607573
Received: 07 April 2025; Accepted: 11 June 2025;
Published: 19 June 2025.
Edited by:
Mobeen Ur Rehman, Keele University, United KingdomReviewed by:
Andreea Violeta Constantinescu, Romanian Academy, RomaniaAlexandru Bodislav, Bucharest Academy of Economic Studies, Romania
Copyright © 2025 Ivanková, Taušová, Cehlár and Khouri. This is an open-access article distributed under the terms of the Creative Commons Attribution License (CC BY). The use, distribution or reproduction in other forums is permitted, provided the original author(s) and the copyright owner(s) are credited and that the original publication in this journal is cited, in accordance with accepted academic practice. No use, distribution or reproduction is permitted which does not comply with these terms.
*Correspondence: Viera Ivanková, dmllcmEuaXZhbmtvdmFAdHVrZS5zaw==