 Robert J. W. Brewin1,2*
 Xuerong Sun1
 Joanne L. Wood1
 Thomas G. Brewin2,3Delaney McBride4B. Troy Frensley4Philip J. Bresnahan5
 Stefan G. H. Simis6Norbert Schmidt7
 Grinson George8
 Ancy C. Stoy8,9
 Nandini N. Menon10Jasmin Chekidhenkuzhiyil10
 Anas Abdulaziz11
 Shubha Sathyendranath6Lilian A. Krug12,13Nabanita Das14
 Subrata Sarker15
 Natacha Pasche16
 Laurence Haller16Yasmin Ghadyani17Daniel Odermatt17,18Alexandre Camus19Suzanne Mader20Adrien Bonny20Alexis Pochelon20Akintoye Edward Akinnigbagbe21
 Mauricio Almeida Noernberg22Edem Mahu23
 Ousmane Diankha24
 Adriana Gonzalez-Silvera25Waqar Ahmed26Samina Kidwai27Rodrigo Hernandez-Moresino28Ahmed Hussein Mohamed29Wilfried Essowè Panassa30
 Noir Primadona Purba31
 Stella Patricia Betancur-Turizo32Lamona Irmudyawati Bernawis33Houssem Smeti34,35Happiness Anold Moshi36,37
- 1Centre for Geography and Environmental Science, Department of Earth and Environmental Sciences, University of Exeter, Cornwall, United Kingdom
- 2Brewtek Ltd., Kent, United Kingdom
- 3Chatham and Clarendon Grammar School, Ramsgate, United Kingdom
- 4Environmental Sciences, University of North Carolina Wilmington, Wilmington, NC, United States
- 5Department of Earth and Ocean Sciences, Center for Marine Science, University of North Carolina Wilmington, Wilmington, NC, United States
- 6Plymouth Marine Laboratory, Plymouth, United Kingdom
- 7DDQ Pocket Science, Heerlen, Netherlands
- 8Fishery Resources Assessment Economics and Extension Division (FRAEED) Indian Council of Agricultural Research (ICAR)-Central Marine Fisheries Research Institute, Cochin, India
- 9Department of Marine Biology, Microbiology, Biochemistry, School of Marine Sciences, Cochin University of Science and Technology (CUSAT), Kochi, India
- 10Nansen Environmental Research Centre India, Cochin, India
- 11Council of Scientific and Industrial Research (CSIR)-National Institute of Oceanography, Regional Centre Cochin, Cochin, India
- 12Partnership for Observation of the Global Ocean (POGO), Plymouth, United Kingdom
- 13Centro de Ciências do Mar do Algarve (CCMAR/CIMAR LA), Faro, Portugal
- 14NANO Research Fellow, Partnership for Observation of Global Ocean, Plymouth, United Kingdom
- 15Department of Oceanography, Shahjalal University of Science and Technology, Sylhet, Bangladesh
- 16Limnology Center, École Polytechnique Fédérale de Lausanne (EPFL), Limnology Center, Lausanne, Switzerland
- 17Eawag: Swiss Federal Institute of Aquatic Science and Technology, Department Surface Waters - Research and Management, Dübendorf, Switzerland
- 18University of Zurich, Department of Geography, Zurich, Switzerland
- 19Le ColLaboratoire, Unité de Recherche-Action, Collaborative et Participative, University of Lausanne, Lausanne, Switzerland
- 20Association pour la Sauvegarde du Léman, Geneva, Switzerland
- 21Nigerian Institute for Oceanography and Marine Research, Lagos, Nigeria
- 22Center for Marine Studies, Federal University of Paraná, Pontal doParaná, Brazil
- 23Department of Marine and Fisheries Sciences, University of Ghana, Legon, Ghana
- 24Département Hydro Sciences et Environnement, UFR Sciences et Technologies, Université Iba Der THIAM, Thiès, Senegal
- 25Faculty of Marine Science, Universidad Autónoma de Baja California, Ensenada, Mexico
- 26National Institute of Oceanography, Karachi, Pakistan
- 27School of Maritime and Applied Sciences, Bahria University Karachi Campus, Karachi, Pakistan
- 28Centro para el Estudio de Sistemas Marinos (CESIMAR-CONICET), Puerto Madryn, Chubut, Argentina
- 29School of Applied Sciences, Edinburgh Napier University, Edinburgh, United Kingdom
- 30Department of Physics, Faculty of Science and Technology (FaST), University of Kara, Kara, Togo
- 31Department of Marine Science, Faculty of Fishery and Marine Science, Universitas Padjadjaran, Bandung, West Java, Indonesia
- 32Centro de Investigaciones Oceanográficas e Hidrográficas del Caribe, Dirección General Marítima, Cartagena, Colombia
- 33Research Group of Environmental and Applied Oceanography, Faculty of Earth Science and Technology, Institut Teknologi Bandung, Bandung, Indonesia
- 34Sustainable Seas Scientific Studies, Dawnview Crescent, Victoria, BC, Canada
- 35Higher Institute of Biotechnology, University of Monastir, Monastir, Tunisia
- 36School of Aquatic Sciences and Fisheries Technology, University of Dar es Salaam, Dar esSalaam, Tanzania
- 37Arusha Climate and Environmental Research Centre, Aga Khan University, Dar esSalaam, Tanzania
Measurements of water colour and clarity are used to track the environmental status of lakes, estuaries and oceans. The oldest standardised methods for measuring water clarity and colour are the Secchi disk and Forel-Ule colour scale. Both techniques were developed in the 19th century and require use of the human eye. Despite the advent of optoelectronic-based sensing, these visual methods are still used today, owing to their sensitivity, affordability, simplicity and long history of use. Recently, a hand-held device was developed for measuring the Secchi depth and Forel-Ule colour (presented in two formats, named the mini- and midi-Secchi disk). Designed to be small, light and convenient-to-use, it is well suited for participatory science projects that involve monitoring water colour and clarity. To date, over 900 mini- and midi-Secchi disks have been distributed to citizens and scientists, primarily through six projects, with data mostly transferred via mobile phone applications to data servers and dashboards. In this paper, we describe the methods used in the projects and show some characteristics of the datasets collected so far. We showcase how the device can be used for scientific applications, such as verifying satellite data products, gaining new scientific insights, and supporting public engagement and education. Finally, we provide suggestions for methodological improvements and future developments.
1 Introduction
Water colour and clarity are key metrics used to study aquatic systems. Together, they provide information on the composition and concentration of particles and dissolved substances in the water, and on aquatic light propagation. They are useful for a wide range of ecological and societal applications; including quantifying aquatic productivity, underwater visibility (with implications for predator and prey interactions), water quality and health, and those (like recreation and wellbeing) related to human perception (Smith and Davies-Colley, 1992; Zielinski, 2021).
Standardised techniques to measure water colour and clarity date back to the 19th century. Measurements with a Secchi disk (Secchi, 1864), named after Angelo Secchi (for a review of this history, see Pitarch, 2020; Wernand, 2010), involve lowering a white disk into the water and recording the depth at which it disappears/reappears (known as Secchi depth). Secchi depth is proportional to the clarity of the water (Preisendorfer, 1986). The Forel-Ule (FU) colour scale was developed originally by François-Alphonse Forel and by Wilhelm Ule (Forel, 1890; Ule, 1892), is a scale of 21 colours, varying from blue to green to yellow and brown, designed to identify natural variations in water colour. Although different combinations of optically active substances in water can produce a similar colour (Defoin-Platel and Chami, 2007), the Forel-Ule (FU) index a useful tool for identifying optical water types and bulk water constituents (Pitarch et al., 2019). Both techniques are still used today (Wernand and Woerd, 2010; Ye and Sun, 2022), owing to their low cost and simplicity, despite the ubiquitous use of precision optoelectronic instrumentation.
The utility of the Secchi disk and Forel-Ule colour scale are centred on human observers, with the human eye (and brain) the equivalent of a highly capable sensor, particularly in terms of radiometric sensitivity and colour perception (but note Burggraaff et al., 2021). Consequently, they have been used in several participatory science projects (Novoa et al., 2014; Novoa et al., 2015; Busch et al., 2016; Seafarers et al., 2017; Malthus et al., 2020; Kirby et al., 2021), often in conjunction with mobile phone applications and webservers, for data transfer, storage and visualisation. With the goal to make the Secchi disk and FU scale compact (hand-held), ergonomic and easier to use, Brewin et al. (2019) developed the mini-Secchi disk. Partly 3D-printed, the mini-Secchi disk was designed for operation in turbid lacustrine, estuarine and nearshore regions (with Secchi depths in the range of 0–10 m), and for use in participatory science projects (George et al., 2021). The device was also extended to operate in clearer coastal waters and clear lakes (with Secchi depths in the range of 0–20 m) by Brewin et al. (2024), named a midi-Secchi disk.
Participatory science–based water quality monitoring approaches are increasingly employed given community interest in local water quality and the importance of quantifying spatiotemporal heterogeneity (Ramírez et al., 2023 and references therein). Furthermore, the availability of comparatively accessible tools to aid in participatory monitoring is rapidly increasing. For example, recent work by Neale et al. (2024) demonstrated applications of participatory science tools, such as mobile device cameras and apps and handheld optoelectronic devices, for evaluating remotely sensed aquatic imagery. Participatory science can add to existing professional monitoring by increasing spatial and temporal coverage of data, fill gaps in existing monitoring systems (e.g., under cloudy conditions when satellite data is not available), enhance public engagement, and help verify professional observations (Chandler et al., 2017; Christine and Thinyane, 2021).
The mini- and midi- Secchi disks have been adopted in six projects (five involving participatory science), supporting the manufacture of 927 disks that have been distributed to citizens and scientists around the world. In this paper, we describe details of the six projects, including the distribution of disks and method of data collection. We then combine data collected in these projects and describe their characteristics, how they can be used within scientific data applications, for example, verifying satellite imagery, and show scientific insights gained. We provide suggestions for methodological improvements and future developments and show applications within educational and public engagement settings.
2 Methods
2.1 Mini- and midi- Secchi disk
The mini-Secchi and midi-Secchi disks represent an innovation of two old methods, the Secchi disk and the FU colour scale (Figure 1). There is little difference between the mini-Secchi and midi-Secchi disks other than the tape length and scale of components (e.g., case diameter). The designs are entirely open-source and freely available (for commercial and non-commercial use), using a share-alike license (Brewin et al., 2019). The devices consist of a tape measure, held within a body (or case), that is attached to a small Secchi disk (10–12.5 cm in size) and weight (Figure 1). The disk can be wound in and out using a bobbin and handle. The body of the device has a FU colour scale sticker, and a finger strap and lanyard to support operation. The manufacture of the devices has been designed, as such, to use only basic workshop tools and a 3D printer: the body, bobbin and handle can be made with a 3D-printer; the white disk cut from polypropylene sheet; the weight produced using a metal lathe or a computer numerical control (CNC) machine; with all other components and fixings being readily available from on-line hardware providers. The FU colour sticker is based on an FU to RGB (red, green, blue) conversion (Wernand et al., 2013 see their Table 5). These RGBs were converted to a CMYK (cyan, magenta, yellow, black) scale, required for colour printing. Multiple stickers are provided with each device, allowing it to be replaced when degraded or damaged.
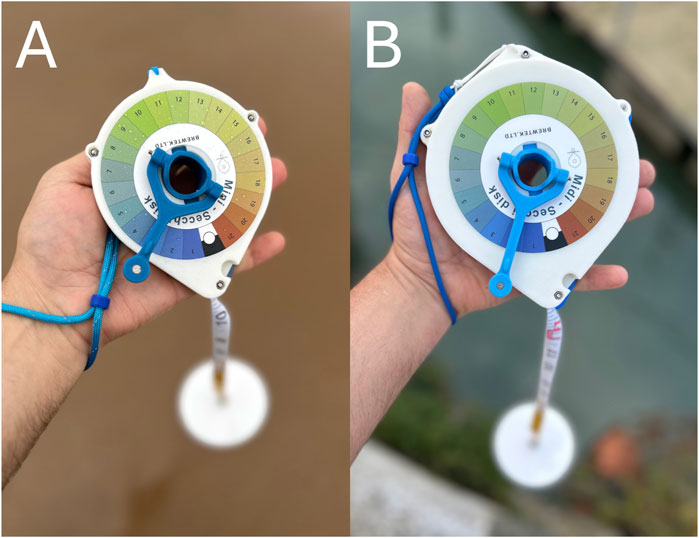
Figure 1. (A) The mini-Secchi disk and (B) the midi-Secchi disk.
The devices are operated by slipping the lanyard over your wrist, detaching the Secchi disk from the body, placing a few fingers in the finger strap, and using the handle to wind the disk in and out. The Secchi depth is recorded by identifying the depth at which the disk disappears, and the FU colour, either by looking at the water above a background of the Secchi disk at half the Secchi depth, or directly at the water without the disk (noting there are systematic differences between these two measurements of colour, see Pitarch, 2017). It is important that the disk sinks vertically when measuring the Secchi depth, and additional weights can be added to the disk, to minimise lateral drift, with a 200–500 g weight often adequate. Brewin et al. (2019) provide additional details on the design and manufacturing process, operation of the device, with some recent updates to the design described in Brewin et al. (2024). Stereolithography computer aided designs (CAD) of the mini- and midi-Secchi disk (STL files) are openly available (see https://www.brewtek.online/).
Typical uncertainties (average percent deviation) reported for Secchi depth measurements are around 10% (Brewin et al., 2023; Heath et al., 2024) based on multiple individuals collecting data simultaneously under the same conditions. This is in good agreement with data collected under controlled conditions by multiple individuals using a mini-Secchi disk (see Figure 9 of Brewin et al., 2019). Typical uncertainties for FU colour measurements are reported at around 1.0 scale unit (Burggraaff et al., 2021). This is in good agreement with the standard deviation of FU colour measurements collected by 21 students using a mini-Secchi disk sticker at the same location in the Fal Estuary, United Kingdom during an undergraduate field trip (median = 13, standard deviation = 1.05). As participatory science initiatives generate increasing volumes of observational data, random individual-level variation can be averaged out, reducing uncertainties.
2.2 Projects
To date, five participatory science projects and a project led by members of a network of alumni from capacity development programmes have utilised the mini- and midi-Secchi disks. These include:
1. The Rehabilitation of Vibrio-infested waters of Lake Vembanad (REVIVAL) project. This was funded under the India-UK Water Quality programme and involved citizen sampling using the mini- and midi-Secchi disk to monitor water quality in Lake Vembanad, Kerala, India (George et al., 2021).
2. The Waterborne Infectious Diseases and Global Earth Observation in the Nearshore (WIDGEON) project. This was funded by the European Space Agency and midi-Secchi disks were used to educate college students in the regions adjoining Vembanad lake and nearby coastal areas on water quality estimation.
3. The Multiscale Observation Networks for Optical monitoring of Coastal waters, Lakes and Estuaries (MONOCLE) project was funded by the European Union and involved citizen sampling using the mini- and midi-Secchi disk, among a range of other low-cost technologies.
4. The Participatory Ocean Color Network (POCN) project was funded by the Gordon and Betty Moore Foundation as part of their support of the SeaHawk-HawkEye CubeSat ocean color mission (Bresnahan et al., 2024). POCN focuses on distributing mini- and midi-Secchi disks to individuals, organizations, businesses, and agencies across U.S. coasts. To date, participants in this network have collected in situ measurements across 22 cities in the United States.
5. LÉMANSCOPE is a participatory science project financed by the Swiss National Science Foundation within the AGORA scheme. Over 600 volunteers in Switzerland and France are involved in the project. More than 300 boaters have received a midi-Secchi disk to measure local differences in transparency and colour.
6. The NANO-DOAP (A Global Study of Coastal Deoxygenation, Ocean Acidification, and Productivity at Selected Sites) is a collaborative scientific project led by members of a network of alumni from capacity development programmes under the partnership between the Nippon Foundation and the Partnership for Observation of the Global Ocean (the NF-POGO Alumni Network for the Ocean–NANO). The project currently includes 34 sampling sites across 18 countries in Asia, Africa, and Latin America (Krug et al., 2021). Since September 2023, NANO-DOAP members have incorporated midi-Secchi disks measurements to their regular monitoring activities.
Table 1 provides an overview of the projects, their focus, region of interest, number of disks produced, and additional details regarding mobile phone applications used, references and weblinks. Efforts have been made to standardize data collection and upload consistent instructions across all applications but given the wide range of contexts of these projects, multiple applications have been made to meet specific needs of different projects. In addition to these six projects, an additional 100 disks have been manufactured to support networks and activities, including: a student network developed within the Trevor Platt Science Foundation (TPSF), an international organisation dedicated to capacity building in science, research, and education (50 disks produced and distributed at a TPSF training course); as well the production of individual disks or small batches (∼50), supporting teaching and research activities, including field campaigns as well as public engagement activities (Table 1). To date, 927 disks have been produced and distributed for use.
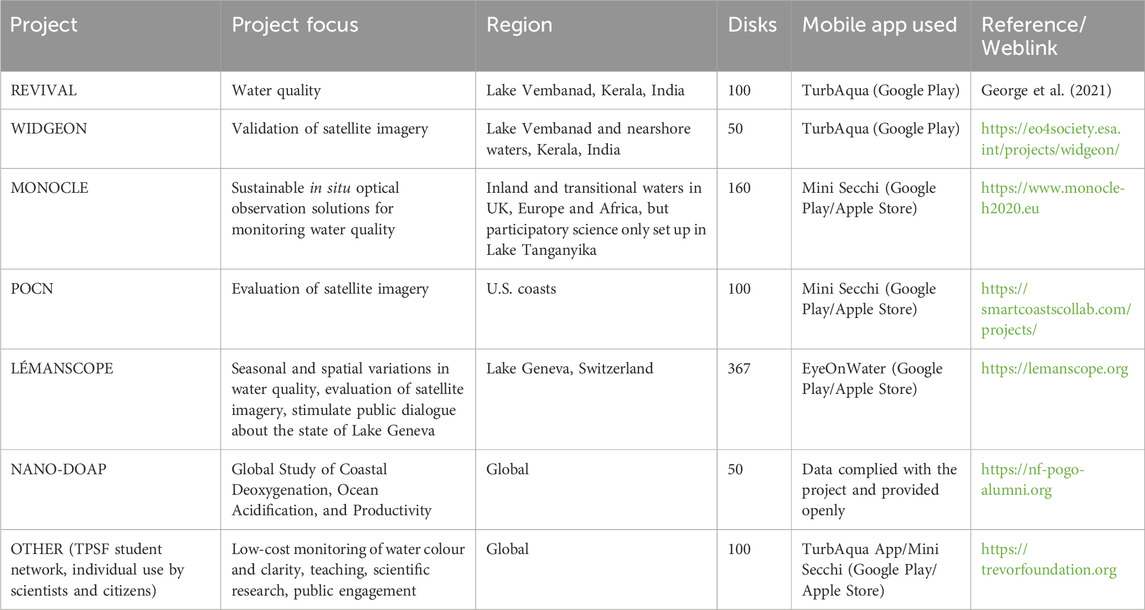
Table 1. An overview of the participatory science projects and activities using the mini- and midi-Secchi disks.
Each of the five participatory science projects was guided by the principles of citizen science (Kelly et al., 2020) adapted to goals of the individual project and the region of interest, i.e., cultural and societal values of the participants from different regions were taken into consideration. All projects involved an open and transparent recruitment of participants; accessible project information (e.g., online, through news updates, articles and community events); distribution of training resources (including demonstrations, manuals and videos) to ensure scientific rigour and data quality; and feedback mechanisms (e.g., online, email, in-person community events, and questionnaires). More details of these project can be found in the reference and weblinks provided in Table 1.
Data were logged primarily using mobile phone applications that collected, in addition to the Secchi depth and FU colour, important metadata such as geolocation, time, and data quality flags (see Section 2.3). Different mobile phone applications were used to cater for the different needs of the participants in each region. In the REVIVAL and WIDGEON projects, the TurbAqua App was developed (Android compatible, available on Google Play), tailored to participants collecting data in India. TurbAqua has been recently updated with a colour vision test to ensure accurate colour perception overcoming colour vision deficiencies, and an “Optimal Angle Assistant” feature that helps users to achieve optimal positioning for their smartphone cameras to minimize surface reflectance while taking photos with their mobile phone cameras to confirm the FU colour. For the MONOCLE project, the open-source Mini Secchi App was developed (Android/Apple, available on Google Play and Apple Store), used to log mini-Secchi data and make it available through open geospatial data standards. The Mini Secchi App was also adopted and improved for use for the POCN project, by refining the geolocation and providing additional options and instructions. The LÉMANSCOPE project made use of the EyeOnWater App (Android/Apple, available on Google Play and Apple Store), translated into French. The app was originally developed for the Citclops project (http://www.citclops.eu), which also allows users to take photographs with their mobile phone camera to compute the FU colour (Novoa et al., 2015), in addition to logging individual visual-based estimates of FU colour. In all of the five participatory science projects, data were transferred to webservers for storage. For the NANO-DOAP project, data collected alongside other oceanographic samples were compiled by the alumni network and provided openly.
2.3 Data collection and processing
In this work, we compiled a dataset containing geolocated and time-stamped coincident Secchi depth and FU measurements collected using mini- and midi-Secchi disks. Only data collected within realistic geographical bounds, with Secchi depths <20 m (length of the midi-Secchi disk tape) and with FU values between 1 and 21, were used. We also only used measurements with both Secchi depth and FU, to analyse their relationship. Except for LÉMANSCOPE (see bullet below for details on FU data), FU measurements were collected above a background of the Secchi disk at half the Secchi depth. For some datasets, additional quality control was performed, when auxiliary information was available. Specifically:
• REVIVAL, WIDGEON and other TurbAqua app data (1,448 measurements) collected between February 2019 and September 2023 were used.
• MONOCLE, POCN and other mini-Secchi app data (452 measurements, 393 from POCN) were extracted from the MONOCLE mini-Secchi Geoserver between October 2023 and March 2025 using the Python MONDA package (https://github.com/monocle-h2020/MONDA). Only data after October 2023 were used, following a fix to the mini-Secchi app to ensure accurate geolocation. We also made use of quality flags in the app removing data where the user reported seeing the seabed (i.e., water depth too shallow to get a Secchi depth reading), where the end of the tape was reached during measurement (water too clear to use the mini- or midi-Secchi disk), and where the angle of deployment exceed 15° (implying significant drift in Secchi disk).
• LÉMANSCOPE data (1,156 measurements) collected using the midi-Secchi disk in Lake Geneva between May 2024 and February 2025 were extracted from the EyeOnWater data server. Only data where coordinates were within the national map lake polygon were used, and where the Secchi depth was less than the water depth, taken from a bathymetric map of the lake. We also removed any FU data collected visually that differed by more than 3 FU to that extracted from photos taken with the mobile phone camera (Novoa et al., 2015). As FU data were collected directly at the water without the use of a Secchi disk, we converted the FU measurements to estimates of FU collected above a background of the Secchi disk at half the Secchi depth using the algorithm of Pitarch (2017), to be consistent with FU data collected in other projects.
• NANO-DOAP (213 measurements) were collected between August 2023 and December 2024.
Considering FU values of 1 and 2 are characteristic of very clear, open ocean waters with Secchi depths far exceeding 3 m (Wernand and Woerd, 2010; Pitarch et al., 2019; Brewin et al., 2023), an additional quality control was performed on all data, removing any data with FU < 3 and corresponding Secchi depth <3 m (29 samples removed). The final in situ dataset contained 3,269 combined measurements of Secchi depth, FU, latitude, longitude and time.
We compared our in situ dataset with satellite observations at a range of spatial scales. Firstly (1), we overlaid FU data (Wernand et al., 2013) onto very high resolution ESRI World Imagery, a tile-based map service available via the Python contextily package. This imagery was used to qualitatively compare the colour of a water body with mini- and midi-Secchi disk observations, for a selection of regions. Secondly (2), we conducted a more quantitative comparison (matching in situ data in space and time with satellite Secchi depth products) using the Satellite-based analysis Tool for Rapid Evaluation of Aquatic environMents (STREAM) (https://ladsweb.modaps.eosdis.nasa.gov/stream/). These new openly available products are derived from high-resolution Copernicus Sentinel-2 (10 m spatial resolution in the visible) and USGS Landsat 8 and 9 (30 m spatial resolution in the visible), processed using the algorithms of Pahlevan et al. (2022) and Maciel et al. (2023). Satellite observations of water colour are processed using a mixture density network (a class of neural network) that was trained to produce high resolution (20–30 m) Secchi depth maps with an uncertainty (median symmetric accuracy) of around 40% (Maciel et al., 2023). We extracted STREAM Secchi depth data from a 3 × 3 pixel window centred on the location of the in situ measurement and within a ± 2 days time frame (STREAM accessed on 2nd April 2025). To ensure homogeneity of the region surrounding the satellite match-up we computed the median absolute deviation in Secchi depth for a 3 × 3 pixel window surrounding the location of the in situ measurement. Match-ups were removed if there were fewer than three valid pixels within the 3 × 3 window and if the median absolute deviation in Secchi depth for the group of pixels was greater than a meter. This resulted in 15 corresponding matchups with STREAM in the eastern US (1 for Landsat 8 and 11 for Sentinel 2) that resulted from the POCN and NANO-DOAP datasets. Thirdly (3), we selected an example from the LÉMANSCOPE data visualisation portal (https://lemanscope.org/data/) on the 13th June 2024, using Sentinel 3 (300 m spatial resolution in the visible) satellite-estimated Secchi depth maps of Lake Geneva (derived from the Polymer atmospheric correction algorithm (Steinmetz et al., 2011) and the Secchi depth model of Lee et al. (2015)), with in situ data points overlain, to compare spatial variability between satellite and in situ data. We also extracted a monthly seasonal climatology of percentage precipitation in Kerala, India (see Table 1 of Mini et al., 2016), and computed the cumulative sum of the anomalies (an anomaly being the monthly seasonal percentage minus average monthly percentage) which was used as a seasonal index of variation in freshwater input to Lake Vembanad.
3 Results and discussion
3.1 Dataset characteristics
The geographical distribution of the mini- and midi-Secchi disk dataset complied in our study (Figure 2A), highlights that most data were collected on the eastern coastline of the US (POCN project), in Europe (MONOCLE and LÉMANSCOPE) and southern India (REVIVAL and WIGEON). Additional measurements were collected as part of NANO-DOAP and other smaller initiatives (see Table 1) in South America, Africa, Indonesia, Asia and Antarctica (the latter as part of the NERC PICCOLO research cruise, see Brewin and Dall’Olmo, 2024).
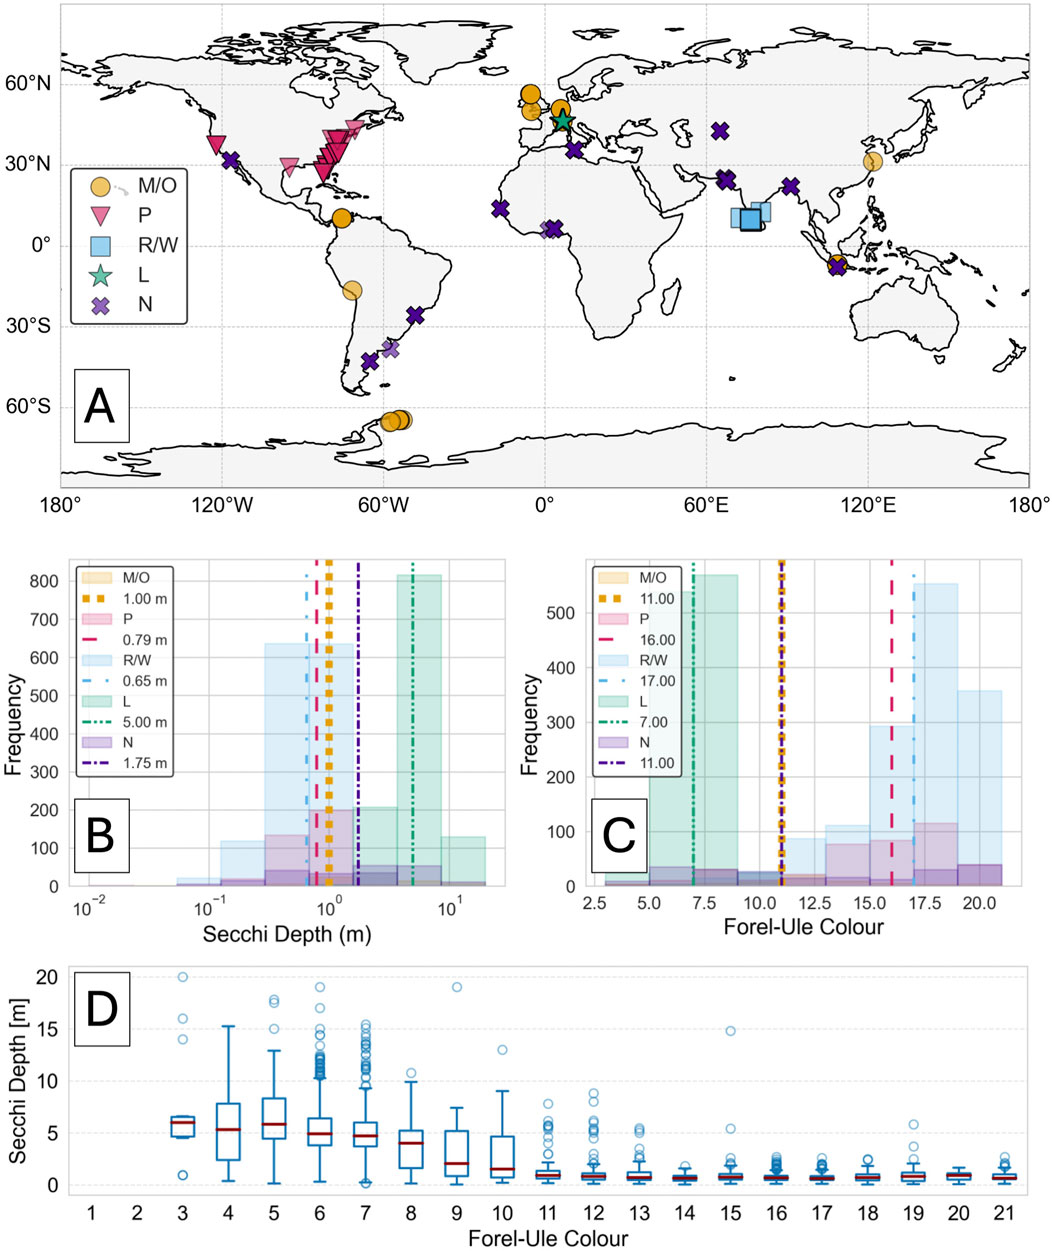
Figure 2. (A) Geographic distribution of mini- and midi-dataset complied. M/O refers to data from the MONOCLE and OTHER projects; P the POCN project; R/W the REVIVAL and WIDGEN projects; L the LÉMANSCOPE project; and N the NANO-DOAP project (see Table 1). (B,C) The frequency distribution of Secchi depth and FU measurements, respectively. Lines represent the median values for each project. (D) The relationship between the Secchi depth and FU colour in the complied dataset.
Frequency distributions of the datasets (Figures 2B,C) highlight the range of variability in Secchi depth and FU collected in the projects. The POCN, REVIVAL and WIDGEON data display similar ranges of variability, with median Secchi depth between 0.65 and 0.79 m and median FU of 16–17. The LÉMANSCOPE data is, however, strikingly different (Figures 2B,C), with higher Secchi depths (median of 5 m) and lower FU colours (median of 7 FU). These differences in visibility can be explained by lower concentrations of phytoplankton, coloured dissolved organic matter and inorganic particles in Lake Geneva. The remaining datasets (NANO-DOAP, MONOCLE and other) have a median Secchi depth and FU colour that lies in-between the other projects and display a greater range of variability (Figures 2B,C) consistent with the sites covering a wider geographic range (Figure 2A).
We observed a clear inverse relationship between Secchi depth and FU in the compiled dataset for FU values <12 (Figure 2D), consistent with previous studies (Wernand, 2011; Brewin et al., 2023). This relationship is related to the increasing contribution of pure water (which is blue in colour and represented by low FU values) to the colour of a water body as it becomes clearer (as reflected by higher Secchi depths). Interestingly, for FU values > 12 there is no clear relationship between the two variables (Figure 2D), demonstrating that similar levels of water clarity can occur for a wide range of colour (greens to yellows to browns), a result again consistent with previous complications of data (see Figures 1, 3 of Wernand, 2011), giving confidence in the veracity of our data compilation.
3.2 Scientific applications
Satellite observations have the capability of viewing wide areas synoptically, at high temporal resolution (depending on the characteristics of the sensor and its orbit). A variety of satellite algorithms have been developed for mapping variables, like Secchi depth, using satellite observations (e.g., Lee et al., 2015); yet the accuracy of these satellite estimates needs to be understood and quantified for successful use in applications related to water quality and ecosystem health. Furthermore, satellite passive visible radiometry has limitations; for example, it is not capable of viewing a water body under cloudy conditions. Unlike Secchi depth and FU measurements, satellites have only been around for the last 30–50 years, meaning these are not suitable for monitoring centennial trends in variables like water colour and clarity on their own (Boyce et al., 2010; Heath et al., 2024). It is widely accepted that an approach that combines in situ and satellite data is required to successfully monitor water colour and clarity globally and identify long-term changes (Lee et al., 2018).
3.2.1 Comparison with ESRI World Imagery
FU colour measurements were overlain onto ESRI true colour World Imagery at Wilmington, North Carolina, United States (Figure 3A), Lake Vembanad, India (Figure 3B) and Lake Geneva, Switzerland and France (Figure 3C), to conduct a qualitative comparison of mini- and midi-Secchi depth FU data with openly available, high resolution satellite tiles. While acknowledging such a comparison is not well matched in time (single scene taken on a single day compared with in situ observations collected at various times over the year) there are strong similarities in some of the spatial features in the datasets. For example, at Wilmington (Figure 3A) it is clear from both the ESRI tiles and the in situ FU measurements that the Cape Fear River is far browner in colour when compared with Atlantic Intracoastal Waterway estuarine region. Furthermore, in both the ESRI tiles and the in situ FU data the colour of Lake Geneva (Figure 3C) appears bluer than in the inshore Wilmington and Lake Vembanad regions (Figures 3A,B) where in situ data were collected, consistent with the in situ data compilation distribution (see Figure 2C).
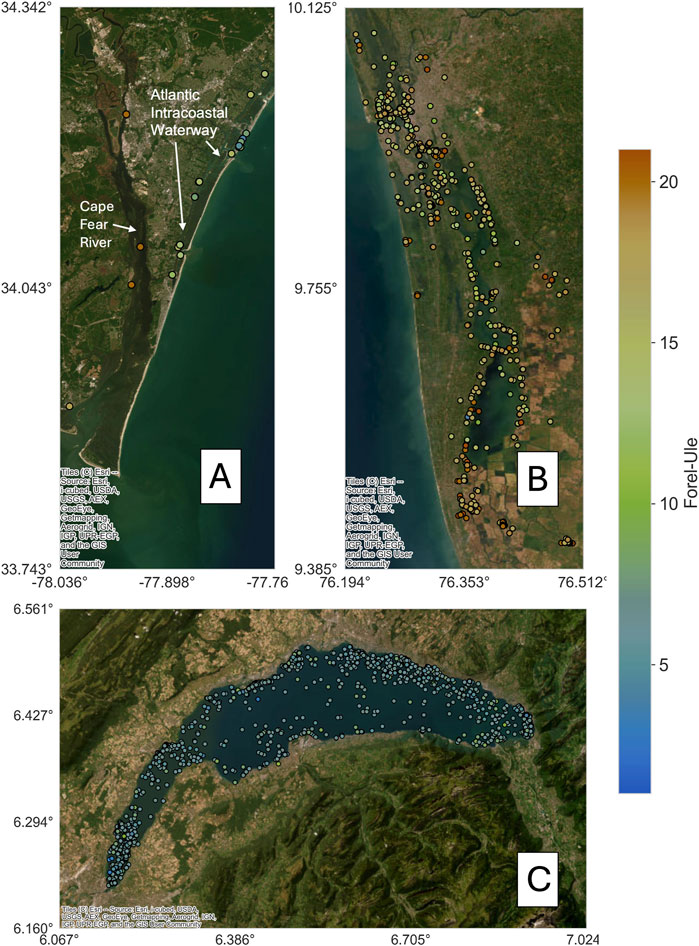
Figure 3. Mini- and midi-Secchi disk Forel-Ule (FU) colour data overlain onto ESRI true colour World Imagery for (A) Wilmington, North Carolina, US, (B) Lake Vembanad, Kerala, India, and (C) Lake Geneva, Switzerland.
3.2.2 Comparison with STREAM data
While it is useful and aesthetically pleasing to observe citizen and satellite observations together holistically on high resolution ERSI tiles (Figure 3), more rigorous and careful comparisons are required to quantify the performance of satellite Secchi depth products. Figure 4A shows the results of our match-up analysis using the STREAM products for Sentinel-2 and Landsat 8 and 9. Although only a few matchups were available (N = 15), statistical comparisons show good agreement overall, with a median absolute deviation (MAD) of 0.17 m. Despite this, there was one outlier where the satellite STREAM data (4.15 m) differed considerably from the in situ data (0.63 m, Figure 4A). This outlier (data collected on the 26th (in situ) and 24th (satellite) of May 2024) was found to be located inland on the Potomac River near Washington D. C. (Figures 4B,C), a river that runs into Chesapeake Bay.
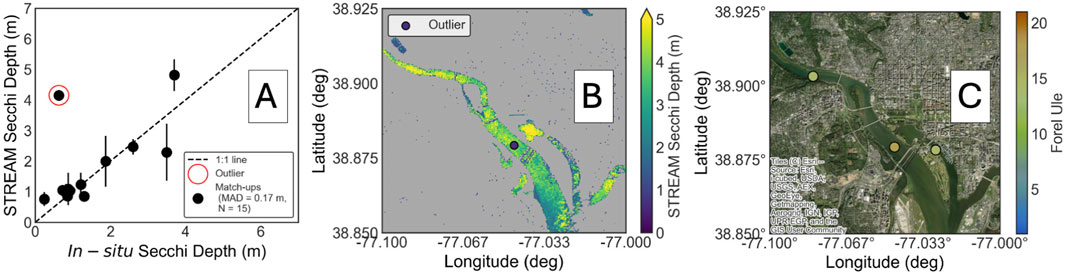
Figure 4. Comparison of in situ Secchi depth data with NASA’s STREAM satellite products. (A) Scatter plot of match-up data (MAD refers to median absolute deviation and N number of matchups). (B) Location of in situ data point identified as an outlier in (A) near Washington D. C., US, overlain onto the STREAM satellite map. (C) Location of 2 other in situ data points (including the outlier in (A)) collected at other times (22nd June and 19th September 2024) and their FU colour, overlain onto ESRI true colour World Imagery.
To study this outlier further, Figure 4B illustrates that most pixels in the satellite imagery in the region provide a higher (some exceeding 5 m) Secchi depth than the corresponding in situ measurements. Interestingly, the FU value reported in situ for this outlier was 18 (Figure 4C). Of the 322 data points with FU 18 in our data compilation, the maximum Secchi depth was found to be 2.5 m (see Figure 1D), considerably lower than the 4.15 m reported by STREAM. We analysed our dataset for other measurements collected in the region and found two (collected on the 22nd of June and 19th of September 2024, see Figure 4C) both of which had Secchi depths much lower than the STREAM image (0.67–1.23 m). Together this information suggests the outlier is due to an overestimation in Secchi depth by the STREAM product, which may be related to challenges in the retrieval algorithm in a narrow and complex inland river. Nonetheless, differences may also be related to mismatches in time between when the in situ and satellite measurements were collected. For example, in a tidal estuary in the United Kingdom (Fal Estuary), Brewin et al. (2024) showed that the Secchi depth can vary between 1.5 and 4 m, over the course of a 6-h portion of a tidal cycle. When more in situ measurements are collected, such comparisons can be updated with stricter time differences. Considering STREAM products are designed for near-real time applications, and that in situ data becomes available nearly instantly via the mobile phone apps, there is potential to operationalise these types of comparisons, which may be useful for flagging satellite scenes where large differences occur.
3.2.3 Comparison with Sentinel 3 data
In addition to high resolution satellite data like Sentinel 2 and Landsat 8 and 9, our database is also useful for comparing with coarser spatial (300 m resolution pixels) but higher temporal resolution (1–2-day overpass) satellite data, such as that derived from ESA’s Sentinel 3 series, for larger water bodies like Lake Geneva. As part of the LÉMANSCOPE project, a data visualisation portal has been developed to overlay Secchi depth data derived from the midi-Secchi disk onto Secchi depth maps from Sentinel 3 (https://lemanscope.org/data/). Figure 5A shows an example on the 13th of June 2024. The spatial distribution of the in situ and satellite Secchi depth data are in good agreement, both showing lower Secchi depths to the eastern side of the lake, caused by high turbidity in its main tributary following heavy precipitations. The validation of Sentinel-3 products in Lake Geneva used to rely completely on bi-weekly Secchi measurements collected as part of the official lake monitoring programme in the centre of the lake. Citizen observations being collected in LÉMANSCOPE greatly expand the spatial and temporal coverage of these data resulting in a more comprehensive evaluation of satellite products.
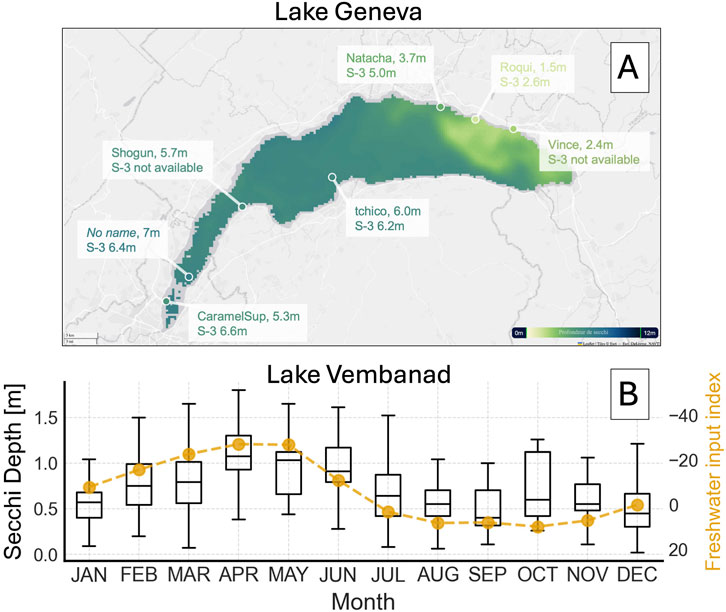
Figure 5. (A) An example from the LÉMANSCOPE data visualisation portal (https://lemanscope.org/data/) on 13th June 2024 of Sentinel 3 satellite-estimated Secchi depth maps of Lake Geneva with midi Secchi depth in situ data overlain. (B) Boxplots of the monthly Secchi depth for Lake Vembanad (see Figure 3B for data locations) with the freshwater input index (cumulative sum of the monthly anomaly in percentage rainfall) overlaid.
3.2.4 Relationship between precipitation and Secchi depth in Lake Vembanad
As the in situ mini- and midi-Secchi dataset grows there are increasing opportunities to gain scientific insights into the dynamics of a water body. Using mini-Secchi disk data, calibrated to estimates of turbidity, George et al. (2021) successfully mapped the spatial distribution of turbidity in Lake Vembanad using citizen observations. Menon et al. (2021) also showed how mini-Secchi disk data can be used to monitor short-term fluctuations in water colour and clarity caused by anthropogenic disturbances (demolitions of buildings at the edge of Lake Vembanad). Here, we expand on this work by analysing seasonal variability in water clarity and colour from the REVIVAL and WIDGEON dataset. While there were no major variations observed in FU over the season (not shown), we saw clear changes in water clarity, with larger Secchi depths between February and June, and lower Secchi depths between July and January (Figure 5B). We found these changes to be inversely correlated (r =
3.3 Other applications of the mini- and midi-Secchi disk
The cost of commercial in situ optical equipment and associated maintenance (e.g., regular calibration) makes it difficult to use for those outside of scientific institutes. The mini- and midi-Secchi disks falls into a category of low-cost instrumentation that is affordable to most people interested in monitoring water colour and clarity, democratising the measurement process and broadening the range of users (Figure 6). Such affordable instrumentation has the potential to unite water quality monitoring enthusiasts and attract new users from different backgrounds and cultures, breaking down social barriers in the process (Bonney et al., 2016; Pateman et al., 2021; Ramírez et al., 2023).
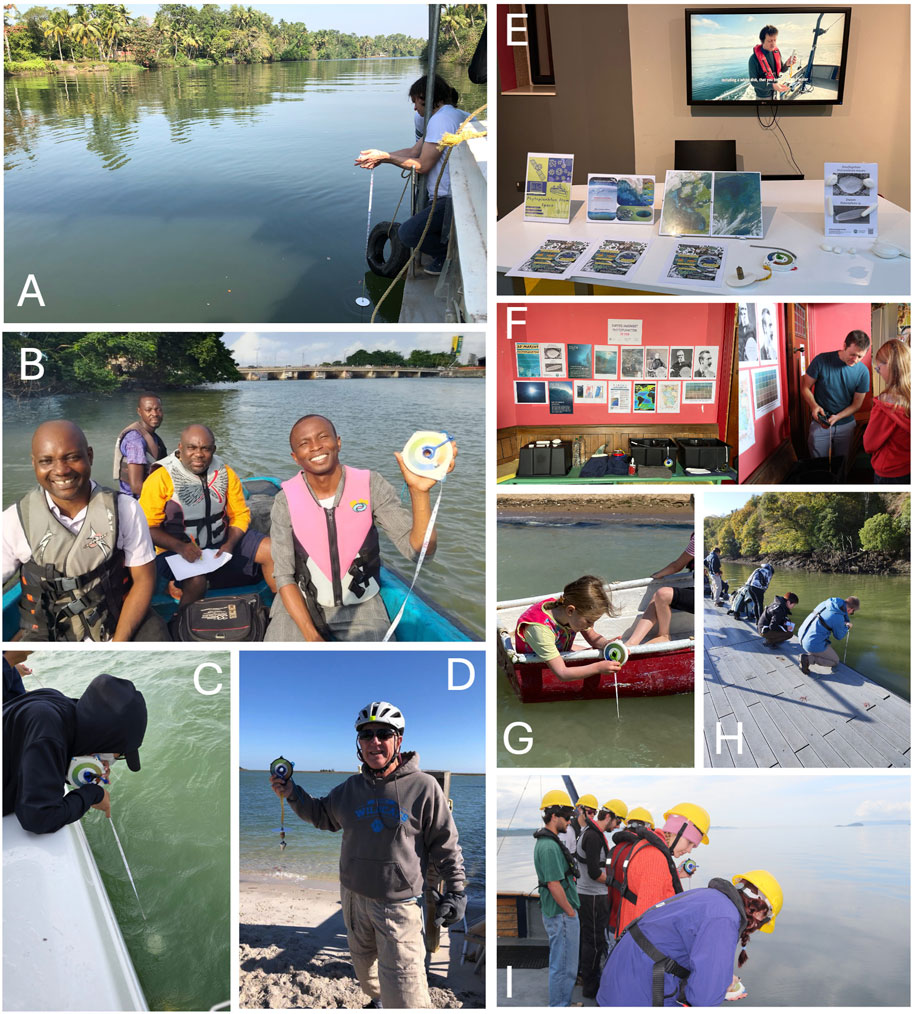
Figure 6. Photos of the mini- and midi-Secchi disk being used by citizens and scientists around the world (A–D), used in public engagement events (E–F) and for teaching activities (G–I). (A) Deployment in Lake Vembanad during the REVIVAL project. Midi-Secchi disks being deployed as part of the NANO-DOAP in (B) Nigeria (photo taken by Mrs. Oghenede Esther Kar with permission) and (C) the Java Sea, Indonesia. (D) Deployment by US participants as part of the POCN project. Public engagement event (E) as part of the Festival of Physics (February 2025, University of Exeter, Penryn, United Kingdom) and (F) as part of the Pop-Up Shop (September 2023, Cornish Bank, Falmouth, United Kingdom). (G) Teaching children how to measure ocean colour and clarity using a mini-Secchi disk. Undergraduate teaching using the mini-Secchi disk in (H) the Fal Estuary, United Kingdom and (I) Loch Creran, Scotland.
The Secchi disk and FU scale forces the user to directly engage in the measurement process, using their eyes as the sensor, and become connected with their environment in a way that is not feasible with electrical sensing technology. The ergonomic design of the mini- and midi- Secchi disk makes it deployable in a wide range of environments and from a variety of platforms. Together with the simplicity of the method and its long history of use (dating back to before the 19th century), these factors make the mini- and midi- Secchi disk useful for teaching the concepts of optical oceanography and limnology to a wide audience from children to undergraduate students (see Figures 6G–I). It has also been proven to be an engaging tool for public engagement events (Figures 6E,F), requiring only water, a small bucket, and some substance (e.g., food colouring), to modify the colour and clarity of the water in the bucket to demonstrate the principles of the measurement, provoking interest and curiosity. Specific examples where the device has been used in undergraduate teaching include field trips to the Fal Estuary, England (Figure 6H) and Loch Creran, Scotland (Figure 6H), and in public engagement events (Figures 6E,F) as part of the Festival of Physics (February 2025, University of Exeter, Penryn, United Kingdom) and Pop-Up Shop (September 2023, Cornish Bank, Falmouth, United Kingdom).
3.4 Suggestions for methodological improvements and future developments
Figure 7 outlines a range of considerations for methodological improvements to the mini- and midi Secchi disk and possible future project developments. These can be broadly categorised into improvements in the device itself, the involvement of participants, data transfer, data quality and compatibility, and data use.
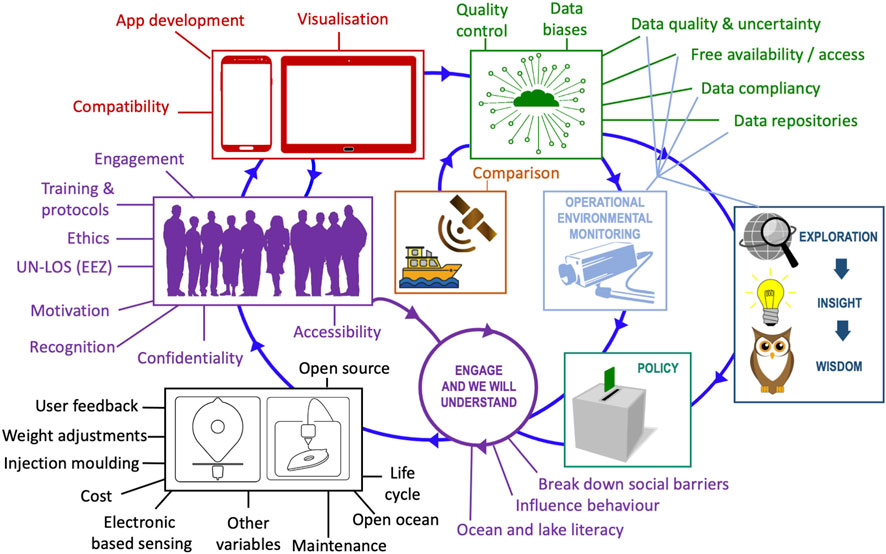
Figure 7. Considerations of methodological improvements to the mini- and midi Secchi disk and future developments. Black colour represents aspects related to the hardware (mini- and midi-Secchi disk), purple participatory science, red data transfer and visualisation, green data storage, dark orange other datasets for comparison, light blue operational monitoring, dark steel blue scientific insight, and turquoise policy.
It is essential that the designs of the mini- and midi-Secchi disk remain openly available to promote community development and innovation, and regional production (e.g., in fabrication labs or makerspaces). Although 3D printing is great for testing and development, to reduce cost, larger scale production through other manufacturing techniques (e.g., injection moulding) is planned in the future. Scrutinising the life cycle of the product, and its environmental impact, is an important part of this process. The vinyl FU colour sticker provides an approximate index of FU colour. To ensure colour fidelity and consistency, we used the same RGB-to-CMYK conversion and printed most stickers through the same company and printer settings (https://www.fastprint.co.uk/ matt, vinyl stickers). Multiple stickers are included to replace those damaged by wear and tear. However, printed colour may still vary across printers, posing challenges for maintaining consistency. Future work should focus on improving the colour fidelity of the FU sticker, for example, validating chromaticity by placing the sticker in the integrating sphere of a spectrophotometer.
User feedback is critical to improve the functionality of the mini- and midi- Secchi disk, which has been a key aspect of all projects. Brewin et al. (2024) reports on a series of improvements to the original device following user feedback, such as the mini-Secchi disk being redesigned to hold more tape (10 m), the development of the midi-Secchi disk (with a 20 m tape), and the strengthening of certain components. Feedback is ongoing and modifications will be integrated into the design in the future. For example, recently some users have expressed an interest in adapting the device for use in clear open ocean waters (where Secchi depths can exceed 40 m). Furthermore, as the Secchi disk must sink vertically for proper measurement, the device often requires additional weights to be added, and adjustments are being considered in future designs. For example, feedback from participants in the POCN noted the weights provided still did not allow for vertical sinking in fast moving tidal waters and currents. This has led to adding a small a bag attachment so the user can easily add more weight if needed and we will be seeking feedback from participants using this new approach to determine its effectiveness. The iterative feedback received in these projects has allowed for adaptive management, refinement, and improvement of our approaches (McBride et al. In Prep). In the NANO-DOAP project, scientists have been experimenting with additional hardware (a modular arm) to help reduce measurement error and improve repeatability when deploying a midi-Secchi disk from a pier.
In recent years there have been developments in low-cost electronic optical sensing packages that measure the optical properties of the water, including fully custom devices and some utilising mobile phone cameras (e.g., Bardaji et al., 2016; Burggraaff et al., 2019; 2022; Droujko and Molnar, 2022; Eidam et al., 2022; Friedrichs et al., 2017; Hixson and Ward, 2022; Hommersom et al., 2012; Leeuw and Boss, 2018; Leeuw et al., 2013; Parra et al., 2018; Rodero et al., 2022). These approaches should be compared with, and run alongside, the mini- and midi-Secchi disk, to broaden knowledge and understanding, and to gain important experience in participatory science using physics-based approaches. For example, improving uncertainties in FU methods from variations in the human eye, printers and mobile phone screens. Recently, Brewin et al. (2024) integrated an electronical sensing package into the mini-Secchi disk, that additionally measures profiles of pressure and temperature, as well as and spectral light, using an AS7341 multi-spectral digital sensor (see also Donini and Piccolroaz, 2025). Such tools may form part of future participatory science projects, possibly benefiting from the established networks of citizens and scientists developed in our projects (Table 1).
Future participatory science projects utilising tools like the mini- and midi-Secchi disk should be guided by the principles of citizen science (Kelly et al., 2020), taking in a wide range of considerations around engagement, motivation, recognition, accessibility and ethics (see Figure 7). In fact, these social aspects are critical to the success of participatory science projects. Considering the diversity of approaches used in the projects studied here, targeting participants of varying backgrounds with differing cultural and societal values (for example, boat owners in Lake Geneva compared with native fisherman in Lake Vembanad), a more detailed analysis on recruitment of participants, their motivations for participating, and what they are willing to invest, would aid future initiatives and should be a focus of future work. Tools for data transfer and participant engagement (e.g., mobile phone apps) need to be managed sustainably, remain compatible with software and mobile phone versions, and should be designed to inform and engage participants (Figure 7). Data ideally should be stored securely in data repositories or servers, be openly available, compliant with standard formats, and come with traceable information on biases, quality control procedures and information on uncertainty (Figure 7). This will facilitate comparisons with other observing networks (e.g., satellites), facilitate seamless integration into operational monitoring networks, and maximise uptake for scientific applications; ultimately feeding into policy, engaging and influencing participants in the process, and promoting environmental literacy (Figure 7).
4 Summary
The mini- and midi-Secchi disk represent an innovation of two old but still relevant techniques for monitoring water colour and clarity. In this paper, we reported on the production and distribution of 927 mini- and midi-Secchi disks primarily through six projects. An example dataset was produced and shown to be useful for verifying satellite imagery and studying lake dynamics. Examples on how the device has been useful for supporting public engagement and education were also provided. Future developments and methodological improvements were discussed that hinge on participant feedback and responsible design of participatory science programmes.
Data availability statement
The original contributions presented in the study are included in the article/Supplementary Material, further inquiries can be directed to the corresponding author.
Ethics statement
Written informed consent was obtained from the individual(s), and minor(s)’ legal guardian/next of kin, for the publication of any potentially identifiable images or data included in this article.
Author contributions
RB: Visualization, Conceptualization, Resources, Investigation, Validation, Funding acquisition, Writing – review and editing, Project administration, Writing – original draft, Supervision, Formal Analysis, Methodology, Data curation, Software. XS: Formal Analysis, Methodology, Data curation, Writing – review and editing. JW: Investigation, Writing – review and editing. TB: Resources, Writing – review and editing, Data curation, Methodology, Project administration, Conceptualization, Funding acquisition. DM: Writing – review and editing, Methodology, Project administration, Data curation. BF: Resources, Funding acquisition, Project administration, Data curation, Writing – review and editing, Methodology, Supervision. PB: Data curation, Methodology, Supervision, Project administration, Writing – review and editing, Funding acquisition, Resources. StS: Writing – review and editing, Data curation, Software, Resources, Funding acquisition, Project administration. NS: Writing – review and editing, Software, Data curation, Resources. GG: Resources, Data curation, Project administration, Writing – review and editing, Funding acquisition, Software, Methodology, Supervision. AS: Data curation, Writing – review and editing. NM: Writing – review and editing, Supervision, Funding acquisition, Software, Resources, Project administration, Data curation, Methodology. JC: Writing – review and editing, Data curation. AA: Supervision, Project administration, Data curation, Software, Resources, Funding acquisition, Writing – review and editing. ShS: Project administration, Writing – review and editing, Supervision, Funding acquisition, Resources. LK: Project administration, Resources, Funding acquisition, Writing – review and editing. ND: Data curation, Writing – review and editing. SuS: Writing – review and editing, Data curation. NP: Writing – review and editing, Project administration, Data curation. LH: Data curation, Writing – review and editing. YG: Data curation, Writing – review and editing. DO: Methodology, Data curation, Project administration, Software, Funding acquisition, Supervision, Writing – review and editing, Resources. AC: Writing – review and editing, Data curation. SM: Writing – review and editing, Data curation. AB: Data curation, Writing – review and editing. AP: Writing – review and editing, Data curation, Project administration. AEA: Writing – review and editing. MN: Data curation, Writing – review and editing. EM: Data curation, Writing – review and editing. OD: Writing – review and editing, Data curation. AG-S: Data curation, Writing – review and editing. WA: Data curation, Writing – review and editing. SK: Writing – review and editing, Data curation. RH-M: Writing – review and editing, Data curation. AM: Writing – review and editing, Data curation. WP: Writing – review and editing, Data curation. NP: Writing – review and editing, Data curation. SB-T: Writing – review and editing, Data curation. LB: Data curation, Writing – review and editing. HS: Data curation, Writing – review and editing. HM: Writing – review and editing, Data curation.
Funding
The author(s) declare that financial support was received for the research and/or publication of this article. RJWB is supported by a UKRI Future Leader Fellowship (MR/V022792/1). BTF, PJB, JW and the POCN project, are supported by the Gordon and Betty Moore Foundation through Grant GBMF11171. The Nippon Foundation and the Partnership for Observation of the Global Ocean provided financial support of the NANO-DOAP project. We thank the Swiss National Science Foundation for funding the LÉMANSCOPE project (LAAGP0_215873). The REVIVAL project was supported jointly by NERC, UK and DST, India (grant numbers NE/R003521/1 and DST/TM/INDO-UK/2K17/64 C & G). The WIDGEON project was funded by the European Space Agency. This work has received funding from the European Union's Horizon 2020 research and innovation programme under grant agreement No. 776480 (MONOCLE).
Acknowledgments
We are strongly indebted to all participants that contributed to the dataset used in the paper, without which this work would not be possible. We thank Carla Berghoff and Sutaporn Bunyajetpong from the NANO-DOAP group. We thank Nima Pahlevan and William Wainwright for guidance on the use of STREAM products. We thank Oghenede Esther Kar for a photo used in Figure 6. We thank the two reviewers for their constructive comments that helped us improve the manuscript.
Conflict of interest
Authors RB and TG support Brewtek Ltd and NS Pocket Science / DDQ B.V.
The remaining authors declare that the research was conducted in the absence of any commercial or financial relationships that could be construed as a potential conflict of interest.
Correction note
A correction has been made to this article. Details can be found at: 10.3389/fenvs.2025.1659157.
Generative AI statement
The author(s) declare that no Generative AI was used in the creation of this manuscript.
Publisher’s note
All claims expressed in this article are solely those of the authors and do not necessarily represent those of their affiliated organizations, or those of the publisher, the editors and the reviewers. Any product that may be evaluated in this article, or claim that may be made by its manufacturer, is not guaranteed or endorsed by the publisher.
Supplementary material
The Supplementary Material for this article can be found online at: https://www.frontiersin.org/articles/10.3389/fenvs.2025.1610130/full#supplementary-material
References
Bardaji, R., Sánchez, A.-M., Simon, C., Wernand, M. R., and Piera, J. (2016). Estimating the underwater diffuse attenuation coefficient with a low-cost instrument: the KdUINO DIY buoy. Sensors 16, 373. doi:10.3390/s16030373
Bonney, R., Phillips, T. B., Ballard, H. L., and Enck, J. W. (2016). Can citizen science enhance public understanding of science? Public Underst. Sci. 25, 2–16. doi:10.1177/0963662515607406
Boyce, D. G., Lewis, M. R., and Worm, B. (2010). Global phytoplankton decline over the past century. Nature 466, 591–596. doi:10.1038/nature09268
Bresnahan, P. J., Rivero-Calle, S., Morrison, J., Feldman, G., Holmes, A., Bailey, S., et al. (2024). High-resolution ocean color imagery from the SeaHawk-HawkEye CubeSat mission. Sci. Data 11, 1246. doi:10.1038/s41597-024-04076-4
Brewin, R. J. W., Brewin, T. G., Bresnahan, P. J., Davis, K., Sun, X., Wilson, N., et al. (2024). Lab on a Secchi disk: a prototype open-source profiling package for low-cost monitoring in aquatic environments. Limnol. Oceanogr. Methods 22, 507–526. doi:10.1002/lom3.10624
Brewin, R. J. W., Brewin, T. G., Phillips, J., Rose, S., Abdulaziz, A., Wimmer, W., et al. (2019). A printable device for measuring clarity and colour in lake and nearshore waters. Sensors Switz. 19, 936. doi:10.3390/s19040936
Brewin, R. J. W., and Dall’Olmo, G. (2024). Ocean-colour anomalies quantified by the human eye. J. Plankton Res. 46, 380–382. doi:10.1093/plankt/fbae027
Brewin, R. J. W., Pitarch, J., Dall’Olmo, G., van der Woerd, H. J., Lin, J., Sun, X., et al. (2023). Evaluating historic and modern optical techniques for monitoring phytoplankton biomass in the Atlantic Ocean. Front. Mar. Sci. 10. doi:10.3389/fmars.2023.1111416
Burggraaff, O., Panchagnula, S., and Snik, F. (2021). Citizen science with colour blindness: a case study on the Forel-Ule scale. PLoS One 16, e0249755. doi:10.1371/journal.pone.0249755
Burggraaff, O., Schmidt, N., Zamorano, J., Pauly, K., Pascual, S., Tapia, C., et al. (2019). Standardized spectral and radiometric calibration of consumer cameras. Opt. Express 27, 19075–19101. doi:10.1364/OE.27.019075
Burggraaff, O., Werther, M., Boss, E. S., Simis, S. G. H., and Snik, F. (2022). Accuracy and reproducibility of above-water radiometry with calibrated smartphone cameras using RAW data. Front. Remote Sens. 3. doi:10.3389/frsen.2022.940096
Busch, J. A., Bardaji, R., Ceccaroni, L., Friedrichs, A., Piera, J., Simon, C., et al. (2016). Citizen bio-optical observations from coast- and ocean and their compatibility with ocean colour satellite measurements. Remote Sens. 8, 879. doi:10.3390/rs8110879
Chandler, M., See, L., Copas, K., Bonde, A. M. Z., López, B. C., Danielsen, F., et al. (2017). Contribution of citizen science towards international biodiversity monitoring. Biol. Conserv. 213, 280–294. doi:10.1016/j.biocon.2016.09.004
Christine, D. I., and Thinyane, M. (2021). Citizen science as a data-based practice: a consideration of data justice. Patterns 2, 100224. doi:10.1016/j.patter.2021.100224
Defoin-Platel, M., and Chami, M. (2007). How ambiguous is the inverse problem of ocean color in coastal waters? J. Geophys Res. Oceans 112. doi:10.1029/2006JC003847
Donini, G., and Piccolroaz, S. (2025). DISCO: a low-cost device-instrumented Secchi disk for water clarity observations. Limnol. Oceanogr. Methods 23, 346–361. doi:10.1002/lom3.10684
Droujko, J., and Molnar, P. (2022). Open-source, low-cost, in-situ turbidity sensor for river network monitoring. Sci. Rep. 12, 10341. doi:10.1038/s41598-022-14228-4
Eidam, E. F., Langhorst, T., Goldstein, E. B., and McLean, M. (2022). OpenOBS: open-source, low-cost optical backscatter sensors for water quality and sediment-transport research. Limnol. Oceanogr. Methods 20, 46–59. doi:10.1002/lom3.10469
Forel, F. A. (1890). Une nouvelle forme de la gamme de couleur pour l’étude de l’eau Des Lacs. Archives Des Sci. Physiques Naturelles/Societe de Physique d’histoire Naturelle de Geneve 6, 0–25.
Friedrichs, A., Busch, J. A., der Woerd, H. J., and Zielinski, O. (2017). SmartFluo: a method and affordable adapter to measure chlorophyll a fluorescence with smartphones. Sensors 17, 678. doi:10.3390/s17040678
George, G., Menon, N. N., Abdulaziz, A., Brewin, R. J. W., Pranav, P., Gopalakrishnan, A., et al. (2021). Citizen scientists contribute to real-time monitoring of Lake water quality using 3D printed mini Secchi disks. Front. Water 3. doi:10.3389/frwa.2021.662142
Heath, J. R., Brewin, R. J. W., Pitarch, J., and Raitsos, D. E. (2024). Detecting centennial changes in the clarity and colour of the Red and Eastern Mediterranean Seas by retracing the “Pola” expeditions. Front. Mar. Sci. 11. doi:10.3389/fmars.2024.1358899
Hixson, J. L., and Ward, A. S. (2022). Hardware selection and performance of low-cost fluorometers. Sensors 22, 2319. doi:10.3390/s22062319
Hommersom, A., Kratzer, S., Laanen, M., Ansko, I., Ligi, M., Bresciani, M., et al. (2012). Intercomparison in the field between the new WISP-3 and other radiometers (TriOS Ramses, ASD FieldSpec, and TACCS). J. Appl. Remote Sens. 6, 063615. doi:10.1117/1.JRS.6.063615
Kelly, R., Fleming, A., Pecl, G. T., von Gönner, J., and Bonn, A. (2020). Citizen science and marine conservation: a global review. Philosophical Trans. R. Soc. B Biol. Sci. 375, 20190461. doi:10.1098/rstb.2019.0461
Kirby, R. R., Beaugrand, G., Kleparski, L., Goodall, S., and Lavender, S. (2021). Citizens and scientists collect comparable oceanographic data: measurements of ocean transparency from the Secchi Disk study and science programmes. Sci. Rep. 11, 15499. doi:10.1038/s41598-021-95029-z
Krug, L., Sarker, S., Huda, S., Gonzalez-Silvera, A., Edward, A., Berghoff, C., et al. (2021). Putting training into practice: an alumni network global monitoring program. Oceanography, 18–19. doi:10.5670/oceanog.2021.supplement.02-08
Lee, Z., Arnone, R., Boyce, D., Franz, B., Greb, S., Hu, C., et al. (2018). Global water clarity: continuing a century-long monitoring. Eos Wash. DC 99. doi:10.1029/2018EO097251
Lee, Z., Shang, S., Hu, C., Du, K., Weidemann, A., Hou, W., et al. (2015). Secchi disk depth: a new theory and mechanistic model for underwater visibility. Remote Sens. Environ. 169, 139–149. doi:10.1016/j.rse.2015.08.002
Leeuw, T., and Boss, E. (2018). The HydroColor app: above water measurements of remote sensing reflectance and turbidity using a smartphone camera. Sensors 18, 256. doi:10.3390/s18010256
Leeuw, T., Boss, E. S., and Wright, D. L. (2013). In situ measurements of phytoplankton fluorescence using low cost electronics. Sensors 13, 7872–7883. doi:10.3390/s130607872
Maciel, D. A., Pahlevan, N., Barbosa, C. C. F., Martins, V. S., Smith, B., O’Shea, R. E., et al. (2023). Towards global long-term water transparency products from the Landsat archive. Remote Sens. Environ. 299, 113889. doi:10.1016/j.rse.2023.113889
Malthus, T. J., Ohmsen, R., and Woerd, H. J. (2020). An evaluation of citizen science smartphone apps for inland water quality assessment. Remote Sens. 12, 1578. doi:10.3390/rs12101578
Menon, N., George, G., Ranith, R., Sajin, V., Murali, S., Abdulaziz, A., et al. (2021). Citizen science tools reveal changes in estuarine water quality following demolition of buildings. Remote Sens. 13, 1683. doi:10.3390/rs13091683
Mini, V. K., Pushpa, V. L., and Manoj, K. B. (2016). Inter-annual and long term variability of rainfall in Kerala. Vayu Mandal 42, 30–35.
Neale, P., Brown, S., Sill, T., Cawood, A., Tzortziou, M., Park, J., et al. (2024). Participatory science methods to monitor water quality and ground truth remote sensing of the Chesapeake Bay. PLoS One 19, e0305505. doi:10.1371/journal.pone.0305505
Novoa, S., Wernand, M., and van der Woerd, H. (2014). The modern Forel-Ule scale: a “do-it-yourself” colour comparator for water monitoring. J. Eur. Opt. Soc. Rapid Publ. 9, 14025. doi:10.2971/jeos.2014.14025
Novoa, S., Wernand, M., and van der Woerd, H. J. (2015). WACODI: a generic algorithm to derive the intrinsic color of natural waters from digital images. Limnol. Oceanogr. Methods 13, 697–711. doi:10.1002/lom3.10059
Pahlevan, N., Smith, B., Alikas, K., Anstee, J., Barbosa, C., Binding, C., et al. (2022). Simultaneous retrieval of selected optical water quality indicators from Landsat-8, Sentinel-2, and Sentinel-3. Remote Sens. Environ. 270, 112860. doi:10.1016/j.rse.2021.112860
Parra, L., Rocher, J., Escrivá, J., and Lloret, J. (2018). Design and development of low cost smart turbidity sensor for water quality monitoring in fish farms. Aquac. Eng. 81, 10–18. doi:10.1016/j.aquaeng.2018.01.004
Pateman, R., Dyke, A., and West, S. (2021). The diversity of participants in environmental citizen science. Citiz. Sci. 6, 9. doi:10.5334/cstp.369
Pitarch, J. (2017). Biases in ocean color over a Secchi disk. Opt. Express 25, A1124. doi:10.1364/OE.25.0A1124
Pitarch, J. (2020). A review of secchi’s contribution to marine optics and the foundation of Secchi disk science. Oceanography 33. doi:10.5670/oceanog.2020.301
Pitarch, J., van der Woerd, H. J., Brewin, R. J. W., and Zielinski, O. (2019). Optical properties of Forel-Ule water types deduced from 15 years of global satellite ocean color observations. Remote Sens. Environ. 231, 111249. doi:10.1016/j.rse.2019.111249
Preisendorfer, R. W. (1986). Eyeball optics of natural waters: Secchi disk science. Washington, DC: Seattle.
Ramírez, S. B., van Meerveld, I., and Seibert, J. (2023). Citizen science approaches for water quality measurements. Sci. Total Environ. 897, 165436. doi:10.1016/j.scitotenv.2023.165436
Rodero, C., Bardaji, R., Olmedo, E., and Piera, J. (2022). Operational monitoring of water quality with a Do-It-Yourself modular instrument. Front. Mar. Sci. 9. doi:10.3389/fmars.2022.1004159
Seafarers, S. D., Lavender, S., Beaugrand, G., Outram, N., Barlow, N., Crotty, D., et al. (2017). Seafarer citizen scientist ocean transparency data as a resource for phytoplankton and climate research. PLoS One 12, e0186092-. doi:10.1371/journal.pone.0186092
Secchi, P. A. (1864). Relazione delle esperienze fatte a bordo della pontificia pirocorvetta l’Immacolata concezione per determinare la trasparenza del mare; Memoria del P. A. Secchi. Il Nuovo Cimento 20, 205–238. doi:10.1007/BF02726911
Smith, D. G., and Davies-Colley, R. J. (1992). Perception of water clarity and colour in terms of suitability for recreational use. J. Environ. Manage 36, 225–235. doi:10.1016/S0301-4797(05)80136-7
Steinmetz, F., Deschamps, P.-Y., and Ramon, D. (2011). Atmospheric correction in presence of sun glint: application to MERIS. Opt. Express 19, 9783. doi:10.1364/OE.19.009783
Ule, W. (1892). Die Bestimmung der Wasserfarbe in den Seen. Kleinere Mitth. Dr. A. Petermanns Mitth. Aus Justus Perthes Geogr. Anst., 70–71.
Wernand, M. (2011). Poseidon’s paintbox: historical archives of ocean colour in global-change perspective. Utrecht, Netherlands: Utrecht University.
Wernand, M. R. (2010). On the history of the Secchi disc. J. Eur. Opt. Soc. Rapid Publ. 5, 10013s. doi:10.2971/jeos.2010.10013s
Wernand, M. R., Hommersom, A., and van der Woerd, H. J. (2013). MERIS-based ocean colour classification with the discrete Forel–Ule scale. Ocean Sci. 9, 477–487. doi:10.5194/os-9-477-2013
Wernand, M. R., and Woerd, H. J. (2010). Spectral analysis of the Forel-Ule ocean colour comparator scale. J. Eur. Opt. Soc. Rapid Publ. 5, 10014s. doi:10.2971/jeos.2010.10014s
Ye, M., and Sun, Y. (2022). Review of the Forel–Ule Index based on in situ and remote sensing methods and application in water quality assessment. Environ. Sci. Pollut. Res. 29, 13024–13041. doi:10.1007/s11356-021-18083-0
Keywords: Secchi disk, Forel-Ule, water clarity, water colour, participatory science
Citation: Brewin RJW, Sun X, Wood JL, Brewin TG, McBride D, Frensley BT, Bresnahan PJ, Simis SGH, Schmidt N, George G, Stoy AC, Menon NN, Chekidhenkuzhiyil J, Abdulaziz A, Sathyendranath S, Krug LA, Das N, Sarker S, Pasche N, Haller L, Ghadyani Y, Odermatt D, Camus A, Mader S, Bonny A, Pochelon A, Akinnigbagbe AE, Noernberg MA, Mahu E, Diankha O, Gonzalez-Silvera A, Ahmed W, Kidwai S, Hernandez-Moresino R, Mohamed AH, Panassa WE, Purba NP, Betancur-Turizo SP, Bernawis LI, Smeti H and Moshi HA (2025) An innovation of two established methods for monitoring water colour and clarity: participatory science using the mini- and midi- secchi disks. Front. Environ. Sci. 13:1610130. doi: 10.3389/fenvs.2025.1610130
Received: 11 April 2025; Accepted: 03 June 2025;
Published: 01 July 2025; Corrected: 11 July 2025.
Edited by:
Ahmet Erkan Kideys, Middle East Technical University, TürkiyeReviewed by:
Dingfeng Yu, Qilu University of Technology, ChinaFrans Snik, Leiden University, Netherlands
Copyright © 2025 Brewin, Sun, Wood, Brewin, McBride, Frensley, Bresnahan, Simis, Schmidt, George, Stoy, Menon, Chekidhenkuzhiyil, Abdulaziz, Sathyendranath, Krug, Das, Sarker, Pasche, Haller, Ghadyani, Odermatt, Camus, Mader, Bonny, Pochelon, Akinnigbagbe, Noernberg, Mahu, Diankha, Gonzalez-Silvera, Ahmed, Kidwai, Hernandez-Moresino, Mohamed, Panassa, Purba, Betancur-Turizo, Bernawis, Smeti and Moshi. This is an open-access article distributed under the terms of the Creative Commons Attribution License (CC BY). The use, distribution or reproduction in other forums is permitted, provided the original author(s) and the copyright owner(s) are credited and that the original publication in this journal is cited, in accordance with accepted academic practice. No use, distribution or reproduction is permitted which does not comply with these terms.
*Correspondence: Robert J. W. Brewin, ci5icmV3aW5AZXhldGVyLmFjLnVr