 Shibin Ma
 Zhongfa Zhou
 Yongrong Zhang1
- 1School of Economics and Management, LiuPanshui Normal University, LiuPanshui, China
- 2School of Geography and Environment/School of Karst Science, GuiZhou Normal University, GuiYang, China
- 3State Key Laboratory Incubation Base for Karst Mountain Ecology Environment of GuiZhou Province, GuiYang, China
Introduction: As an important ecological barrier and major water source in the upper reaches of the Yangtze and Pearl Rivers, the Zhongshan District, Guizhou Province, Southwest China, is of great ecological significance. The gross ecosystem product (GEP) of the area not only reflects the overall condition of the ecosystem but also provides an important basis for regional ecosystem service management and scientific decision-making by quantifying nature’s contribution to human society.
Methods: Through systematic analysis of the land use changes between 2000 and 2020, calculated the GEP for 2000, 2005, 2010, 2015, and 2020. In addition, based on the elasticity index, the impact of land use change on the spatial differentiation of the GEP was further clarified at the raster scale.
Results: The results show that (1) between 2000 and 2020, the main land use types in the study area were dominated by forests, grassland, and agriculture; and the urban areas changed significantly, mainly reflecting the transition between urban land, water bodies, grassland, and shrubland. (2) The GEP exhibited an overall increasing trend in the study area from 2000 to 2020. In terms of the structure of the GEP, 2000–2015 was dominated by regulating services, which mainly manifested in climate regulation, soil and water conservation, flood control, and water conservation; while 2015–2020 was dominated by product provision services, which mainly manifested in agricultural products. (3) From 2000 to 2020, the main contribution of the land use changes to the GEP growth was the increase in the area of the human-exploited wetlands and the transfer of forest, grassland, and shrubland to cropland.
Discussion: The quantitative analysis of the elasticity coefficient further demonstrates that small changes in wetlands and cropland can lead to significant changes in the GEP. These results highlight the importance of incorporating key factors such as the anthropogenic activity intensity and agricultural cropping structure and area in management decisions for ecosystems in the study area.
1 Introduction
GEP refers to the sum of the values of the final goods and services provided by ecosystems to human beings within a certain time frame in a certain region (Ouyang et al., 2020). It involves not only ecological value but also economic and social considerations. By transforming ecological benefits into economic gains, it helps to balance economic growth, environmental protection, and social wellbeing (Ouyang et al., 2013; Lin et al., 2022). As the Chinese government has put forward the concept of “green water and green mountains are golden mountains and silver mountains,” GEP accounting has become an important means of quantifying the value of “green water and green mountains are golden mountains and silver mountains” and of promoting sustainable development. In addition, it has become a concrete measure to realize the concept of “green water and green mountains are golden mountains and silver mountains.” The GEP includes the ecosystem provisioning services value (EPV), ecosystem regulating services value (ERV), and ecosystem cultural services value (ECV) (Ouyang et al., 2020). The functions and conditions of ecosystems are measured and evaluated by calculating the gross value of natural ecosystems such as grasslands, deserts, forests, and wetlands, as well as artificial ecosystems such as farmlands, pastures, and aquaculture farms (European Commission, Organisation for Economic Cooperation and Development, United Nations, World Bank, 2013). Compared with the results of most studies in China and abroad, which only give the economic value of a certain type of natural resources, the GEP includes the sum of the value of the products and services provided by ecosystems for human wellbeing and sustainable economic and social development, which is more complete and more adequate in reflecting the functioning and conditions of ecosystems. It is therefore easier to arouse the attention of the whole of society to ecological environmental protection. In addition, Ouyang et al. (2013) pointed out that GEP accounting can be used to reveal the contribution of ecosystems to economic and social development and human wellbeing, analyze the ecological linkages between regions, and assess the effectiveness and benefits of ecological protection. The current GEP accounting guidelines issued by the Chinese government and some local governments specify the indicator system and methodology of GEP accounting such that the value of provisioning services relies on the output and unit price of products such as agriculture, forestry, livestock, and fishery products (Zhang et al., 2022), the value of cultural services uses the number of tourists at tourist attractions and the cost of tourism for accounting; and the value of regulating services uses the amount of ecosystem service functions combined with the amount of substitution value for accounting.
GEP is a monetary measurement approach employed to evaluate the service functions provided by ecosystems as well as the value of the goods and services they generate (Lajoie-O’Malley et al., 2020; Schirpke et al., 2020). Land serves as the carrier of ecosystem services. In order to meet the increased demand for these services driven by significant population growth, certain regions have commonly experienced over exploitation of land resources, leading to ecological degradation (Langemeyer and Connolly, 2020; Schirpke et al., 2020; Li et al., 2024; Zhang et al., 2023). Changes in land use/cover (LULC) are closely related to ecosystem services. Variations in land use types, patterns, and intensity affect the ecosystem services (Fang et al., 2022; Liu L et al., 2023). The changes in GEP quantitatively and thoroughly reflect the variations in ecosystem services caused by regional LULC changes, which significantly impact the long-term development of both the natural environment and human society (Luo et al., 2023; Su et al., 2023). Therefore, the GEP of a region serves as an indicator of the regional development and utilization status, and is also a key metric for assessing the relationship between human activities and land use. Intensive land use continuously and significantly alters the LULC pattern, thereby influencing the supply and spatial distribution of ecosystem services. A structurally imbalanced LULC configuration severely constrains the full realization of ecosystem service values (Cao et al., 2021; Chen et al., 2021; Shi et al., 2020; Peng and Wang, 2019; Ye et al., 2018; Zhang et al., 2020). For example, China’s rapid socio-economic development has imposed significant pressure on the goal of building an ecological civilization. Achieving comprehensive, coordinated, and sustainable development urgently requires exploring the relationship between LULC changes and ecosystem service values, in order to promote a virtuous cycle of sustainable ecosystem utilization.
To mitigate the degradation of ecosystems in terms of both quantity and quality of services provided, integrated management of land use based on ecosystem service value (ESV) has been implemented globally (Mascarenhas et al., 2015; Staiano et al., 2021; Su et al., 2020). In 2016, the Chinese government proposed the establishment of the main function division conceptual framework (Fan, 2015), a planning scheme for spatial development and protection of China’s national land. This framework is based on the integration of the key ecological function areas into an ecological security strategic pattern referred to as “Two ecological barriers and three shelters”, also known as national barrier zone (Wang et al., 2020). Building upon this foundation to further refine the national ecological security framework by constructing ecological barriers across Yunnan, Guizhou, Sichuan, and Chongqing represents a major front for ecological conservation in the Yangtze River and Pearl River basins (Cui et al., 2025). Therefore, Zhongshan District, located in the western part of Guizhou Province and situated at the confluence of the Yangtze River and Pearl River systems, constitutes a core area within this ecological barrier. Optimizing land use structure, enhancing ecological quality, and strengthening ecosystem service functions hold significant importance. However, current research on large-scale national ecological barrier zones often lacks empirical field data and in-depth analysis, particularly regarding the integration of GEP into land use optimization. This study aims to address this research gap. Quantifying the GEP in ecologically fragile regions characterized by intertwined water systems and understanding its synergistic role in ecological restoration are of critical importance (Guo et al., 2024; Haileslassie et al., 2024).
The current research on the relationship between LULC and ecosystem services primarily relies on the methodology of Xie et al. (2008), which modified the equivalent coefficient values of six LULC types in China based on a questionnaire survey of 700 ecological experts across the country, tailoring these values to China’s specific ecosystem and socio-economic conditions. On this basis, various and inconsistent approaches are used to adjust these equivalent values when calculating regional ecosystem services value (ESV). Some studies rely solely on regional grain production for adjustment (Niu et al., 2018), while others also incorporate NPP data alongside grain yields for modification (Feng et al., 2022). Moreover, since spatial data on ESV are derived from LULC data, their results are highly dependent on LULC. Therefore, the autocorrelation inherent in the relationship between LULC and ESV can influence the outcomes of such analyses.
To address this issue, this study proposes using the GEP based on localized parameter accounting, instead of ESV, to analyze the relationship between LULC and ecosystem services. By drawing on the methodology of spatializing GDP, the study spatially represents the indicators contained in the GEP, including the value of ecosystem provisioning services (EPV) and ecosystem cultural services (ECV), thereby achieving a raster-scale expression of GEP. Based on the analysis of the spatiotemporal characteristics of GEP, the response relationship between GEP and land use change is explored. Specifically, the study aims to achieve the following: (1) identify the patterns and spatial heterogeneity of GEP changes from 2000 to 2020; (2) assess the contributions of provisioning, regulating, and cultural ecosystem services to overall GEP changes; and (3) analyze the impact of land use change on the dynamic characteristics of GEP. A technical flowchart is also provided (Figure 1).
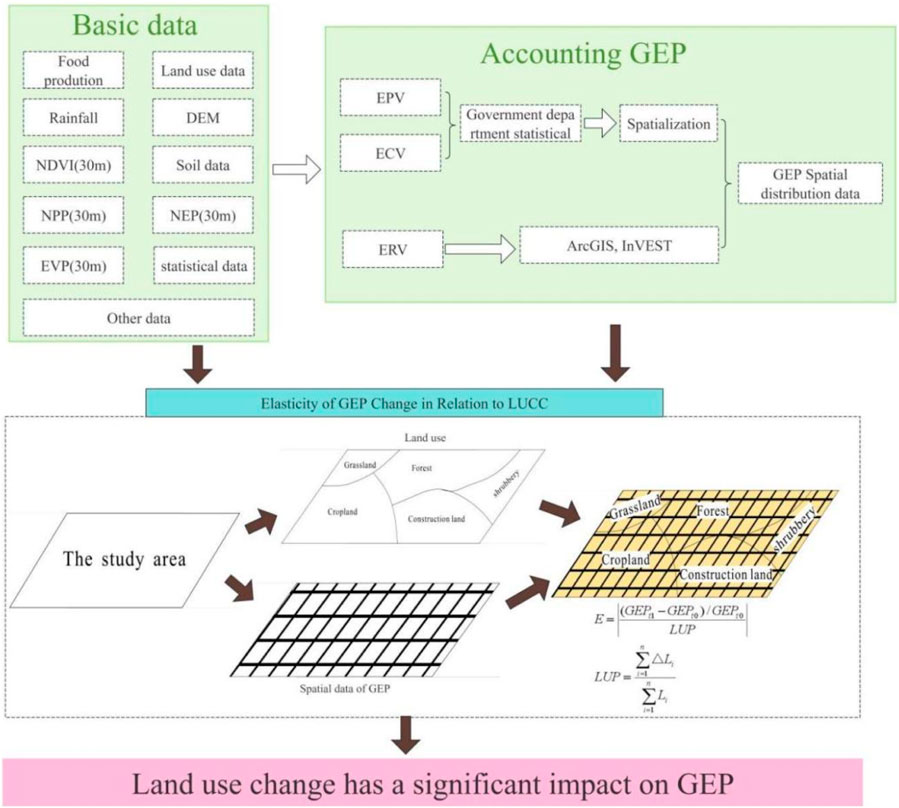
Figure 1. The research workflow of this study.
2 Data and methodology
2.1 Overview of the study area
The Zhongshan District of Liupanshui City in Guizhou Province is in the transition zone between the East Yunnan Plateau and the Central Guizhou Plateau, as well as between the Northwest Guizhou Plateau. Its topography is characterized by significant features. The terrain is generally high in the northwest and low in the northeast. The highest peak, Jiucaiping, is located in Dawan Township and has an altitude of 2,900.3 m, while the lowest point is located at the exit of Jiehe, Dushan Village, Yuezhao Township, at an altitude of 1,450 m, forming a tiered sloping zone. The mountain ranges in the area have a profound influence on the natural environment and are mainly composed of three branches of the Wumeng Mountains. One mountain range, which extends southeastward from Meihuashan through Dewu and Fenghuang, is the basin between the Shucheng River (Xiangshui River) in the Yangtze River water system and the Beipanjiang River in the Pearl River water system. The second mountain range extends southward from Meihuashan to Shuangga Township through Dewu, Huangtupo, and Hecheng, dividing the Shucheng River and the Sanchuan River (the Dahe section). The third mountain range starts from Jiucaiping and extends eastward to Yide in Dahe Township, becoming the basin of Sancha River and Lianshan River, with a total area of 10,343 km2 and a total population of 790,800 people. The average annual temperature is 12.9 °C, and the annual precipitation is 1,158 mm. The main ecosystem types are forests, wetlands, meadows, farmlands, and cities, and the vegetation cover is 76.8% (Figure 2).
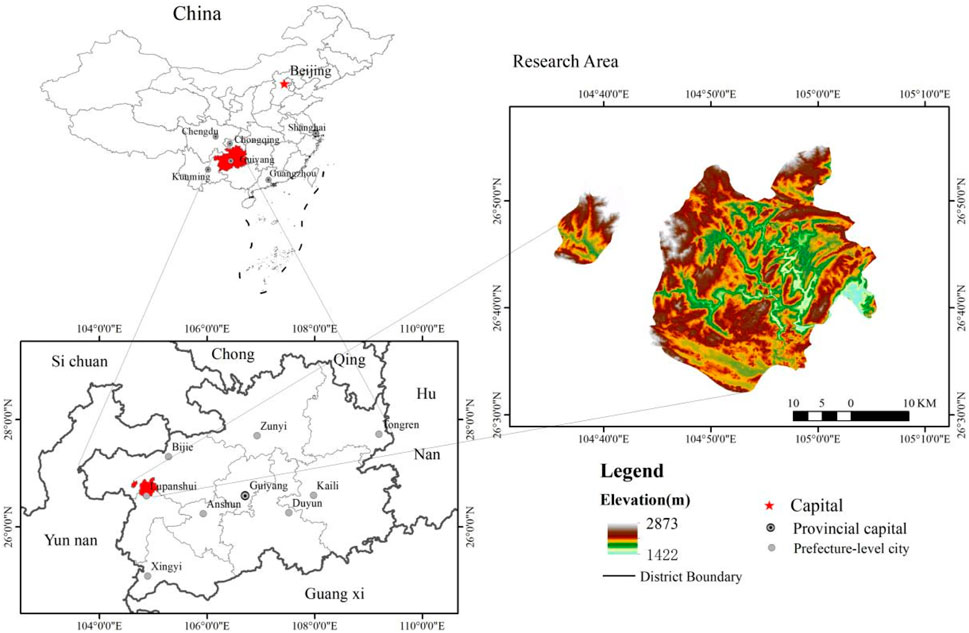
Figure 2. Spatial location and elevation of the Zhongshan District, Guizhou Province.
2.2 Data
This study aims to systematically analyze the changes in the ecosystem gross product (GEP) within the study area across the years 2005, 2010, 2015, and 2020, and to thoroughly investigate the impact of land use changes on GEP. The research incorporates multi-source data, including geospatial information, official statistics provided by the relevant government departments, market price parameters, and other pertinent datasets (Table 1). The data were processed as follows. Given the diversity of the data types and sources involved in this study, the WGS_1984_UTM_Zone_35N standard coordinate system was selected to process the data to ensure data consistency and accuracy. In the GEP calculation process, all of the raster spatial data were unified to a spatial resolution of 30 m × 30 m and were processed by splicing and cropping to meet the specific needs of the study. Upon completion of the calculations, the ecosystem service functions were monetized in RMB based on established price parameters, and the GEP accounting results were spatially displayed. Subsequently, the area of each ecosystem type in each grid was accurately determined, and the GEP of each grid was assessed based on the value of each ecosystem service per unit area, thus realizing the spatial expression of the GEP.
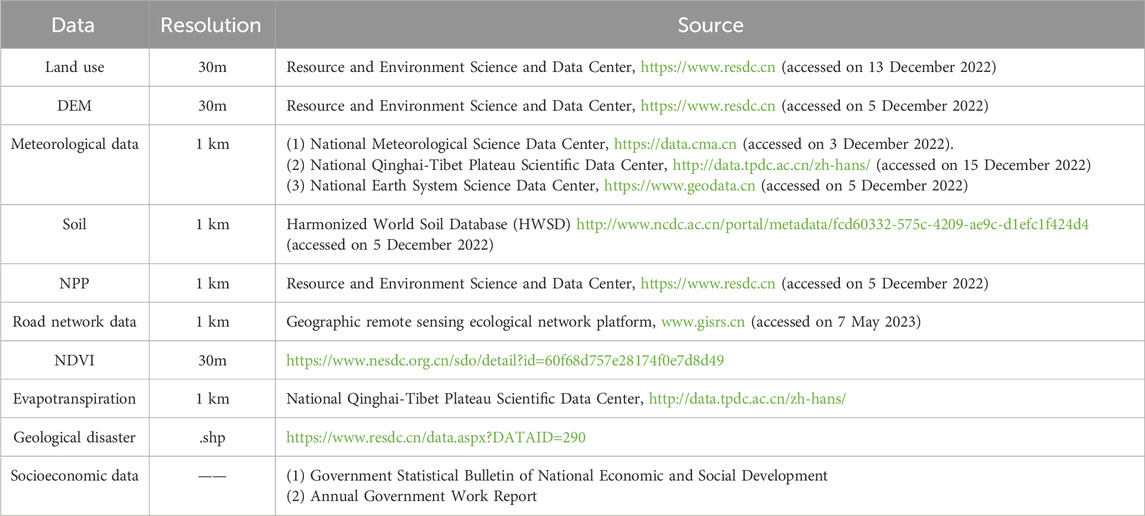
Table 1. Data, resolution, and sources in study area.
2.3 Methods of analysis
The GEP were calculated in 2005, 2010, 2015, and 2020 in the basin of the upper Yangtze River and Pearl River with intersecting water systems. Furthermore, we analyzed the spatiotemporal evolution characteristics of the GEP in the basin between 2000 and 2020. In addition, an elasticity index model was applied to identify the effects of the spatiotemporal variations in the land use changes on the GEP. The research framework is shown in Figure 1.
2.3.1 Land use changes
Based on the characteristics of the ecosystem composition in the basin and with reference to the ecosystem classification system proposed by Ouyang et al. (2013), in this study, the land use types classified into seven categories: dryland, paddy field, forest, grassland, shrubland, wetland, and urban land. The spatiotemporal evolutionary pattern of the land use was quantitatively analyzed through the transfer matrix and the degree of dynamic change.
2.3.1.1 Land use type transfer matrix
By constructing and analyzing the land use type transfer matrix (Hou et al., 2022), the structural characteristics of the land use in the basin and the dynamic change trend of each category were systematically revealed. The calculation formula is as follows Equation 1:
where Sij is the land use status at the beginning and end of the study period, and n is the number of land use types.
2.3.1.2 Degree of change in land use type dynamics
To quantify the degrees of dynamic change of the various land use types within the basin between 2005 and 2020, the research used a dynamic land use model (Liu Y et al., 2023). The indicator of the degree of change can effectively reflect the speed and intensity of the land use change, and it is calculated as follows Equation 2:
where L is the degree of dynamic change of the land use types over time; La is the area of the land use types (km2) at the beginning of the study; Lb is the area of the land use types (km2) at the end of the study; and t is the time span (a).
2.3.2 GEP accounting methods
In this study, a comprehensive accounting framework for the GEP was constructed. The framework considers the importance of the GEP and systematically examines the characteristics of each type of ecosystem in the basin. The system consists of 11 functional indicators, which are categorized into three main types of services and products: material goods, regulating services, and cultural services (see Table 2).
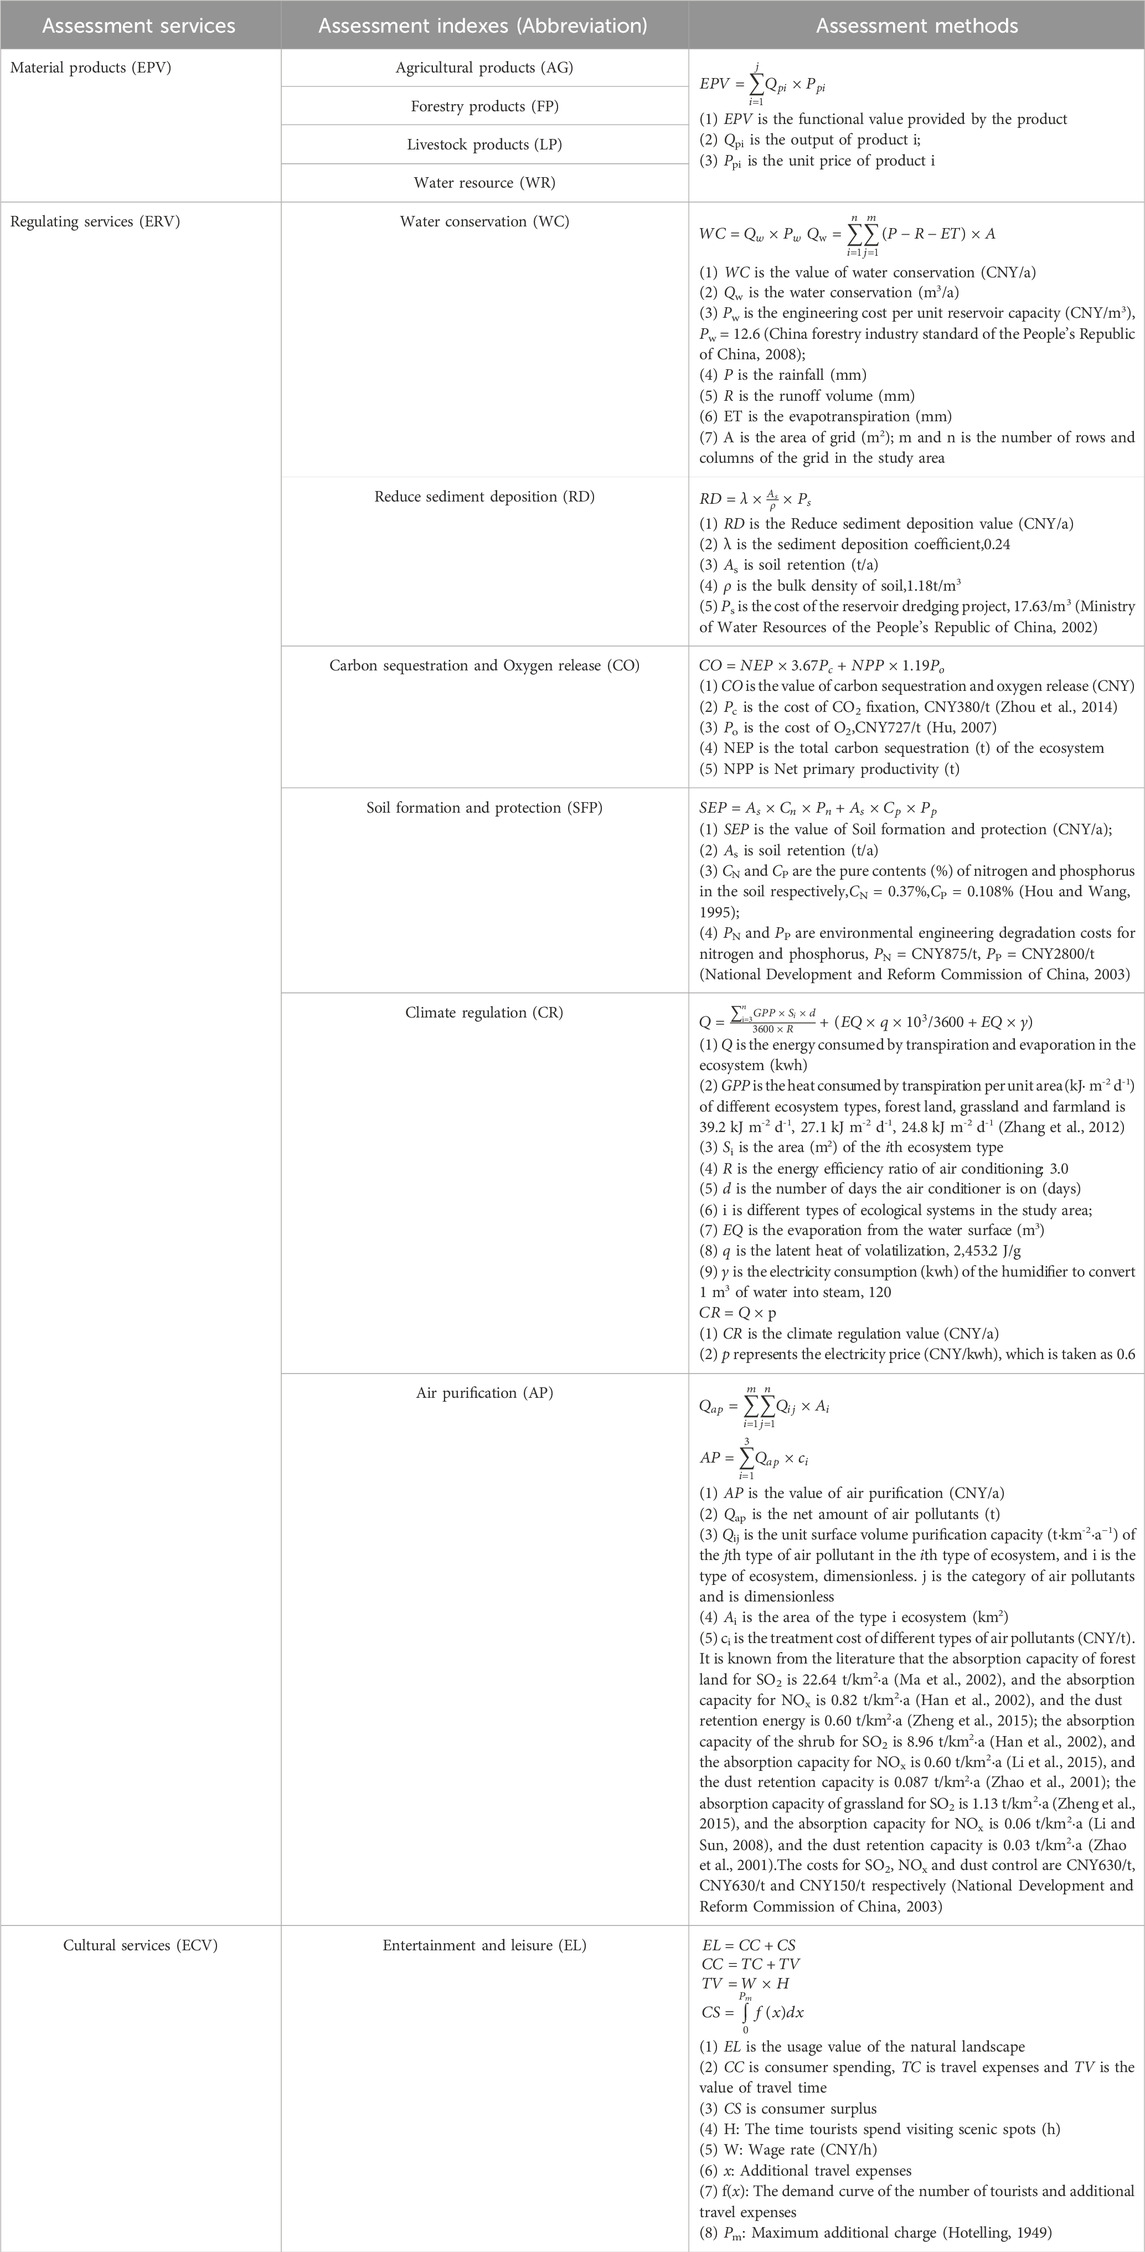
Table 2. Assessment index and method for GEP accounting in the research area.
The GEP accounting covers the values of the material goods, regulating services, and cultural services provided by the ecosystems, but it excludes the value of the supporting services (Wang et al., 2022). It is calculated using the following formula Equation 3:
where EPV is the value of the ecosystem material goods, ERV is the value of the ecosystem regulating services, and ECV is the value of the ecosystem cultural services.
2.3.3 The method of spatializing the EPV and ECV
2.3.3.1 Spatial quantification of the EPV
Based on statistics for 2000–2020, the value of the agriculture, forestry, livestock, and water resources in the study area is calculated. The value of the products provided in Table 2 is attributed to the different ecosystem types (Table 3). The unit value of the products from different ecosystem types (CNY/GRID) is also calculated.

Table 3. The product provides a match with the type of ecosystem.
The NPP, which determines the systematic circulation of matter and energy flow, is also an important indicator of the health of the system (Lieth and Whittaker, 1975). Its size characterizes the ability of an ecosystem to provide products. This view is further supported by the results of Costanza et al. (1998); Costanza and Hannon, (1989); Costanza et al. (1981), who verified the corresponding relationship between the productivity of an ecosystem and its value coefficient. For this reason, the research select the ratio of the NPPi of grid i to the annual average value of the NPP of all of the grid in the biological productivity index to dynamically adjust the value of the ecosystem products (Pi). The details are as follows Equation 4:
where NPPi is the value of the NPP of the ith grid; and NPPmean is the annual average value of the NPP of all of the grid.
The revision method of the GEP is as follows Equations 5, 6:
where EPVij is the value of the jth grid of the ith ecosystem type (CNY/year), and EPVi is the total value of the ith ecosystem type, Ci is the total number of grid of the ith ecosystem type.
2.3.3.2 Spatial quantification of the ECV
The tourism suitability index is corrected as the amount of recreational and leisure value at the raster scale for each ecosystem type. The process of calculating the tourism suitability index is as follows: ① Construct the tourism suitability evaluation index system. The research choose the vegetation coverage, habitat quality, susceptibility to geologic hazards, the distance from the 3A scenic spot, and the distance from the main road. ② Set the weights of each index, which is determined by referring to the research of Guan et al. (2023) and with the aid of expert scoring (Table 4).
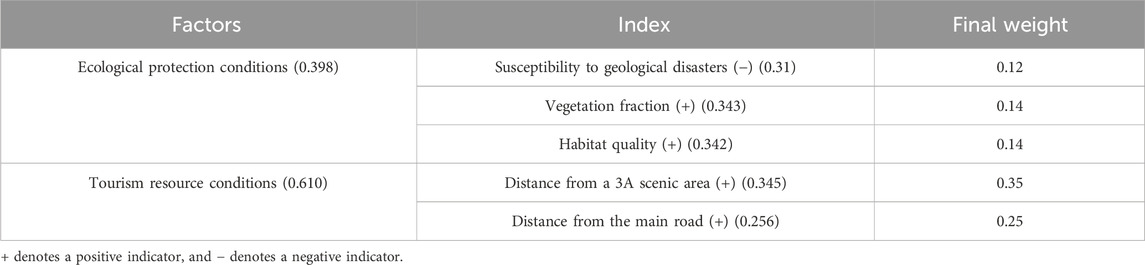
Table 4. Evaluation criteria weights for ecotourism development suitability.
Based on the weights of the evaluation indexes and the evaluation equivalence scores after normalization of the indexes, the ArcGIS raster processor is used to carry out weighted overlay processing of the indexes to obtain the evaluation results of the suitability of ecotourism development. The evaluation formula is as follows Equation 7:
where B is the ecotourism development suitability score of each raster, Wi is the corresponding weight of the index, and Ri is the corresponding image value of the ith index.
The recreational and leisure value on the raster scale is combined with the tourism suitability index to obtain each raster recreational and leisure value. The formula is as follows Equation 8:
where Tij is the recreational and leisure value of each grid, Bij is the suitability score for ecotourism development, and Xij is the original leisure and recreational value of the pixel in the ith row and jth column.
2.3.4 Land use change response elasticity of GEP
Elasticity is a measure of the response of one variable to changes in another. This method is utilized in this paper to measure the percentage change in the GEP caused by land use/land cover change (Yuan et al., 2019). The formulas are as follows Equation 9:
where E is the elasticity index of the GEP in response to land use change; t0 denotes the beginning of the study, and t1 denotes the end of the study; LUP is the percentage of land use change; ∆Li is the area of land use change of land use type i, and Li is the total area of land use type i.
3 Results
3.1 Changes in land use pattern
3.1.1 Land use area changes
The land use structure in the study area remained relatively stable between 2000 and 2020. The hierarchical order of the area proportions of the land use types did not change significantly during this period. Forests accounted for the largest proportion, followed by grassland and shrubland; while urban land, wetlands, and paddy fields accounted for smaller proportions (Table 5).
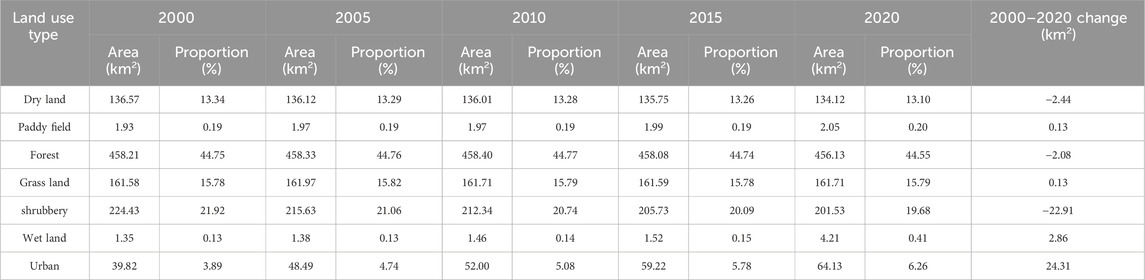
Table 5. Ecosystem area and proportion in the basin from 2005 to 2020.
Between 2000 and 2020, the changes in the land use structure were mainly characterized by significant expansion of urban areas and a corresponding reduction in the areas of the shrubland and dryland. Among them, the expansion of the urban land was the most obvious, with an increase in area of 24.31 km2, accounting for 44.3% of the total area of change. In contrast, the shrubland decreased most significantly, by 22.91km2, accounting for 41.7% of the total area of change. In addition, the wetlands increased by 2.86 km2, accounting for 5.2% of the total area of change; and the area of the forests decreased by 2.08 km2, accounting for 3.7% of the total area of change.
3.1.2 Land use transfer matrix
The transfers between the land use types in the area between 2000 and 2020 mainly involved interchanges between urban land, shrubland, and dryland. The growth of the urban land far outpaced the rate of its transfer, exhibiting an increasing trend from year to year (Figure 3). The expansion of the urban land mainly encroached on areas previously occupied by shrubland, dryland, and grassland, with 86.5%, 11.56%, and 12.1% of the newly developed area being converted from shrubland, dryland, and grassland, respectively. The increase in the area of the wetland was mainly through conversion of shrubland, dryland, and grassland, but the increase was not significant. The shrinkage of the shrubland was mainly attributed to conversion to urban land, grassland, forest, dryland, and water sources. The shrinkage of the dryland was mainly attributed to conversion to grassland, forest, and urban land. The decline in the forest area was mainly attributed to conversion to dryland, grassland, and shrubland. It should be noted that the land use change in the study area during 2010–2015 was relatively small, and the main type of conversion was the conversion of shrubland to built-up land. This conversion accounted for 3.11% of the shrubland in 2020.
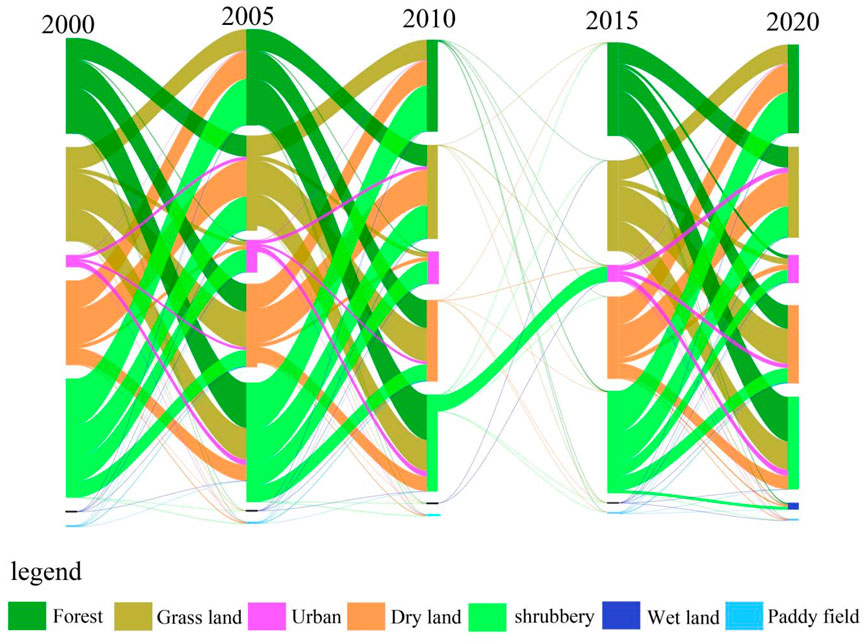
Figure 3. Changes in the transfer of land use in Zhongshan District from 2000 to 2020.
3.1.3 Degree of dynamic land use change
The temporal characteristics of the land use changes in the study area from 2000 to 2020 exhibited a significant pattern (Table 6). During this period, the urban land experienced the fastest expansion, with an increase of 24.31 km2 and a dynamic rate of change of 3.05%. The fastest period of change was from 2000 to 2005, with an increase of 8.67 km2 and a dynamic rate of change of 4.35%. Next, the area of the water sources also expanded considerably, with an increase of 2.86 km2 and a dynamic rate of change of 10.58%. The fastest period of change was 2015–2020, with an increase of 2.69 km2 and a dynamic rate of change of 35.5%. Conversely, the area of the shrubland decreased the fastest, with a decrease of 22.91 km2 and a dynamic rate of change of −0.51%. Throughout the study period, the fastest rate of ecosystem change occurred between 2000 and 2005. During this period, the area of the dryland exhibited a continuous decreasing trend and a relatively stable dynamic rate of change. The area of the grassland exhibited an increasing-decreasing-increasing trend, while the area of the forest initially increased and then decreased; however, the changes in the areas of the grassland and the forest were not significant.

Table 6. Changes in land use area and dynamic degree.
3.2 Spatiotemporal changes in the GEP
3.2.1 GEP accounting results (2000–2020)
The spatial distribution of the GEP value is manifested as: the maximum value of unit grid GEP is predominantly observed in the peripheral and central zones of the study area, specifically encompassing the southwestern urban fringe, the northeastern Jinpen, Nankai and Qinglin townships, as well as the central Dahe Town (Figure 4). The GEP values in the study area in 2000, 2005, 2010, 2015, and 2020 were about CNY74.00 × 108, CNY82.29 × 108, CNY108.09 × 108, CNY115.46 × 108, and CNY173.91 × 108, respectively (Figure 5). These values were equivalent to 2.53, 1.05, 0.58, 0.29, and 0.56 times the GDP of each area in that year, respectively. In 2000, 2005, 2010, 2015, and 2020, the values of the GEP per unit area were CNY7.2 × 106/km2, CNY8.04 × 106/km2, CNY1.05 × 107/km2, CNY1.12 × 107/km2, and CNY1.7 × 107/km2, respectively. Among the services provisioned, the ecosystem regulating services dominated. Specifically, in 2000, 2005, 2010, 2015, and 2020, their values were CNY55.25 × 108, CNY52.51 × 108, CNY51.89 × 108, CNY51.33 × 108, and CNY63.70 × 108, respectively. The value of the regulating services as a proportion of the total GEP was consistently at the highest level during 2000–2015, exceeding 40% each year, but the value of the product provisioning as a proportion of the GEP exceeded that of the regulating services in 2020. The values of the ecosystem product provisioning services in 2000, 2005, 2010, 2015, and 2020 were CNY14.16 × 108, CNY24.91 × 108, CNY44.79 × 108, CNY49.05 × 108, and CNY63.70 × 108, respectively. The values of the ecosystem product provisioning services in 2000, 2005, 2010, 2015, and 2020 were CNY14.16 × 108, CNY24.91 × 108, CNY44.79 × 108, CNY49.05 × 108, and CNY91.99 × 108; and the values of the ecosystem cultural services were CNY4.59 × 108, CNY4.87 × 108, CNY11.41 × 108, CNY15.09 × 108, and CNY18.23 × 108, respectively.
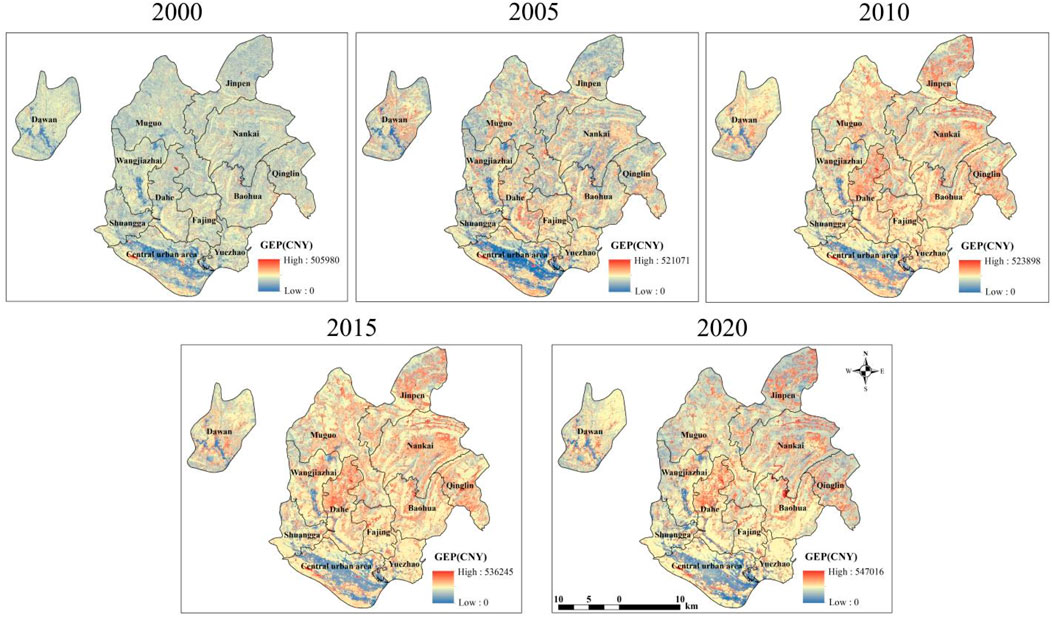
Figure 4. Spatial distribution pattern of GEP per grid (900m2/grid).
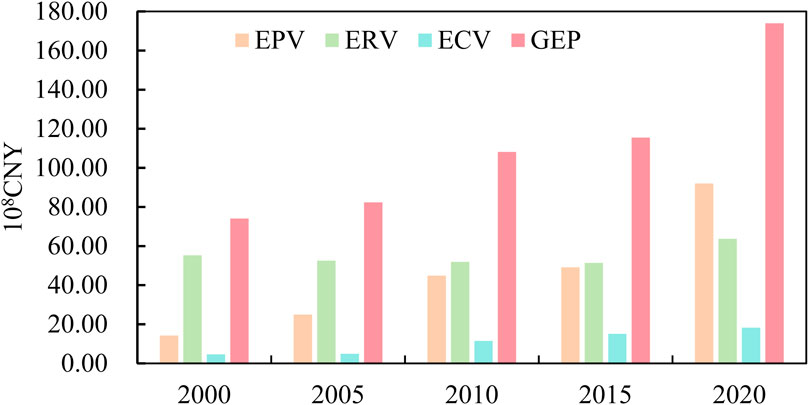
Figure 5. GEP accounting results for 2000, 2005,2010, 2015, and 2020.
3.2.2 Changes in GEP
During 2000–2020, the GEP value in the study area experienced a continuous and significant increase. Compared to the GEP of CNY74.0 × 108 in 2000 (Figure 5), it increased by 11.2% in 2005 (8.2 × 10⁹), 46% in 2010 (10.8 × 10⁹), and 55.6% in 2015 (11.5 × 10⁹). In 2020, the GEP exhibited a substantial increase of 135%. In this case, the GEP increased the most from 2015 to 2020. The structural composition of the GEP changed to some extent throughout the study period (Figure 6). The proportion of the regulating services exceeded those of the product provisioning and cultural services from 2000 to 2015, with proportions of 74.66%, 63.81%, 48.01, and 44.45% in 2000, 2005, 2010, and 2015, respectively, exhibiting a decreasing trend, and by 2020, the proportion of the regulating services was lower than that of the product provision services. It should be noted that the value of the regulating services decreased slightly and then increased significantly between 2000 and 2020, amounting to CNY55.25 × 108 in 2000, CNY52.51 × 108 in 2005, CNY51.89 × 108 in 2010, and CNY51.33 × 108 in 2015. It increased significantly to CNY63.7 × 108 by 2020, indicating a steady improvement in the ecosystem in the study area from 2000 to 2020. The value of the product provision services continued to increase steadily, increasing from CNY14.16 × 108 in 2000 to CNY91.99 × 108 in 2020, a 5.49-fold increase, especially during 2015–2020, when the increase reached 88.2%. The change trend of the value of the cultural services was basically consistent with the change trend of the product provision services. Although it accounted for a relatively small proportion of the GEP, it exhibited a sustained increasing trend during 2000–2020, especially during 2015–2020, with an increase of 20.8%.
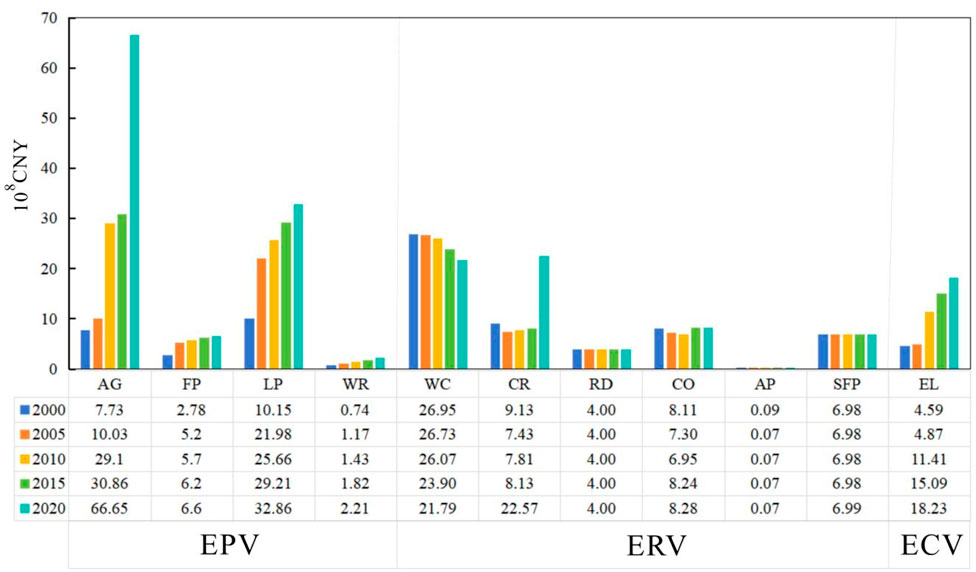
Figure 6. The values of various services in GEP for 2000, 2005, 2010, 2015, and 2020.
Between 2000 and 2015, the area’s ecosystem generally remained stable and improved; there was a substantial improvement after 2015, with the value of the regulating services peaking at CNY63.7 × 108 in 2020 and exhibiting a sustained increasing trend. Compared with the data for 2000, the value of the regulating services increased significantly in 2020, by 15.2%. Among them, the value of the climate regulation services increased most significantly, reaching CNY13.44 × 108, followed by carbon sequestration and oxygen release, with an increase of CNY0.177 × 108. It should be noted that there was a small decrease in the value of the water conservation service, with a decrease of CNY5.13 × 108 (Figure 6).
The value of the material supply products from agriculture, forestry, livestock, and water resources in the study area exhibited significant changes during the study period. The total value of the material supply products peaked at CNY91.99 × 108 in 2020 (Figure 5), while it lowest in 2000, with a total value of CNY14.16 × 108. Compared to 2015, the value of the supply products increased significantly in 2020, by 87.5%. Specifically, the increase in the value of the agriculture products was particularly notable, with an increase of about 116%. In contrast, the values of the forestry, livestock, and water resource products increased slightly, by approximately 6.4%, 12.4%, and 21.4%, respectively, while the values of the fishery products and biomass energy remained relatively stable without significant fluctuations (Figure 6).
The value of the cultural services in the study area increased annually from 2000 to 2020, and the growth rate was the fastest (134%) from 2005 to 2010, followed by 32% from 2010 to 2015. The rapid increase in the value of the cultural tourism during this period was reflected in the dual benefits of the study area’s rich tourism resources and the implementation of the poverty eradication policies. The growth rate fell back to 21% during 2015–2020. The decline in the growth rate was mainly attributed to the impact of the COVID pandemic, which led to a decrease in the number of tourists at popular attractions (Figure 6).
From 2000 to 2020, the spatial distribution of GEP changes in the study area exhibited significant variation. During the period of 2000–2005, areas with declining GEP were predominantly located around the central urban area, whereas regions with increasing GEP were more evenly distributed. From 2005 to 2010, GEP reductions were mainly observed in the southern parts of Dawan Town and Jinpen Township, while increases were primarily concentrated in the central urban area and Dahe town. Between 2010 and 2015, the decline in GEP was mainly found in the southeast of the central urban area, while growth areas remained relatively evenly distributed. A similar spatial pattern persisted from 2015 to 2020. Over the past 2 decades, the overall spatial pattern of GEP changes indicates that the southeastern part of the central urban area and the southern part of Dayuan town experienced concentrated declines, whereas the northeastern regions of Dahe, Jinpen, Nankai, and Qinglin Township were characterized by concentrated increases (Figure 7).
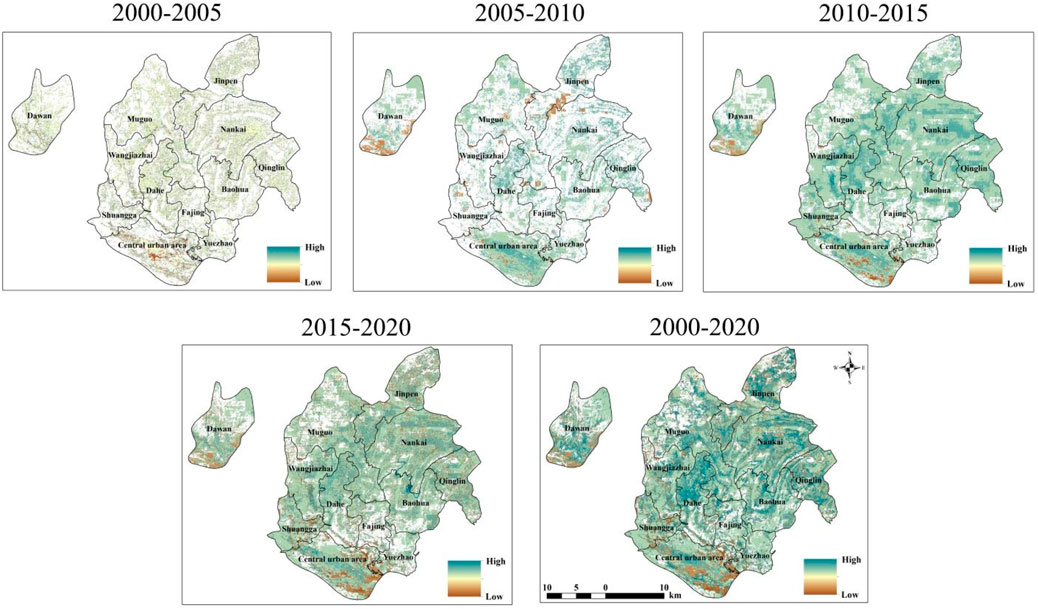
Figure 7. Left to right represents the rate of change in total GEP by county for 2000–2005, 2005–2010, 2010–2015, 2015–2020 and 2000–2020, respectively. Note: Low to high indicates normalized values from 1 to 1.
3.3 Response of GEP to land use changes
To demonstrate the impact of the land use changes on the GEP between 2000 and 2020, the research constructed a GEP transfer matrix based on the land use transfer matrix accounting (see Table 7 for details). Analysis of the matrix revealed that the total area affected by the land use changes between 2000 and 2020 was 89.07 km2, accounting for 8.6% of the total area of the study area. These land use changes resulted in a cumulative increase in the GEP of CNY37.92 × 108 (before removing the effects of inflation and currency depreciation). The increase in the wetland area was mainly attributed to the construction of artificial wetlands, accounting for 6.4% of the change volume in the study area. This resulted in an increase in the GEP of CNY17.77 × 108, which was the most significant increase in the GEP compared to those caused by the other land use types. Although the area of the dryland in the study area decreased by 4.2%, the conversion of grassland, woodland, and shrubland to cropland resulted in an increase in the GEP of CNY15.2 × 108. In addition, the construction land increased by 61%, reducing the GEP byCNY0.79 × 108. Although the forest area decreased, the conversion of the other land use types to forest (mainly due to cropland replenishment and shrubland conversion) contributed to a CNY1.02 × 108 increase in the GEP. The impacts of the other land use type changes were not as significant as those mentioned above.
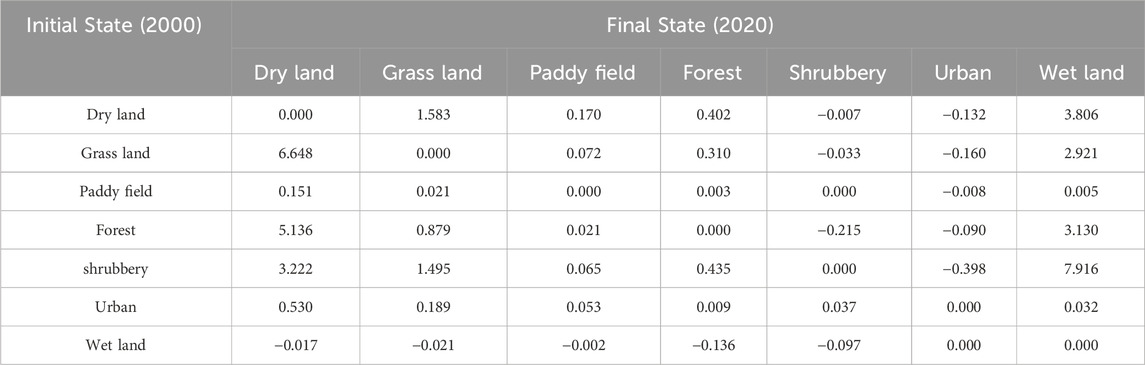
Table 7. Transition matrix of GEP between 2000 and 2020 in the research area. (108CNY).
To quantitatively evaluate the impact of land use change on GEP, this study introduces the elasticity coefficient of GEP in relation to land use change. This coefficient enables quantitative analysis of the relationship by calculating the percentage change in the GEP caused by land use changes. The average values of the elasticity coefficients of the GEP related to land use changes in each time period from 2000 to 2020 were 5.04, 2.42, 3.52, and 21.62, respectively (Table 8). The overall trend of the changes was decreasing followed by increasing. The overall sensitivity coefficient from 2000 to 2020 reached 35.13, indicating that for every 1% change in the land use in the study area during this 20-year period, the GEP changed by 35.13% on average. It is important to focus on 2015–2020, during which the elasticity index increased by more than four times compared to the previous two time periods, proving that the impact of the land use changes on the GEP was significantly higher during this period.
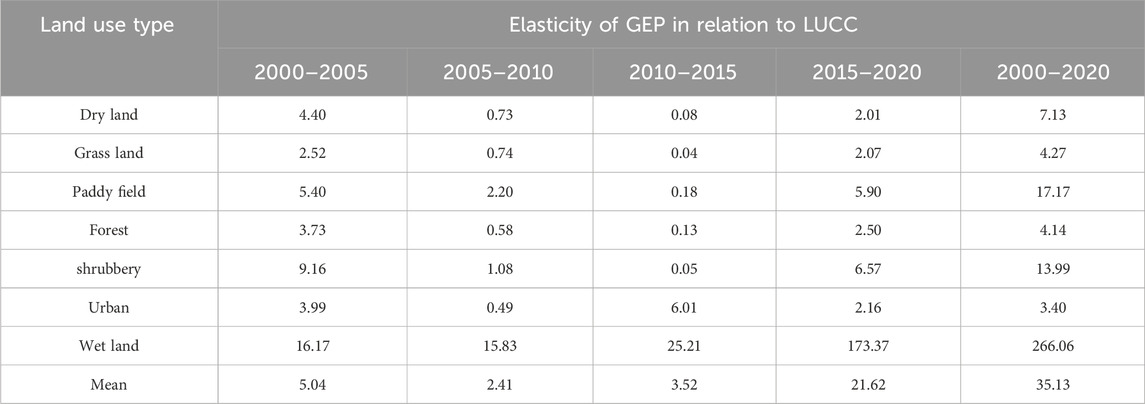
Table 8. Elasticity of GEP with respect to land use/cover change in the research area.
Regarding the sensitivity coefficients of each category, the wetland elasticity index was the highest. After 2015, it reached more than 100, implying that small changes would lead to significant changes in the GEP. The 10.58% increase in the area of the wetlands between 2000 and 2020 proves that the increase in the wetlands was the main contributor to the increase in the GEP in the study area. The sensitivity coefficients of the paddy fields and shrubland were 17.17 and 13.99, respectively. These two types of land use changes also had large impacts on the GEP. The sharp increases in the elasticity coefficients of these types of land indicates that a small change in the land use may lead to a significant change in the GEP.
4 Discussion
4.1 Interactions among GEP changes and ecosystem management policy
The results of our study reveal that in the study area, from 2000 to 2020, the GEP exhibited a general increasing trend, indicating positive improvement of the ecological environment and the ecosystem service functions. These results are related to the ecological protection policies implemented in the study area in recent years. In recent decades, local governments have implemented a series of major policies and ecological programs that have had profound impacts on the ecosystem services in the area. Since 2000, the Chinese government has implemented major ecological projects in Southwest China (Zeng et al., 2024), including rocky desertification control and returning farmland to forest projects, which have promoted vegetation restoration and management of degraded land in the study area (Ma et al., 2019), thereby improving the stability of the ecosystems and laying a foundation for the growth of the GEP in the area. After 2009, the local government issued the Pilot Project Management Measures for the Comprehensive Treatment of Liupanshui City Rocky Desertification (Trial) and the Liupanshui City 12th Five-Year Plan for Ecological Environmental Protection, aiming to optimize the land use structure of the study area and strengthen ecological restoration and construction. Through the implementation of measures such as rational land use planning, an ecological maintenance strategy, and an ecological industry development strategy, the government has changed the green ecological development mode. In this context, the area’s economy, society, population, resources, and environment have achieved sustainable development, thereby optimizing the land use structure, enhancing ecosystem services, and positively affecting the GEP. After 2015, to promote the coordinated development of the Pan-Pearl River Delta, the national government introduced a series of important policies, including the State Council’s Framework Agreement on the Implementation of the Pan-Pearl River Delta. In this context, human activities have also been greatly influenced. The local government utilized economic incentives, such as the construction of an ecologically clean sub-basin, to encourage people to participate in ecological restoration efforts. As a result, ecosystem functions have been further restored, and the supply capacity of ecosystem services has been strengthened, thus promoting the growth of the GEP. In conclusion, the growth of the GEP in the area of the upper Yangtze River and Pearl River, which contains intersecting water systems, has been closely related to the ecological protection policies and major ecological projects implemented by the government.
4.2 The impact of the implementation of poverty alleviation policies on GEP
The GEP reflects the overall health of the ecosystem. Its assessment enables decision makers to accurately identify growth points in the value of ecological products and provides a scientific basis and guidance for the formulation and implementation of relevant policies by government departments. The research found that the main contributor to the GEP growth during 2000–2020 was the increase in the value of the product provision services. The main contributing factors are the significant increase in the value of AG due to the rise in both their output and unit price, as well as the increase in the value of WR resulting from the expansion of wetland areas. The period from 2015 to 2020 was a crucial time for the implementation of China’s poverty alleviation strategy. During this period, the agricultural planting structure in Liupanshui City, Guizhou Province, to which the research area belongs, underwent significant changes. It vigorously developed mountainous characteristic planting industries such as kiwi, tea, walnut, rosa roxburghii and flue-cured tobacco, as well as breeding industries such as Nubian sheep, beef cattle, and undergrowth in the forest. In addition, there are conventional planting industries such as vegetables, tea, Chinese medicinal materials and potatoes, forming 15 agricultural base of over 10,000 mu and 282 over 1,000 mu (The Lecturer Group of the CPC Guizhou Provincial Committee, 2018). The high value added by these agricultural products increased the value of the products in the GEP.
The development of rural tourism is the main factor driving the growth of ECV in the study area, which in turn has increased the total amount of GEP. By the end of 2021, among the 18,091 administrative villages in the province, approximately 3,500 had developed rural tourism initiatives. There were 23 provincial-level or higher key towns for rural tourism and 300 key villages, including 38 national-level key villages for rural tourism, ranking third nationwide in terms of the number of selected villages. In 2019, rural tourism in the province attracted 515 million visitors and generated revenue of CNY 278.416 billion, accounting for 45.4% and 22.6% of the total number of tourists and tourism revenue in the province, respectively. Since 2016, approximately 1,138,000 individuals registered under the poverty alleviation program have benefited from these efforts (Yang, 2019).
4.3 Planning and suggestions
Policymakers can utilize the results of GEP accounting and the driving factors behind GEP changes to identify the types of ecosystem services that have the greatest impact on human wellbeing. This helps in determining which ecosystem service functions require protection and enhancement (Ouyang et al., 2020). As can be seen from the analysis in Sections 4.1,4.2, the changes in GEP in the study area are the combined result of natural and socioeconomic factors. Vegetation restoration, development of agriculture, forestry, and animal husbandry, and an increase in wetland areas are the main reasons for the improvement of regional GEP. Based on this, optimized land-use measures for maximizing GEP in the study area are clearly identified:
1. Vegetation restoration mainly targets land use types such as forestland, shrubland, and grassland. However, combined with regional land use change analysis, it is evident that the areas of forestland, shrubland, and grassland in the study region have slightly decreased from 2000 to 2020. In response to this situation, the study area must strictly abide by the ecological protection red line, tightly control the conversion of ecological land into production and residential land, and strengthen ecological conservation efforts for forest and grassland resources. It is necessary to further improve vegetation coverage in forestland, shrubland, and grassland areas. For scattered farmland with slopes exceeding 25°, efforts should be made to implement reforestation and grassland restoration programs. Additionally, land rehabilitation and greening work should be strengthened to enhance the value of ecosystem services such as water conservation, air purification, and carbon sequestration and oxygen release.
2. The development of agriculture, forestry, and animal husbandry primarily targets land-use types such as forestland, grassland, and cropland. When the availability of these three land-use types is decreasing, it is essential to strictly control the conversion of basic cropland into construction land, and to strengthen cropland protection. Within the carrying capacity of farmland, diversified cropping patterns should be enhanced to increase the planting area of specialty crops such as kiwifruit, prairie tea, and flue-cured tobacco. As developing distinctive local industries is more beneficial for synergistic improvements in ecological and production performance (Zhang et al., 2025), efforts should persist in transformation to promote development, and in development to advance conservation. On the basis of actively protecting forestland and increasing vegetation coverage, industries such as under-forest animal husbandry and the cultivation of traditional Chinese medicinal herbs should be promoted.
3. Natural wetlands should be strictly protected, while the area of artificial wetlands should be appropriately expanded. The conversion of pond wetlands to other land use types must be strictly controlled. Given that the value of wetland ecosystem services is closely linked to both water quality and quantity, it is essential to enhance the supply of wetland water resources while maintaining stringent control over water quality. This will improve the environmental carrying capacity of wetland ecosystems and fully realize their critical ecosystem services, including water supply, water purification, and flood regulation (Chen et al., 2020; Twery et al., 2005).
4. Reasonable urban planning and improved transportation infrastructure can effectively enhance regional GEP (Zhang et al., 2024). Therefore, during the process of urban expansion, ecological vulnerable areas should be avoided as much as possible to minimize ecological damage. Strengthening regional transportation infrastructure not only provides transportation support for the development of agriculture, forestry, animal husbandry, and tourism, promoting the growth of EPV and ECV values, but also facilitates the implementation of ecological restoration projects, thereby increasing ERV value.
4.4 Limitations of the study and plans
Although this study has revealed some valuable insights, it is still necessary to recognize some of its limitations. First, in this study, we mainly focused on the area in the upper reaches of the Yangtze River and the Pearl River with intersecting water systems and examined the GEP and its responses to land use changes in this area. However, it is important to recognize that ecosystem services may be subject to the influences of factors outside the study area, such as human activities outside the administrative area, transboundary impacts, and interregional interactions. Future studies should consider expanding the study area to include the entire Pearl River and Yangtze River basin areas, thus covering a broader ecological and socio-economic context. Second, the analysis only explored the response of the GEP to land use changes, while the influences of other factors (e.g., GDP and population density) were not analyzed. In the future, analysis should be conducted on the factors influencing the changes in the GEP from multiple perspectives, i.e., by systematically identifying the variables controlling the changes in the ecosystem quality. In addition, the trend of future GEP changes should be predicted through simulation.
5 Conclusion
In this study, to systematically explore the spatiotemporal evolution characteristics of the GEP in the area of the upper Yangtze River and Pearl River, which contains intersecting water systems, from 2000 to 2020, we used the elasticity index model to analyze its response to land use changes. The results show that the land use changes significantly affected the GEP. Therefore, this study suggest that more attention should be paid to the effects of factors such as ecological governance policies and agricultural cultivation structure on the ecosystem services in the study area. The main research results are summarized below.
1. The temporal characteristics of the land use changes in the study area from 2000 to 2020 exhibited a remarkable pattern. The expansion of the urban land occurred at the fastest rate, the area of the water sources also expanded considerably, and the area of the shrubland decreased the fastest. The changes in the areas of the dryland, grassland, and forest were small.
2. From 2000 to 2020, the GEP in the study area exhibited and increasing trend overall. In terms of the structure of the GEP, 2000–2015 was dominated by regulating services, mainly manifested in climate regulation, soil and water conservation, flood regulation, storage, and water containment; while 2015–2020 was dominated by product provision services, mainly manifested in agricultural products.
3. In 2000–2020, the land use changes that made the greatest contributions to the GEP growth were the increase in the wetland area and the conversion of forest, grassland, and shrubland to cropland. Quantitative analysis of the elasticity coefficient revealed that small changes in the wetlands and cropland may lead to significant changes in the GEP.
In conclusion, by studying the response of GEP to land-use change, we can enhance our understanding of the driving factors behind ecosystems in the ecotone of the Yangtze River and Pearl River basins. By identifying the differences in management requirements based on the contributions of various land-use types to changes in GEP, this study ultimately proposes targeted measures to improve the ecosystem quality of the core area of the Yunnan-Guizhou-Sichuan-Chongqing ecological barrier and to maximize GEP functionality.
Data availability statement
The original contributions presented in the study are included in the article/supplementary material, further inquiries can be directed to the corresponding author.
Author contributions
SM: Writing – original draft, Writing – review and editing. ZZ: Funding acquisition, Methodology, Writing – review and editing. YZ: Data curation, Methodology, Writing – review and editing. CD: Software, Writing – original draft. CZ: Software, Writing – original draft.
Funding
The author(s) declare that financial support was received for the research and/or publication of this article. This study was financially supported by Guizhou Provincial Key Technology R&D Program:Research on the key technologies of evaluation, accounting and promotion of the value of land-scale karst ecological products (NO.QianKeHe supports [2023] general 246), the Research Foundation for Advanced Talents of Liupanshui Normal University (Grant No. LPSSYKYJJ202209).
Conflict of interest
The authors declare that the research was conducted in the absence of any commercial or financial relationships that could be construed as a potential conflict of interest.
Generative AI statement
The author(s) declare that no Generative AI was used in the creation of this manuscript.
Any alternative text (alt text) provided alongside figures in this article has been generated by Frontiers with the support of artificial intelligence and reasonable efforts have been made to ensure accuracy, including review by the authors wherever possible. If you identify any issues, please contact us.
Publisher’s note
All claims expressed in this article are solely those of the authors and do not necessarily represent those of their affiliated organizations, or those of the publisher, the editors and the reviewers. Any product that may be evaluated in this article, or claim that may be made by its manufacturer, is not guaranteed or endorsed by the publisher.
References
Cao, Y. N., Kong, L. Q., Zhang, L. F., and Ouyang, Z. Y. (2021). The balance between economic development and ecosystem service value in the process of land urbanization: a case study of China’s land urbanization from 2000 to 2015. Land Use Policy 108, 105536. doi:10.1016/j.landusepol.2021.105536
Chen, B., Cui, B., and Ding, X. (2020). Integration of natural resources government service system and data fusion construction: taking Nanjing as an example. Bull. Surv. Mapp. 12, 75–78. doi:10.13474/j.cnki.11-2246.2020.0394
Chen, Z. Z., Lei, J. R., Wu, T. T., Chen, D. X., Zhou, Z., Li, Y. L., et al. (2021). Gross ecosystem product accounting of national park: taking hainan Tropical rainforest national park as an example. Chin. J. Appl. Ecol. 32 (11), 3883–3892. doi:10.13287/j.1001-9332.202111.010
China forestry industry standard of the People’s Republic of China (2008). LY/T1721-2008: specifications for assessment of forest ecosystem service function.
Costanza, R., and Hannon, B. M. (1989). “Dealing with the ‘mixed units’ problem in ecosystem network analysis//wulff F, field J G, mann K H. Network analysis,” in Marine ecology: methods and applications (Berlin Heidelberg: Springer-Verlag), 90–115.
Costanza, R., and Neill, C. (1981). “The energy embodied in the products of the biospher,” in Energy and ecological modeling. Amsterdam: Elsevier, 745–755.
Costanza, R., d'Arge, R., de Groot, R., Farber, S., Grasso, M., Hannon, B., et al. (1998). The value of ecosystem services: putting the issues in perspective. Ecol. Econ. 25 (1), 67–72. doi:10.1016/S0921-8009(98)00019-6
Cui, P., Yang, Y. P., Wang, G. X., Zhu, B., Lu, X. Y., Sun, G., et al. (2025). Technological challenges and development directions of ecological security barrier construction in Yun-Gui-Chuan-Yu region. Bull. Chin. Acad. Sci. 40 (6), 980–990. doi:10.3724/j.issn.1000-3045.20250518002
European Commission, Organisation for Economic Cooperation and Development, United Nations, World Bank (2013). System of environmental-economic accounting 2012: experimental ecosystem accounting. Available online at: http://unstats.un.org/unsd/envaccounting/eea_white_cover.pdf.
Fan, J. (2015). Draft of major function oriented zoning of China. Acta Geogr. Sin. 70 (2), 186–201. doi:10.11821/yj2010030001
Fang, Z., Ding, T. H., Chen, J. Y., Xue, S., Zhou, Q., Wang, Y. D., et al. (2022). Impacts of land use/land cover changes on ecosystem services in ecologically fragile regions. Sci. Total Environ. 831, 154967. doi:10.1016/j.scitotenv.2022.154967
Feng, Q., Zhou, Z. F., Chen, Q., and Zhu, C. L. (2022). Spatial-temporal evolution research of ecosystem service value in ecologically vulnerable karst regions under the perspective of poverty alleviation relocation. Acta Ecol. Sin. 42 (7), 2708–2717. doi:10.5846/stxb202103260798
Guan, Y., Tang, Z. X., and Chen, Z. Y. (2023). Evaluation on the suitability of ecotourism development in Qilian Mountain National Park (Qinghai area). J. Arid. Land Resour. Environ. 37 (12), 151–161. doi:10.13448/j.cnki.jalre.2023.289
Guo, J. Y., and Wang, L. (2024). Spatiotemporal variations in gross ecosystem product and its relationship with economic growth in ecologically vulnerable watershed areas: a case study of yongding river basin. Sustainability 16, 9383. doi:10.13287/j.1001-9332.2002.0143
Han, Y., Li, Z. Z., and Liu, R. K. (2002). Potential of purifying SO2 of main tree species and their planting quota in Shenyang area. Chin. J. Appl. Ecol. 13 (5), 601–604. doi:10.13287/j.1001-9332
Haileslassie, A., Taye, M. T., Diyessa, M., and Mekuria, W. (2024). Land use and land cover changes and their effect on ecosystem service values in the bale ecoregion, southeastern Ethiopia. Front. Environ. Sci. 12, 1386026. doi:10.3389/fenvs.2024.1386026
Hotelling, H. L. (1949). In An Economic Study of the Monetary Evaluation of Recreation in the National Parks. Washington, DC: National Park Service.
Hou, Y. Z., and Wang, Q. (1995). Study on forest resources accounting in China. Beijing: China Forestry Publishing House.
Hou, Y. F., Chen, Y. N., Li, Z., Li, Y. P., Sun, F., Zhang, S., et al. (2022). Land use dynamic changes in an arid inland river basin based on multi-scenario simulation. Remote Sens. 14 (12), 2797. doi:10.3390/rs14122797
Hu, H. S. (2007). Evaluation of the service value of the forest ecosystem in lushan mountain nature reserve. Resour. Sci. 29 (5), 28–36. doi:10.3321/j.issn:1007-7588.2007.05.005
Lajoie-O’Malley, A., Bronson, K., Van der Burg, S., and Klerkx, L. (2020). The future(s) of digital agriculture and sustainable food systems: an analysis of high-level policy documents. Ecosyst. Serv. 45, 101183. doi:10.1016/j.ecoser.2020.101183
Langemeyer, J., and Connolly, J. J. T. (2020). Weaving notions of justice into urban ecosystem services research and practice. Environ. Sci. & policy 109, 1–14. doi:10.1016/j.envsci.2020.03.021
Li, Q., and Sun, G. N. (2008). Study on annual changes and synchronousness of atmosphere pollution reduction by woodland and grassland in Xi’an. Syst. Sci. Compr. Stud. Agric. 24 (1), 73–77.
Li, G. W., Zhao, W., Wei, Y. W., Fang, X. M., Gao, B., and Dai, L. M. (2015). Evaluation on the influence of natural forest protection program on forest ecosystem service function in Changbai Mountain. Acta Ecol. Sin. 35 (4), 984–992. doi:10.5846/stxb201304240799
Li, Y., Geng, H. C., Wu, L. H., Luo, G. J., and Chen, F. (2024). Ecosystem service functions of a typical karst urban basin based on land use change. J. Resour. Ecol. 15, 1–14. doi:10.5814/j.issn.1674-764x.2024.01.001
Lieth, H., and Whittaker, R. (1975). Primary productivity of the biosphere. New York: Springer Berlin Heidelberg.
Lin, Z. Y., Wu, T., Xiao, Y., Rao, E. M., Shi, X. W., and Ouyang, Z. Y. (2022). Protecting biodiversity to support ecosystem services: an analysis of trade-offs and synergies in southwestern China. J. Appl. Ecol. 59, 2440–2451. doi:10.1111/1365-2664.14248
Liu L, L. T., Zhang, H. J., Zhang, Y., Li, F. Q., Chen, X. T., Wang, Y., et al. (2023). Spatiotemporal heterogeneity correction in land ecosystem services and its value assessment: a case study of the Loess Plateau of China. Environ. Sci. Pollut. Res. 30, 47561–47579. doi:10.1007/s11356-023-25338-5
Liu Y, Y., Yuan, X. L., Li, J. X., Qian, K. X., Yan, W., Yang, X. Y., et al. (2023). Tradeoffs and synergistic relationships of ecosystem services under land use change in Xinjiang from 1990 to 2020: a Bayesian network analysis. Sci. Total Environ. 858, 160015. doi:10.1016/j.scitotenv.2022.160015
Luo, Z. B., Chen, X., Li, N., Li, J. Y., Zhang, W. T., and Wang, T. W. (2023). Spatiotemporal foresting of soil erosion for SSP-RCP scenarios considering local vegetation restoration project: a case study in the three gorges reservoir (TGR) area, China. J. Environ. Manag. 337, 117717. doi:10.1016/j.jenvman.2023.117717
Ma, X. H., Sun, G. N., and Ren, Z. Y. (2002). The values of vegetation purified air and its measure in Xi’an city. J. Arid Land Resour. Environ. 16 (4), 85–86.
Ma, S. B., An, Y. L., Yang, G. B., and Zhang, Y. R. (2019). The analysis of distribution characteristics and reasons of NDVI change trends along the terrain gradient. Ecol. Environ. Sci. 28 (5), 857–864. doi:10.16258/j.cnki.1674-5906.2019.05.001
Mascarenhas, A., Ramos, T. B., Haase, D., and Santos, R. (2015). Ecosystem services in spatial planning and strategic environmental assessment-A European and Portuguese profile. Land Use Policy 48, 158–169. doi:10.1016/j.landusepol.2015.05.012
Ministry of Water Resources of the People’s Republic of China (2002). The building built water engineering budget norm. Beijing, China: Yellow River Water Conservancy Press.
National Development and Reform Commission of China (2003). Levy standard of pollution discharge fees and calculation methods.
Niu, Q., Zhou, X., Xu, Y. X., Yang, J. Z., and Zhang, J. (2018). Analysis of ecosystem service value evolution of Wujiang River basin of Guizhou Province based on land use. Ecol. Sci. 37 (5), 165–173. doi:10.14108/j.cnki.1008-8873.2018.05.022
Ouyang, Z. Y., Zhu, C. Q., Yang, G. B., Xu, W. H., Zheng, H., Zheng, Y., et al. (2013). Gross ecosystem product: concept, accounting framework and case study. Acta Ecol. Sin. 33, 6747–6761. doi:10.5846/stxb201310092428
Ouyang, Z. Y., Song, C. S., Zheng, H., Polasky, S., Xiao, Y., Bateman, I. J., et al. (2020). Using gross ecosystem product (GEP) to value nature in decision making. Proc. Natl. Acad. Sci. U. S. A. 117, 14593–14601. doi:10.1073/pnas.1911439117
Peng, L., and Wang, X. X. (2019). What is the relationship between ecosystem services and urbanization? A case study of the mountainous areas in Southwest China. J. Mt. Sci. 16 (12), 2867–2881. doi:10.1007/s11629-019-5390-2
Schirpke, U., Tscholl, S., and Tasser, E. (2020). Spatio-temporal changes in ecosystem service values:effects of land-use changes from past to future (1860–2100). J. Environ. Manag. 272, 111068. doi:10.1016/j.jenvman.2020.111068
Shi, F., Xiao, Y., Xu, W. H., Zou, Z. Y., Dailyh, G. C., Bateman, I. J., et al. (2020). Using gross ecosystem product (GEP) to value nature in decision making. Proc. Natl. Acad. Sci. 117, 14593–14601. doi:10.1073/pnas.1911439117
Staiano, L., CambaSans, G. H., Baldassini, P., Gallego, F., Texeira, M. A., and Paruelo, J. M. (2021). Putting the Ecosystem Services idea at work: applications on impact assessment and territorial planning. Environ. Dev. 38, 100570. doi:10.1016/j.envdev.2020
Su, K., Wei, D. Z., and Lin, W. X. (2020). Evaluation of ecosystem services value and its implications for policy making in China-A case study of Fujian Province. Ecol. Indic. 108, 105752. doi:10.1016/j.ecolind.2019.105752
Su, Y. Q., Ma, X. H., Feng, Q., Liu, W., Zhu, M., Niu, J. J., et al. (2023). Patterns and controls of ecosystem service values under different land-use change scenarios in a mining-dominated basin of northern China. Ecol. Indic. 151, 110321. doi:10.1016/j.ecolind.2023.110321
The Lecturer Group of the CPC Guizhou Provincial Committee (2018).Support the backbone of economic development-Overview of the construction project in Liupanshui, Theory and contemporary.
Twery, M. J., Knopp, P. D., Thomasma, S. A., Rauscher, H. M., Nute, D. E., Potter, W. D., et al. (2005). NED-2: a decision support system for integrated forest ecosystem management. Comput. Electron. Agric. 49, 24–43. doi:10.1016/j.compag.2005.03.001
Wang, L. J., Ma, S., Qiao, Y. P., and Zhang, J. C. (2020). Simulating the impact of future climate change and ecological restoration on trade-offs and synergies of ecosystem services in two ecological shelters and three belts in China. Int. J. Environ. Res. Public Health 17 (21), 7849. doi:10.3390/ijerph17217849
Wang, L. Y., Su, K., Jiang, X. B., Zhou, X. B., Yu, Z., Chen, Z. C., et al. (2022). Measuring gross ecosystem product (GEP) in guangxi, China, from 2005 to 2020. Land 11, 1213. doi:10.3390/land11081213
Xie, G. D., Zhen, L., Lu, C. X., Xiao, Y., and Chen, C. (2008). Expert knowledge based valuation method of ecosystem services in China. J. Nat. Resour. 23 (9), 911–919. Available online at: https://kns.cnki.net/kcms2/article/abstract?v=bJ89lKU86K8DlGeRIVsOMSoaQHzmaNXlCDGTsnduWYoHnn61Be1iPNhr7WBvbgc3-bfp9l_F1LZE2UUiDSC6uMK6VphEOuldkoUM4HAl2VyS5mliJNxcu6CRslcF7On2kwPdiwiroRpdEReXtQyg9D5Pt1jJJI2KHpfzdaAtCo8ufTCN40zG5Q==&uniplatform=NZKPT&language=CHS.
Yang, S. (2019). Research on the current situation and countermeasures of rural tourism development in Guizhou province under the background of rural revitalization. Popular Literature Art (20). doi:10.20112/j.cnki.issn1007-5828.2019.20.167
Ye, Y. Q., Bryan, B. A., Zhang, J. E., Connor, J. D., Chen, L. L., Qin, Z., et al. (2018). Changes in land-use and ecosystem services in the Guangzhou-Foshan Metropolitan Area, China from 1990 to 2010: implications for sustainability under rapid urbanization. Ecol. Indic. 93, 930–941. doi:10.1016/j.ecolind.2018.05.031
Yuan, S. F., Zhu, C. M., Yang, L. X., and Xie, F. H. (2019). Responses of ecosystem services to urbanization-induced land use changes in ecologically sensitive suburban areas in Hangzhou, China. Int. J. Environ. Res. Public Health 16 (7), 1124. doi:10.3390/ijerph16071124
Zeng, J. Y., Zhou, T., Tan, E., Xu, Y. X., Lin, Q. Y., Zhang, Y. J., et al. (2024). Evaluate the differences in carbon sink contribution of different ecological engineering projects. Carbon Res. 3 (10), 10. doi:10.1007/s44246-024-00105-444246-024-00105-4
Zhang, B., Gao, J. X., Xie, G. D., and Wang, Y. P. (2012). Preliminary evaluation of air temperature reduction of urban green spaces in Beijing. Acta Ecol. sin. 32 (24), 7698–7705. doi:10.5846/stxb201203150345
Zhang, Z. P., Xia, F. Q., Yang, D. G., Huo, J. W., Wang, G. L., and Chen, H. X. (2020). Spatiotemporal characteristics in ecosystem service value and its interaction with human activities in Xinjiang. China. Ecol. Indic. 110, 105826. doi:10.1016/j.ecolind.2019.105826
Zhang, J. Y., Song, Y., and Wang, J. (2022). Spatiotemporal patterns of gross ecosystem product across China’s cropland ecosystems over the past two decades. Front. Ecol. Evol. 10, 959329DOI. doi:10.3389/fevo.2022.959329
Zhang, M. M., Tan, S. K., Zhang, C., Han, S. Y., Zou, S. J., and Chen, E. Q. (2023). Assessing the impact of fractional vegetation cover on urban thermal environment: a case study of Hangzhou, China. Sustain. Cities Soc. 96, 104663. doi:10.1016/j.scs.2023.104663
Zhang, W. F., Xiong, K. N., Li, Y. Y., Song, S. Z., and Xiang, S. (2024). Improving grassland ecosystem services for human well being in the karst desertification control area: anthropogenic factors become more important. Sci. Total Environ. 946, 174199. doi:10.1016/j.scitotenv.2024.174199
Zhang, W., Hu, P. L., Xie, B. G., Chen, H. S., Huang, F., Xiao, J., et al. (2025). Integration model of ecological service enhancement and rural revitalization in karst peak-cluster depresions. Acta Ecol. Sin. 45 (21). doi:10.20103/j.stxb.202411222867
Zhao, Y., Li, S. R., and Yan, Z. P. (2001). The effect of green land on absorbed dust and its assessment method. J. Huazhong Agric. Univ. 21 (6), 582–586.
Zheng, S. L., Wang, B. L., Chen, F., and Zhang, Q. (2015). Study on antibacterial activities and dust retention ability of ten garden plants. J. Minnan Normal Univ. 4, 77–81.
Keywords: gross ecosystem product, ecosystem service, land use, driving factor, spatial distribution
Citation: Ma S, Zhou Z, Zhang Y, Dong C and Zhang C (2025) Response of gross ecosystem product to land use change in an area with intersecting water systems in southwestern China. Front. Environ. Sci. 13:1611457. doi: 10.3389/fenvs.2025.1611457
Received: 15 April 2025; Accepted: 08 September 2025;
Published: 01 October 2025.
Edited by:
Chong Jiang, Guangdong Academy of Science (CAS), ChinaReviewed by:
Friday Njaya, Lilongwe University of Agriculture and Natural Resources, MalawiHong Shuai, Hunan Normal University, China
Copyright © 2025 Ma, Zhou, Zhang, Dong and Zhang. This is an open-access article distributed under the terms of the Creative Commons Attribution License (CC BY). The use, distribution or reproduction in other forums is permitted, provided the original author(s) and the copyright owner(s) are credited and that the original publication in this journal is cited, in accordance with accepted academic practice. No use, distribution or reproduction is permitted which does not comply with these terms.
*Correspondence: Zhongfa Zhou, ZmE2ODk3QDE2My5jb20=