 Yu Sun
 Xinwu Li*
- College of Economics and Management, Xinjiang Agricultural University, Urumqi, Xinjiang, China
Promoting the coordinated development of urban renewal, ecological resilience, and water resilience in Xinjiang is the key to promoting sustainable urban development. The paper applies the comprehensive evaluation method, modified CCD model, kernel density estimation, traditional and spatial Markov chain, spatial econometric model, and GTWR, to analyze the distribution characteristics, spatial evolution, and factors of coordinated level of urban renewal-ecological resilience-water resilience in the 14 prefectures in Xinjiang from 2010–2021. The results show that: (1) The development levels of Xinjiang’s urban renewal, ecological resilience, and water resilience show an overall upward trend, exhibiting qualities of “high in the north and low in the South” in space. (2) Urban renewal-ecological resilience-water resilience coordination level across Xinjiang prefectures show a polarizing trend, with spatial core areas of nuclear density shrinking, but coordination levels increasing overall. In the short term, the transfer of the coordination level in Xinjiang has higher stability; after the introduction of spatial geography, the coordination level shifts to a higher level with a higher probability. (3) Urban population density, infrastructure level, total environmental investment, per capita GDP, and fiscal technology expenditure all support the enhancement of the coordination level. The infrastructure level and overall environmental investment have notable negative spatial spillover effects, and the impact of the five components has regional differentiation characteristics. This study provides a theoretical and empirical basis for Xinjiang to achieve sustainable urban development according to local conditions.
1 Introduction
Since the reform and opening up, China’s urbanization has moved from incremental development to a new era of stock optimization, and urban renewal has become a key way to promote China’s high-quality development (Huang et al., 2025). The report of the 20th National Congress of the Communist Party of China clearly stated that “accelerate the transformation of the development mode of megacities and implement urban renewal actions”. On 18 July 2024, the Third Plenary Session of the 20th Central Committee of the Communist Party of China (CPC) once again emphasized the “establishment of sustainable urban renewal models, policies and regulations”, indicating that urban renewal has risen to an unprecedented national strategy and a major strategic deployment to promote Chinese-style modernization. However, Xinjiang is located in an arid and ecologically fragile area, and in the process of urban renewal, the ecological environment has been polluted due to factors such as industrial development, infrastructure construction, and resource utilization, which has led to increasing cumulative risks and seriously affected the sustainable development of the city (Hu et al., 2022). In 2020, the SO2 emissions of Yili Prefecture Industrial Park exceeded the total standard by 1,000 times, and it faced the problem of long-term unlicensed pollutant discharge. The cities of Turpan and Hami are still overexploiting groundwater, causing ecological problems such as oasis degradation. In order to solve these problems, the practice of urban renewal is no longer limited to the transformation of the physical environment but takes into account the economic, social, and environmental multi-dimensional goals, and pursues the transformation of sustainable urban renewal mode (Song et al., 2025). Therefore, how to promote the rapid development of urban renewal while protecting resources and the environment, and ultimately realizing the sustainable development of Xinjiang has become a key topic of increasing attention in the academic community.
Based on the above analysis, the research on the coordination of “urban renewal-ecological resilience-water resilience” is not only a timely response to the challenges faced by urban development, but also helps to alleviate the contradiction between urban renewal, resource, and environmental development, stimulates the green development of regional economy, and is also conducive to the realization of multiple goals of “sustainable resource development, economic development and ecological restoration” in urban development in resource-poor areas, and finally achieve regional sustainable development. The coordination level of urban renewal, ecological resilience, and water resilience describes the degree of mutual promotion and coordinated development between the three systems. This refers to the effect of 1 + 1+1 > 3 when the three systems interact (Haken, 1980). Specifically, the high coordination level between urban renewal, ecological resilience, and water resilience shows that the three have achieved mutual promotion and coordinated development. The low coordination level between urban renewal-ecological resilience-water resilience suggests that the development of one system will come at the expense of another so the three are not coordinated development. Sorting out the relationship between the three and identifying the factors influencing the coordinated development of the three not only expands the relevant theories of the combined research of the three, clarifies the relationship between urban renewal, ecological resilience, and water resilience, but also is of great significance for promoting water conservation, protecting the ecological environment, and exploring regional sustainable development models in resource-scarce areas.
Relevant studies on urban renewal: Urban renewal is defined by both domestic and international scholars as a diversified expansion and promotion strategy aimed at achieving equitable distribution of social resources, improving people’s life quality, promoting urban industrial upgrading, and improving the quality of urban culture (Tao, 2015). Or it is a comprehensive and holistic urban development plan and action for urban development that seeks to continuously enhance the economic, social, and physical environment conditions in the region while also addressing difficult urban challenges (Liu et al., 2023). In terms of quantitative research, The impact of urban renewal on ecological resilience (Peng and Cao, 2023), high-quality development (Wang et al., 2022) commuting behavior (Huang and Guo, 2022), government debt (Xiang and Wang, 2024), and other factors in recent years. Additionally, the spatial correlation network between urban renewal and ecological resilience (Peng et al., 2024) and the ecological resilience’s response to urban renewal have been examined (Peng and Xie, 2024) Research on ecological resilience. Scholars focus on measuring resilience levels, building resilience indicator systems using theoretical frameworks including “pressure-state-response” (PSR) (Sun et al., 2023), “vulnerability-resistance-robustness-resilience” (Wang, 2023) and “resistance-resilience- adaptability” (Li et al., 2025), explore the spatial-temporal pattern differences and evolution characteristics of ecological resilience using spatial Markov chain, comprehensive evaluation method, and hierarchical analysis method (Fang et al., 2023; Jiang et al., 2023; Liu et al., 2021). The influence mechanisms or factors of ecological resilience are examined using spatial panel regression (Ren and Li, 2024), ERGM (Deng and Shen, 2025), GTWR (Wang and Li, 2025), and QAP (Li et al., 2024a; Li et al., 2024b). Ou et al. (2023) take 10 urban agglomerations with different development levels in China as the research object to explore the impact of ULEE on ES from the perspective of efficiency, indicating Natural factors directly influenced ES changes, thereby affecting both ULEE and Es dynamics. In contrast, changes in social factors indirectly caused changes in ESs. This provides a new research perspective for the study of urban expansion. Wei et al. (2024) first reveal the evolution of trade-off and synergy patterns of SRAS performances, at both nation and city levels, in the BRI region. It also contributes new perspectives from the BRI region to the sustainable urban planning, terrestrial ecosystems conservation, and urban ecological governance programs. Johnson et al. (2025) unified concepts on ecological resilience to wildfire, examined how the rate and percent of recovery varied across ecosystem function, structure, and composition attributes following wildfire, and identified drivers of recovery and resilience. This paper provides a reference for constructing an ecological resilience index system and determining the influencing factors of resilience. Zhang et al. (2025) studied the coordination degree of water use efficiency and ecological resilience and the factors affecting it and concluded that the coordination degree of the two showed a growth trend, the differences between the regions expanded, and the internal driving force is the main factor affecting the coordination degree, which provides theoretical references for this paper to analyze the part of the mechanism affecting urban renewal, ecological resilience and water resources resilience. Sun et al. (2024) explored the water-economic-ecological resilience coordination level and future projections and concluded that the coordination level is trending toward the good and that there may be a worsening trend in the future in various states. This informs this paper to define water resources resilience and ecological resilience. Peng et al. (2025) discussed the coupling effect and influencing factors of urban renewal and ecological resilience in Huanchang-Zhuzhou-Zhuhai-Tan area, and argued that the coupling coordination degree of urban renewal and ecological resilience is on the rise, and the phenomenon of agglomeration in surrounding cities can promote the improvement of coupling coordination degree by population agglomeration and economic development, which provides a theoretical basis for the construction of influencing factors in this paper. Wang et al. (2025a) explored the evolution trajectory and influencing mechanism of the synergistic effect of construction waste and carbon emission reduction in China, and concluded that the synergistic effect of the two is gradually weakening, presenting a spatial pattern of “south > north”, and there is spatial heterogeneity in the synergistic effect of population size, per capita GDP, industrial structure, CE intensity and CW generation intensity, and formulates a collaborative implementation plan for government pollution reduction, which makes important practical significance for the sustainable development of the construction industry (Yang et al., 2025). Most studies only explore the relationship between urban renewal, ecological resilience and water resilience, and lack a systematic discussion of the interaction between the three, and have not yet established an analytical framework for the interaction between urban renewal, ecological resilience and water resilience, and there is a lack of coupling and coordination between the three systems.Currently, the research on urban renewal and ecological resilience mainly focuses on urban agglomerations, individual cities, and provincial levels, with little attention given to the arid areas of Xinjiang. Due to Xinjiang’s long-standing contradictions between resources, environment, and development, addressing the various environmental issues arising from urban renewal has become a strategic objective for sustainable development in Xinjiang.
Based on this, this study first constructs an index system of urban renewal, ecological resilience, and water resilience, and then uses the comprehensive evaluation method to measure the comprehensive development level of urban renewal, ecological resilience, and water resilience in 14 prefectures in Xinjiang from 2010 to 2021, and uses the modified CCD model and kernel density estimation to analyze the spatiotemporal characteristics of the coupling coordination degree of urban renewal, ecological resilience and water resilience in Xinjiang. Secondly, we use the traditional and spatial Markov chains to calculate and gain insight into the transfer probability and development trend of urban renewal-ecological resilience-water resilience coordination. Finally, we use the spatial econometric model to analyze the mechanism of influencing factors and use the spatiotemporal GTWR model to explore the impact of influencing factors on the spatial heterogeneity of urban renewal-ecological resilience-water resilience coordination. The results of this study can provide a theoretical and empirical basis for shortening the development gap of urban renewal, ecological resilience, and water resilience in different regions of Xinjiang, realizing the coupling and coordination of urban renewal, ecological resilience, and water resilience, and supplementing and improving the development path according to local conditions.
2 Materials and methods
2.1 Theoretical basis
2.1.1 Mechanism of urban renewal-ecological resilience-water resilience
In this complex system, there is an independent and interdependent relationship between urban renewal, ecological resilience, and water resilience, and the change of one subsystem will lead to a “chain reaction” of the other two subsystems (Lu and Li, 2024) (Figure 1).
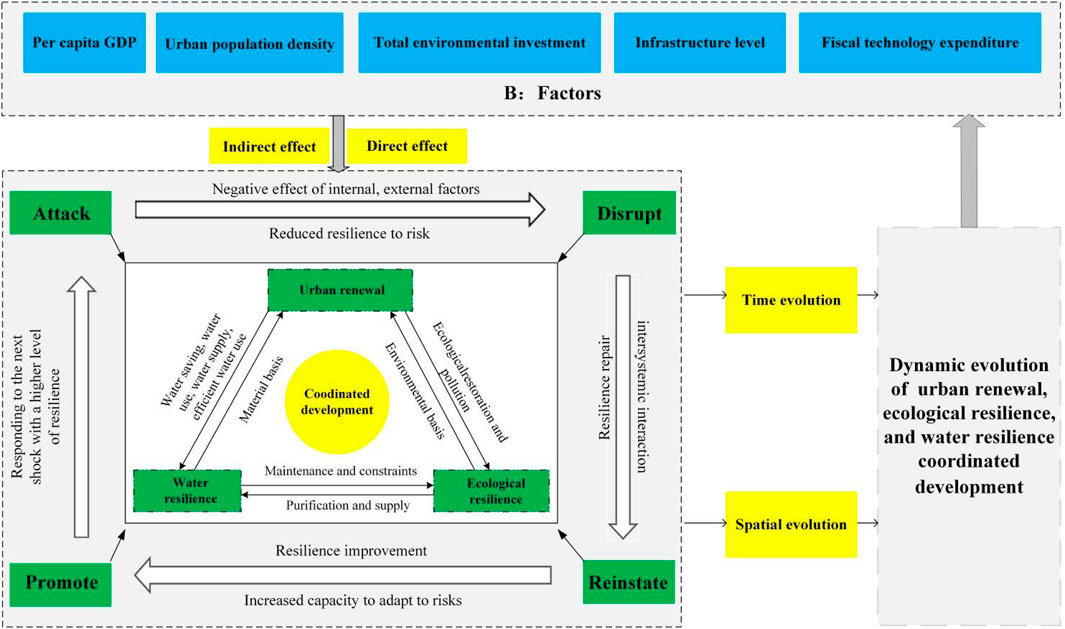
Figure 1. Analysis Framework of urban renewal-ecological resilience-water resilience mechanism and factors.
Urban renewal increases the water resource system’s resilience to emergencies by green-transforming water-related infrastructure, such as outdated water supply networks, water-saving appliances, drainage and flood prevention, and digital twin technology. This allows the system to resume regular operations more quickly after being disrupted. Water resilience is the tangible foundation for the sustainable development of urban renewal, and cities with high water resilience can activate the value of waterfront space by restoring water ecosystems such as rivers and wetlands, promoting the “ecological development” model, and supporting the ecologically-oriented urban renewal model. However, cities with scarce water resources need to follow the principle of “determining cities by water and production by water”, restricting water-intensive industries and large-scale population introduction, and then limiting the scale of development and industrial choices.
Green measures that can be implemented in urban renewal include expanding the area of urban green space, cleaning and restoring rivers and lakes, and improving the construction of green infrastructure. These actions can not only increase the ecological benefits of infrastructure and lower pollution levels but also guarantee the ecosystem’s complexity and stability. However, the development process of urban regeneration will pollute the current environment and weaken the ecosystem’s resistance. The environmental basis for the long-term growth of urban redevelopment is ecological resilience. In cities with strong ecological resilience, green space systems, and vegetation cover can improve the city’s ability to withstand extreme calamities like drought and excessive rainfall by reducing the urban heat island effect through transpiration. Moreover, urban renewal would prioritize the creation of ecologically resilient cities that can accomplish both “economic development and ecological restoration” objectives.
The adaptability of water resilience can provide water security and living environment for ecosystems through factors such as forest cover and wetland area, and maintain the state level of ecosystems. In addition, the pollution control ability in water resilience also directly affects the ecological health of water bodies and then determines the survival of animals and plants in the ecosystem. Large-scale urbanization, surface vegetation loss, and the deterioration of urban “green lungs” have all contributed to the ecosystem’s natural capacity to store and purify water, which lowers the ecosystem’s ability to withstand natural disasters and jeopardizes the long-term stability of the water resource system.
2.1.2 Factors of urban renewal-ecological resilience-water resilience coordination level
Under the background of promoting high-quality economic development in China. The rapid expansion of urbanization and the urban population density growth have caused problems such as urban land contraction and the water environment deterioration, which have affected the sustainable development of urban renewal (Peng and Xie, 2024). Through their influence on construction technology innovation, industrial upgrading and transformation, and the construction of urban sewage cleanup infrastructure, financial science and technology expenditures and environmental governance can simultaneously improve environmental problems, increase resource utilization, and achieve economic and ecological coordination. Based on this, this paper deeply analyzes how the five factors of economy, labor, technology, ecology, and capital affect the coordinated development of urban renewal-ecological resilience-water resilience.
2.1.2.1 Direct effect
Endogenous growth theory points out that economic growth can promote technological progress, human capital accumulation, and knowledge spillover. Technological progress caused by urban economic benefits can effectively control pollution emissions and reduce resource consumption through source prevention and control, forming a “technology-efficiency-resilience” closed loop (Wang et al., 2025b). Human capital is the engine of economic growth. Economic development draws in top talent, whose knowledge bases directly support ecological innovation in urban renewal and enhancing water utilization. The “learning by doing” effect prompts the government to dynamically adjust its policies in urban renewal, balancing economic growth and ecological goals, and realizing the linkage of “economic incentives, efficiency enhancement, and resilience enhancement”. According to the factor accumulation buffer effect, a variety of innovative factors, including talent, capital, technology, and information, flow together with urban redevelopment when it faces environmental disturbance. It will inevitably lead to the accumulation of information, capital stock, technological advancements, and knowledge (Liu and Lu, 2023). These elements accumulation lays a solid foundation for urban renewal and sustainable promotion, and knowledge accumulation is the technological innovation precondition. The production function states that increasing skill factors will undoubtedly boost technological innovation output. The dynamic accumulation of elements can enhance the urban system’s capacity for self-organization, hence enhancing its ability to withstand environmental shocks.
2.1.2.2 Indirect effect
Urban renewal penetrates, diffuses, and radiates to other geographical locations through factor flow, and information exchange, and then produces spillover effects (Peng et al., 2024): (1)Economic spillover effect. Urban renewal stimulates industrial development and stimulates the vitality of renewal zones and cities (Wang et al., 2022). Urban renewal guides the flow of capital. When a city’s economy reaches a certain stage, its development momentum will moderately spread to the surrounding areas, This spatial spillover effect can not only activate the economic vitality of surrounding cities but also provide continuous capital injection for urban ecological environment protection and economic construction. (2)Labor spillover effect. The concentration of urban population density has significantly increased labor mobility in the city and prompted several highly trained workers to participate in urban renewal construction projects (Wang et al., 2025c). (3) Technology spillover effect. The region with substantial expenditures in scientific research has advantages in industrial technology innovation, public service efficiency, cutting-edge technology application, etc. Its innovative achievements generate spatial spillover effect through interregional technology transfer and industry-university-research coordination mechanisms, maximize the efficiency of factor allocation, and realize the cross-regional integration of resources. (4) Ecological management demonstration effect. To reduce environmental pollution and improve environmental quality brought on by urban renewal and enhance environmental quality, regions that increase their investment in the environment will formulate “environmental protection policies and plans.” Neighboring regions can use these effective examples as a guide to creating more scientific environmental policies that better meet the needs of regional development. (5) Capital sharing effect. Facing the development pressure of resource constraints and ecological priority, highway construction provides a connecting channel for the economy, society, environment, and culture, Through factor flow, resource sharing, and information exchange, local advantageous resources will be spread to adjacent areas, promoting the coordinated development of neighboring cities’ economies and ecosystems, and realizing the sustainable development of urban renewal.
2.2 Indicator construction and data sources
2.2.1 Indicator construction
2.2.1.1 Urban renewal indicator system
Urban renewal is a coordinated effort made in the areas of social, economic, cultural, and environmental standards of residents’ lives to preserve, repair, improve, rebuild, or eliminate the built-up areas within the city through planning and construction (Keith, 1954). The urban renewal indicator system makes use of all-encompassing, holistic ideas and practices to improve the city sustainably over the long run from an economic, social, physical, and environmental standpoint (Liu and Zhou, 2022). The urban renewal indicator system is built using four layers of urban construction, facility building, ecological construction, and cultural construction, all of which are based on the practices of the predecessors (He and Liu, 2019; Chen and Ma, 2022) (Table 1).
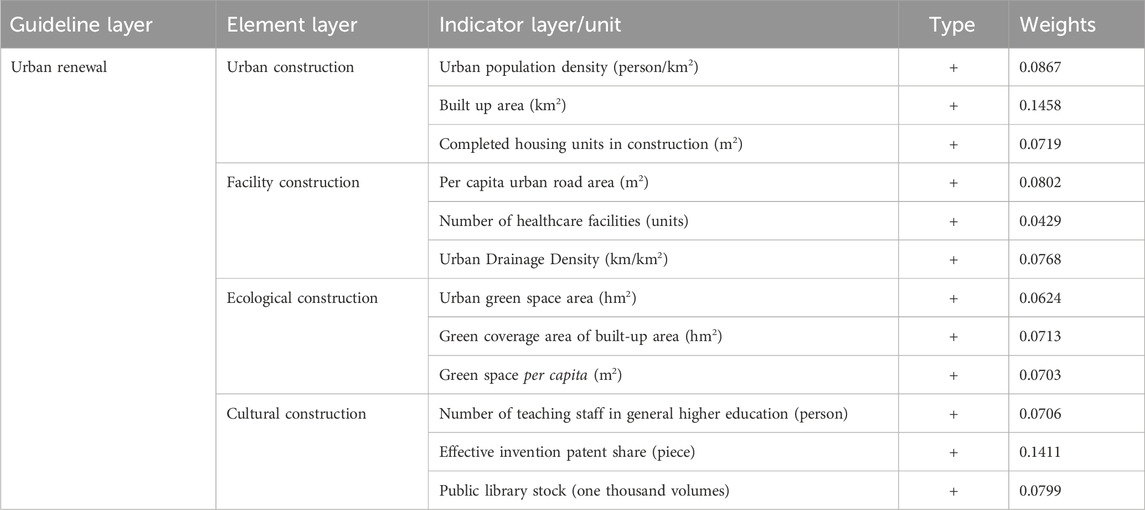
Table 1. Indicator system for evaluating urban renewal.
Urban construction reflects the expansion of urban space and the scale of housing construction. Three indicators are selected, namely, urban population density, built-up area, and completed construction area. Urban population density reflects the degree of population concentration, which affects the allocation of urban resources and living space; the built-up area shows the scope of urban land development and utilization; and the area of completed construction housing shows the results of housing construction in a certain period, which is related to the supply of residential and commercial housing. Facility construction measures the level of urban infrastructure and public service facilities. Three indicators are selected: road area per capita, number of medical and health institutions, and density of urban drainage pipes. The per capita urban road area reflects the degree of protection of transportation facilities for residents; the number of medical and health institutions reflects the richness of medical service resources; and the density of urban drainage pipes is related to the city’s ability to prevent drainage and flooding. Ecological construction reflects the state of the urban ecological environment. Three indicators have been selected: the area of green space in urban gardens, the area covered by greening in built-up areas, and the area of green space per capita in parks. The area of green space in urban gardens and the area covered by greening in built-up areas reflect the scale of green space in the city; the area of green space per capita in parks measures the level of ecological welfare available to residents, which is related to the quality of the living environment. Cultural construction demonstrates the city’s cultural resources and innovation capacity. Three indicators are selected: the number of teaching staff in general higher education institutions, the number of effective invention patents, and the number of books in public libraries. The number of faculty and staff in higher education reflects the talent pool of higher education; the number of effective patents reflects the city’s scientific and technological innovation output; and the number of books in public libraries reflects the richness of the city’s cultural knowledge resources.
2.2.1.2 Water Resilience indicator system
Water resilience refers to the ability of a water resources system to maintain its functional stability in the face of internal and external pressures, such as natural disaster perturbations and human activities, to quickly recover from the impacts of the perturbations, and to continue to satisfy the water needs of human society and ecosystems through adaptive adjustments. Based on evolutionary theory, Wamsler proposes that resilience is the ability of a system to resist, cope, and change in the face of disturbances and shocks (Wamsler et al., 2013). Based on “evolutionary resilience”, this paper combines the relevant existing results (Ma et al., 2013; Sun et al., 2024), Resilience is categorized into three dimensions of resistance, resilience, and adaptability to construct the water resources resilience evaluation index system.
Resistance refers to the ability of a system to withstand disturbances before it is disturbed. In various systems, the greater the potential risk and the more disturbances, the weaker the resistance. 6 indicators are selected to measure water resilience resistance from the water resources endowment dimension. Resilience refers to the ability of a system to recover to the state before the impact when it is disturbed, and 5 indicators are selected to measure the resilience of water resources from the dimensions of water use structure and sustainability. Adaptability is the ability of a system to adapt in which it can learn after being disturbed and recovering, and five indicators were selected to measure water resources resilience from three dimensions: habitat quality, water depletion intensity, and nutrient capacity. (Table 2).
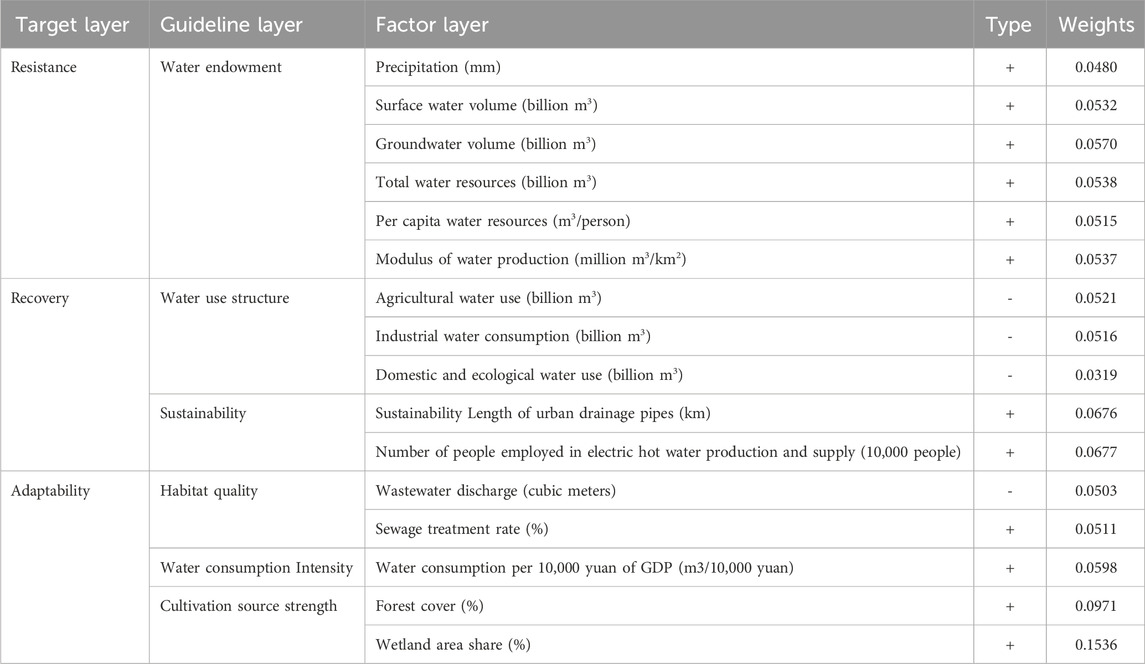
Table 2. Indicator system for evaluating water resilience.
2.2.1.3 Ecological resilience indicator system.
Ecological resilience indicator system construction. Ecological resilience refers to the ability of ecosystems to actively maintain, adapt, and reconstruct in the face of external disturbances (Tao et al., 2022). The PSR model is a conceptual model jointly established by the Organization for Economic Cooperation and Development and the United Nations Environment Programme, which is commonly used as a framework system for studying environmental issues (Sun et al., 2023). Combining PSR with the evolutionary resilience proposed by Wamsler, and referring to the research results of related literature (Liu and Zhou, 2022; Peng et al., 2024; Peng et al., 2024), the ecological resilience evaluation index system is constructed from the three dimensions of pressure, state, and response Table 3.
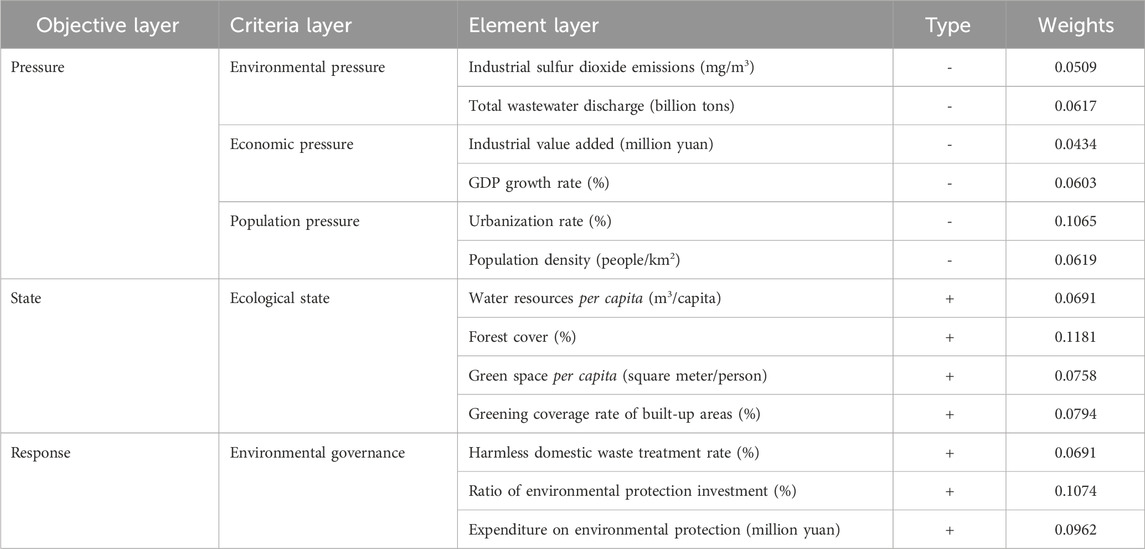
Table 3. Indicator system for evaluating ecological resilience.
Pressure refers to the city in the process of development of multiple factors on the ecological environment caused by the pressure, from the environmental pressure, economic pressure, and population pressure in three dimensions, selected six indicator systems to measure the resilience of ecological pressure. State refers to the process of urban operation, the various subsystems in the pressure impact of the state of change and mutual coupling present a common ability to resist pressure, from the ecological state dimension, selected four indicators to measure the ecological state toughness. Response refers to human forces actively intervening and regulating various subsystems in the city to restore them to a state of equilibrium or to generate a new equilibrium, and three indicators were selected to measure the resilience of ecological response from the dimension of environmental governance.
2.2.2 Data source
The data of each variable is mainly from the data of Xinjiang Uygur Autonomous Region Bureau of Statistics, Xinjiang Uygur Autonomous Region Water Conservancy Department, and other government departments, and《 Xinjiang Statistical Yearbook (2011–2022)》, 《Xinjiang Water Resources Bulletin (2010–2021)》, 《Xinjiang water and soil conservation Bulletin (2010–2021)》, 《Xinjiang Ecological Environment Bulletin (2010–2021)》, and national economic and social development statistical bulletin and Environmental Status Bulletin of various prefectures and cities, etc. For some missing data, linear interpolation method is used to supplement.
2.3 Methods
2.3.1 Comprehensive evaluation method
We standardized the original data and used the entropy weight method to calculate the weight of each index (Li G. et al, 2024). Meanwhile, we used the comprehensive evaluation method to calculate the comprehensive evaluation level of urban renewal, ecological resilience, and water resilience. The calculation formula was as follows:
Equations 1, 2: U1 is the urban renewal evaluation level; U2 is the ecological resilience evaluation level; U3 is the water resilience evaluation level; Wk is the weight of each index; Xik is the standardized index value; n is the index number; T is the comprehensive evaluation level of urban renewal-ecological resilience-water resilience; a, b, c are undetermined coefficients. After comprehensive consideration, it is considered that the three subsystems are equally important and assigned 1/3 respectively.
2.3.2 Modified CCD model
As an effective tool to measure the coupling coordination and development relationship between different systems, the coupling coordination degree model can truly reflect the coupling effect and coordination degree between the systems. However, the traditional coupling coordination degree model has validity problems, so a modified CCD model is introduced. Referring to the related study (Wang et al., 2021), we use the modified coupled coordination degree model to assess the coupled coordination level of urban renewal-ecological resilience-water resilience. The modified CCD model is:
Equations 3, 4: C is the coupling level of urban renewal-ecological resilience-water resilience; D is the coordination level of urban renewal-ecological resilience-water resilience; Ui is the comprehensive evaluation level of urban renewal-ecological resilience-water resilience, and maxUi indicates the maximum value between the comprehensive evaluation level of three. The coordination level was ranked according to related studies to determine the grade (Meng et al., 2025) (Table 4).
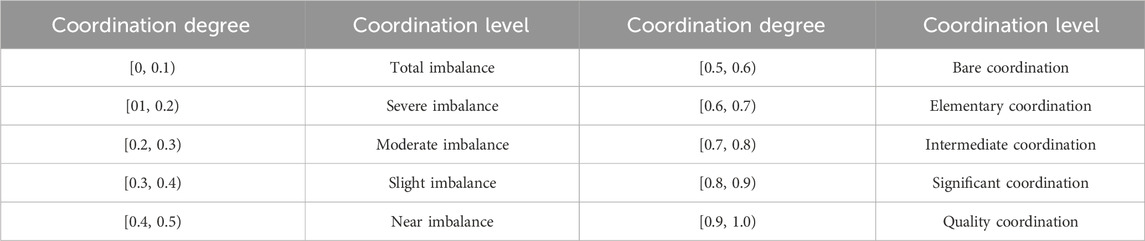
Table 4. Classification of coordination level.
2.3.3 Kernel density estimation
The kernel density estimation can fully demonstrate the distribution dynamics and evolution law of the urban renewal-ecological resilience-water resilience coordination level, this paper introduces the kernel density estimation method to examine the distribution pattern, development trend, and other dynamic features of urban renewal-ecological resilience-water resilience coordination level in Xinjiang (Li et al., 2023). Higher values of kernel density indicate higher levels of coordination, as calculated by the following formula:
Equation 5: f (xi, yi) is the value of kernel density located at position (x, y); k is the kernel function; r is the search radius, denoting bandwidth; n is the number of samples; and di is the point distance between the valuation point and (xi, yi). According to Table 4, the coordination level after kernel density estimation is redefined to be divided as shown in Table 5.
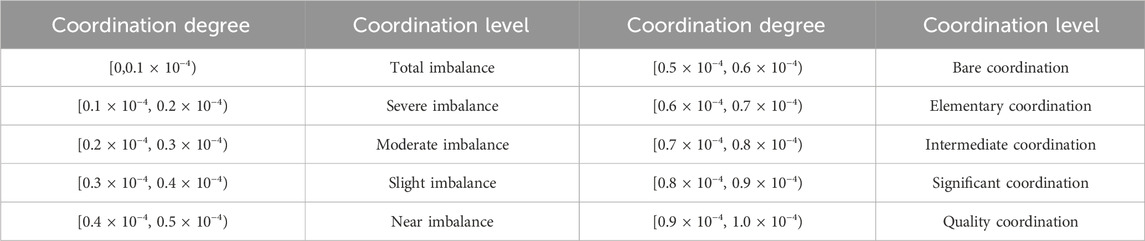
Table 5. Coordination level after kernel density estimation.
2.3.4 Traditional and spatial Markov chains
Markov chains show the transition of random variables in state space and are usually applied to the evolution of some regions without posteriority. Spatial Markov chains consider the role of spatial factors in the evolution of economic phenomena (Chen and Li, 2024). In this paper, spatial Markov chains are constructed to reveal the type transfer law of urban renewal-ecological resilience-water resilience coordination level in Xinjiang.
2.3.5 Spatial econometric model
Construct spatial econometric models to study the influencing factors of urban renewal-ecological resilience-water resilience coordination level, specifically including spatial lag model (SLM), spatial error model (SEM), and spatial Durbin model (SDM) (Peng et al., 2024). The spatial econometric model can not only quantitatively analyze the endogenous interaction effect of independent variables, but also reflect the spatial exogenous interaction effect of variables.
2.3.6 GTWR
Brunsdon first proposed a Geographically Weighted Regression model in 1996 to shed light on the non-stationarity of spatial data (Brunsdon et al., 1999), Spatial econometric regression parameters are based on the spatial homogeneity assumption, and the estimated parameters are constant, which is not completely consistent with spatial heterogeneity (Li et al., 2023). Therefore, this paper uses GTWR to take into account the two dimensions of time and space to investigate the spatial heterogeneity of various impact factors. The following is the model:
Equation 6: xi is the explained variable of Prefecture i; (μi,νi, ti) is the spatial coordinate of Prefecture i; β0 (μi,νi, ti) is the intercept of Prefecture i; βk (μi,νi, ti) is the regression coefficient of the kth explanatory variable of Prefecture i; Zik is a set of explanatory variables; p is the number of explanatory variables; εi is the residual term.
3 Results
3.1 Analysis of the development level of urban renewal-ecological resilience-water resilience in Xinjiang
The paper measured the development level of urban renewal-ecological resilience-water resilience in 14 prefectures of Xinjiang from 2010 to 2021 using the comprehensive evaluation method. We use the ArcGIS 10.2 software for spatial visualization and use the natural fracture method to divide the development level into five categories.
3.1.1 Analysis of urban renewal development level
According to Figure 2d, the overall fluctuating upward trend in the level of urban renewal development in Xinjiang from 2010 to 2021 indicates that the various states in Xinjiang have continued to carry out the renewal and transformation of old cities in the past decade, and the urban construction and style are constantly gaining development. The level of urban renewal development was highest in the Aksu and Hotan regions in 2010. In 2015, the level of urban renewal development was highest in the Yili Prefecture and Changji Prefecture, until 2021 Turpan City, Hami City urban renewal development level growth is the most significant, maybe the healthcare service system is sound and education infrastructure strengthening, simultaneous promotion of cultural facilities, urban infrastructure, and public service level, continue to increase the investment in the field of culture, to attract high-level talents gathered in universities and devoted to scientific research and teaching and innovation practice.
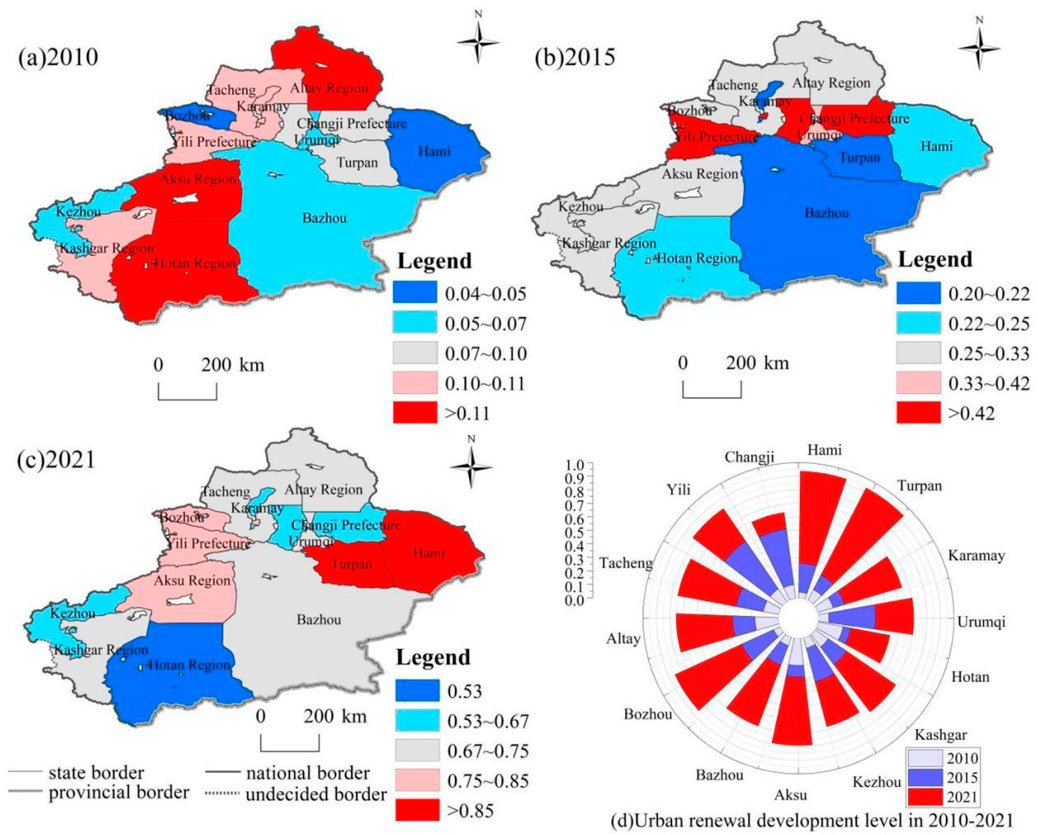
Figure 2. (a–d) Spatial distribution of urban renewal development level in Xinjiang, 2010–2021. Note: This map is based on the standard map No. New S (2021) 047 downloaded from the Xinjiang Standard Map Service website, with no modifications to the base map boundary.
From the perspective of spatial pattern, According to Figure 2a, The development level of urban renewal in various states of Xinjiang presented the distribution characteristics of “high in the west and low in the east” in 2010, but the overall development level of urban renewal is low, indicating that there are differences between the states, but not significant. According to Figure 2b, In 2015, the development level of urban renewal in the northern part of the high-value area spread to the distribution of the Yili Prefecture directly, Changji Prefecture and Urumqi City, the overall urban renewal development level has increased compared to 2010, indicating that the gap between urban renewal development in various prefectures is gradually increasing, probably because the economic development leads to urban development, and to pursue a better life, the process of urban renewal has accelerated, and the infrastructure and public services are being gradually perfected, but there are differences in the development speed of various prefectures in Xinjiang, and therefore there is still a part of the prefecture where urban renewal speed is still. According to Figure 2c, In 2021, the overall development level of urban renewal in all regions of Xinjiang has been improved, showing a spatial pattern of “high in the north and low in the south”, in which Hotan region is in the low-value area, which cannot be separated from the resource endowment of the southern Xinjiang region, and the economic development is limited by the scarcity of water resources and the fragile ecological conditions, which makes the economic development lag behind and restricts the development speed of urban renewal. The development speed of urban renewal.
3.1.2 Analysis of ecological resilience development level
According to Figure 3d, the level of ecological resilience development in Xinjiang increased from 2010 to 2021, indicating that the ecosystem in Xinjiang has gradually stabilized, and its ability to withstand external influences as well as to recover is increasing. The level of ecological resilience development in Bazhou was in the high-value area in 2010, with a value of 0.46, indicating that the ecological conditions in Bazhou were better in comparison with other regions in 2010. In 2015, the ecological resilience development levels of Changji Prefecture, Turpan City, Karamay City, and Urumqi City were 0.65, 0.78, 0.60, and 0.60 respectively, indicating that these areas are constantly strengthening urban greening construction, and urban air quality and water quality have been effectively improved, so that the level of ecological resilience development has increased significantly. In 2021, the ecological resilience level of each prefecture in Xinjiang will be in a different direction, and the ecological resilience level of each region will be in a different direction, and the level of ecological resilience will be in a different direction. Changji Prefecture, Turpan City, Karamay City, Urumqi City, and Altay Region showed a downward trend in the level of ecological resilience development, while the other regions showed an increasing trend in the level of ecological resilience development, mainly because the ecological background conditions of the various regions in Xinjiang are different, and the environmental protection measures taken by the government are different, which resulted in some differences in the development of ecological resilience.
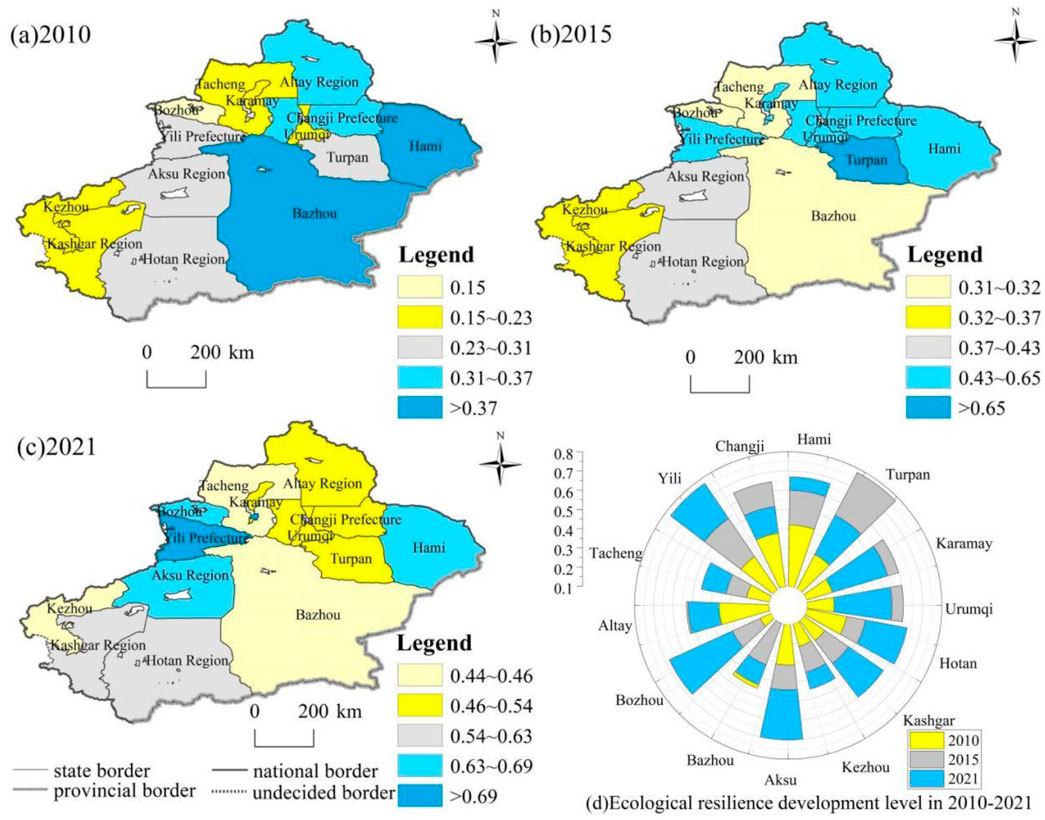
Figure 3. (a–d) Spatial distribution of ecological resilience development level in Xinjiang, 2010–2021.
From the viewpoint of spatial pattern, According to Figure 3a, In 2010, the ecological resilience development level of Xinjiang presented the distribution characteristics of “high in the east and low in the west”, and the distribution of high-value areas in the east is more aggregated, and the ecological resilience development level of Xinjiang’s regions and states differed but was not significant, probably because of the slow development of economic activities in agriculture and industry in 2010, and the impact on the ecological environment was relatively small. According to Figure 3b, In 2015, the high ecological resilience development level in Xinjiang spread to the north, indicating that the northern region of Xinjiang is relatively abundant in resources compared to the southern region, with less pressure on the ecological environment, and the development of urban greening and afforestation, ecological restoration work is more successful, thus forming a higher ecological resilience area. According to Figure 3c, In 2021, the ecological resilience development level of all the regions in Xinjiang presents the distribution characteristics of “high in the west and low in the east”, the ecological resilience development level of Xinjiang states has grown significantly, indicating that the ecological conditions are the basis of economic development, and the work of ecological protection and restoration is being gradually carried out by the states, and the ecological greening, wastewater treatment, and environmental protection inputs are all carried out on a large scale.
3.1.3 Analysis of water resilience development level
According to Figure 4d, the overall trend of water resilience development level in Xinjiang from 2010 to 2021 shows a downward trend, indicating that water resources are scarce in all states of Xinjiang, sewage discharge is strong, enough to meet the economic development, the amount of water demand is increased, and multiple factors make the water resources system pressure bigger, and the level of water resilience development has declined. In 2010, Hami City, Aksu region water resources resilience development level was higher. In 2015, the water resilience development level of each state decreased significantly, Hami city decreased from 0.74 in 2010 to 0.43 in 2015, and the water resilience development levels of Kashgar, Aksu, Kexu, and Hotan regions all decreased significantly, probably because these regions are located in the southern part of Xinjiang, where water resources scarcity is more serious, water resources are utilized in a low way, and there is insufficient capital investment and imperfect water-saving facilities, which restrict the water resources resilience. In 2021, the decreasing trend of water resilience development level in all regions of Xinjiang has rebounded, and Urumqi, Karamay, Aksu, Kashgar, and Hotan regions all show an increasing trend.
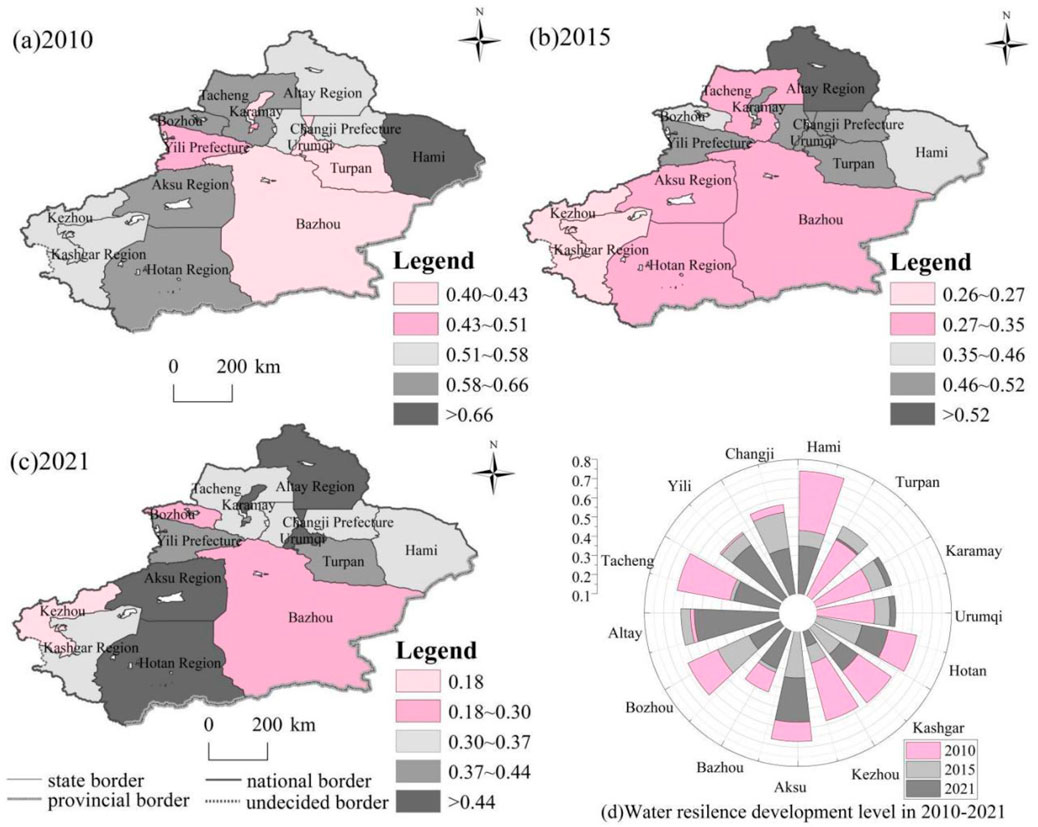
Figure 4. (a–d) Spatial distribution of water resilience development level in Xinjiang, 2010–2021.
From the perspective of spatial pattern, According to Figure 4a, In 2010, Xinjiang’s water resilience development level presents the distribution characteristics of “northwest high, southeast low”, the distribution of high-value areas is more dispersed, the overall water resilience development level in Xinjiang is higher, indicating that in 2010 water resources conditions are better, resistance is stronger, water use structure is balanced, water resources endowment can meet the normal operation of the economy, can recover water resilience level faster. According to Figure 4b, In 2015, the high-value area of water resilience development level in Xinjiang spread to the north, and the distribution is more aggregated, the water resilience development level in Xinjiang compared to 2010 shows a downward trend, the low-value area is concentrated in Kexu, Aksu region. The high-value area of water resilience development level in Xinjiang shows a dispersed trend, and the value of water resilience development level is decreasing significantly, indicating that the rapid development of industry makes it possible for the economy to develop rapidly. According to Figure 4c, In 2021, the high-value areas of water resilience development level in Xinjiang are scattered, and the value of water resilience development level decreased significantly, which indicates that the rapid development of industry makes the intensity of water consumption increase, and the amount of sewage discharge increases, polluting the water source and causing pressure on water resources.
3.2 Spatio-temporal evolution analysis of urban renewal-ecological resilience-water resilience coordination level in Xinjiang
3.2.1 Time evolution analysis of urban renewal-ecological resilience-water resilience coordination level
According to Figure 5, We found the core density function central point of urban renewal-ecological resilience-water resilience coordination level in all regions of Xinjiang from 2010 to 2021 continued to move to the right, and the position of the kernel density moved significantly to the right. Indicating that the coordinated development effect of urban renewal-ecological resilience-water resilience in Xinjiang was very significant, However, the spatial differentiation of the coordination level among regions in Xinjiang is obvious in terms of the number of crests, crest height, and curve width.
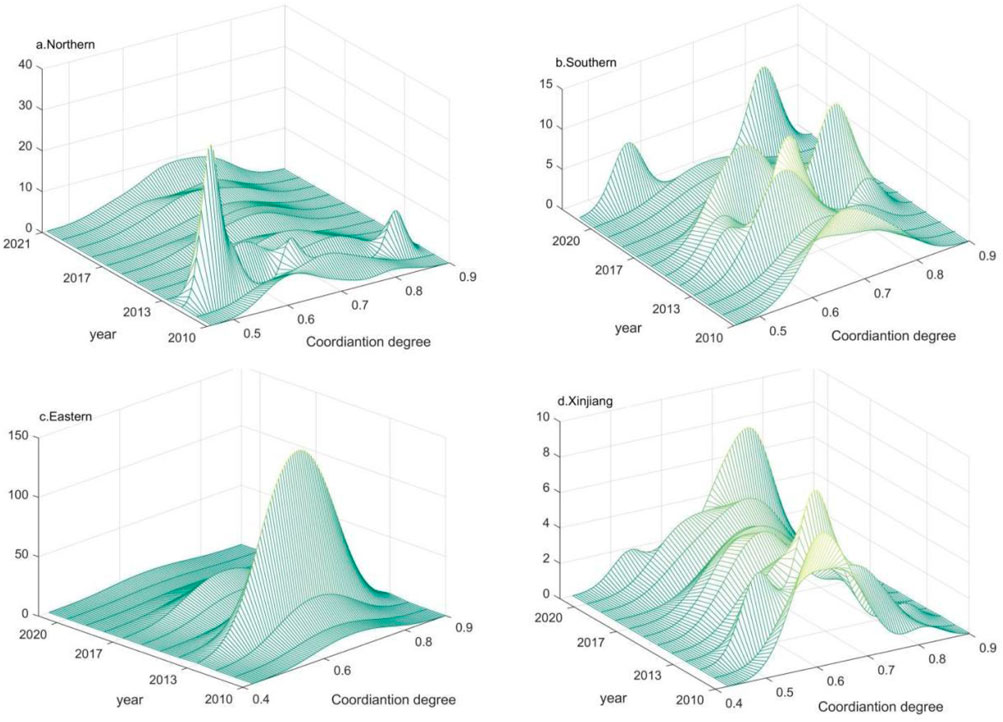
Figure 5. (a–d) Dynamic evolution diagram of urban renewal-ecological resilience-water resilience coordination level in Xinjiang, 2010–2021.
Specifically, According to Figure 5a, the kernel density curves in the northern border region show that the coordination level of the seven prefectures in the northern border region is displaying a trend of differentiation and expansion. In 2012, the wave peaks changed from a “single-peak” distribution to a “multiple-peak” pattern, with the main peak situated in the low-level zone on the left side, which is significantly higher than the secondary peaks on the right. It revealed that the proportion of low-level regions was significantly higher than that of high-level groups, and the spatial polarization characteristics were prominent; According to Figure 5c, The eastern border region’s kernel density curve demonstrates that the main peak’s height increased significantly in 2012, indicating the clear convergence of the spatial gap between Turpan City and Hami City in the coordinated development of urban renewal-ecological resilience-water resilience during that period. After 2013, the main peak’s height quickly decreased and leveled off, causing the gap between the two cities’ coordination levels to widen once more. The region’s level of spatial differentiation also displayed a characteristic of phased fluctuation. According to Figure 5b, The core density curve of Southern Xinjiang during the study period exhibited bimodal or multi-peak distribution characteristics, suggesting a polarization trend in the level of coordination between urban renewal-ecological resilience-water resilience; the secondary peaks’ height is consistently lower than the primary peaks’, the primary peaks’ height is still declining; and the distribution pattern tends to be gentle from steep, revealing the spatial heterogeneity of the level of coordination between the regions; the degree of dispersion is continuously increasing over time; According to Figure 5d, The peak height of the nuclear density curve in Xinjiang has decreased year by year, indicating that The density distribution curve of the urban renewal-ecological resilience-water resilience coordination level in Xinjiang as a whole shift to the right over time, as the number of areas with high coordination values rises and the number of areas with low values decreases. The coordination level of the two exhibits an ever-increasing evolution characteristic, and the kernel density curve shifts from a trailing-right one to a trailing-left one. Indicating that the overall level of coordination between urban renewal-ecological resilience-water resilience in Xinjiang is uneven. The waveform is primarily a “single peak” with one peak, and the kernel density curve is flat and wide, Polarization is absent and decreasing in most areas, except in a few years when there is a “double peak” pattern and polarization is present.
3.2.2 Spatial evolution characteristics of urban renewal-ecological resilience-water resilience coordination level
We use the kernel density analysis tool to identify the spatial distribution and agglomeration degree of the coordination degree of urban renewal-ecological resilience-water resilience. The kernel densities of urban renewal-ecological resilience-water resilience coordination levels in Xinjiang in 2010, 2013, 2017, and 2021 range from 0 to 0.6287 × 10⁻⁴, 0∼0.8664 × 10⁻⁴, 0∼1.000 × 10⁻⁴, 0∼1.000 × 10⁻⁴, with the level of coordination changing from complete imbalance to primary coordination, significant coordination, and high-quality coordination. The shift indicates that in the process of implementing urban renewal in each state, the positive spillover from the optimal allocation of infrastructure resources and environmental regulation outweighs the problems of large-scale demolition and construction, waste of resources, and degradation of habitat quality, and brings a positive effect to the water resources system and the ecosystem.
According to Figure 6a, In 2010, the high-density zones of urban renewal-ecological resilience-water resilience coordination levels were mainly concentrated in the four core regions of Changji Prefecture, Kelamayi City, Tacheng District, and Altay District, with Changji Prefecture radiating to Urumqi City. Located in the southeastern region of Xinjiang is mainly a low-density zone, the distribution is more aggregated, mainly due to the arid zone “survival bottom line” and “development needs” of the intense collision, these areas of urban renewal in the hard construction (such as roads, parking lots) instead of oasis buffer zone, resulting in the reduction of wind and sand protection capacity (such as roads, parking lots), which leads to the reduction of wind and sand protection capacity (such as roads, parking lots). This has led to a decline in the ability to protect against wind and sand (the frequency of sand and dust storms in Kashgar and Hotan has increased in recent years). According to Figure 6b, In 2013, the high-density areas showed a shrinking trend, mainly concentrated in Changji Prefecture and Karamay City, but the overall level of urban renewal-ecological resilience-water resilience coordination increased, indicating that urban renewal in these two core areas is in the process of transforming into an ecological system, optimizing the green space system, and restoring the ecological restoration of the water bodies, which will transform the hard urban space into a “resilient carrier” with ecological adjustment functions. The optimization of the green space system and the ecological restoration of water bodies have transformed the hard urban space into a resilient carrier with ecological adjustment functions, forming a virtuous cycle of “urban renewal, water, and ecology”. According to Figure 6c, In 2017, the high-density area was concentrated in Changji Prefecture, and the coordination level of other prefectures in Xinjiang was located on the verge of imbalance, with bare coordination, elementary coordination, indicating that the continuous implementation of urban renewal has impacted the bottom line of urban development and water resources and ecological security in Xinjiang, but the level of coordination was improved compared to 2010 and 2013, which leads to the conclusion that the level of urban renewal, ecological resilience, and water resilience inter-coordinated with each other improved but there are still contradictions. According to Figure 6d, In 2021, the high-density area further expands to include Turpan City, Changji Prefecture, Tacheng Prefecture, Bozhou, and Aksu Prefecture, and the coordination level of these core areas is at the level of significant coordination and high-quality coordination, while the other prefectures and states are at the level of middle- and lower-secondary level coordination, which suggests that with the continuous development of the economy, the developmental contradiction between urban renewal, ecological resilience, and water resilience has been alleviated, and industrial transformation and technological innovation have been carried out, Environmental governance measures are gradually implemented, urban renewal is incorporated into the framework of oasis ecological safety net construction, and through the coordinated path of setting the city by water, limiting the city by green, and developing the city by culture, it realizes the transition from passive ecological preservation to active ecological preservation. Through the synergistic path of defining the city by water, limiting the city by green, and developing the city by culture, the transformation from passively preserving the ecology to actively creating the ecology will be realized, and ultimately the sustainable development of Xinjiang will be realized.
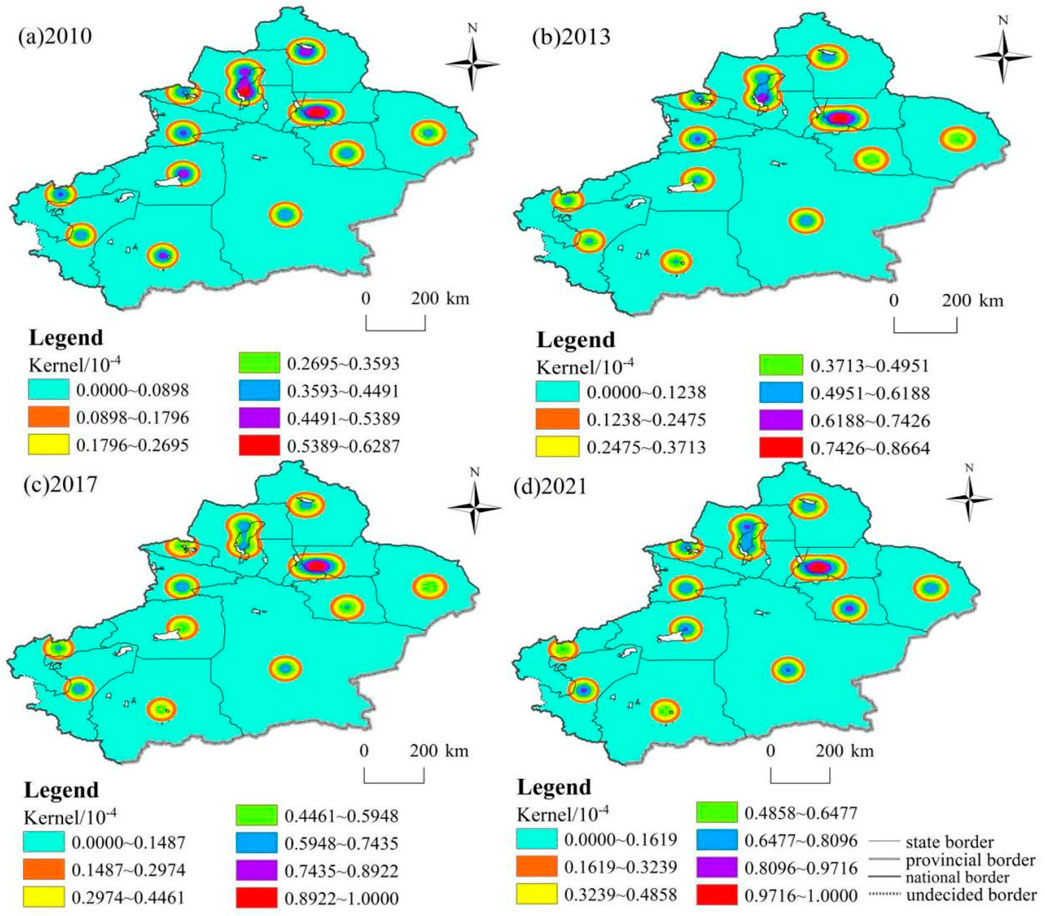
Figure 6. (a–d) Spatial Distribution of kernel density at the coordinated level of urban renewal-ecological resilience-water resilience in Xinjiang, 2010–2021.
3.2.3 Transition probability analysis of urban renewal-ecological resilience-water resilience coordination level
In this paper, the traditional Markov chain and spatial Markov chain are used to further examine the transfer direction of urban renewal-ecological resilience-water resilience coordination level and its transfer probability in each prefecture of Xinjiang, to effectively grasp its dynamic evolution law. The urban renewal-ecological resilience-water resilience coordination levels can be categorized into five grades. Among them, level 1 indicates less than 20% quartile, which is a low level; level 2 is between 20%–40% quartile, which is a low level; level 3 is between 40%–60% quartile, which is a medium level; level 4 is between 60%–80% quartile, which is a high level; and level 5 is greater than the 80% quartile, which is a high level (Liu and Liu, 2024) Through the MATLAB R2024b software, the distribution state transfer probability of urban renewal-ecological resilience-water resilience coordination level was measured for each prefecture in Xinjiang from 2010 to 2021.
3.2.3.1 Traditional Markov chain analysis
First, Table 6 shows that the probability values of diagonal elements are substantially higher than those of non-diagonal elements. The probability distributions of each type’s initial state maintenance are as follows: 61.76%, 54.55%, 45.45%, 43.75%, and 81.82%, with the probability of preserving the initial level typically greater than 50%. With the likelihood of retaining the high-level group reaching 81.82%, the probability values at the two ends of the diagonal line are substantially higher than those in the middle zone, suggesting that areas with high coordination levels are more stable. This distribution feature supports the idea of “club convergence,” which states that regional coordination levels are hierarchically solidified and that it is more challenging to achieve a leap across levels. Second, there is a phenomenon of hierarchical transfer between neighboring types in each prefecture’s coordination level between urban renewal, water resilience, and ecological resilience. This suggests that improving the coordination level between these three factors takes time and is a gradual process. The probability of an upward leap in each tier is low (32.35%), lower (39.39%), medium (42.42%), and higher (46.88%), according to the transfer matrix distribution. This indicates that Xinjiang’s urban renewal, water resilience, and ecological resilience coordination levels are improving along a gradient. Each level has a different likelihood of slipping downward: relatively low level (3.03%), medium level (9.09%), relatively high level (9.38%), and high level (18.18%). Even though there is a positive trend in regional coordination development, it is necessary to be vigilant against the risk of high-level decline, actively sustain the existing level of urban renewal-ecological resilience-water resilience coordination at this stage, and strive to improve its upward transfer.
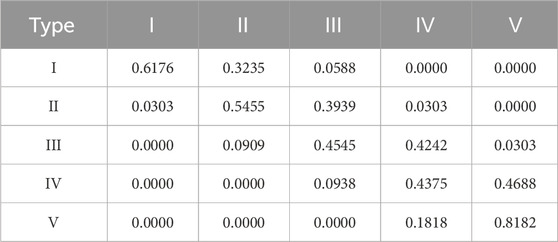
Table 6. Traditional Markov transition probability matrix of urban renewal-ecological resilience-water resilience coordination level in Xinjiang.
3.2.3.2 Spatial Markov chain analysis
The spatial Markov transition probability matrix is constructed in this paper by adding the spatial lag condition to the traditional Markov chain transition probability matrix, to further examine the influence of the spatial relationship on the development trend of urban renewal-ecological resilience-water resilience coordination level in Xinjiang (Table 7).
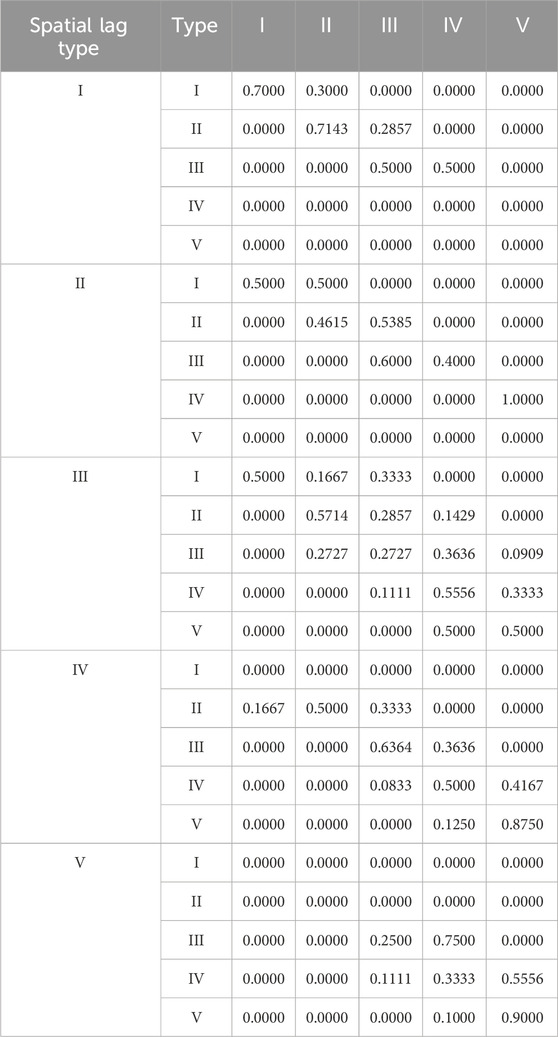
Table 7. Markov transition probability matrix of urban renewal-ecological resilience-water resilience coordination level space in Xinjiang.
Compared with the traditional Markov transition probability matrix, the transition probability distribution of the urban renewal-ecological resilience-water resilience coordination level in the several Xinjiang prefectures varies considerably under various spatial lag states. The presence of non-zero values on both sides of the diagonal of the spatial Markov transfer matrix reveals the possibility of hierarchical leapfrogging in the level of regional coordination, with the possibility of positive upgrading of adjacent tiers and the risk of reverse slippage. Rank shifts occur between neighboring ranks, reflecting the significant impact of the spatial correlation of regional development on the evolution of the level of coordination. Second, the Markov transition probability distribution of the level of coordination between urban renewal-ecological resilience-water resilience varies significantly under the influence of geographical lag, and this region is significantly impacted spatially by the neighboring regions. The stability probability of the low-level group drops from 61.76% to 0.00% when the neighborhood is at a high level, indicating that the stability of the regional coordination level is seriously disrupted. The spatial spillover effect is as follows: when the neighborhood is at a high level, the prefectures with low levels of coordination between urban renewal-ecological resilience-water resilience are likely to make progress and improve. This suggests that being close to prefectures with high levels of coordination between these three factors is beneficial for raising the level of coordination in the area. Additionally, there is a positive “spillover effect” that will partially recover. Conversely, the transition probability of the low level, comparatively low level, medium level, and high level to the higher level is low and the probability of self-stability is high when the low level is a neighborhood. Nonetheless, the neighborhood’s high level has a 0.00% steady-state probability, making it extremely susceptible to the detrimental spillover impact of the low-level neighborhood. On the whole, the likelihood of each level moving to the upper level under the high-level lag type is, on average, low-level (0.00%), relatively low level (33.33%), medium level (36.36%), and relatively high level (41.67%). The likelihood of type transferring to the upper level is greater than the likelihood of relatively low level, medium level, relatively high level, and high level transferring to the lower level.
3.3 The factors of the urban renewal-ecological resilience-water resilience coordination level in Xinjiang
3.3.1 Factors selection
According to relevant research content (Song et al., 2025; Peng et al., 2024), The explained variables are urban renewal-ecological resilience-water resilience coordination level; the explanatory variables are per capita GDP, urban population density, fiscal technology expenditure, total environmental investment, and infrastructure level. Among them, per capita GDP (pgdp) is expressed as regional GDP/total population (in 10,000 yuan/person); The urban population density (den) is expressed as the ratio of urban population to total urban area (people/km2); Fiscal technology expenditure (fte), expressed in total local fiscal science and technology expenditure (in 10,000 yuan); The total environmental investment (env) is expressed in terms of the total local environmental protection expenditure (10,000 yuan); The infrastructure level (infra) is expressed in terms of road mileage/year-end population (kilometers/10000 people).
3.3.2 Spatial correlation test
3.3.2.1 Global spatial autocorrelation analysis
The existence of spatial correlation is a prerequisite for analyzing spatial effects, for this reason, this paper uses stata17 software to test the global spatial autocorrelation of the coordination level of urban renewal-ecological resilience-water resilience based on the adjacency matrix using Moran’s I (Table 8). The findings demonstrate that the urban renewal-ecological resilience-water resilience coordination level in Xinjiang during the study period has a global Moran’s I of 0.078 in 2010 and -0.274 in 2021, both of which pass the significance test at the 10% level. This suggests that the coordinated level in Xinjiang demonstrates clear spatial clustering characteristics and transitions from spatial positive correlation to spatial negative correlation.
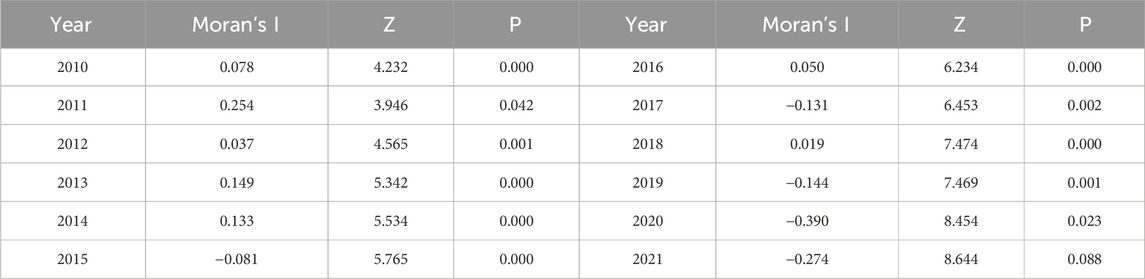
Table 8. Global Moran’s I value of urban renewal-ecological resilience-water resilience coordination level in Xinjiang.
3.3.2.2 Local spatial autocorrelation analysis
In this research, the local Moran’s I of the urban renewal-ecological resilience-water resilience coordination level is plotted as a scatter plot to further analyze the spatial characteristics of the level. According to Figure 7, Moran’s I in 2000 is primarily concentrated in the second and third quadrants, indicating L-H clustering and L-L clustering. By 2021, Moran’s I is primarily concentrated in the first quadrant, exhibiting H-H agglomeration. This suggests that the great majority of Xinjiang’s regions exhibit strong isotropic spatial agglomeration in terms of the coordination level between urban renewal-ecological resilience-water resilience. That is, when the urban renewal-ecological resilience-water resilience coordination level in this region is at a high (low) level, the surrounding neighboring regions are also more likely to be at a high (low) level, and the spatial factor should be taken into account in the empirical process.
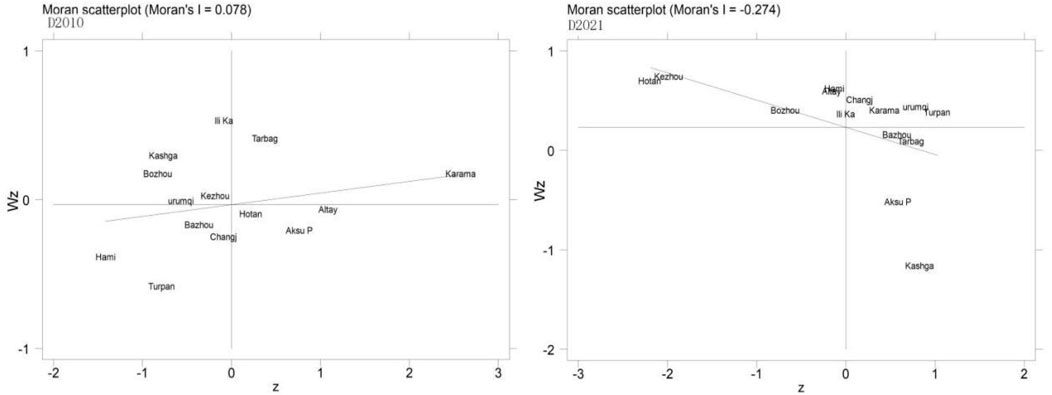
Figure 7. Moran scatter plot of the urban renewal-ecological resilience-water resilience coordination level in Xinjiang during different periods.
3.3.3 Measurement model verification
The factors impacting the coordination level between urban renewal-ecological resilience-water resilience at the global level were determined using spatial econometric modeling (Xu et al., 2022). First, the multicollinearity test findings demonstrate that there is no multicollinearity issue because all of the explanatory variables’ VIF values are much less than 10. The spatial Durbin model with double fixation of time and area was ultimately chosen in this paper following a series of tests that included the Hausman, LM, Robust LM, Wald, and LR tests to decide which spatial econometric model is more appropriate to apply, as shown in Table 9.
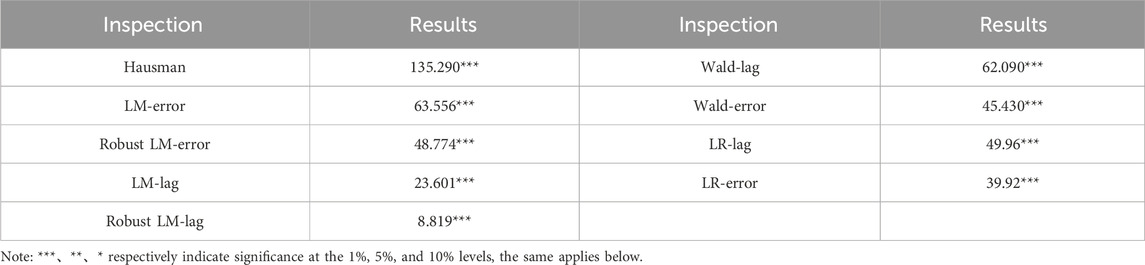
Table 9. Results of spatial econometric model verification.
From the estimation results of the double fixed space Durbin model, the spatial autoregressive coefficient ρ is 0.432, which is significant at the 5% level (Table 10), indicating that the coordination level of Xinjiang’s urban renewal-ecological resilience-water resilience has a positive spatial spillover effect. This means that for every 1% increase in the urban renewal-ecological resilience-water resilience coordination level in this region, the urban renewal-ecological resilience-water resilience coordination level in the neighboring region will result in a 0.432% increase in the level of coordination in the neighboring region.
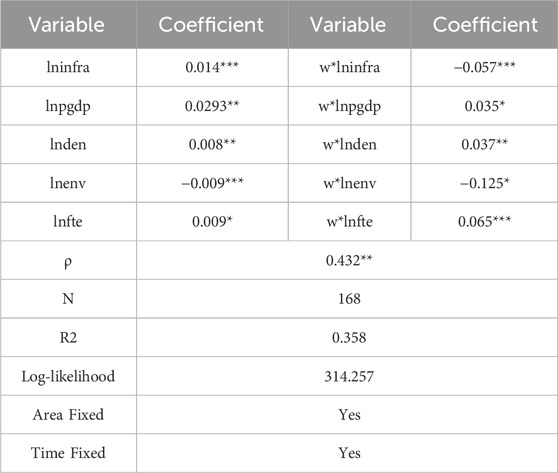
Table 10. Estimation results of the spatial Durbin model.
3.3.4 Effect decomposition
LeSage and Pace. (2010) noted that the use of the spatial Durbin model to determine the spatial effect may be biased and that the results cannot accurately reflect the degree of influence of the independent variable on the dependent variable. The spatial effect must be broken down using the method of partial differentiation, where the direct effect refers to the influence of the independent variable of the region on the dependent variable of the region, and the indirect effect refers to the influence of the independent variable of the region of the dependent variable of the neighboring region, also known as the spatial spillover effect (Lu and Li, 2024) (Table 11).
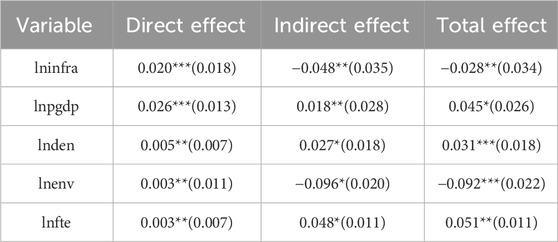
Table 11. Decomposition results of spatial effects.
3.3.4.1 Direct effect
According to the direct effect results (Table 11), the region’s urban renewal-ecological resilience-water resilience coordination level increases by 0.026 for every 10,000 yuan increase in per capita GDP. This coefficient of the direct effect of per capita GDP (pgdp) is 0.026, passing the 10% significance test. The improvement of living conditions is predicated on economic development, and as the nation’s financial strength increases, it offers a strong financial assurance for the establishment of a decent life and stable financial security (Chen and Li, 2024). A higher per capita GDP indicates that citizens are more concerned with their quality of life and have higher expectations for public services and urban living conditions. This will cause the city to speed up urban renewal, and the government will invest more in ecological restoration and protection, which will improve environmental protection for urban renewal and create a positive feedback loop. The coefficient of the infrastructure level direct effect (Infra) is 0.020, Through a 10% significance test, it indicates that the urban renewal-ecological resilience-water resilience coordination level in the local region rises by 0.020 for every unit increase in infrastructure level. Cities can better organize their operations and modernize their businesses with the infrastructure support that highway building offers for urban renewal. Additionally, it improves ecological and water resilience by fostering the conditions necessary for ecological restoration and conservation. The coefficient of the urban population density direct effect (den) is 0.005. Through a 10% significance test, meaning that for every unit increase in urban population density, the level of coordination between urban renewal-ecological resilience-water resilience in the local area increases by 0.005. Higher population density can provide sufficient labor resources and a consumer market for urban renewal and stimulate the development of commercial and service industries in urban renewal. And, to some extent, provide more technological, material, and human support for ecological protection and restoration, which helps promote the construction of ecological resilience. On the other hand, an excessively high population density can put a strain on limited space, surpassing ecosystems’ carrying capacity and intensifying the conflict between urban renewal-ecological resilience-water resilience.
The coefficient of the total environmental investment direct effect (env) is 0.003, passing the 10% significance test. Investments in environmental governance give the development of the coordination of urban renewal, water resilience, and ecological resilience a material and technological basis. By guiding urban industries towards green, low-carbon, and environmentally friendly directions, optimizing the industrial structure of cities, establishing resilient ecosystems, improving environmental quality, and enhancing ecosystem functions, urban renewal can be carried out in a good ecological environment. At the same time, it also creates conditions for improving water resilience and promotes the coordinated progress of the three. The coefficient of the fiscal technology expenditure direct effect (fte) is 0.003. Through a 10% significance test, it suggests that for every 1 unit rise in fiscal technology spending, the urban renewal-ecological resilience-water resilience coordination level in the local area increases by 0.003. Fiscal technology spending can direct funds to projects and regions that assist the coordinated development of urban renewal-ecological resilience-water resilience. It can also focus funds to support important technological research and development, and the construction of large ecological projects. Prevent resource fragmentation and redundant investment, enhance the effectiveness of resource use, accomplish cooperative resource allocation optimization among the three, and encourage the maximization of overall benefits.
3.3.4.2 Indirect effect
Infrastructure level (Infra) has an indirect effect coefficient of −0.048, meaning that for every unit increase in infrastructure level, the level of coordination between urban renewal-ecological resilience-water resilience in the surrounding areas decreases by 0.048. The development of highways hurts the surrounding areas. The construction of highways may result in a disorderly expansion of urban space, occupying a large amount of farmland and ecological land, making the urban form loose, and weakening the connections between urban functional areas, which in turn affects the urban development of neighboring areas. The total environmental investment (env) has a significantly negative indirect effect coefficient. Some high-polluting and high-energy-consuming industries will shift to areas with lax environmental regulations and low environmental investment if a region increases environmental investment and strictly regulates the environment. This will increase the cost of environmental governance, require more resources for environmental restoration in urban renewal, and lower water resilience, thereby impeding the level of coordination between urban renewal-ecological resilience-water resilience. The per capita GDP (pgdp) indirect effect coefficient is substantially positive. Higher per capita GDP regions can share resources, construct more comprehensive infrastructure, offer services to other areas, and enhance the region’s overall water resilience. In addition, it can draw businesses and people from nearby regions to congregate around it, creating a more sensible industrial layout and population distribution during the urban renewal process, encouraging the best possible use of regional resources, and raising the coordination level between urban renewal-ecological resilience-water resilience.
3.3.5 Spatial differentiation characteristics
To further investigate the spatial heterogeneity of the factors of urban renewal-ecological resilience-water resilience coordination level in Xinjiang, this paper uses the GTWR model to visually analyze the regression coefficient of each factor (Figure 8).
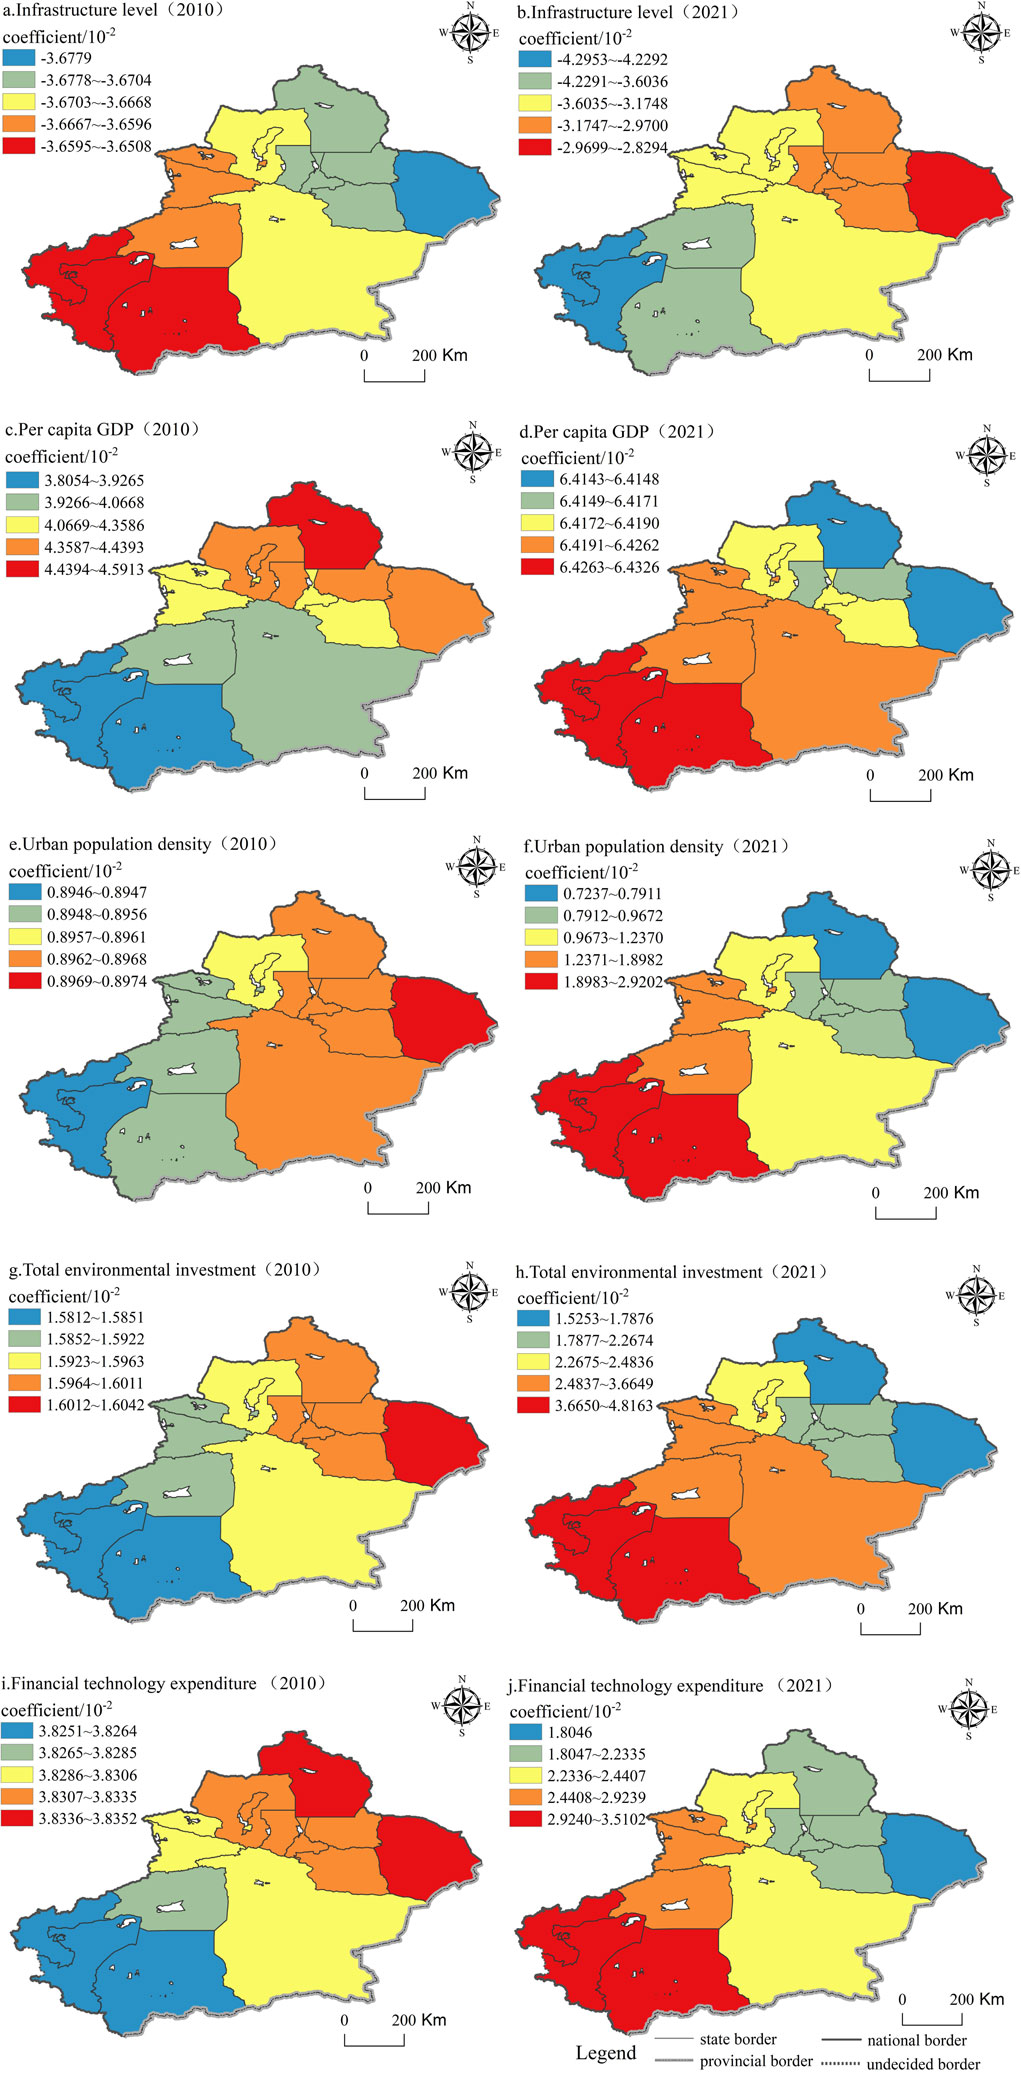
Figure 8. (a–j) Spatiotemporal changes in factors of the urban renewal-ecological resilience-water resilience coordination level in Xinjiang, 2010–2021.
According to Figures 8c,d, the regression coefficient of the impact of per capita GDP on the synergistic level of urban renewal-ecological resilience-water resilience increases, indicating that the role of the economy in the coordinated development of urban renewal-ecological resilience-water resilience tends to be strengthened. Spatially, the spatial pattern of strong in the north and weak in the south evolved to strong in the southwest and weak in the northeast. The role of per capita GDP in Hotan, Kashgar, and Kezhou on coordinated development has changed most significantly, revealing that the economic development trend of these regions has been good in recent years, which has laid a solid foundation for urban renewal and development. According to Figures 8e,f, The coefficient between urban population density and the coordination level of urban renewal-ecological resilience-water resilience has shifted from 0.8946 × 10²∼0.8974 × 10² to 0.7237 × 10²∼2.9202 × 10². The level of coordination between urban renewal-ecological resilience-water resilience is positively impacted by urban population density, which spatially varies from strong in the east to weak in the west to strong in the east with an improved influence. The cities of Hotan, Kashgar, and Kezhou exhibit a steady increase in population density, which supplies enough labor for southern Xinjiang’s infrastructural development and public service enhancement; According to Figures 8a,b, The coefficient of infrastructure level is negative, indicating the infrastructure level has a constraining influence on the coordination level of urban renewal-ecological resilience-water resilience, and this effect tends to rise. Overreliance on traditional grey infrastructure (such as large-scale concrete buildings, roads, etc.) during urban road construction and significant damage to the ecological environment, while neglecting ecological restoration and environmental protection, may lead to a decline in the quality of the ecological environment; According to Figures 8g,h, The coefficient of total environmental investment has shifted from the range of 1.5812 × 10²∼1.6042 × 10² to1.5253 × 102∼4.8163 × 10², indicating a positive trend in the urban renewal-ecological resilience-water resilience coordination level. The effect of environmental governance expenditures on the coordination level of urban renewal-ecological resilience-water resilience was greatest in Hami City in 2010, and greater in Altay Region, Turpan City, Changji Prefecture, and Urumqi City, and then weakened in these regions by 2021, with a spatial pattern of high in the southwest and low in the northeast; According to Figures 8i,j, The coefficient of fiscal technology expenditure has changed from the range of 3.8251 × 10²∼3.8352 × 10² to 1.8046 × 10²∼3.5102 × 10², showing a declining trend in the role of fiscal technology expenditure on the urban renewal-ecological resilience-water resilience coordination level. The spatial pattern reveals a transition from high in the northeast and low in the southwest to high in the southwest and low in the northeast. The Altay region and Hami city have the most drop in impact, whereas Bazhou, Yili prefecture, and Bozhou have the smallest decline.
4 Discussions
4.1 Spatio-temporal characteristics of the coordination level of urban renewal-ecological resilience-water resilience
To further understand the complex interaction between urban renewal, ecological resilience, and water resilience, this paper explores the coupling coordination and trend evolution of urban renewal-ecological resilience-water resilience by calculating the coordination level and transition probability of urban renewal-ecological resilience-water resilience. Compared with previous studies (Meng et al., 2025; Zhang et al., 2023), the traditional coupling coordination model has the problems of effectiveness and unreasonable calculation of boundary values. We use the modified CCD model, which can avoid the bias of the traditional grading table bias towards stability, which can better distinguish the coupling coordination level and improve the explanatory power of the results. In the study of the spatial pattern of coordination, previous studies only introduced kernel density into the temporal evolution of coordination level (Wang et al., 2025a; Yu et al., 2025), We introduce kernel density into the spatial evolution of coordination and can identify the spatial layout and agglomeration state of coordination level.
The coordinated development of urban renewal, ecological resilience, and water resilience is a dynamic process. The coordinated development of the three plays an important role in promoting the sustainable development of Xinjiang’s cities. The results show that the coordination level of urban renewal-ecological resilience-water resilience in various prefectures in Xinjiang is developing on an upward trend, but the spatial gap is also increasing, and the spatial imbalance in southern Xinjiang is significant, and the economic development, resource endowment, and ecological environment of southern Xinjiang lag behind those of northern and eastern Xinjiang. There are several reasons for this, first of all, the low density of the transportation network in southern Xinjiang, the lack of transportation infrastructure construction, the remoteness of Hotan and Kashgar, and the high transportation cost, which greatly restricts the economic exchanges and trade between southern Xinjiang and other regions, while the northern Xinjiang has strong transportation accessibility, which provides convenience for the connection between the region and the mainland and other countries, so southern Xinjiang needs to focus on strengthening the construction of road infrastructure in the future urban renewal planning, improving traffic accessibility, and laying the foundation for economic development. Secondly, the educational resources in southern Xinjiang are backward, the concentration of talents is low, and in the process of resource development, the technical level is relatively low and is in the primary development stage, while northern Xinjiang has a developed economy, attracting talent inflow and promoting the rapid development of industries. Finally, the drought lack of rain and serious desertification in southern Xinjiang limit the scale of agricultural and industrial development, which will bring uncertain impact on urban development, while the climate of northern Xinjiang is more humid than that of southern Xinjiang, with more precipitation, which provides a certain material basis for agricultural production and ecological environment, and provides good production conditions for economic development, so it is necessary to focus on ecological protection and restoration and set up special funds for ecological protection for desertification control, vegetation restoration, grassland protection and other projects in southern Xinjiang to provide stability of the ecosystem.
4.2 Influencing factors of coordination level of urban renewal-ecological resilience-water resilience
Scholars discussed the influencing factors of the relationship between urban renewal, ecological resilience, and water resilience. Most studies consider per capita GDP (Sun et al., 2023), level of science and technology, and population density (Yang et al., 2025) to be the main influencing factors, among which urban renewal in the region has a negative impact on the ecological resilience of the region (Peng et al., 2024), mainly because the higher the proportion of the secondary industry, the greater the pollution emissions, and the more unfavorable the improvement of ecological resilience. However, urban renewal in the region has a positive spillover effect on the ecological resilience of neighboring areas, mainly because the pressure of “upward competition” caused by environmental regulations will force cities to develop in a greener direction (Peng et al., 2023). Moreover, the response index of ecological resilience to urban renewal shows a downward trend, which may be due to the rapid process of urban renewal, which has exceeded the supporting role of ecological resilience in urban renewal (Peng et al., 2024). This indicates that per capita GDP, financial expenditure on science and technology, and population density have high explanatory power in this study. With the continuous expansion of urbanization, what difficulties will Xinjiang face in urban renewal actions? And how can Xinjiang get out of these predicaments? This aroused our great interest. Xinjiang has long faced problems such as water scarcity, fragile ecology, and unbalanced industrial structure, and with the implementation of urban renewal, Xinjiang has exacerbated problems such as resource constraints, ecological pollution, industrial transformation pressure, and regional development differences. This means that the contradiction between urban development and resources and the environment can be alleviated through policy tilt. Therefore, this study included three variables, namely, infrastructure level, total environmental investment, and financial expenditure on science and technology, into the influencing factors of urban renewal, ecological resilience, and water resilience coordination. The findings indicate that both environmental investment and infrastructure level have negative spillover effects. From a spatial pattern perspective, the impact of infrastructure level on southern Xinjiang is greater. This could be because of the region’s single economic structure, the fact that infrastructure construction is the foundation of industrial upgrading, the region’s large land area and sparse population, and the challenge of providing public services, all of which contribute to the region’s wide infrastructure gap. Northern Xinjiang is more affected by overall environmental investment, which may be because of the region’s high level of industrialization, concentration of the energy sector, high level of environmental pollution, and pressing need for ecological governance. Furthermore, it is critical to advance environmental governance and enhance the ecological environment through green investment due to the rapid pace of urbanization and the challenging domestic pollution control duties in northern Xinjiang.
5 Conclusions and policy recommendations
5.1 Conclusions
We use the entropy method, the comprehensive evaluation method, the modified CCD model, the kernel density estimation, the traditional and spatial Markov chains, and the spatial econometric model to study the development level, coordinated development characteristics, evolution trend and influencing factors of urban renewal, ecological resilience, and water resilience in 14 prefectures in Xinjiang. The main conclusions are as follows.
(1) The development level of urban renewal and ecological resilience in Xinjiang is generally on an upward trend, and water resilience is generally on a downward trend. Spatially urban renewal, ecological resilience, and water resilience show spatial heterogeneity, but the high-value areas are spreading to the northwest.
(2) The core density curve appears double-peaked and is flat and wide, indicating that urban renewal-ecological resilience-water resilience coordinated development is polarized across Xinjiang. Spatially, the core area of kernel density is narrowed down to Changji Prefecture, but the synergy level has increased as a whole.
(3) The traditional Markov chain results indicate that the transfer of the urban renewal-ecological resilience-water resilience coordination level in Xinjiang has higher stability. After incorporating spatial lag factors, the states of adjacent regions have a positive spillover effect on the evolution of regional states. The probability of collaborative type upward transfer in each region is greater than the probability of type downward transfer.
(4) The spatial measurement results show that per capita GDP, infrastructure level, total environmental investment, fiscal technology expenditure, and urban population density are all conducive to the improvement of the coordinated development level of local urban renewal-ecological resilience-water resilience, among which the infrastructure level and total environmental investment have significant negative spatial spillover effects, and the GTWR model shows that the impact of five influencing factors on the coordination level of urban renewal-ecological resilience-water resilience has spatial differentiation characteristics.
5.2 Policy recommendations
(1) According to the distribution characteristics of urban renewal-ecological resilience-water resilience coordination level, compared with northern Xinjiang, southern Xinjiang has significant spatial imbalance characteristics and low coordination level. Through policy guidance, an inter-regional information exchange platform can be established to encourage the northern Xinjiang region to export advanced green technology and management experience to the southern Xinjiang region, to help the southern Xinjiang region improve its urban renewal capacity and reduce the urban development gap between the southern and northern Xinjiang regions. The transportation infrastructure in southern Xinjiang is weak, so it is necessary to improve the accessibility of transportation and improve the quality of urban development and the living standards of residents. In addition, attention should also be paid to the education of residents’ cultural quality, the construction of intangible cultural heritage inheritance centers, the creation of cultural scenes, the dissemination of traditional culture, the improvement of residents’ awareness and participation in urban renewal, and the creation of a good atmosphere for the participation of the whole society.
(2) The level of ecological resilience in southern Xinjiang is low, and the contradiction of a fragile ecological environment is prominent. Therefore, it is necessary to build an ecological barrier against wind and sand fixation, curb the expansion of deserts, such as Aksu Prefecture and Hotan Prefecture, implement sand prevention and control projects around the Tarim Basin, and expand the area of oases through artificial afforestation, sand closure and afforestation (grass), and aerial seeding. Strengthen the control and monitoring of sand sources, strictly prohibit the implementation of grazing bans, fallow grazing, and rotational grazing systems in degraded grasslands, and restore grassland vegetation. In addition, the protection and restoration of groundwater should be strengthened, the overexploitation of groundwater should be strictly controlled, the dynamic monitoring of groundwater level should be implemented, and the groundwater level should be gradually restored. Strengthen the construction of water-saving projects, implement the transformation of pipe networks, promote the combination of high-efficiency water-saving technologies in agriculture and digital technology, realize the effect of efficient water supply, water management, and water use, carry out pilot demonstrations of regional reclaimed water recycling, promote the recycling of water resources, and alleviate the urgency of water shortage in regional development.
(3) In the development of urban renewal, the dual dilemma of “ecological disturbance” and “water constraint” should be solved. For desert fringes and areas with serious water shortages, such as Hotan and Kashgar, we should first increase investment in water source guarantee projects, improve the storage capacity of reservoirs for urban water supply, and strengthen windbreak and sand fixation barriers to curb the expansion of desertification. Because of the strong agricultural areas such as Aksu Prefecture and Bazhou, it is necessary to increase investment in water-saving urban facilities, rationally plan the structure of water use, and increase investment in ecological restoration of oases, to return farmland to forests and wetlands and restore degraded grasslands. In addition, it is necessary to build resource-recycling cities, and make large-scale investments in low-carbon transportation systems, distributed energy facilities, solid waste recycling, and other projects to reduce the impact of urban development on the ecological environment, and finally build a sustainable development model of symbiosis and co-prosperity of “water-saving cities-oasis ecosystems-desert shelterbelts”.
5.3 Limitations and future research
This study used the modified CCD model, kernel density estimation, traditional and spatial Markov chains, spatial econometric model, and GTWR model to analyze the spatiotemporal characteristics, evolution trends, and influencing factors of the coordination level of urban renewal-ecological resilience-water resilience. However, there are still shortcomings in this study: firstly, considering the availability of data, this study uses panel data from 14 prefectures in Xinjiang from 2010 to 2021, and the time frame of the study is short, the data is time-sensitive, and the lagging data may affect the conclusion; Secondly, the construction of the urban renewal index system is not perfect, and some characteristic indicators may be omitted from taking Xinjiang as the research object. Finally, it is of practical significance to grasp the coupling and coordinated development of urban renewal, water resources, and ecological environment in Xinjiang from the macro level, and if we can start from the micro level and take the urban renewal community in Xinjiang as the research object to explore the relationship between urban development and resources and environment, it will be more reasonable and scientific to promote the sustainable development of urban renewal.
Data availability statement
The datasets presented in this article are not readily available because the original contributions presented in the study are included in the article; further inquiries can be directed to the corresponding author. Requests to access the datasets should be directed to XL, bGl5dWU3NTExQDE2My5jb20=.
Author contributions
YS: Writing – original draft, Formal Analysis, Data curation, Software, Investigation, Visualization, Conceptualization, Methodology, Validation. XL: Project administration, Supervision, Conceptualization, Writing – review and editing, Funding acquisition, Resources.
Funding
The author(s) declare that financial support was received for the research and/or publication of this article. This work was supported by the [“Xinjiang Autonomous Region Talent Development Fund ‘Tianchi Talent’ Introduction Program (Innovation Leaders)”].
Acknowledgments
The authors would like to thank the reviewers and editors for commenting on this paper. Thank you to everyone who contributed to this study.
Conflict of interest
The authors declare that the research was conducted in the absence of any commercial or financial relationships that could be construed as a potential conflict of interest.
Generative AI statement
The author(s) declare that no Generative AI was used in the creation of this manuscript.
Publisher’s note
All claims expressed in this article are solely those of the authors and do not necessarily represent those of their affiliated organizations, or those of the publisher, the editors and the reviewers. Any product that may be evaluated in this article, or claim that may be made by its manufacturer, is not guaranteed or endorsed by the publisher.
References
Brunsdon, C. E., Fotheringham, A. S., and Charlton, M. E. (1999). Some notes on parametric significance tests for geographically weighted regression. J. Regional Sci. 39 (3), 497–524. doi:10.1111/0022-4146.00146
Chen, Y. H., and Li, M. J. (2024). Evolution of spatiotemporal patterns and influencing factors of china’s agricultural green resilience. Reform Econ. Syst. 42 (05), 70–78.
Chen, Z. C., and Ma, Y. D. (2022). Impact of urban renewal on residents’ happiness in China—A study based on genetic algorithm projection pursuit and panel spatial quantile model. Manag. Rev. 34 (08), 43–53. doi:10.14120/j.cnki.cn11-5057/f.2022.08.015
Deng, G. Y., and Shen, Y. C. (2025). Characterization and influencing factors of ecological resilience linkage networks in Chinese provinces. ARID Geogr. 48 (04), 704–716.
Fang, Y. L., Wang, Q. Y., Huang, Z. F., and Wu, Y. (2023). Spatial and temporal evolution of tourism economic resilience and mechanism of impact in China. Prog. Geogr. 42 (03), 417–427. doi:10.18306/dlkxjz.2023.03.001
He, C., and Liu, R. Z. (2019). Poverty reduction effect of urban renewal. Econ. Surv. 36 (06), 40–46. doi:10.15931/j.cnki.1006-1096.2019.06.003
Hu, K. Q., Lin, M. X., Lin, T., Ye, H., Zhang, G. Q., Hui, J. L., et al. (2022). Spatial identification and quantitative evaluation of conflict space between urban sprawl and ecological protection in the process of rapid urbanization: a case study of the yangtze river Delta eco-green integrated development demonstration zone. Acta Ecol. Sin. 42 (2), 462–473. doi:10.5846/stxb202102070402
Huang, G. Z., Li, X., Zhang, W. Z., Lin, J., Tian, L., Zhang, J. x., et al. (2025). Urban renewal in China with the transition to high-quality development: challenges and paths. J. Nat. Resour. 40 (01), 1–19. doi:10.31497/zrzyxb.20250101
Huang, Z., and Guo, L. X. (2022). Impact of residential orientation urban renewal on the commuting behavior: a case study of shenzhen city. AREAL Res. Dev. 41 (06), 68–74. doi:10.3969/j.issn.1003-2363.2022.06.012
Jiang, W. X., Wu, J., and Xu, J. G. (2023). Study on the coupling coordination between urban ecological resilience and economic development level—taking Jiangsu Province as an example. Resour. Dev. & Mark. 39 (03), 299–308+318. Available online at: https://kns.cnki.net/kcms/detail//51.1448.N.20221209.1709.003.html.
Johnson, M., Ballantyne, A., Graham, J., Holden, Z., Hoylman, Z., Jensco, K., et al. (2025). An ecosystem resilience index that integrates measures of vegetation function, structure, and composition. Ecol. Indic. 171, 113076. doi:10.1016/j.ecolind.2025.113076
Keith, N. S. (1954). Rebuilding American cities: the challenge of urban redevelopment. Am. Scholar 23 (3), 341–352. Available online at: https://www.jstor.org/stable/41207833.
LeSage, J., and Pace, R. K. (2010). Introduction to spatial econometrics. London, Britain: Taylor and Francis; CRC Press. doi:10.1201/9781420064254
Li, G., Kang, D., and Hao, M. (2024a). Spatial-temporal characteristics and driving factors of collaborative security of water-energy-food linkage systemin the yellow river basin. Geogr. Geo-Information Sci. 40 (05), 84–91+142. doi:10.1016/j.jclepro.2023.140153
Li, Q., Dong, L., Deng, P. A., Zhu, X. Y., and Li, Y. (2023). Spatial evolution and driving factors for the people's livelihood development level in China, 2010-2021. ACTA Geogr. SIN. 78 (12), 3037–3057. doi:10.11821/dlxb202312008
Li, Y. N., Yang, L. J., and Li, X. T. (2025). Assessment on urban ecological resilience in the hexi corridor based on the “resistance-adaptability-recovery” model. Chin. J. Ecol. in press. Available online at: http://cnki.ccki.top/kcms/detail/21.1148.q.20241217.0857.004.html.
Li, Z. Y., Feng, X. G., He, J., and Zuo, W. J. (2024b). Spatial correlation network structure and driving factors of tourism ecological resilience in China. Geogr. Res. 43 (05), 1146–1165. doi:10.11821/dlyj020230737
Liu, H. D., and Lu, C. X. (2023). The impact of innovation ecosystem resilience on high-quality economic development. Forum Sci. Technol. China 39 (01), 48–57. doi:10.13580/j.cnki.fstc.2023.01.005
Liu, J., and Liu, H. (2024). Study on the spatiotemporal evolution of coupled and coordinated digital economic resilience and efficiency. Int. Rev. Econ. Finance 93, 876–888. doi:10.1016/j.iref.2024.02.058
Liu, S. S., Jiang, X., Zhang, L., Zhang, Z. C., and Cai, Y. T. (2021). Study on the measurement of urban economic resilience and its spatial-temporal evolution in the Yangtze river. Economic belt. City& Gov. 39 (06), 31–35.
Liu, X. S., and Zhou, D. (2022). Practical exploration and enlightenment of British urban regeneration under culture-led. Econ. Geogr. 42, 64–71. doi:10.15957/j.cnki.jjdl.2022.06.007
Lu, Z. Y., and Li, H. M. (2024). Coordination development of “water-energy-food” system in China’s Aariculture and Iis Iifluencing factors. Econ. Geogr. 44 (12), 177–186+227. doi:10.15957/j.cnki.jjdl.2024.12.018
Ma, F., Hu, R. Q., and Li, Z. J. (2013). Evaluation and impact analysis of “resilience-vulnerability-sustainability” of water resources in Han jiang river basin. Water Resour. Power 50 (8), 68–81. doi:10.20040/j.cnki.1000-7709.2025.20241209
Meng, Q. S., Gong, Y., and Liu, X. Y. (2025). “Research and prediction of the degree of coupling coordination of water resources, socioeconomic development, and the ecological environment: a case of the Inner Mongolia section,” in The yellow river basin arid zone research. in press. doi:10.13866/j.azr.2025.04.10
Ou, Y. X., Wei, X., Wei, G. E., and Wang, K. (2023). The expansion efficiency of urban land in China's urban agglomerations and its impact on ecosystem services. Habitat Int. 141, 102944. doi:10.1016/j.habitatint.2023.102944
Peng, W. B., and Cao, X. T. (2023). Spatiotemporal differentiation of ecological resilience under urban renewal and its influencing mechanisms around the changsha-zhuzhou-xiangtan urban agglomeration. Econ. Geogr. 43 (10), 44–52. doi:10.15957/j.cnki.jjdl.2023.10.005
Peng, W. B., Di, Y. X., Kuang, C. E., Su, X. y., Ning, Y. x., and Zhao, D. d. (2025). The coupling effect of urban renewal and ecological resilience and its influencing factors in the changsha-zhuzhou-xiangtan surrounding area. J. Nat. Resour. 40 (06), 1569–1585. doi:10.31497/zrzyxb.20250609
Peng, W. B., Kuang, C. E., Li, W. Y., and Di, Y. X. (2024). Spatial correlation network and impacts of urban renewal and ecological resilience in urban agglomerations in the middle reaches of the Yangtze river. Sci. Geogr. Sin. 44 (11), 1936–1945. doi:10.13249/j.cnki.sgs.20240159
Peng, W. B., Su, X. Y., Yang, S. S., Kuang, J. S., and Cao, X. T. (2023). Spatio-temporal evolution and spillover effects of urban green innovation under envir onmental regulation. Sci. Geogr. Sin. 43 (1), 41–49. doi:10.13249/j.cnki.sgs.2023.01.005
Peng, W. B., and Xie, X. Q. (2024). Response of ecological resilience to urban renewal in chang-zhu-tan urban agglomeration. Resour. Environ. Yangtze Basin 33 (11), 2369–2378. doi:10.11870/cjlyzyyhj202411005
Ren, H. J., and Li, H. S. (2024). Spatial and temporal evolution characteristics and influencing factors of rural ecological resilience in China. ARID Geogr. 47 (11), 1915–1923. doi:10.12118/j.issn.1000-6060.2023.707
Song, W. X., Chen, H., Cui, C., Liu, Y. f., Tong, D., Guo, F., et al. (2025). Theoretical, methodological, and implementation considerations for establishing a sustainable urban renewal model. J. Nat. Resour. 40 (01), 20–38. doi:10.31497/zrzyxb.20250102
Sun, Y., Liu, W. Z., and Sheng, Y. (2023). Spatiotemporal differences and influencing factors of economic and ecological resilience of water resources in Xinjiang. ARID Geogr. 46 (12), 2017–2028. doi:10.12118/j.issn.1000-6060.2023.155
Sun, Y., Meng, S. S., and Liu, W. Z. (2024). Coordination analysis and future prediction of the resilience of water resources and economic ecosystems in Xinjiang. Yangtze River 55 (06), 143–151. doi:10.16232/j.cnki.1001-4179.2024.06.020
Tao, J. Y., Dong, P., and Lu, Y. Q. (2022). Spatial-temporal analysis and influencing factors of ecological resilience in Yangtze river Delta. Resour. Environ. Yangtze Basin 31 (9), 1975–1987. Available online at: https://kns.cnki.net/kcms/detail/42.1320.X.20220409.1234.002.html.
Tao, X. D. (2015). Model of transformation on urban renewal in China: from Economy Old City Reconstruction to social urban renewal. Urban Dev. Stud. 22 (04), 111–116+124.
Wamsler, C., Brink, E., and Rivera, C. (2013). Planning for climate change in urban areas: from theory to practice. J. Clean. Prod. 50 (8), 68–81. doi:10.1016/j.jclepro.2012.12.008
Wang, J., Bai, W. C., and Yu, X. S. (2025a). Spatial-temporal distribution pattern and dynamic evolution of the coupling coordination degree between high-quality development of the construction industry and ecological resilience. Environ. Sci. in press. doi:10.13227/j.hjkx.202502009
Wang, L. Q., and Li, G. Z. (2025). Spatial-temporal characteristics and influencing factors of urban ecological resilience in China. ARID Geogr. 48 (05), 893–904. Available online at: https://link.cnki.net/urlid/65.1103.X.20241210.1722.004.
Wang, S. J., Kong, W., Ren, L., Zhi, D. d., and Dai, B. t. (2021). Research on misuses and modification of coupling coordination degree model in China. J. Nat. Resour. 36 (03), 793–810. doi:10.31497/zrzyxb.20210319
Wang, S. M., Niu, J. L., Jiang, H., and He, Z. L. (2025b). The impact and spatial spillover of tourism economy on ecological resilience in the Yellow river basin. Geogr. Res. 44 (01), 205–222. doi:10.11821/dlyj020240302
Wang, W. R., Liang, M. Q., Su, M., and Guo, H. (2022). Study on the effect of urban renewal driving high quality economic development. J. Statistics Inf. 37 (12), 112–125. Available online at: https://kns.cnki.net/kcms/detail/61.1421.C.20221021.1343.002.html.
Wang, Y. S. (2023). Development and spatial structure of China’s marine economic resilience. AREAL Res. Dev. 42 (03), 7–12. doi:10.3969/j.issn.1003-2363.2023.03.002
Wang, Z., Qin, F., Liu, J., and Jin, X. (2025c). “Evolution trajectory and driving mechanism of the synergistic effect on construction waste and carbon reduction: evidence from China,”, 203. New York, N.Y. doi:10.1016/j.wasman.2025.114891Waste Manag.114891
Wei, G. E., Zhang, W. Q., Bi, M., Sun, P. J., Li, S. S., QY, X., et al. (2024). Trade-offs and synergies pattern evolution of ecosystem structure-resilience-activity-services (SRAS) in the belt and road initiative region. Resour. Conservation & Recycl. 211, 107883. doi:10.1016/j.resconrec.2024.107883
Xiang, Y. H., and Wang, Z. Q. (2024). Spatiotemporal heterogeneity analysis of the impact of urban renewal on local government debt — based on time geography weighted model. Sub Natl. Fiscal Res. 21 (05), 65–73.
Xu, Y. T., Mu, Y. Y., and Zhang, Z. Z. (2022). The influencing factors and spatial spillover effects of water use efficiency of grain production in China. J. Huazhong Agric. Univ. Sci. Ed. 42 (4), 76–89. doi:10.13300/j.cnki.hnwkxb.2022.04.007
Yang, L., Xu, Y., and Zhu, J. Q. (2025). Assessment of water ecological resilience and influencing factors in urban agglomerations along the middle reaches of the Yangtze river. J. Saf. Environ. 25 (1), 335–347. doi:10.13637/j.issn.1009-6094.2024.0847
Yu, X. Y., Wu, J., Wei, G. P., Gao, Y. X., and Zhou, T. (2025). The coupling coordination relationship and driving factors of economic quality and ecological resilience in re⁃ source-based cities of the“jizi bend”of the yellow river. J. Shenyang Agric. Univ. 56 (2), 144–159. doi:10.3969/j.issn.1000-1700.2025.02.015
Zhang, M. D., Ren, Y. T., and Liu, Y. B. (2025). Coordination degree and driving factors of water resources utilization efficiency and ecological resilience in China. WORLD REG. Stud. 34 (02), 168–180. doi:10.3969/j.issn.1004-9479.2025.02.20230240
Zhang, M. M., Zhang, Z. Y., Tong, B., Ren, B., Zhang, L., and Lin, X. H. (2023). Analysis of the coupling characteristics of land and transfer and carbon emissions and its influencing factors: a case study of China. Front. Environ. Sci. 4 (10), 1105552. Available online at: https://doi.org/10.3389/fenvs.2022.1105552
Keywords: urban renewal, ecological resilience, water resilience, coordination level, factors, Xinjiang
Citation: Sun Y and Li X (2025) Coupling coordination analysis and factors of “Urban renewal-ecological resilience-water resilience” in arid zones. Front. Environ. Sci. 13:1615419. doi: 10.3389/fenvs.2025.1615419
Received: 21 April 2025; Accepted: 30 June 2025;
Published: 08 August 2025.
Edited by:
Nazmul Huq, Technical University of Cologne, GermanyCopyright © 2025 Sun and Li. This is an open-access article distributed under the terms of the Creative Commons Attribution License (CC BY). The use, distribution or reproduction in other forums is permitted, provided the original author(s) and the copyright owner(s) are credited and that the original publication in this journal is cited, in accordance with accepted academic practice. No use, distribution or reproduction is permitted which does not comply with these terms.
*Correspondence: Xinwu Li, bGl5dWU3NTExQDE2My5jb20=