 Ang Yue1,2
 Xueer Guo
 Haiying Gong
- 1School of Environmental Science and Engineering, Tianjin University, Tianjin, China
- 2Tianjin Eco-Environmental Monitoring Center, Tianjin, China
- 3Academy of Ecological Civilization Development for JING-JIN-JI Megalopolis, Tianjin Normal University, Tianjin, China
- 4Tianjin Environmental Emergency and Accident Investigation Center, Tianjin, China
- 5Tianjin Natural Resources Ecological Restoration and Remediation Center, Tianjin, China
Wetland ecosystem nature reserves provide both ecological protection and cultural-educational functions, requiring scientific evaluation of their ecosystem services and interactions. This study assessed water resource supply, soil conservation, carbon fixation and oxygen release, and habitat quality in four wetland reserves in Tianjin from 2000 to 2020 using the InVEST model. Spatial and temporal dynamics were examined, and trade-offs and synergies among services were analyzed using an ecosystem service trade-off synergy model. Results showed that: (1) ecosystem service functions varied significantly across reserves. Habitat quality improved, soil conservation declined slightly, and carbon storage decreased from 7.61 t/hm2 in 2000 to 5.23 t/hm2 in 2015, then rebounded. (2) Core and buffer zones generally had higher service levels than experimental zones, with carbon storage and soil retention higher by approximately 1 t/hm2 and 0.1 t/hm2, respectively. (3) Soil conservation showed strong synergy with habitat quality and carbon storage, while carbon storage exhibited trade-offs with habitat quality and water yield. These findings provide a scientific basis for targeted management of wetland reserves.
1 Introduction
Wetland ecosystems have ecological functions such as water conservation, soil and water conservation, water purification, biodiversity maintenance, and climate regulation (Costanza et al., 1997; Ouyang et al., 2020; Xue et al., 2022). Wetlands provide habitats for a variety of animals and plants and play an active role in maintaining global water and carbon cycles. The ecological functions of wetlands are becoming increasingly important in the context of climate change and ecological environmental deterioration. However, with rapid urbanization, the structure and function of wetland ecosystems have severely decreased; this not only affects the ecological balance of wetlands but also threatens regional and global ecological security (Yin and Ni, 1998). Establishing nature reserves is important for protecting wetland ecosystems because they provide a stable ecosystem environment by restricting human activities (Deng and Chen, 2003; Assessment, 2005). Therefore, in-depth research on the dynamic spatiotemporal changes in wetland ecosystem service functions, especially within protected areas, has important scientific value and practical significance.
Ecosystem service functions refer to the environmental conditions and benefits provided by natural ecosystems that support human survival. Methods of evaluating wetland ecosystem service value are constantly evolving. Brander estimated the economic value of global wetlands using the benefit transfer method and found that wetlands are more valuable in areas with high population densities (Bhowmik, 2022). Friedrichsen explored the value of various ecological services provided by wetlands, especially water purification, by combining the replacement cost and life cycle analysis methods (Vymazal, 2022). Li et al. evaluated the functional value of wetland ecosystems in a given study area using the InVEST model (Rahimi et al., 2020; Li et al., 2024; Zhou et al., 2024). Shirong evaluated the gross ecosystem products of Shanxi Province using the MIMES model (Jiang, 2022). Le and Xin performed a meta-analysis to systematically evaluate the value of wetland ecosystem services on Hainan Island and Zhangye Heihe (Yang et al., 2023; Zhang et al., 2024). Qiang used the conditional value method and random effects logit model to evaluate the value of the supporting services of the Caofeidian wetland ecosystem and used the distance decay model to explore its spatial evolution and regional differences (Wei et al., 2021). Among these methods, the InVEST model presents excellent spatial analysis capabilities. By simulating changes in the value of ecosystem service functions under various land use and land cover scenarios, it can provide a solid scientific basis for decision-makers to evaluate the effects of human activities on ecosystems and has been used worldwide (Choudhary et al., 2021; Nelson et al., 2024). The concepts of ecosystem synergy and trade-off relationships originate from evaluations of the economic benefits of green agricultural production by foreign scholars and reflect the interaction between the various components of the system that both constrains and promotes the system (Min et al., 2025). Current research has mainly focused on conflicts between ecosystem services caused by human activities, especially land use changes (Roy et al., 2022; Liu et al., 2023). In terms of research methods, scholars outside of China have introduced a variety of models and tools to analyze the trade-offs and synergies of ecosystem services. The InVEST model has become a mainstream research tool for simulating changes in ecosystem services and their tradeoffs and synergies under different scenarios (Kareiva et al., 2011). Nelson combined spatial optimization models with scenario analysis to reveal the dynamic trade-off effects of land use changes on the supply of ecological services in the Willamette Basin of Oregon (Nelson et al., 2024). NASA’s remote sensing data have also been widely used to study the trade-off between forest carbon storage and water resource services (Ramirez-Reyes et al., 2019). Domestic researchers have used the InVEST model, spatial overlay method, and other methods to analyze the relationship among ecosystem services based on natural and social data with Chinese characteristics. Jianji used the InVEST model and RUSLE equation to quantify ecosystem food supply services and used cluster and outlier analyses to explore the trade-offs and synergies of ecosystem services in northern Shaanxi (An et al., 2025). Jie used the InVEST model to analyze the spatiotemporal distribution characteristics of ecosystem service functions and the correlation coefficient method to obtain the trade-offs and synergies between different ecosystem service functions and land use types in the Yangtze River Delta (Min et al., 2025). Zhang Nengneng quantified the main ecosystem service functions of their study area based on the CASA and InVEST models and used the spatial overlay method to analyze the spatiotemporal heterogeneity of the trade-off/synergy relationship between ecosystem services (Zhang and Liu, 2024).
Although progress has been made in the types and evaluation methods of ecosystem service functions, the overall functional differences and trade-offs of ecosystem services within nature reserves remain poorly understood. Therefore, this study used four nature reserves in Tianjin as the research objects and evaluated the spatiotemporal characteristics of soil conservation, carbon storage, water production, and habitat quality from 2000 to 2020 using the InVEST model. The trade-offs and synergies between ecosystem services in different functional areas were analyzed to provide decision-making references for ecological protection and management of wetlands.
2 Materials and methods
2.1 Study area
Tianjin, in northern China, is a typical coastal ecosystem area with abundant wetland resources and diverse ecological functions. With the acceleration of urbanization, wetland ecosystems in coastal areas face varying degrees of threats. To effectively protect the wetland ecological environment, Tianjin has established multiple wetland nature reserves, including the Tianjin Ancient Coast and Wetland National Nature Reserve, Tianjin Beidagang Wetland Nature Reserve, Tianjin Dahuangbao Wetland Nature Reserve, and Tianjin Tuanbo Bird Nature Reserve (Decision on amending the Administrative Measures for Tianjin Ancient Coast and Wetland National Nature Reserve, 2004; Management Measures for Tianjin Ancient Coast and Wetland National Nature Reserve, 2011; Tianjin Wetland Protection Regulations, 2023; Liu, 2019). Among them, the Tianjin Ancient Coast and Wetland National Nature Reserve is a marine and coastal ecosystem type nature reserve (Figure 1b2); Tianjin Beidagang Wetland Nature Reserve has multiple types of wetland characteristics and a well-preserved ecosystem (Figure 1b4); Tianjin Dahuangbao Wetland Nature Reserve is a large reed marsh wetland (Figure 1b1); and Tianjin Tuanbo Bird Nature Reserve has abundant flora and fauna resources (Figure 1b3). These four wetland nature reserves are typical of the wetland ecosystems in Tianjin. With the advancement of urbanization, further strengthening of the management and monitoring of these wetland reserves is crucial for achieving sustainable development of wetland ecosystems.
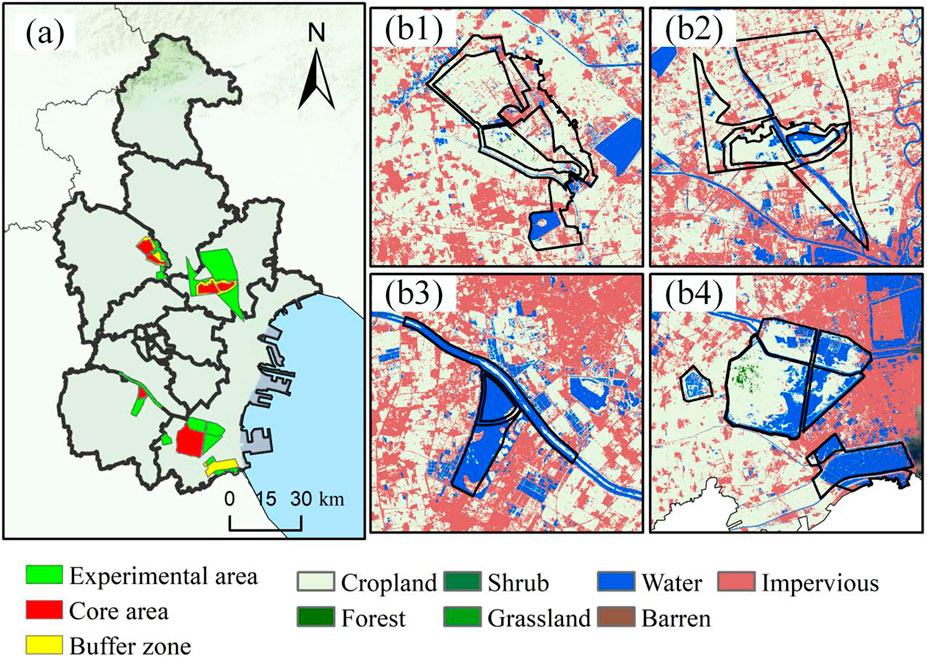
Figure 1. Study area overview (a) Location of Tianjin urban area (b) Layout of Tianjin Binhai Wetlands.
2.2 Data sources
Based on the actual situation of the four wetland nature reserves in Tianjin Binhai and the availability of relevant data, this study evaluated the ecosystem services of water resource supply, soil conservation, carbon sequestration and oxygen release, and habitat quality in the Tianjin Wetland Nature Reserve. The required research data included basic data, such as land use/cover classification images and a digital elevation model (DEM) every 5 years from 2000 to 2020, as well as the input data required for the InVEST model to evaluate various ecosystem service modules (Table 1). All data had a unified spatial projection and a unified 30 m spatial resolution.
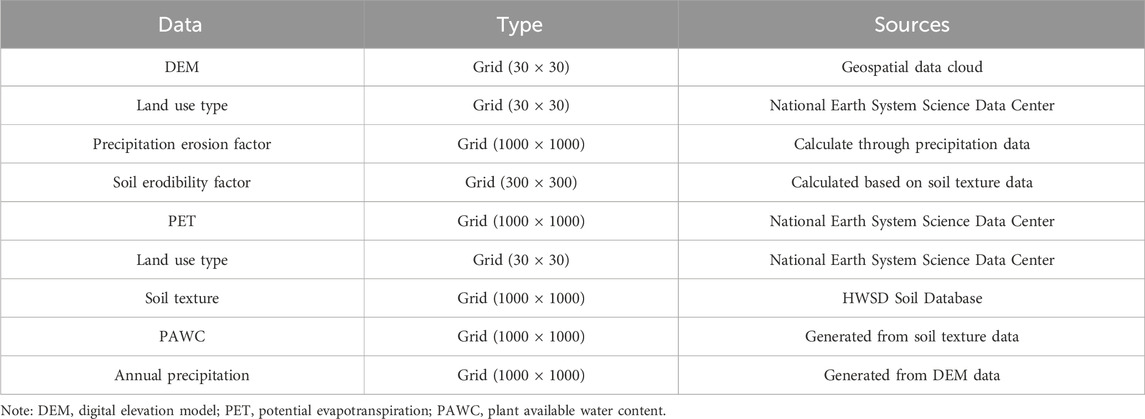
Table 1. Research data sources.
2.3 Methodology
2.3.1 InVEST model
The Integrated Valuation of Ecosystem Services and Trade (InVEST) model was jointly designed and developed by Stanford University, the World Wildlife Fund, and the Nature Conservancy to quantitatively assess ecosystem services. The model adopts the production function and empirical modeling methods to quantify the impact of land use and water body changes on the output value of ecosystem services. The evaluation results are visualized in the form of spatial distribution maps, which helps researchers quickly and accurately understand the changing characteristics of ecosystem services. Based on meteorological data, land use data, and other data, this study selected the indicators—soil conservation, water production services, carbon storage, and habitat quality—from the InVEST model to evaluate the ecosystem service value of four wetland nature reserves in the Tianjin Ancient Coast area, Beidagang, Tuanbo, and Dahuangbao.
(1) Soil Conservation Service Module
The soil conservation function of ecosystems in the InVEST model is represented by soil conservation, which is defined in two parts: erosion reduction and sediment retention. Erosion reduction refers to the potential erosion reduction of different land use methods and is expressed as the difference between the potential erosion and actual erosion. Sediment interception capacity is the retention of sediment by a certain land use method and is expressed as the product of sediment volume and sediment retention efficiency. Based on the Soil Loss Equation (USLE), this module considers the ability of the plot to intercept upstream sediments, which leads to more scientific calculation results (Gong et al., 2019). The formulas are as follows (Equations 1–4):
where SEDRETx is the soil conservation amount of the x grid; RKLSx is the potential soil erosion amount of the x grid (t); USLEx and USLEy represent the actual erosion amount (t) after considering management and engineering measures for the x grid and its uphill y grid, respectively; SEDRx is the sediment retention capacity (t) after considering management and engineering measures for the x-grid; Rx is the precipitation erosion factor of the x grid; Kx is the soil erodibility factor of the x grid; LSx is the slope length factor of the x grid; Cx is the vegetation cover management factor for the x grid; Px is the soil and water conservation engineering measurement factor for the x grid; and SEx is the sediment retention efficiency of the x-grid.
The precipitation erosion factor (R) is the main external force of hydraulic erosion and reflects the potential ability of rainfall to cause soil erosion. This can be obtained using various calculation methods based on precipitation data. This article selects the empirical formula for precipitation erosivity proposed by Wischmeier (Wischmeier and Smith, 1965), and the specific calculation is as follows (Equation 5):
where P is the annual average precipitation (mm), and Pi is the average monthly precipitation (mm). The unit of R is 100 ft t·in/(ac·h·a), which needs to be multiplied by a coefficient of 17.02 to convert the unit to the international unit MJ·mm/(ha·h·hr).
The soil erodibility factor (K) characterizes the difficulty of hydraulic separation and transport of soil particles and can reflect the sensitivity of the soil itself to erosion. Commonly used calculation methods include the Nomo corrosion resistance equation proposed by Wischmeier and the EPIC model equation established by Williams. This study used Williams' model formula (Singh and Jain, 2025), and the specific formula is as follows (Equations 6, 7):
where SAN is the soil sand content (%); SIL is the soil silt content (%); CLA is the soil clay content (%); and C is the soil organic carbon content (%). The unit K reflects t·ha·h/(ha·MJ·mm) from the American system, and it needs to be divided by a coefficient of 7.59 to convert it to the international unit t·ha·hr/(MJ·ha·mm).
(2) Water Production Service Module
The water production calculation module in the InVEST model can not only study the impact of land use/vegetation cover changes on surface water production but also evaluate the relative contribution of various watersheds in the study area to water production. It primarily utilizes the Budyko water heat coupling equilibrium assumption (1974) and annual precipitation data. Based on the principle of water balance, the formula for calculating water production ((Yxj)) within each grid unit in the study area is as follows (Equation 8):
where AETxj is the actual evapotranspiration of land use type j in grid unit x (mm), and Px is the precipitation amount (mm) of grid unit x.
The variables involved in (Equations 11–13) are defined as follows: PETx is the potential evapotranspiration of grid unit x (mm); ω is a non-physical parameter of natural climate soil characteristics, dimensionless; Z is the seasonal precipitation distribution and precipitation depth parameter, which is an empirical constant that characterizes precipitation characteristics. In regions dominated by precipitation in winter, Z approaches 10, whereas in regions with a uniform precipitation distribution or dominated by precipitation in summer, Z approaches 0. In addition, AWCx is the effective soil moisture content of the land use type on grid unit x, which is the amount of water provided by the soil for plant growth (mm); maxlayer_depth is the maximum burial depth of soil roots (mm); Root_depth is the depth of the plant root system (mm); PAWC is the plant available water content.
In Equation 12, Kc is the plant evapotranspiration coefficient of land use type lx on grid unit x, and ET0x is the reference crop evapotranspiration (mm) on grid cell x.
In Equation 13, Ssan represents soil sand content (%); Ssil is soil silt content (%); Scla is soil clay content (%); and Sorg is the soil organic carbon content (%).
(3) Carbon Storage Module
Carbon storage refers to the total amount of carbon stored by terrestrial ecosystems, as well as the natural processes by which ecosystems (including soil and vegetation) fix carbon. The InVEST carbon storage module divides carbon storage into four parts: aboveground biochar (carbon in living plants on the ground), underground biochar (carbon in the roots of living plants), soil carbon (organic carbon in organic and mineral soils), and dead organic carbon (carbon in the litter, standing, or inverted wilted plants). Based on the land use data, the area of each land use type was multiplied by the average carbon density and summed to obtain the total carbon storage capacity of the study area. The calculation formulas are as follows (Equations 14, 15):
where Cabove represents the carbon density of above ground organisms, Cbelow is the underground biological carbon density, Csoil is the soil carbon density, Cdead is the carbon density of dead organic matter, Ctotal is the total carbon storage, Ak is the area of land use type k, and n is the total number of land use types.
(4) Habitat Quality Module
Habitat quality is an important indicator for evaluating whether an ecosystem can provide a suitable environment and sustainable development for biological reproduction and population survival; it can reflect the biodiversity status of the region to some extent. This study used the habitat quality module in the InVEST model to calculate and evaluate the habitat quality of the study area and implement a visual analysis. This module includes four functions: the relative impact of each threat factor, the relative sensitivity of each type of land use to the threat factor, the distance between the threat source and land use, and the degree to which land use is legally protected. The module operates based on raster data and first calculates the degree of habitat degradation. The formulas are as follows (Equations 16–18):
where irxy represents the impact of the threat source r’s habitat in grid cell x on grid y; dxy is the linear distance between grid cells x and y; dr max is the maximum impact distance of threat r; Dxj is the habitat degradation index; R is the number of threat factors; ωr is the weight of the threat factor r; Yr is the grid number of threat factors; ry is the value of the threat factor on the grid; and βx is the degree of legal protection (0 for areas protected by law and one for other areas). The larger the calculation result of the habitat degradation degree, the higher the degree of threat posed by threat factors to the habitat and the more susceptible the habitat is to the influence of threat factors causing degradation.
Based on the degree of habitat degradation Dxj, the formula for evaluating habitat quality is as follows (Equation 19):
where Qxj is the habitat quality index of grid unit x in land use type j, Hj is the habitat suitability of land use type j, K is a semi-saturation constant (usually 1/2 of the maximum value of habitat degradation), and Z is the scaling factor (usually set to 2.5) (Feng et al., 2018). Qxj ranges from 0 to 1, where one indicates the highest habitat quality, which is beneficial for maintaining biodiversity, and 0 indicates the lowest habitat quality.
2.3.2 Ecosystem services trade-off degree model
The ecosystem services trade-off degree (ESTD) method is based on linear data fitting that reflects the interrelationships between ecosystem services. The formulas are as follows (Equations 20, 21):
where ESia and ESib are the values of the ith ecosystem service at times a and b, respectively; ESCIi is the ith ecosystem services change index (ESCD); ESCIj is the change index of the jth ecosystem service; and ESTDij represents the degree of trade-off and synergy between the ith and jth ecosystem services. A negative ESTD indicates a tradeoff relationship between the ith and jth ecosystem services, whereas a positive ESTD indicates a synergistic relationship between the two. The absolute ESTD value reflects the level of trade-off/synergy.
3 Results
3.1 Analysis of the spatiotemporal evolution of ecosystem services
To explore the temporal changes and spatial distribution of ecosystem service functions in multiple wetland nature reserves in Tianjin Binhai, this section uses the above data to form quantitative data on four typical ecosystem service functions: soil conservation services, water production services, carbon storage services, and habitat quality services from 2000 to 2020.
3.1.1 Spatiotemporal evolution of soil conservation services
Soil conservation services assess the ability of ecosystems to control soil erosion by calculating and quantifying the amount of soil retained due to natural vegetation, land management, and land use types. Figure 2 shows the spatial distribution of soil retention in the four reserves in 2000, 2010, and 2020. I represents Tianjin Dahuangbao Wetland Nature Reserve, II represents Tianjin Ancient Coast and Wetland National Nature Reserve, III represents Tianjin Tuanbo Bird Nature Reserve, and IV represents Tianjin Beidagang Wetland Nature Reserve.
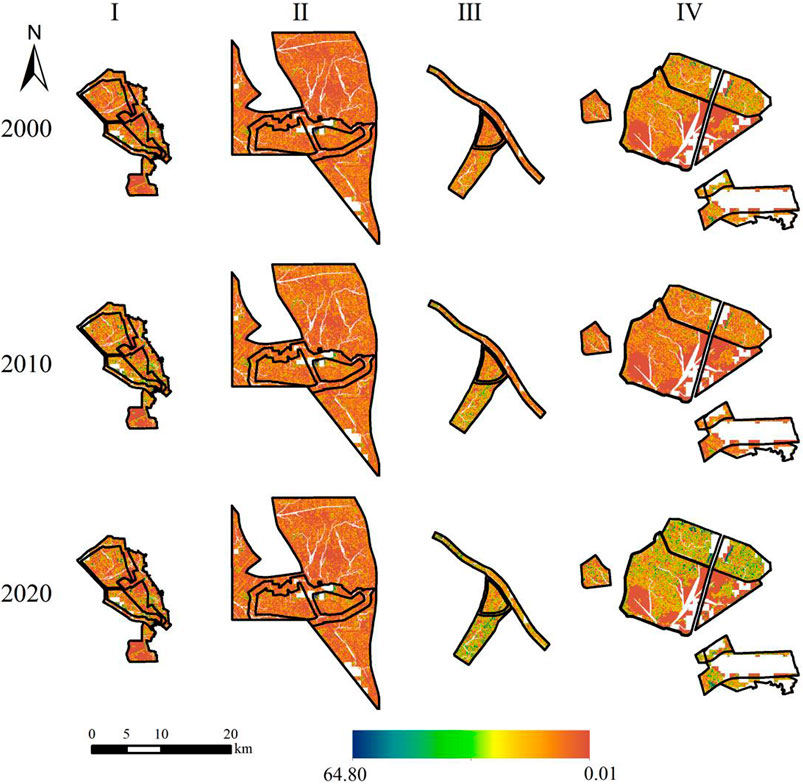
Figure 2. Spatial changes in soil retention in four protected areas from 2000 to 2020.
As shown in Figure 2, soil retention in the four nature reserves changed to varying degrees from 2000 to 2020. The highest soil retention exhibited significant interannual variation, showing an initial increase followed by a decline. Specifically, the highest soil retention increased from 43.4 t/hm2 in 2000 to 64.80 t/hm2 in 2010, representing a 49.31% increase. However, it then decreased to 56.91 t/hm2 in 2020, reflecting a 12.17% decline compared to 2010, but still 31.08% higher than the level in 2000. Adding these percentage changes provides a clearer understanding of the magnitude of variation over time, making the temporal trends more intuitive for readers. From the perspective of spatial distribution, the soil retention of the four nature reserves was generally dominated by low values and low average values, and the high-value areas were unevenly distributed in the form of dense patches. The retention capacities of the waterside areas of the Beidagang Wetland Reserve and Tuanbo Bird Nature Reserve were the most significant, and the retention capacities of the land areas were similar. Among them, soil retention in the Dahuangbao Wetland Nature Reserve and Tuanbo Bird Nature Reserve was relatively high. From the perspective of the different functional zones (Table 2), the average soil retention in the core area was the highest, and it increased steadily from 2000 to 2015 and decreased slightly in 2020. Soil retention in the buffer and experimental zones was lower than that in the core zone, which was related to the land use type and control method of the region.
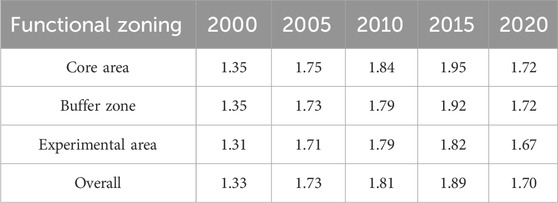
Table 2. Spatiotemporal evolution of soil conservation services from 2000 to 2020. Unit: t/hm2.
3.1.2 Spatiotemporal evolution of water production services
The water production service calculates the amount of available water generated in each area, thus reflecting the amount of water resources produced by each grid unit. The spatial distribution is shown in Figure 3. In general, the water production distribution of each reserve showed obvious spatial heterogeneity, and the differences in water production gradually expanded over time. From the perspective of spatial distribution, the spatial distribution of water production in the Tianjin Beidagang Wetland Nature Reserve and Tianjin Tuanbo Bird Nature Reserve was relatively stable, with a small change range, and the overall water production characteristics were relatively uniform. In contrast, the Dahuangbao Wetland and Ancient Coast and Wetland National Nature Reserve showed large spatial changes, especially in 2010, when the high water production areas of these two reserves increased significantly and the spatial heterogeneity was enhanced. This shows that the water production capacity of different wetlands was affected by the geographical location, wetland characteristics, and climate change. From the experimental results, the average water production of the four reserves reached the highest value in 2010, which was 123.99 m3. From the perspective of functional zoning (Table 3), unlike soil conservation services, water production in the buffer and experimental zones was generally greater than that in the core zone and fluctuated and increased between 2000 and 2020. This is because the water area accounts for a large proportion of the land use structure in the core zone, and the model does not calculate water production in the water area.
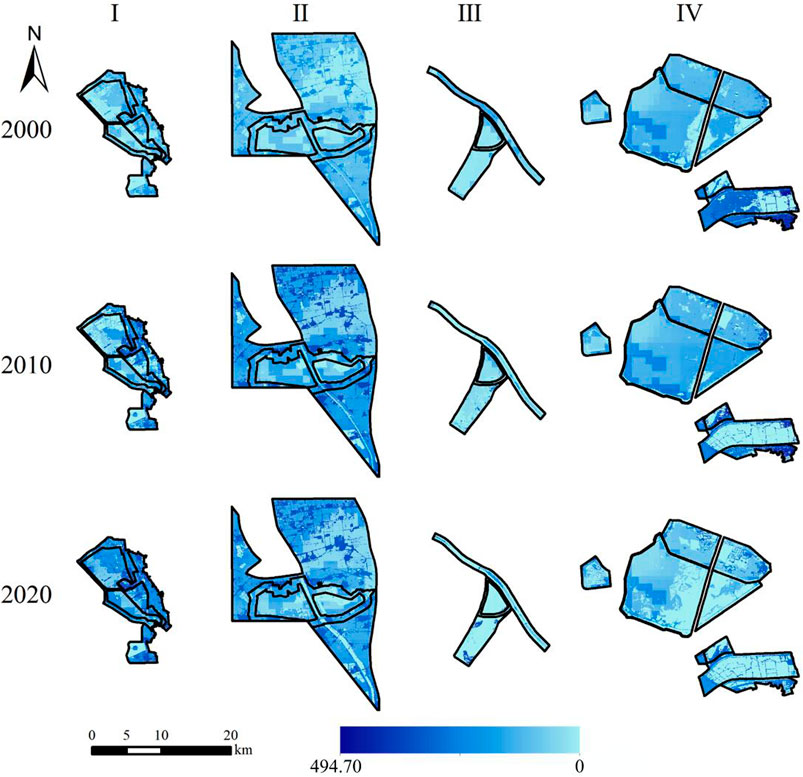
Figure 3. Spatial changes in water yield in the four protected areas from 2000 to 2020.
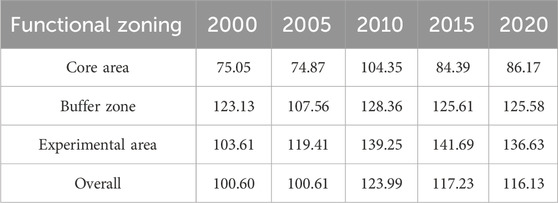
Table 3. Spatiotemporal evolution of water production services from 2000 to 2020 Unit: m3.
3.1.3 Spatiotemporal evolution of carbon storage services
Carbon storage services calculate the amount of carbon stored in ecosystems, especially carbon captured and stored by natural processes, such as plants, soils, and water bodies. As shown in Figure 4, the spatial distribution patterns of carbon storage in the four protected areas in Tianjin showed significant spatial heterogeneity. The highest carbon storage density in the four protected areas was 20 t/hm2, and the lowest was 0.75 t/hm2. Specifically, the carbon storage density of the Tianjin Dahuangbao Wetland Nature Reserve was concentrated in the lower range in 2000 and 2010. By 2020, the carbon storage density of the reserve had increased significantly, particularly in the core and buffer zones (Table 4). These changes were particularly evident. Carbon storage in the Tianjin Tuanbo Bird Nature Reserve and Tianjin Beidagang Wetland Nature Reserve showed a downward trend, and low-value areas expanded. The Tianjin Tuanbo Bird Nature Reserve was completely covered by low-value areas in 2020 with an average of 2.1 t/hm2. From the perspective of different functional zones, the carbon storage in the core area is generally higher than that in the buffer zone of the nuclear experimental area. However, mean carbon storage in the core area exhibited a fluctuating downward trend and was relatively unstable. From 2015 to 2020, carbon storage in the core and buffer zones increased, whereas that in the experimental area continued to decline, indicating that human control had a positive effect on the carbon storage function of the ecosystem.
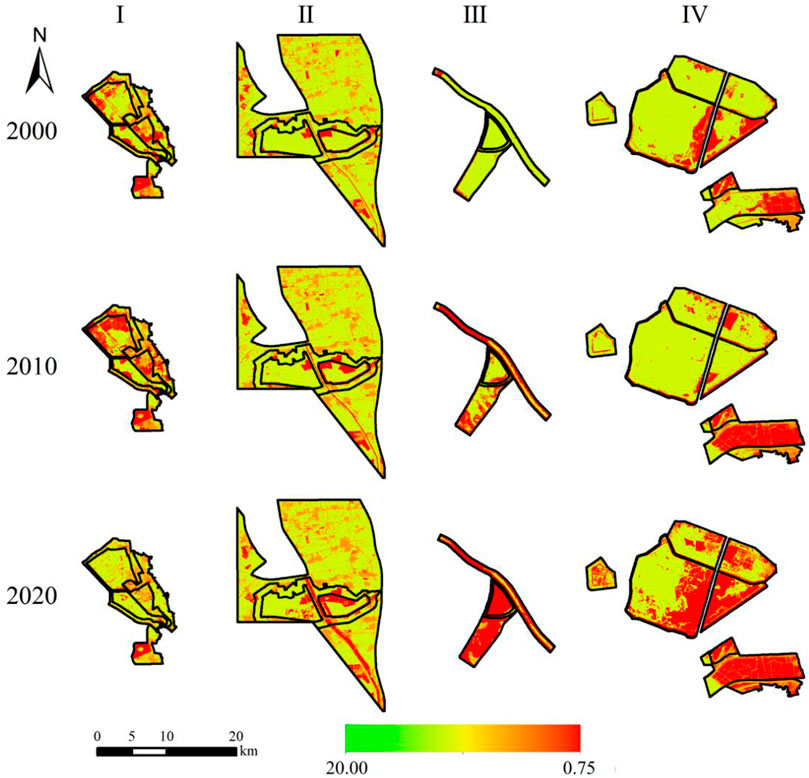
Figure 4. Spatial changes in carbon storage in the four protected areas from 2000 to 2020.
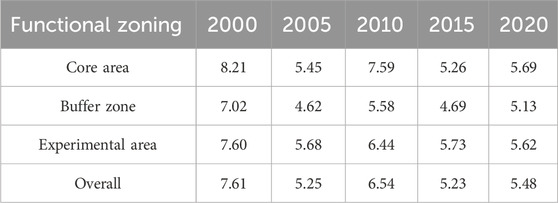
Table 4. Spatiotemporal evolution of carbon storage services from 2000 to 2020 Unit: t/hm2.
3.1.4 Spatial and temporal evolution of habitat quality services
Habitat quality services assess the quality and suitability of ecosystems and habitats, with a focus on whether a habitat can support the survival, reproduction, and migration of species. According to the data distribution characteristics of the habitat quality index in the study area, the results were divided into four levels using the equal interval method: low-quality area (0, 0.2), medium-quality area (0.4, 0.6), relatively high-quality area (0.6, 0.8), and high-quality area (0.8, 1). The habitat quality index in this study area does not involve the (0.2, 0.4) interval. This classification is illustrated in Figure 5.
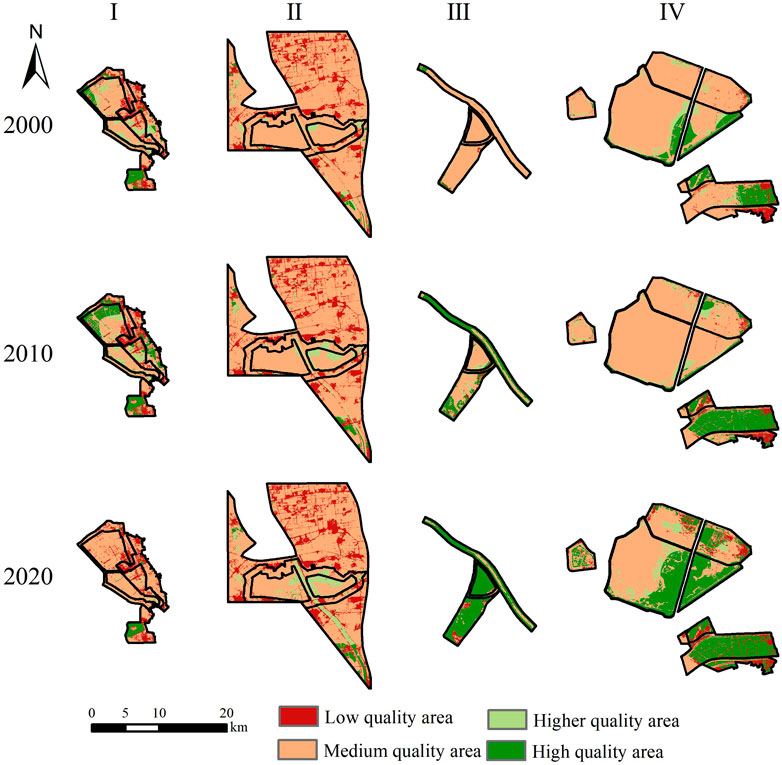
Figure 5. Spatial changes in habitat quality in the four protected areas from 2000 to 2020.
According to the spatial distribution characteristics, the habitat quality of each nature reserve shows significant spatial differences and agglomeration. In general, the high-quality and relatively high-quality areas increased significantly from 2000 to 2020, whereas the low-quality areas gradually decreased, indicating that the quality of wetland habitats has shown a trend of gradual improvement over the past 20 years. Among them, the habitat quality of the Tianjin Dahuangbao Wetland Nature Reserve showed an upward trend by 2010 but declined from 2010 to 2020. The highest growth in high-quality areas occurred in the Tianjin Tuanbo Bird Nature Reserve and the Tianjin Beidagang Wetland Nature Reserve. In particular, the high-quality area of the Tianjin Tuanbo Bird Nature Reserve covered the entire reserve area, which is related to the different main protection objectives of the different reserves. From the perspective of functional zoning (Table 5), the areas of medium quality and above in the buffer and core zones accounted for the largest proportion, showing a fluctuating upward trend, among which the increase from 2010 to 2020 was relatively large. As of 2020, the area of medium quality and above in the core zone was 35.99%.
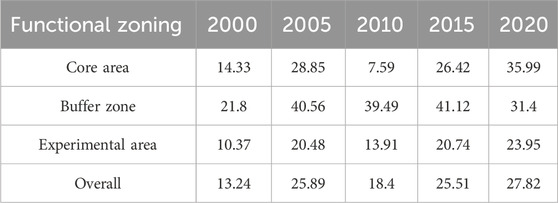
Table 5. Proportion of areas with medium or above habitat quality services from 2000 to 2020 Unit: %.
3.1.5 Comprehensive spatiotemporal evolution of ecosystem services
Based on the evaluation results of the above four key ecosystem services (i.e., soil conservation, water production, carbon storage, and habitat quality), maximum and minimum normalization was performed. The same weights were used to construct a comprehensive ecosystem service index to quantitatively evaluate the ecosystem service capacity of different regions under a unified framework. The calculation results are shown in Figure 6.
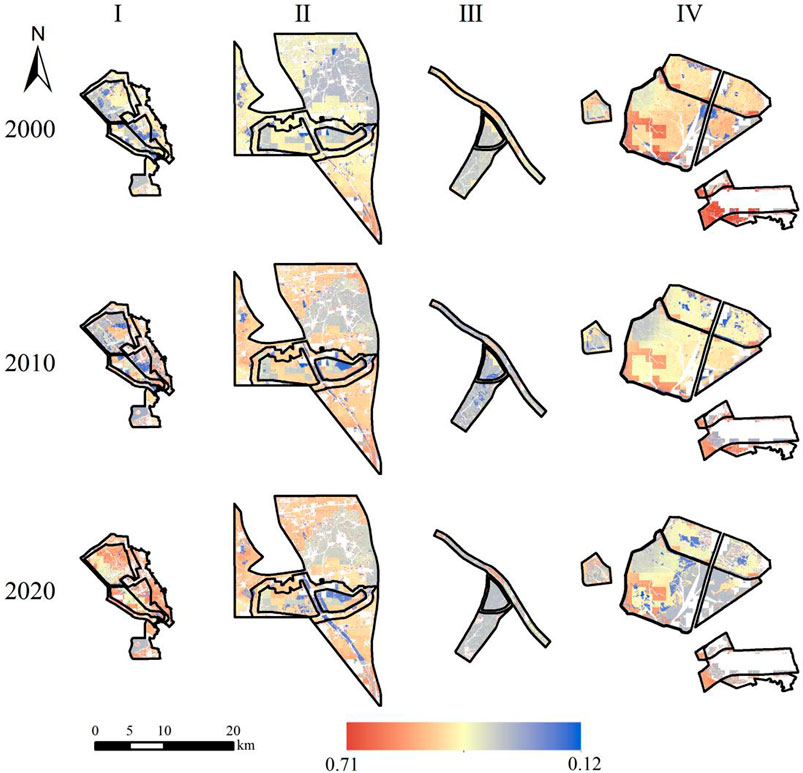
Figure 6. Spatial changes in comprehensive ecosystem services in four protected areas from 2000 to 2020.
According to the spatial distribution, the four reserves showed significant spatial differentiation, and the positions of the regional high- and low-value areas were relatively stable. Among them, the Tianjin Dahuangbao Wetland Nature Reserve and Tianjin Ancient Coast National Wetland Nature Reserve showed a significant upward trend during the study period; Tianjin Beidagang Wetland Nature Reserve showed a downward trend, as shown by the reduction of high-value areas and decrease in the highest value; and Tianjin Tuanbo Bird Nature Reserve showed a relatively small change trend. According to functional zoning (Table 6), the mean values of the three functional zoning areas were relatively small, the interannual changes were small, and the regional mean was stable.
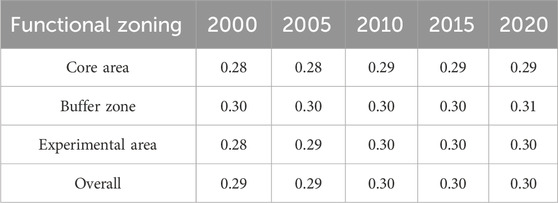
Table 6. Spatiotemporal evolution of comprehensive ecosystem services from 2000 to 2020.
3.2 Analysis of trade-offs and synergies in ecosystem services
Based on the quantitative analysis of four ecosystem functions, namely, soil conservation, water production services, carbon storage, and habitat quality, the ESTD model was used to explore the trade-offs and synergies among different ecosystem service functions and their temporal trends. Moreover, it further explored the interdependence and impacts among different ecological processes to achieve a balance between ecological and socioeconomic goals.
Overall, the interactions among the four ecosystem services showed a complex trade-off synergy, and the mutual influences among ecosystem services changed significantly over time. As shown in Figure 7, which illustrates the trade-offs and synergies among water yield (WY), habitat quality (HQ), carbon storage (CS), and soil conservation (SC) from 2000 to 2020, the relationship between these services varied considerably over the 2 decades. Among them, soil conservation (SC) and water yield (WY) showed weak synergy, although this synergy increased significantly from 0.0455 in 2000–2010 to 0.12 in 2010–2020. This indicated that soil conservation measures can promote the effective use of water resources by reducing soil erosion and improving water storage capacity. The relationship between soil conservation (SC) and habitat quality (HQ) exhibited a more pronounced synergy, especially during 2010–2020, when the synergy increased to 2.24. Meanwhile, the relationship between soil conservation (SC) and carbon storage (CS) remained relatively weak. Although the goodness of fit for this relationship increased to 2.13 from 2010 to 2020, it indicates that the direct promotion of carbon fixation by soil conservation is influenced by other ecological factors, such as vegetation type and soil organic carbon content.
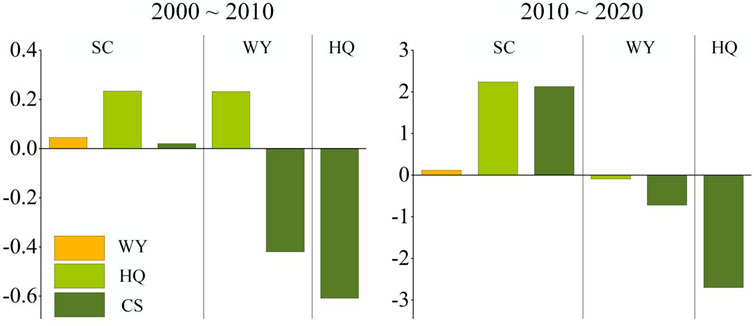
Figure 7. Trade-offs and synergies of ecosystem services from 2000 to 2020.
Because of the water-rich nature of wetland ecosystems, the relationship between water production services and habitat quality services is particularly important. In 2000–2010, the two showed synergy (0.2326), indicating positive feedback between water production and habitat quality. However, in 2010–2020, the synergy between water production services and habitat quality services showed a negative change (−0.09), reflecting that the positive effect of water resources on habitat quality had weakened and even led to a decline in habitat quality in some areas. The relationship between water production and carbon storage was always negative, especially during the period 2010–2020, when the harmony further decreased to −0.72. This finding indicated that the excessive use of water resources may have a negative impact on carbon storage. The negative relationship between habitat quality and carbon storage was significant in both 2000–2010 and 2010–2020, especially in 2010–2020, when the trade-off reached −2.7. This indicated that although habitat quality improved in some regions, it had a negative impact on carbon storage.
4 Discussion
4.1 Impact of land use change on ecosystem services
In this study, we analyzed the spatiotemporal variation characteristics of four ecosystem services, namely, soil conservation, water production, habitat quality, and carbon storage, and their trade-offs and synergies. As shown in Section 3.1., the ecological service functions of the four reserves had large spatial differences and obvious preferences for different ecosystem service functions. For example, the water production of the Tianjin Dahuangbao Wetland Nature Reserve was the highest on average, whereas the habitat quality of the Tianjin Tuanbo Bird Nature Reserve was the highest. Among the many factors that affect the regional ecosystem service functions, the change in land use type is undoubtedly an important and direct factor affecting the ecosystem service functions. Different land use types (such as farmland, forest, wetland, and urban land) have different ecological service characteristics, and their transformation greatly affects the overall function and service capacity of regional ecosystems.
Figure 8 shows the transformation of land use types in four protected areas. Overall, frequent conversion between cultivated land and water occurred. The Tianjin Dahuangbao Wetland Nature Reserve has undergone a large-scale transformation of various land use types, especially water areas, to cultivated land from 2015 to 2020. At this time, the carbon storage in the region increased from 5.45 t/hm2 in 2015 to 7.73 t/hm2. The Tianjin Ancient Coast and Wetland National Nature Reserve underwent more transformations to impervious surfaces, water areas, and cultivated land from 2010 to 2020. The water yield in the region exhibited a downward trend during this period, and the regional mean value decreased from 173.96 t/hm2 to 156.23 t/hm2. Whether the transformation of land use types will indeed have a significant impact on ecosystem service functions because of other factors cannot be ruled out. Therefore, reasonable land planning and utilization and ecological restoration measures are particularly important.
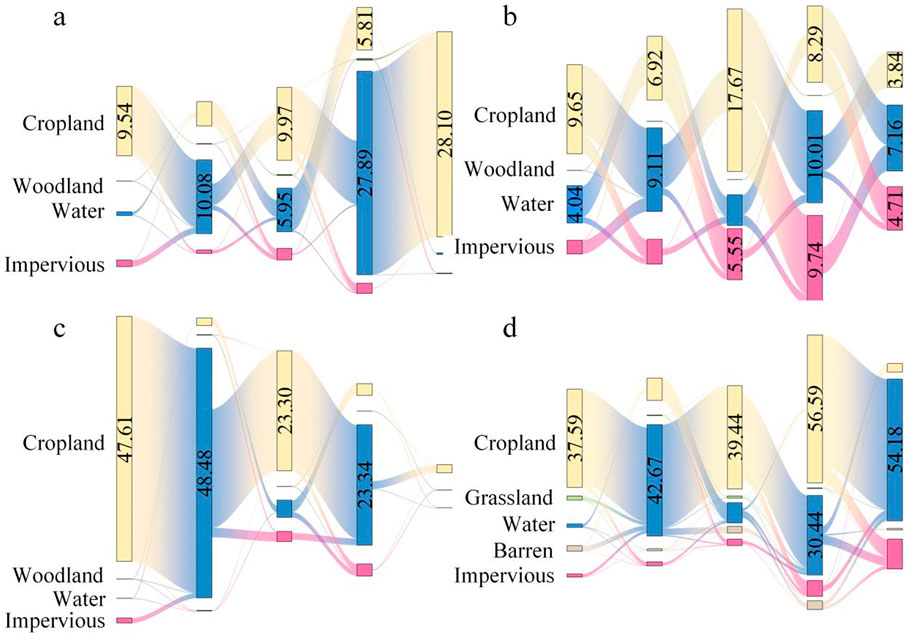
Figure 8. Land use conversion in the four protected areas. (a) Tianjin Dahuangbao Wetland Nature Reserve, (b) Tianjin Ancient Coast and Wetland National Nature Reserve, (c) Tianjin Tuanbo Bird Nature Reserve, and (d) Tianjin Beidagang Wetland Nature Reserve.
4.2 Changes in the quality of ecosystem services under human control
Wetland nature reserves refer to special protection areas established to protect wetland ecosystems and their species and maintain wetland ecological functions. Different functional areas within wetlands have different management and control policies. According to the “Regulations on Nature Reserves” [26], no unit or individual is allowed to enter the core area. The buffer zone of a certain area can be demarcated outside the core area, and only scientific research and observation activities are allowed. The buffer zone is designated as an experimental area, where scientific experiments, teaching internships, visits and inspections, tourism, and domestication and breeding of rare and endangered wild animals and plants are permitted.
Different management methods inevitably impact the ecosystem service functions in a region. The results showed that the ecosystem services in the core and buffer zones were generally higher than those in the experimental area. Especially for habitat quality services, the core area with medium or higher quality accounted for 36% of the regional area. This discrepancy is mainly due to differences in land use, ecological protection measures, and human activity management. The core area is more strictly protected and managed, allowing for active restoration efforts that promote ecological recovery. For example, the Dahuangbao Wetland Nature Reserve Core Area Restoration Project in the eastern section has significantly reduced human disturbances and increased species richness through targeted restoration measures.In contrast, the experimental area is in a relatively open management environment, includes more diverse land use types, and experiences greater pressure from human activity. For example, illegal human encroachment in the Tianjin Ancient Coast and Wetland National Nature Reserve has significantly impacted the natural ecosystem. In 2017, the core and buffer zones of this reserve experienced a total encroachment area of 54.67 km2 due to unauthorized farmland expansion, village construction, industrial facilities, and other production and living activities. These contrasting examples highlight the critical importance of integrating effective conservation strategies in core areas while addressing the challenges of human interference in experimental zones to ensure long-term ecological sustainability.
The quality of ecosystem services is not only closely related to the characteristics of the natural environment but also associated with the strictness of human control measures. In the actual process of ecological management and protection, ecological protection and reasonable land use planning must be strengthened to effectively improve regional ecosystem service functions and lay a foundation for regional sustainable development.
5 Conclusion
Based on the InVEST model, this study evaluated the four ecosystem services water resource supply, soil conservation, carbon fixation and oxygen release, and habitat quality in four wetland nature reserves in Tianjin from 2000 to 2020. Moreover, their temporal and spatial evolution was analyzed, and the ETSM was applied to study the relationship between ecosystem services in different periods. The main conclusions are as follows.
1.From 2000 to 2020, the four ecosystem service functions of Tianjin wetland nature reserves showed obvious differences. The habitat quality function continued to improve, and in 2020, areas with medium or higher quality accounted for 27.82% of the region. Soil conservation continued to decline slowly, while water production and carbon storage fluctuated significantly. Water production began to decline in 2010, whereas carbon storage began to increase in 2015.
2.The ecosystem service functions of the three functional zones in the reserves differed significantly. The ecosystem service functions of the core and buffer zones were generally higher than those of the experimental zones. Carbon storage in the core zone was 1 t/hm2 higher on average than that in the experimental zone, and the proportion of areas with medium or higher habitat quality was approximately 8% higher.
3.The relationship between ecosystem services showed complex trade-offs and synergies, although this tendency was basically stable, and the correlation strengthened during the study period. The soil conservation function showed a high degree of synergy with the habitat quality and carbon storage functions, and the carbon storage function showed a high degree of trade-offs with the habitat quality and water production functions.
The factors that affected the evolution of the spatiotemporal pattern of ecosystem services in wetland nature reserves and the trade-offs and synergies were mainly the transformation of land use types and changes in conditions related to specific ecosystem services. At the same time, human control can also positively affect ecosystems.
Data availability statement
The original contributions presented in the study are included in the article/supplementary material, further inquiries can be directed to the corresponding authors.
Author contributions
AY: Writing – original draft, Data curation, Methodology. XG: Software, Writing – original draft, Data curation. HG: Writing – review and editing, Validation, Software. XJ: Methodology, Writing – review and editing, Software. YZ: Supervision, Validation, Writing – review and editing. WW: Supervision, Writing – review and editing, Validation.
Funding
The author(s) declare that financial support was received for the research and/or publication of this article. This research was funded by Tianjin Research Innovation Project for Postgraduate Students, grant number 2022SKYZ277.
Conflict of interest
The authors declare that the research was conducted in the absence of any commercial or financial relationships that could be construed as a potential conflict of interest.
Generative AI statement
The author(s) declare that no Generative AI was used in the creation of this manuscript.
Publisher’s note
All claims expressed in this article are solely those of the authors and do not necessarily represent those of their affiliated organizations, or those of the publisher, the editors and the reviewers. Any product that may be evaluated in this article, or claim that may be made by its manufacturer, is not guaranteed or endorsed by the publisher.
References
An, J., Yang, Y., Yuan, X., Su, Q., and An, Q. (2025). patialandtemporalvariation,spatialagglomerationandtrade-offsand synergiesofecosystemservicesinnorthernShaanxi. Res. WaterConservation 32, 316–327+335. doi:10.13869/j.cnki.rswc.2025.01.024
Assessment, M. E. (2005). Ecosystems and human well-being: wetlands and water[M]. World resources institute.
Bhowmik, S. (2022). “Ecological and economic importance of wetlands and their vulnerability: a review,” in Research anthology on Ecosystem conservation and preserving biodiversity, 11–27.
Choudhary, A., Deval, K., and Joshi, P. K. (2021). Study of habitat quality assessment using geospatial techniques in Keoladeo National Park, India. Environ. Sci. Pollut. Res. 28, 14105–14114. doi:10.1007/s11356-020-11666-3
Costanza, R., d’Arge, R., De Groot, R., Farber, S., Grasso, M., Hannon, B., et al. (1997). The value of the world’s ecosystem services and natural capital. nature 387, 253–15. doi:10.1016/s0921-8009(98)00020-2
Decision on amending the Administrative Measures for Tianjin Ancient Coast and Wetland National Nature Reserve (2004). Tianjin Political News, 13–14.
Deng, P., and Chen, G. (2003). Discussion on wetland value and related issues[J]. Wetland Science, 2003, (1): 136–140. doi:10.13248/j.cnki.wetlandsci.2003.02.010
Feng, S., Sun, R., and Chen, L. (2018). Study on the spatiotemporal evolution of habitat quality in Beijing based on changes in land use pattern. Acta Ecol. Sin. 38(12): 4167–4179. doi:10.5846/stxb201801310258
Gong, J., Xie, Y., Cao, E., Huang, Q., and Li, H. (2019). Integration of InVEST-habitat quality model with landscape pattern indexes to assess mountain plant biodiversity change: a case study of Bailongjiang watershed in Gansu Province. J. Geogr. Sci. 29, 1193–1210. doi:10.1007/s11442-019-1653-7
Jiang, S. (2021). Research on the calculation and spatiotemporal evolution of gross ecosystem product in Shaanxi Province[D]. Northwest Agriculture and Forestry University. doi:10.27409/d.cnki.gxbnu.2021.000388
P. Kareiva, H. Tallis, T. H. Ricketts, G. C. Daily, and S. Polasky (2011). Natural capital: theory and practice of mapping ecosystem services (Oxford University Press). doi:10.1093/acprof:oso/9780199588992.001.0001
Li, Y., Xie, L., Mo, X., Zhou, S., Zhang, Z., and Zhang, M. (2024). Wetland ecosystem gross value (GEP) accounting and spatial and temporal dynamic analysis in Jiangxi Province. J. Ecol. Rural Environ. 40, 738–748. doi:10.19741/j.issn.1673-4831.2023.0996
Liu, Q. (2019). Changes in the legal system of nature reserves and scenic spots in the 40 years of reform and opening up., in new developments of environmental and resource law in the new era: research on the legal issues of nature reserves: proceedings of the 2019 annual conference of the environmental and resources law research society of the China law society. Environ. Resour. Law Res. Soc. 20. doi:10.26914/c.cnkihy.2019.096565
Liu, X., Wang, Y., Liu, Q., and Li, Z. (2023). Ecosystem service trade-offs and synergies in southwest China based on urbanization gradient. Acta Ecol. Sin. 43, 9416–9429. doi:10.20103/j.stxb.202210032804
Management Measures for Tianjin Ancient Coast and Wetland National Nature Reserve[J]. (2011). Gazette of Tianjin Municipal People’s Government, (09): 2–3.
Min, J., Liu, X., Xiao, Y., Li, H., Luo, X., Wang, R., et al. (2025). Spatiotemporal patterns and trade-offs of ecosystem services in the Yangtze River Delta[J]. Geol. Bull, 44(01): 136–149. doi:10.12097/gbc.2024.05.040
Nelson, E., Mendoza, G., Regetz, J., Polasky, S., Tallis, H., Cameron, D. R., et al. (2024). Modeling multiple ecosystem services, biodiversity conservation, commodity production, and tradeoffs at landscape scales.
Ouyang, X., He, Q., and Zhu, X. (2020). Simulating the impact of urban agglomeration land use change on ecosystem service value under multiple scenarios: a case study of Changsha-Zhuzhou-Xiangtan urban agglomeration[J]. Econ. Geogr. 40(01): 93–102. doi:10.15957/j.cnki.jjdl.2020.01.011
Rahimi, L., Malekmohammadi, B., and Yavari, A. R. (2020). Assessing and modeling the impacts of wetland land cover changes on water provision and habitat quality ecosystem services. Nat. Resour. Res. 29, 3701–3718. doi:10.1007/s11053-020-09667-7
Ramirez-Reyes, C., Brauman, K. A., Chaplin-Kramer, R., Galford, G. L., Adamo, S. B., Anderson, C. B., et al. (2019). Reimagining the potential of Earth observations for ecosystem service assessments. Sci. Total Environ. 665, 1053–1063. doi:10.1016/j.scitotenv.2019.02.150
Roy, P. S., Ramachandran, R. M., Paul, O., Thakur, P. K., Ravan, S., Behera, M. D., et al. (2022). Anthropogenic land use and land cover changes—a review on its environmental consequences and climate change. J. Indian Soc. Remote Sens. 50, 1615–1640. doi:10.1007/s12524-022-01569-w
Singh, P. K., and Jain, S. K. (2025). Soil erosion and sediment yield modeling[M]/handbook of climate change impacts on river basin management. CRC Press, 19–33.
Tianjin Wetland Protection Regulations (2023). “Tianjin wetland protection regulations,” in Tianjin daily, 007. doi:10.28789/n.cnki.ntjrb.2023.004278
Vymazal, J. (2022). The historical development of constructed wetlands for wastewater treatment. Land 11, 174. doi:10.3390/land11020174
Wei, Q., Xi, Z., Su, H., Miao, Y., and Cao, Y. (2021). Spa-tial differentiation of supporting service value of coastal wetland ecosystem in the Caofeidian District of Tangshan in Hebei Province. Sci. Geogr. Sin. 41, 890–899. doi:10.13249/j.cnki.sgs.2021.05.017
Wischmeier, W. H., and Smith, D. D. (1965). Predicting rainfall-erosion losses from cropland east of the Rocky Mountains: Guide for selection of practices for soil and water conservation[M]. Agric. Handb. 282.
Xue, C., Zhang, H., Wu, S., Chen, J., and Chen, X. (2022). Spatial-temporal evolution of ecosystem services and its potential drivers: a geospatial perspective from Bairin Left Banner, China. Ecol. Indic. 137, 108760. doi:10.1016/j.ecolind.2022.108760
Yang, X., Hai, X., and Yang, Y. (2023). Assessment of Zhangye Heihe wetland ecosystem service value based on meta analysis. J. Ecol. Rural Environ. 39, 60–68. doi:10.19741/j.issn.1673-4831.2022.0157
Zhang, L., Lei, J., He, R., and Zhou, P. (2024). Assessment of Hainan Island wetland ecosystem service value based on meta-analysis. J. Aquatic Ecol. 45, 70–77. doi:10.15928/j.1674-3075.202210050397
Zhang, N., and Liu, Z. (2024). Trade-offs/Synergies of ecosystem services in the xiaoxing’an mountains based on the InVEST model. Environ. Sci., 1–22. doi:10.13227/j.hjkx.202405314
Keywords: spatiotemporal evolution, ecosystem services, trade-off relationship, wetland conservation, InVEST model
Citation: Yue A, Guo X, Gong H, Ji X, Zhang Y and Wang W (2025) Spatiotemporal evolution and trade-offs among ecosystem services in Tianjin Wetland nature reserves based on the InVEST model. Front. Environ. Sci. 13:1616057. doi: 10.3389/fenvs.2025.1616057
Received: 22 April 2025; Accepted: 26 May 2025;
Published: 27 June 2025.
Edited by:
Di Yang, University of Florida, United StatesReviewed by:
Yu Li, Dalian University of Technology, ChinaHongyan Li, Jilin University, China
Fawen Li, Tianjin University, China
Copyright © 2025 Yue, Guo, Gong, Ji, Zhang and Wang. This is an open-access article distributed under the terms of the Creative Commons Attribution License (CC BY). The use, distribution or reproduction in other forums is permitted, provided the original author(s) and the copyright owner(s) are credited and that the original publication in this journal is cited, in accordance with accepted academic practice. No use, distribution or reproduction is permitted which does not comply with these terms.
*Correspondence: Yatao Zhang, enl0YW9hQDE2My5jb20=; Wanfeng Wang, d2FuZ3dhbmZlbmdAdGouZ292LmNu