 Gerzaín Avilés-Polanco1
 Luis Felipe Beltrán-Morales1*
 Laura Sour2
 Víctor Hernández-Trejo3
 Adan L. Martinez-Cruz4
 Alfredo Ortega-Rubio1
- 1Centro de Investigaciones Biológicas del Noroeste S.C. (CIBNOR), La Paz, Mexico
- 2Facultad de Economía y Negocios, Universidad Anáhuac México, Huixquilucan, Estado de México México. División de Ciencias Multidisciplinarias, Universidad Autónoma del Estado de Quintana Roo, Playa del Carmen, Quintana Roo, Mexico
- 3Departamento de Economía, Universidad Autónoma de Baja California Sur, La Paz, Mexico
- 4Department of Forest Economics, and Centre for Environmental and Resource Economics (CERE), Swedish University of Agricultural Sciences (SLU), Umeå, Sweden
This study explores the relationship between natural capital, environmental policies, and poverty alleviation, with a focus on the Yucatán Peninsula in Mexico. Utilizing analytical techniques such as the Synthetic Control Method, the research assesses the causal impact of natural capital loss—estimated at 14.29% between 2018 and 2022—on multidimensional poverty levels. Findings indicate that the decline in natural resources has contributed to a roughly 2% increase in poverty, preventing approximately 232,150 individuals from escaping impoverishment. The construction of infrastructure projects like the Mayan Train has significantly contributed to natural resource depletion. Despite ongoing social policies—including social programs and infrastructure investments—these efforts have been partially offset by ecological degradation, underscoring the importance of integrating ecological considerations into development strategies. The study emphasizes that conserving natural capital is vital for sustainable development and social wellbeing, advocating for policies that balance economic growth with ecological preservation. Incorporating ecological metrics, such as the natural capital index, into poverty assessments can enhance policy effectiveness. Overall, the findings underscore that environmental conservation is essential for effective poverty reduction, urging policymakers to adopt integrated approaches that prioritize ecological health alongside social and economic objectives for sustainable development.
1 Introduction
The eradication of poverty in all its forms is the first of the United Nations’ Sustainable Development Goals for 2030. Between 2018 and 2022, Mexico achieved a 5.6 percentage point reduction in poverty, which translates to 5,614,150 individuals gaining access to the necessary resources to meet their food and non-food needs, thereby avoiding social deprivation. This achievement is undoubtedly of utmost importance. To date, the central agencies responsible for measuring poverty have adopted a multidimensional approach, based on the pioneering work of Sen (1985), in which social deprivation variables play a significant role. Specifically in the case of Mexico, the National Council for the Evaluation of Social Development Policy (CONEVAL), responsible for measuring poverty, implemented this multidimensional approach in 2009. It defines the population living in poverty as those who lack the income necessary to satisfy their food and non-food needs and who experience at least one of the six social deprivations: 1) educational backwardness; 2) lack of health services; 3) lack of social security; 4) lack of quality and space in housing; 5) lack of basic housing services; and 6) lack of food (Hernández-Licona et al., 2014). According to this criterion, 36.3% of the Mexican population currently lives in poverty (CONEVAL 2022). However, this organization has not yet incorporated ecological indicators that represent the socio-ecological dimension of human wellbeing.
Recently, the National Commission for the Knowledge and Use of Biodiversity (CONABIO) has used biodiversity as a parameter to assess the condition of ecosystems. To this end, it has developed indicators that serve as proxies for biodiversity. These indicators are divided into the different dimensions that comprise natural capital, which is defined as the set of natural elements that support long-term evolutionary processes and, in turn, enable a flow of benefits derived from nature (CONABIO, 2022). The Natural Capital Index (NCI) represents the state and evolution of biodiversity in Mexico. The NCI is formulated as Quantity x Quality, where quantity is expressed in terms of the surface area of remaining natural areas, and quality refers to the ecological integrity within the ecosystem (CONABIO, 2022). The conservation of natural capital is necessary to achieve sustainable livelihoods; its loss entails a reduction in income, which is necessary to meet food and non-food needs, as well as the exercise of social rights.
The objective of this study is to evaluate the impact of the loss of natural capital on poverty. The analysis of the causal effect of natural capital loss on poverty is based on the theory of inclusive wealth,
To achieve the proposed objective, we aim to address the following research question: Did the loss of natural capital triggered by the construction of the Mayan train exacerbate poverty levels in the Yucatan Peninsula? The empirical strategy used involved the loss of a large area of remnant natural ecosystems and ecological integrity in the Yucatán Peninsula region between 2018 and 2022, in order to design a quasi-natural experiment to estimate the effect of the loss of natural capital on poverty. For this purpose, the Synthetic Control Method (SCM) was used, developed by Abadie and Gardeazabal (2003), Abadie et al. (2010), and Abadie (2021), which is distinguished by the construction of a synthetic control for the treated unit (Yucatán Peninsula region) that represents the counterfactual poverty outcome in that unit, that is, the poverty outcome that would have been obtained if the loss of natural capital had not occurred. The results of this analysis indicate that poverty in the Yucatán Peninsula could have been two percentage points lower than the level observed in 2022 (44.56%) in the absence of a 14.29% decline in natural capital. This suggests that the loss of natural capital mitigated the impact of the policies implemented to reduce poverty in the region.
2 Literature review
Recent studies have capitalized on the flexibility of SCM to design empirical strategies based on natural experiments, which allow for estimating response effects in units exposed and unexposed to a phenomenon over periods before and after the exposure, referred to as the treatment. The literature on socio-ecological impact assessment can be classified into two categories: the first includes studies that analyze the impact of public policy programs aimed at mitigating ecological impacts (Alix-Garcia et al., 2013; Sills et al., 2015; Jones, 2018; Rana and Sills, 2018; Roopsind et al., 2019; Fick et al., 2021). The second category includes those that evaluate the impact of governance policies and cash transfers on ecological quality (Ran et al., 2022; Rana and Miller, 2019).
Another part of the literature related to impact evaluation that has been managed by the SCM has been dedicated to estimating the causal effect of policies aimed at combating poverty through cash transfer programs and taxes (Osei and Lambon-Quayefio, 2021; Silva et al., 2021; Qin et al., 2022; Yang et al., 2022; Wen and Sun, 2023; Silva et al., 2023; Duan, 2024), increases in the minimum wage (Campos-Vázquez and Esquivel, 2022), economic growth in the food and tourism services industries (Neri and Soares, 2012; Cazzuffi et al., 2017), business subsidies and sustainable development mechanisms (Bundrick and Yuan, 2019; Mori-Clemet, 2019; Grover and Rao, 2020), farmer resettlement and the promotion of agriculture (Wang et al., 2018; Cheng et al., 2021; Duong et al., 2021; Peng et al., 2022), shale gas exploitation (Huang and Etienne, 2021), as well as photovoltaic infrastructure, terrestrial communication routes, and broadband (Inthakesone and Kim, 2016; Liu et al., 2021; Galperin et al., 2022; Zhang et al., 2023; He et al., 2023; Tian et al., 2024; Li et al., 2024), healthcare for the elderly and vulnerable (Lu et al., 2021; Li et al., 2023), economic sanctions (Ghomi 2020), and exposure to natural disasters (Salvucci and Santos, 2020; González et al., 2021). Table 1 presents a summary of the studies classified according to the method used, treatments, outcome variables, and impacts.
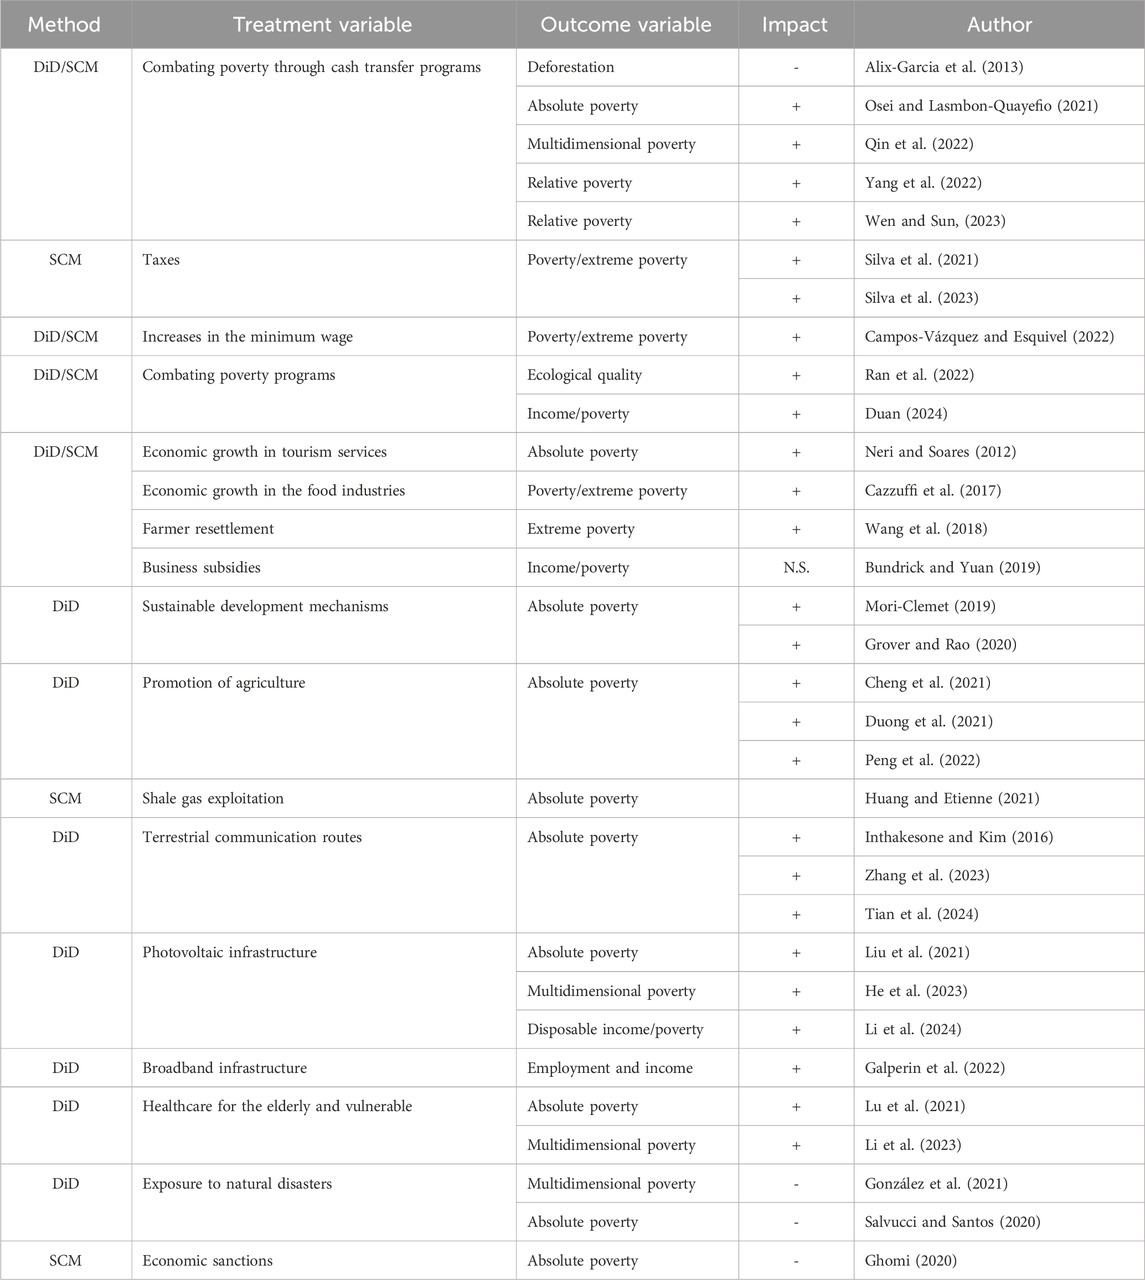
Table 1. Causal effect evaluation studies of poverty reduction programs.
Four studies stand out in the literature that evaluate the causal effects of poverty and the environment, two of which analyze the impact of poverty reduction policies on deforestation and ecological quality. The first study to address this causal relationship was conducted by Alix-Garcia et al. (2013), who employed the Difference-in-Differences (DiD) method to assess the impact of cash transfers on deforestation in Mexico. The authors employed a localized rural marginalization index and 30-m satellite images from 2000 to 2003. They found that the additional income derived from cash transfers increased the consumption of land-intensive goods, such as meat and milk, which, in turn, led to increased deforestation in neighboring areas. A second study, adopting a similar approach, was conducted by Ran et al. (2022), who used the DiD method to evaluate the causal effect of cash transfers on ecological quality, measured through vegetation cover in the Qinghai-Tibet province, China, between 2001 and 2019. The authors concluded that the localities benefiting from the cash transfer program successfully reduced their poverty levels and improved the ecological quality of their environment.
Two additional studies examined the causal effects of exogenous shocks, in the form of natural disasters, on poverty. The first was conducted by Salvucci and Santos (2020), who used the difference-in-differences (DiD) method to assess the impact of the 2015 floods in Mozambique on consumption and poverty levels. The authors reported that provinces adjacent to flood-affected areas experienced a 6% increase in poverty rates. Subsequently, González et al. (2021) employed the DiD approach to examine the impact of exposure to natural disasters that occurred between 1970 and 1992 on multidimensional poverty and extreme poverty in 350 districts in Argentina. The authors found that individuals who were exposed to natural disasters during their first year of life were 5% more likely to reside in a household classified as multidimensionally poor by 2010.
Although studies have measured the impact of increased physical capital, in the form of infrastructure, on poverty through quasi-natural experiments (Inthakesone and Kim, 2016; Zhang et al., 2023; Tian et al., 2024), the trade-off effects between increased physical capital and natural capital on poverty remain unknown. This paper aims to provide empirical evidence on the causal effects of the loss of natural capital resulting from the construction of the Mayan Train infrastructure on poverty in the Yucatan Peninsula region.
According to the literature analyzed, the synthetic control method stands out for enabling the design of quasi-experiments where the number of treated units is limited and the treatment variable is aggregate (Huang et al., 2025). It also avoids endogeneity problems common in conventional econometric approaches (Eliason and Lutz, 2018).
3 Materials and methods
We examine the impact of the loss of natural capital in the Yucatán Peninsula region. To do this, it was necessary to calculate the value of the NCI for the year 2018, as the data available on the CONABIO Geoportal only covers the years 1985, 1993, 2002, 2007, 2011, 2014, and 2021. The calculation was carried out through an interpolation process, which consisted of obtaining the average between the values for the years 2014 and 2021. This calculation was performed after verifying that the functional form of the univariate within-sample estimates fit a linear model, as shown in Supplementary Appendix Figure S1. This method enabled comparisons to be made between the NCI and the poverty percentage for the years 2008, 2010, 2014, 2018, and 2022, disaggregated by federal entity, and obtained from CONEVAL. In this context, the states of Quintana Roo, Campeche, and Yucatán, which make up the Yucatán Peninsula region, recorded the most significant loss of natural capital between 2018 and 2021, as illustrated in Figure 1, in which the NCI values are presented in descending order for 2018, serving as a reference for the change that occurred in 2021. Table 2 provides a description of the variables utilized in this study.
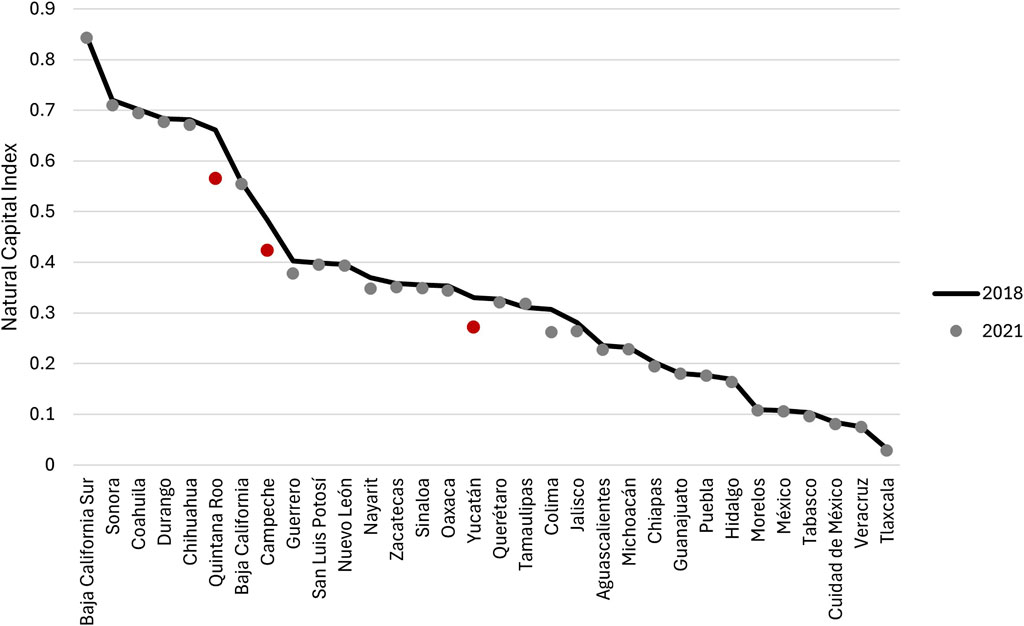
Figure 1. Natural Capital Index 2018 vs 2021.
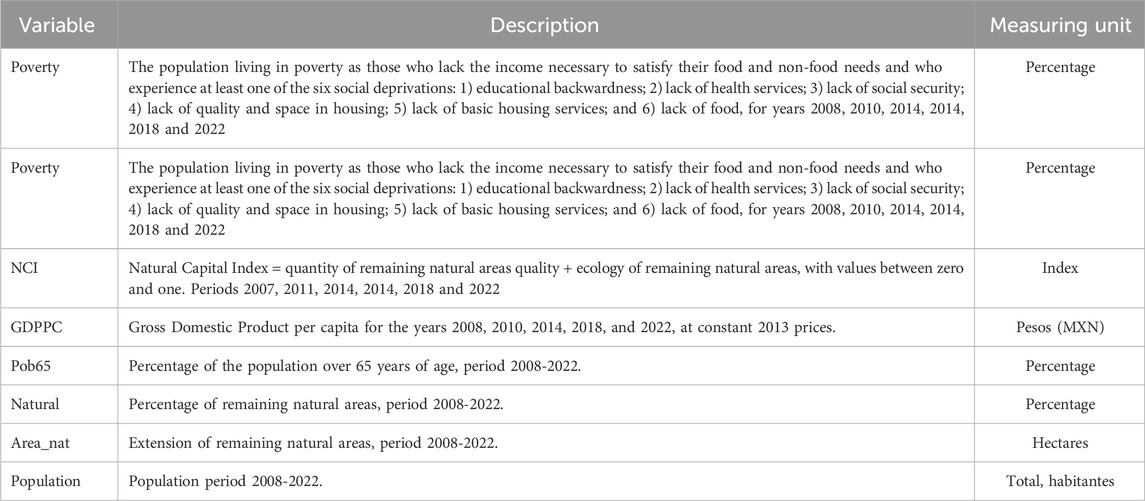
Table 2. Description of variables.
We defined the Yucatán Peninsula region, comprised of the states of Quintana Roo, Campeche, and Yucatán, as a treatment unit, while the remaining states were considered a donor pool. An analysis of the presence of spatial clusters in the natural capital loss rate (NCI) was conducted between 2018 and 2021 using the Local Indicator Spatial Association Analysis (LISA) method. This approach validated the aggregation of the natural capital index variable at the regional level of the Yucatán Peninsula, as well as the outcome variable linked to poverty and its predictors. The LISA statistic was calculated using GeoDa 1.22 software, employing a first-order queen-type spatial weight matrix, which verified the absence of spatial association in natural capital loss between the Yucatán Peninsula treatment unit and the other states considered a donor pool. The interpretation of the LISA statistic for the rate of natural capital loss is categorized into four groups: 1) High value in the local natural capital loss rate with high contiguous values (High-High); 2) Low value in the local natural capital loss rate with low contiguous values (Low-Low); 3) Low value in the local natural capital loss rate with high contiguous values (Low-High); 4) High value in the local natural capital loss rate with low contiguous values (High-Low). The LISA analysis revealed a spatial cluster of high values in natural capital loss between 2018 and 2021 for the states that comprise the Yucatán Peninsula region, which was statistically significant (p-value <0.05) with a z-score of 1.94, obtained from 999 permutations. Figure 2 illustrates the clustered spatial distribution of high values of the natural capital loss rate in the treatment unit of the Yucatán Peninsula, as well as a clustered distribution of low local values of the natural capital loss rate for the states of Northeastern Mexico.
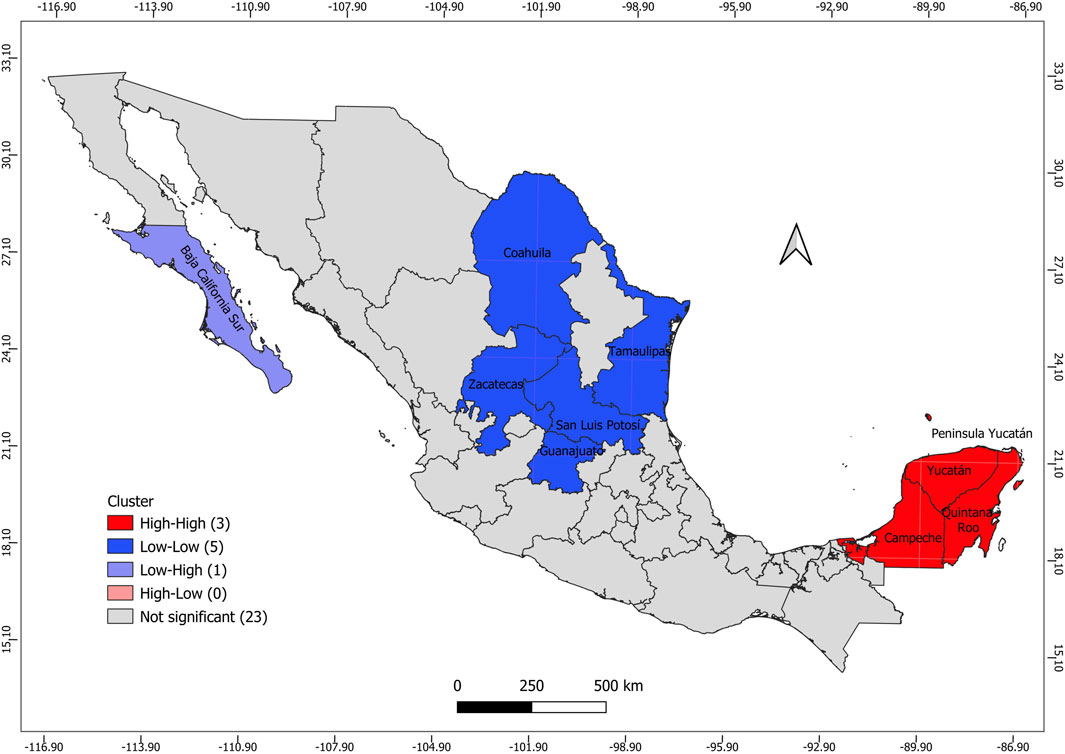
Figure 2. Cluster of Natural Capital loss in Mexico 2008-2021.
Figure 3 illustrates the trend in average poverty in the Yucatán Peninsula region compared to the rest of the states, highlighting a discrepancy in the average poverty rate between the two groups. A parallel trend is observed between 2008 and 2010, followed by a divergence from 2010 to 2022. This suggests that the average poverty rate for the other states is not an adequate benchmark for assessing the impact of natural capital loss on poverty.
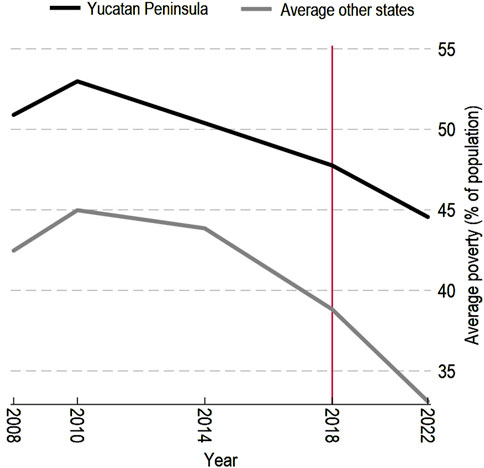
Figure 3. Poverty in the Yucatan Peninsula vs Poverty in Other States.
Trends began to diverge starting in 2010, showing a steady decline in the Yucatán Peninsula region until 2018. Subsequently, a significant decline in the poverty rate was observed between 2018 and 2022. In contrast, the average poverty rate in the rest of the states showed a continuous decline from 2010 to 2022, with a sharper drop between 2018 and 2022. The rate of poverty reduction in the latter period appears to have been higher in the rest of the states compared to the Yucatán Peninsula region, widening the poverty gap between the two groups from 8.94% in 2018 to 11.45% in 2022.
According to Esquivel (2024), the factors that explain the reduction in poverty during the period 2018-2022 are the following: 1) the increase in the minimum wage implemented in January 2019, which had a real effect of 65%; 2) the increase in economic resources for public policy to combat poverty starting in 2019, through unconditional cash transfer programs in the form of a non-contributory universal pension for adults over 65, as well as programs aimed at combating rural poverty (Sembrando Vida), programs conditional on participation in education (Benito Juárez Wellbeing Scholarship for basic education), and programs conditional on incorporation into formal employment (Jóvenes Construyendo el Futuro, the “Bécate” Employment Support Program, and a childcare program to support working mothers), in addition to serving populations in vulnerable conditions due to catastrophic losses (life insurance for female heads of households, orphaned children, and/or policyholders); 3) local infrastructure projects, such as the construction of the Maya Train, the Dos Bocas Refinery, and the Interoceanic Train. Since the construction of the Maya Train connected the state of Chiapas to the Yucatán Peninsula region, an empirical strategy was considered to include the state of Chiapas in the treatment group, considering the potential spillover effects of poverty resulting from its proximity and increased connectivity in the region. Figure 4 presents the percentage of the population benefiting from social programs implemented since 2019, highlighting that three of the four states that make up the treatment unit had percentages of beneficiaries higher than the national average of 12.81%: Chiapas (20.21%), Campeche (16.53%), and Yucatán (14.74%). In contrast, in Quintana Roo, only 8.62% of its population received support through a social program. This discrepancy is due to Quintana Roo’s registered poverty rate of 27.57%, which is considerably lower than the national average of 39.94% of the population living in poverty (CONEVAL, 2019).
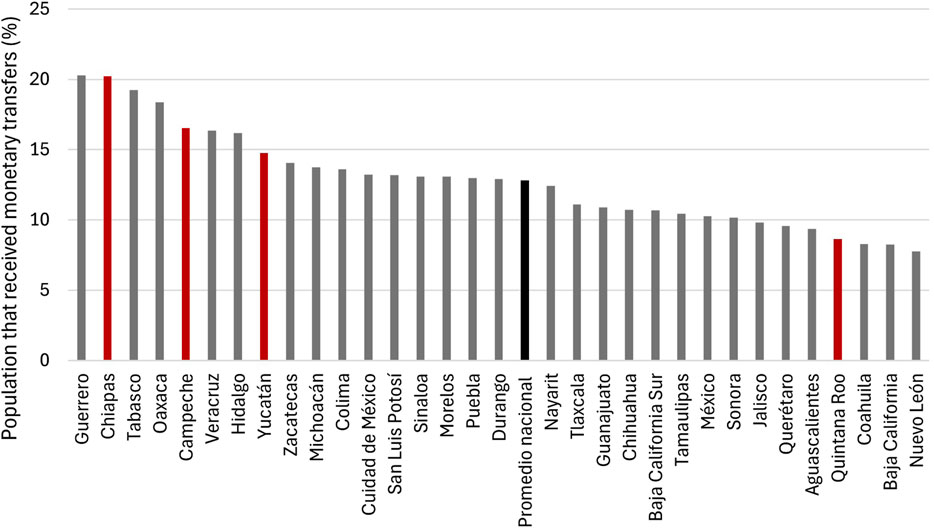
Figure 4. Percentage of the population benefiting from social programs by State, 2019.
From Figures 3, 4, it can be inferred that, in the context of the poverty reduction policy implemented starting in 2019, average poverty in the Yucatan Peninsula region decreased by 3.20 percentage points between 2018 and 2022, while in the rest of the states, the reduction was 5.71 percentage points, as illustrated in Figure 3. The above suggests that the accelerated loss of natural capital had compensatory effects by counteracting or limiting the impact of social program policies aimed at combating poverty in the Yucatan Peninsula region.
3.1 Data
We used the following statistical information to assess the causal effect of natural capital loss on poverty in Mexico: 1) Percentage of the population living in poverty (Poverty); 2) Total population (Population); 3) Percentage of the population aged 65 or older (Pob65); 4) Gross Domestic Product per capita (GDPPC); 5) Natural Capital Index (NCI); 6) Percentage of Natural Protected Areas (Area_nat); 7) Natural Protected Areas in hectares (Natural). Poverty information in Mexico for the period 2008-2022 was obtained from CONEVAL. The total population and percentage of the population aged 65 years and above were obtained from the National Population Council (CONAPO). The Gross Domestic Product per capita was obtained from the National Institute of Statistics and Geography (INEGI). The percentage of protected natural areas (Pan) and the extension of these natural areas, in hectares, were obtained from CONABIO.
Table 3 presents the descriptive statistics of the poverty variable and its predictors for the Yucatán Peninsula region and the rest of the states between 2008 and 2022.
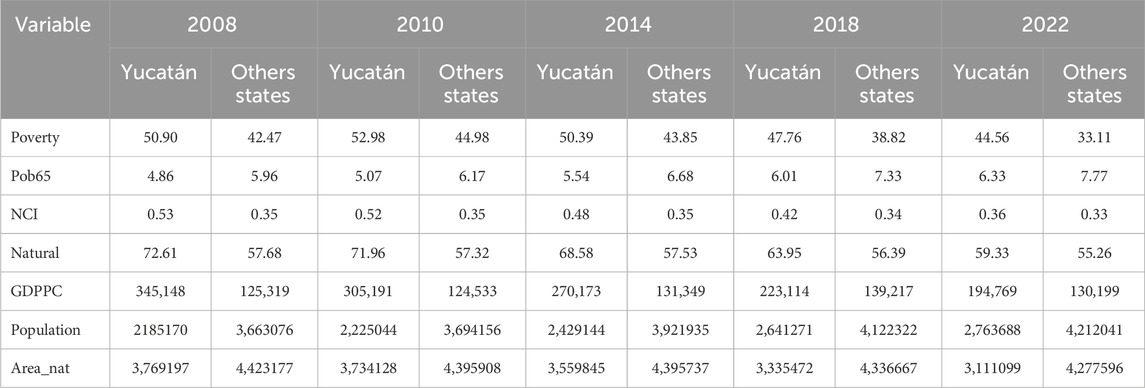
Table 3. Descriptive statistics.
Table 3 shows that the percentage of the population living in poverty in the Yucatán Peninsula region decreased by 3.2 percentage points between 2018 and 2022, while natural capital decreased by 14.29% during the same period.
3.2 Research methodology
The SCM proposed by Abadie and Gardeazabal (2003), Abadie et al. (2010), and Abadie (2021), is used since this method allows for estimating the effects of aggregated interventions at the state and/or regional level. The general framework for causal inference is based on a population of
where
Thus, the synthetic control obtained after applying the treatment reflects what would have happened to the treated unit in the absence of that treatment. While the estimated treatment effect for the treated unit post-treatment can be estimated as (Equation 3):
where
Where
4 Results
Table 4 presents the average values of the response variable, poverty, and its predictors in the treated unit, corresponding to the Yucatan Peninsula region, compared to the weighted average of the states selected from the donor pool.
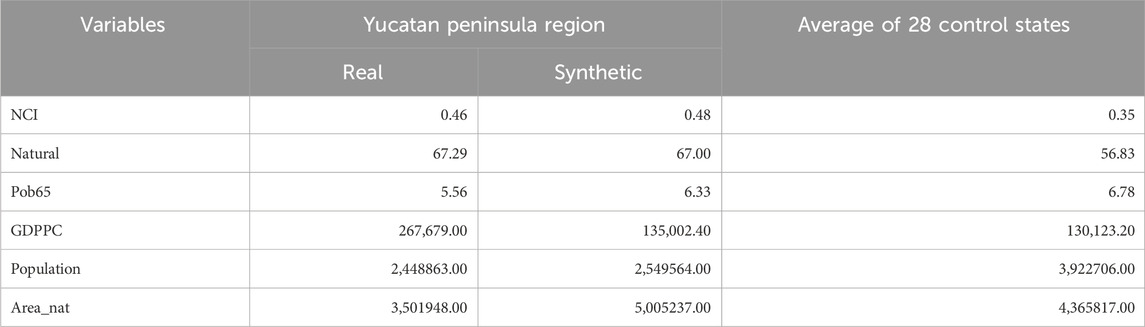
Table 4. Average of predictors 2008-2014.
In light of the results obtained from the weighted averages of the predictor variables of the poverty outcome variable, a discrepancy is observed between the variables GDP per capita and Areanat_ha, which could violate the Convex Hull Condition requirement. The main reason for this discrepancy is that the state of Campeche, part of the Yucatán Peninsula region, registered a 38% reduction in GDP per capita during the pre-intervention period, primarily due to a significant decline in oil production. Regarding the discrepancy between the treated unit and the synthetic control in the predictor Areanat_ha, it is possible that the origin of these discrepancies is the scale effect of hectares between the donor pool and the states that make up the Yucatán Peninsula region. However, excluding these predictors results in a higher Root Mean Squared Prediction Error (MSPE) than the one obtained when they are included (Supplementary Table S1; Figure 2). However, the MSPE obtained including all predictors was 0.0024, indicating that the predictors performed satisfactorily overall. Table 5 presents the weights for each control state in the synthetic Yucatán Peninsula region.
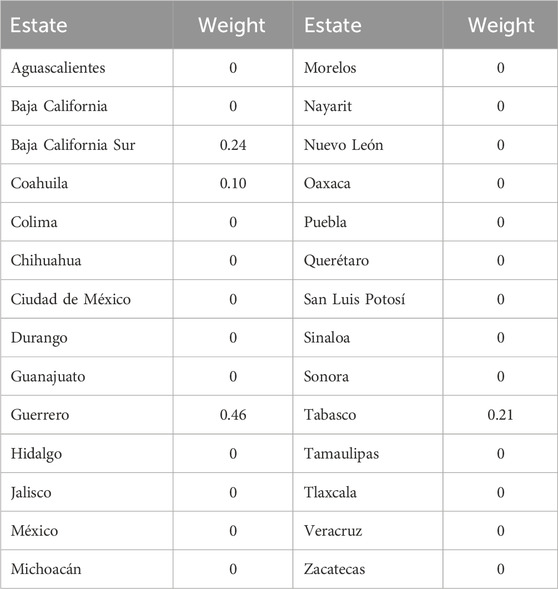
Table 5. Donor pool weights.
The weights obtained reveal that the poverty trend prior to the intensification of natural capital loss in the Yucatán Peninsula region is explained by the combination of the states of Guerrero, Baja California Sur, Tabasco, and Coahuila. Figure 5 shows the evolution of poverty in the Yucatán Peninsula region and its synthetic counterpart for the period 2008-2022.
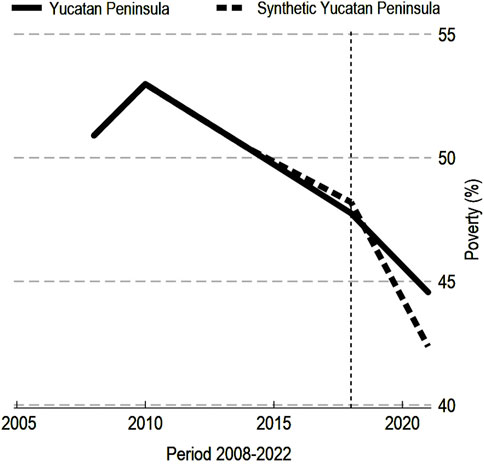
Figure 5. Percentage of the population living in poverty: Yucatán Peninsula region vs synthetic Yucatán Peninsula region.
Figure 5 highlights the proximity between the poverty trajectories of the Yucatán Peninsula region and the synthetic Yucatán Peninsula region, prior to the 14.29% loss of natural capital between 2018 and 2022. The disparity between the two trajectories, together with the low value of the MSPE and the balance of the predictors, suggests that the poverty of the synthetic Yucatán Peninsula represents an adequate approximation of the poverty levels that could have been achieved if natural capital had been preserved. The estimated effect of the loss of natural capital on the percentage of the population living in poverty is manifested as the difference between the poverty observed in the Yucatán Peninsula region and its synthetic counterpart after 2018, when the loss of natural capital intensified. The gap between the two trajectories reveals a negative effect of the loss of natural capital, amounting to 2.08% on poverty reduction; that is, instead of decreasing to 44.56%, it would have decreased to 42.08%. In Figure 6, we observe that the impact exceeded 2% by 2022.
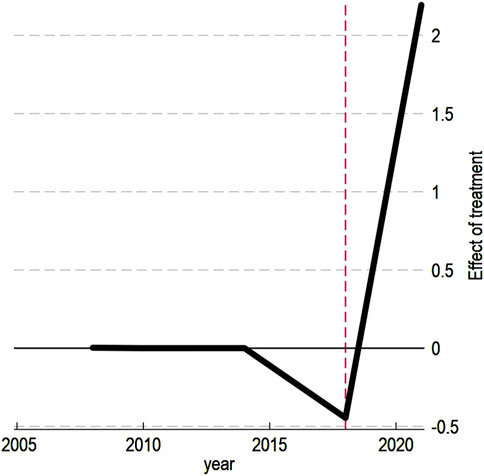
Figure 6. Poverty gap between the Yucatan Peninsula and the synthetic Yucatan Peninsula.
The gap between the Yucatán Peninsula region and its synthetic counterpart remained close to zero between 2008 and 2014. However, it declined significantly by 2018, indicating a decline in Natural Capital. Considering the impact, based on the population estimated by CONAPO for 2022 and the magnitude of the effect, it is concluded that 232,150 people failed to escape poverty.
4.1 Validation
To assess the robustness of the results, the contextual requirements under which the SCM is considered adequate are verified, taking into account Abadie’s (2021) recommendations regarding the absence of interference and non-anticipation. Interference could compromise the validity of the results, given that the effects of spatial spillovers from the loss of natural capital on poverty in neighboring States could be significant, especially in cases where the decrease in remaining natural areas impacts the provision of environmental goods and services on which those States depend. To evaluate the presence of spatial spillovers that could affect poverty levels in the control group, a Local Indicators of Spatial Association (LISA) analysis was conducted for the year 2018. This analysis enabled us to verify the absence of statistically significant local spatial clusters of the poverty variable between the Yucatan Peninsula region and its adjacent States (results available in Supplementary Figure S3). Regarding the possible anticipation effect, the model was estimated by adjusting the treatment for the year 2014, identifying an estimated gap between poverty in the Yucatan Peninsula region and its synthetic counterpart close to zero for that year (results also presented in Supplementary Figure S4).
4.2 Inference
To verify whether the estimated effect is spurious, a placebo test was conducted by applying the SCM to states that did not experience significant losses in their natural capital between 2018 and 2022. Figure 7 illustrates the poverty disparity in the Yucatan Peninsula region, as well as the placebo gaps for 28 states.
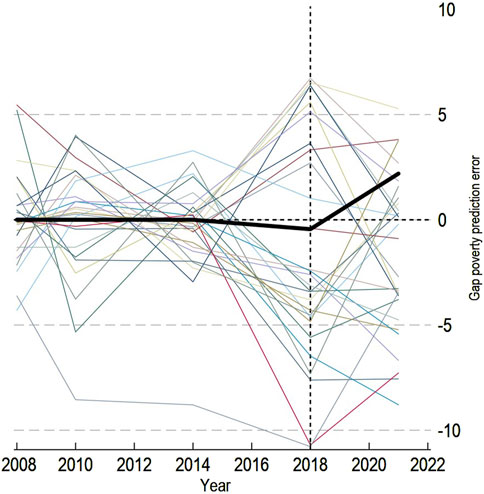
Figure 7. Poverty gap in the Yucatan Peninsula region and placebo gaps in the rest of the States.
As shown in Figure 7, the SCM used to predict poverty in the Yucatán Peninsula region exhibited a gap of nearly zero, with an MSPE of 0.0024 until 2018. This gap subsequently increased, reaching 2.08%. The placebo models exhibited considerable variability in the poverty prediction error gaps for the years 2010, 2018, and 2022. Furthermore, the poverty prediction error gap in the Yucatán Peninsula region was evaluated in comparison to the gaps estimated in the placebo models using the distribution of MSPE ratios before and after the increase in natural capital loss in the Yucatán Peninsula region and control states. See Figure 8.
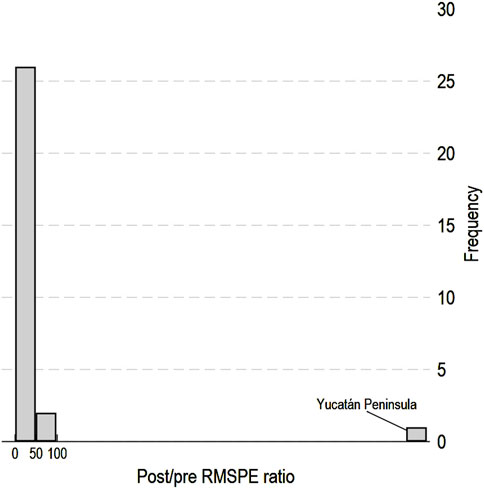
Figure 8. Distribution of ECMP ratios post/pre loss of Natural Capital.
The ratio for the Yucatán Peninsula region stands out significantly, as the MSPE after the natural capital loss was 976 times the MSPE. We then assessed statistical significance by estimating the probability that, upon random assignment of the intervention, a post/pre ratio as high as that for the Peninsula region would result
5 Discussion
This paper contributes to the limited literature on the effects of natural capital loss on multidimensional poverty. This is the first study to utilize the loss of remaining natural areas and ecological integrity to design a natural experiment. It uses the loss of natural capital that has occurred in the Yucatan Peninsula region since 2018 as an empirical strategy to define the treatment unit. The remaining states, which have not suffered significant losses in their natural capital, are considered a control group. In this study, the variable of interest, or outcome, is multidimensional poverty, which is comparable in terms of poverty measurement to the studies conducted by González et al. (2021), He et al. (2023), and Li et al. (2023). Although the outcome variable in these studies is multidimensional poverty, the findings of this paper are consistent with those reported by González et al. (2021), who observed that experiencing natural disasters between 1970 and 1992 increased the probability of living in a household with multidimensional poverty by 2010. In this sense, the results confirm that an exogenous environmental shock, manifested in the form of a natural disaster, has causal effects on the probability of experiencing multidimensional poverty in both the short and long term. In this study, the exogenous shock was caused by the loss of remaining natural areas and ecological integrity inherent to the Maya Train infrastructure.
The results of this study are consistent with the findings of Salvucci and Santos (2020), who noted that temporary exogenous shocks to the natural environment, caused by flooding in rural regions, negatively impact consumption and exacerbate poverty. However, unlike these temporary effects, the results obtained in our research are the result of permanent ecological disturbances, given that the loss of forest cover and ecological integrity due to the construction of the Mayan Train is irreversible. Other studies have examined the impact of cash transfer programs on deforestation and ecological quality (Alix-Garcia et al., 2013; Ran et al., 2022) with contradictory results. Alix-Garcia et al. (2013) found that cash transfers had adverse effects, leading to increased deforestation in the environment. In contrast, Ran et al. (2022) reported positive effects of the cash transfer program on ecological quality. Unlike these studies, this paper considers the loss of Natural Capital, attributed to the construction of the Mayan Train, which began in 2019, to be exogenous.
One of the main challenges in estimating the effects of infrastructure-induced ecological shocks on poverty is the availability of comparable ecological and poverty indicators, considering their compatibility in terms of time, scale, coverage, and representativeness. Despite these limitations, this study utilized data from five cross-sectional surveys obtained from official sources, spanning 24 years. In this sense, the data used are representative at the state level and comparable. However, we recognize that a limitation of this study is the temporal scope of the treatment effect after 2022. Therefore, the effect of the loss of natural capital on poverty is short-term. Further studies with data from 2024 and later are needed to measure and verify the existence of medium- and long-term effects.
Ultimately, we believe that the loss of natural capital has impacted the region’s sustainable livelihoods. The reduction in remaining natural areas and ecological integrity also reduced the flow of ecological goods and services (direct and indirect), affecting agricultural productivity and, consequently, income. This could have led to displacement in the region from rural areas to peri-urban or urban areas under vulnerable conditions, due to a lack of access to essential services, including health services, education, social security, housing, basic necessities (such as water and electricity), as well as food and non-food supplies.
6 Conclusion
The objective of this paper is to evaluate the impact of natural capital loss on poverty in the Yucatan Peninsula, Mexico, during the period 2018-2022. It aims to analyze how the decline in remaining natural areas and ecological integrity affects the effectiveness of policies aimed at poverty reduction in the region, thereby contributing to the debate on the relationship between natural capital and social wellbeing, within the context of the first United Nations Sustainable Development Goal for 2030.
This paper employs the Synthetic Control Method (SCM) framework to assess the impact of natural capital loss on poverty in the Yucatan Peninsula. This approach allows for the comparison of the evolution of poverty in the study region with a synthetic control group that reflects what would have occurred in the absence of natural capital loss. This method is presented as a valuable tool for estimating causal effects in contexts where controlled experiments are not feasible.
The results of this analysis indicate that poverty in the Yucatán Peninsula could have been two percentage points lower than the observed level in 2022 (44.56%) if the 14.29% loss in natural capital had not occurred. This suggests that the loss of natural capital had an additional negative effect of 2.08% on poverty reduction in the region. Between 2018 and 2022, poverty in the Yucatan Peninsula decreased by an average of 3.20 percentage points, compared to a reduction of 5.71 percentage points in the rest of Mexico’s states, indicating that the loss of natural capital offset the impact of policies implemented to reduce poverty in the region. This partial offsetting effect prevented 232,150 people from escaping multidimensional poverty by 2022.
The implications of this study are significant in several respects: the results suggest that conserving natural capital is crucial to optimizing the effectiveness of poverty reduction policies. This implies that development strategies must integrate environmental conservation as an essential component to address multidimensional poverty. It highlights the need to include an ecological poverty component in multidimensional poverty indices, which could help more accurately reflect the living conditions of vulnerable populations and the interrelationship between social wellbeing and ecosystem health. The results of this research will inform resource planning and management in the Yucatán Peninsula, promoting an approach that prioritizes environmental sustainability and the protection of natural areas, which could contribute to poverty reduction. As a result of its finding, this study makes the following recommendations pertinent to the design of regional infrastructure programs.
1. Safeguard natural areas crucial for biodiversity conservation and ecosystem services to ensure sustainable livelihoods for rural populations.
2. Incorporate ecological trade-off effects between infrastructure development and natural area loss into net social cost-benefit analyses, including the full economic value of ecosystem services.
3. Implement ecological and economic offsets through benefit-sharing mechanisms in affected areas to mitigate environmental impacts.
4. Include ecological metrics, such as the CONABIO natural capital index, in regional poverty measurement frameworks to better reflect environmental contributions to social wellbeing.
5. Conduct comprehensive assessments of the long-term socio-ecological impacts of infrastructure projects, extending beyond short-term effects, to inform sustainable development strategies.
The temporal scope of this study is limited to estimating the short-term causal effect of natural capital loss due to the construction of the Mayan Train, covering the period from 2019 to 2022. In the short term, the economic benefits experienced by the population during the construction phase did not fully offset the income losses for those primarily dependent on natural capital in the region. However, it is recognized that in the long term, the infrastructure could foster increased economic activity, which may lead to higher incomes and reduced poverty levels. To accurately assess medium- and long-term impacts, further analysis extending beyond the initial years is necessary to capture the effects following the period of natural capital loss caused by the Mayan Train construction.
This study opens the door to further research on the interrelationship between natural capital and poverty in other regions, as well as the evaluation of policies that integrate environmental conservation and social development. In summary, the conclusions of this document suggest that conserving natural capital is crucial for enhancing social wellbeing and the effectiveness of sustainable development policies.
Data availability statement
The original contributions presented in the study are included in the article/Supplementary Material, further inquiries can be directed to the corresponding author.
Author contributions
GA-P: Writing – original draft, Visualization, Software, Data curation, Conceptualization, Methodology. LB-M: Validation, Funding acquisition, Writing – review and editing. LS: Investigation, Writing – original draft, Formal Analysis. VH-T: Writing – review and editing, Validation, Supervision, Software, Conceptualization, Investigation. AM-C: Validation, Writing – review and editing, Software, Investigation, Supervision. AO-R: Investigation, Writing – review and editing, Validation, Supervision.
Funding
The author(s) declare that financial support was received for the research and/or publication of this article. This work was supported by the Secretaria de Ciencia, Humanidades, Tecnología e Innovación (SECIHTI), through the project CBF 2023-2024-4308.
Acknowledgments
We thank the Centro de Investigaciones Biológicas del Noroeste (CIBNOR) for its support in completing this research.
Conflict of interest
The authors declare that the research was conducted in the absence of any commercial or financial relationships that could be construed as a potential conflict of interest.
Generative AI statement
The author(s) declare that no Generative AI was used in the creation of this manuscript.
Publisher’s note
All claims expressed in this article are solely those of the authors and do not necessarily represent those of their affiliated organizations, or those of the publisher, the editors and the reviewers. Any product that may be evaluated in this article, or claim that may be made by its manufacturer, is not guaranteed or endorsed by the publisher.
Supplementary material
The Supplementary Material for this article can be found online at: https://www.frontiersin.org/articles/10.3389/fenvs.2025.1617170/full#supplementary-material
References
Abadie, A. (2021). Using synthetic controls: feasibility, data requirements, and methodological aspects. J. Econ. Lit. 59 (2), 391–425. doi:10.1257/jel.20191450
Abadie, A., Diamond, A., and Hainmueller, J. (2010). Synthetic control methods for comparative case studies: estimating the effect of california’s tobacco control program. J. Am. Stat. Assoc. 105 (490), 493–505. doi:10.1198/jasa.2009.ap08746
Abadie, A., and Gardeazabal, J. (2003). The economic costs of conflict: a case study of the Basque Country. Am. Ec. Rev. 93 (1), 113–132. doi:10.1257/000282803321455188
Alix-Garcia, J., McIntosh, C., Sims, K. R. E., and Welch, J. R. (2013). The ecological footprint of poverty alleviation: evidence from mexico´s oportunidades program. Rev. Econ. Stat. 95 (2), 417–435. doi:10.1162/REST_a_00349
Arrow, K. J., Dasgupta, P., Goulder, L. H., Mumford, K. J., and Oleson, K. (2012). Sustainability and the measurement of wealth. Environ. Dev. Econ. 17 (3), 317–353. doi:10.1017/S1355770X12000137
Bundrick, J., and Yuan, W. (2019). Do targeted business subsidies improve income and reduce poverty? A synthetic control approach. Econ. Dev. Q. 33 (4), 351–375. doi:10.1177/0891242419875502
Campos-Vazquez, R. M., and Esquivel, G. (2022). The effect of the minimum wage on poverty: evidence from a quasi-experiment in Mexico. J. Dev. Stud. 59 (3), 360–380. doi:10.1080/00220388.2022.2130056
Cazzuffi, C., Pereira-López, M., and Soloaga, I. (2017). Local poverty reduction in Chile and mexico:the role of food manufacturing growth. FP 68, 160–185. doi:10.1016/j.foodpol.2017.02.003
Cheng, X., Chen, J., Jiang, S., Dai, Y., Shuai, C., Li, W., et al. (2021). The impact of rural land consolidation on household poverty alleviation: the moderating effects of human capital endowment. LUP 109, 105692. doi:10.1016/j.landusepol.2021.105692
CONABIO (2022). Natural capital index. Available online at: https://www.biodiversidad.gob.mx/pais/indice_capnat.html (Accessed August 30, 2024).
CONAPO (2023). Databases of demographic conciliation 1950 to 2019 and population projections of Mexico 2020 to 2070. Available online at: https://www.gob.mx/conapo/documentos/bases-de-datos-de-la-conciliacion-demografica-1950-a-2019-y-proyecciones-de-la-poblacion-de-mexico-2020-a-2070?idiom=es (Accessed August 30, 2024).
CONEVAL (2019). Poverty measurement, United Mexican States, 2008-2018 series. Available online at: https://www.coneval.org.mx/medicion/mp/documents/pobreza_18/pobreza_2018_coneval.pdf (Accessed August 30, 2024).
CONEVAL (2024). Poverty result in Mexico 2022. Available online at: https://www.coneval.org.mx/Medicion/MP/Paginas/Pobreza_2022.aspx (Accessed August 30, 2024).
Dasgupta, P. (2004). Human well-being and the natural environment. 2nd edn. Oxford: Oxford University Press.
Di Gennaro, V., Ferrini, S., and Turner, R. K. (2025). Extending the genuine savings estimates with natural capital and poverty at the regional and national level in Italy. Ecol. Econ. 228, 108433. doi:10.1016/j.ecolecon.2024.108433
Duan, H. (2024). Are there lasting impacts of China’s anti-poverty program? A synthetic control analysis. Appl. Econ., 1–35. doi:10.1080/00036846.2024.2393451
Duong, P. B., Thanh, P. T., and Ancev, T. (2021). Impacts of off-farm employment on welfare, food security and poverty: evidence from rural Vietnam. Int. J. Soc. Welf. 30, 84–96. doi:10.1111/ijsw.12424
Eliason, P., and Lutz, B. (2018). Can fiscal rules constrain the size of government? An analysis of the “crown jewel” of tax and expenditure limitations. J. Public Econ. 166, 115–144. doi:10.1016/j.jpubeco.2018.07.008
Esquivel, G. (2024). Avances en el combate a la pobreza en México, 2018-2022. Rev. Mex. Econ. UNAM. Núm. 9. Available online at: http://www.economia.unam.mx/assets/pdfs/econmex/09/02GerardoEsquivel.pdf.
Fick, S. E., Nauman, T. W., Brungard, C. C., and Duniway, M. C. (2021). Evaluating natural experiments in ecology: using synthetic controls in assessments of remotely sensed land-treatments. Ecol. Appl. 31 (00), e02264. doi:10.1002/eap.2264
Galperin, H., Katz, R., and Valencia, R. (2022). The impact of broadband on poverty reduction in rural Ecuador. Telemat. Inf. 75, 101905. doi:10.1016/j.tele.2022.101905
González, F. A. I., Santos, M. E., and London, S. (2021). Persistent effects of natural disasters on human development: quasi-experimental evidence for Argentina. Environ. Dev. Sustain. 23, 10432–10454. doi:10.1007/s10668-020-01064-7
Grover, D., and Rao, S. (2020). Inequality, unemployment, and poverty impacts of mitigation investment: evidence from the CDM in Brazil and implications for a post-2020 mechanism. Clim. Policy 20 (5), 609–625. doi:10.1080/14693062.2020.1760773
Gu, J. (2023). Energy poverty and government subsidies in China. Energ Policy 180, 113652. doi:10.1016/j.enpol.2023.113652
He, J., Ren, F., Weibel, R., and Fu, C. (2023). The effect of large scale photovoltaic-based projects on poverty reduction: empirical evidence from China. Renew. Energy 218, 119294. doi:10.1016/j.renene.2023.119294
Huang, K.-M., and Etienne, X. (2021). Impact of marcellus and utica shale exploitation on Ohio, Pennsylvania, and West Virginia regional economies: a synthetic control analysis. Pap. Regional Sci. 100 (6), 1449–1480. doi:10.1111/pirs.12628
Huang, L., Zhang, J., Wang, X., and Chen, Z. (2025). Evaluating the economic performance of park city policy—based on the penalized version of synthetic control method. Sustainability 17, 3474. doi:10.3390/su17083474
Imbens, G. W. (2024). Causal inference in the social sciences. Annu. Rev. Stat. Appl. 11, 123–152. doi:10.1146/annurev-statistics-033121-114601
INEGI (2022). Sistema de Cuentas Nacionales de México. Producto Interno Bruto por Entidad Federativa. Año Base 2013. Serie de 2003 a 2021. Available online at: https://www.inegi.org.mx/app/tabulados/default.aspx?pr=17&vr=6&in=2&tp=20&wr=1&cno=2 (Accessed August 30, 2024).
Inthakesone, B., and Kim, T. (2016). Impact of public road investment on poverty in rural Laos. JABER 14 (10), 6339–6350. Available online at: https://serialsjournals.com/abstract/69760_ch-16.pdf
Jones, B. A. (2018). Forest-attacking invasive species and infant health: evidence from the invasive emerald ash borer. Ecol. Econ. 154, 282–293. doi:10.1016/j.ecolecon.2018.08.010
Li, W., Huang, J., Kong, L., and Liang, D. (2024). Impact of photovoltaic power generation on poverty alleviation in Jiangsu, China. J. Renew. Sustain. Energy 16 (4), 045902. doi:10.1063/5.0208522
Li, W., Ke, J., and Sun, F. (2023). Long-term care insurance and multidimensional poverty of middle-aged and elderly: evidence from China. Front. Public Health 11, 1100146. doi:10.3389/fpubh.2023.1100146
Liu, J., Huang, F., Wang, Z., and Shuai, C. (2021). What is the anti-poverty effect of solar PV poverty alleviation projects? Evidence from rural China. Energy 2018, 119498. doi:10.1016/j.energy.2020.119498
Lu, J., Zhang, M., Zhang, J., Xu, C., and Cheng, B. (2021). Can health poverty alleviation project reduce the economic vulnerability of poor households? Evidence from chifeng city, China. Comput. Ind. Eng. 162, 107762. doi:10.1016/j.cie.2021.107762
Mori-Clemet, Y. (2019). Impacts of CDM projects on sustainable development: improving living standards across Brazilian municipalities? World Dev. 113, 222–236. doi:10.1016/j.worlddev.2018.06.014
Neri, M. C., and Soares, W. L. (2012). Sustainable tourism and eradication of poverty (step): impact assessment of a tourism development program in Brazil. Rev. Adm. Pública 46 (3), 865–878. doi:10.1590/S0034-76122012000300012
Osei, R. D., and Lambon-Quayefio, M. (2021). Cash transfers and supply of labor by poor households: evidence from the livelihood empowerment against poverty program in Ghana. Rev. Dev. Econ. 25 (3), 1293–1304. doi:10.1111/rode.12784
Peng, J., Zhao, Z., and Chen, L. (2022). The impact of high-standard farmland construction policy on rural poverty in China. Land 11, 1578. doi:10.3390/land11091578
Qin, B., Yu, Y., Ge, L., Yang, L., and Guo, Y. (2022). Does eco-compensation alleviate rural poverty? New evidence from national key ecological function areas in China. Int. J. Environ. Res. Public Health 19, 10899. doi:10.3390/ijerph191710899
Ran, R., Ni, Z., Hua, L., and Li, T. (2022). Does china´s poverty alleviation policy improve the quality of the ecological environment in poverty-stricken areas? Front. Environ. Sci. 1012, 1067339. doi:10.3389/fenvs.2022.1067339
Rana, P., and Miller, D. C. (2019). Explaining long-term outcome trajectories in social–ecological systems. PLoS ONE 14 (4), e0215230. doi:10.1371/journal.pone.0215230
Rana, P., and Sills, E. O. (2018). ¿La certificación cambia la trayectoria de la cobertura arbórea en los bosques en explotación en los trópicos? Una aplicación del método de control sintético de evaluación de impacto. Forests 9, 98. doi:10.3390/f9030098
Roopsind, A., Sohngen, B., and Brandt, J. (2019). Evidence that a national REDD+ program reduces tree cover loss and carbon emissions in a high forest cover, low deforestation country. Proc. Natl. Acad. Sci. U. S. A. 116, 24492–24499. doi:10.1073/pnas.1904027116
Salvucci, V., and Santos, R. (2020). Vulnerability to natural shocks: assessing the short-term impact on consumption and poverty of the 2015 flood in Mozambique. Ecol. Econ. 176, 106713. doi:10.1016/j.ecolecon.2020.106713
Sills, E. O., Herrera, D., Kirkpatrick, A. J., Brandão, A., Dickson, R., Hall, S., et al. (2015). Estimating the impacts of local policy innovation: the synthetic control method applied to tropical deforestation. PLoS ONE 10 (7), e0132590. doi:10.1371/journal.pone.0132590
Silva, V. H. M., Mariano, F. Z., Campêlo, G. L., França, N. C., França, J. M. S., and Firmiano, M. R. (2021). Evaluation of policies to combat poverty in Brazil: application of the generalized synthetic control method for fecop in Ceará. Nova Econ. 31 (01), 273–302. doi:10.1590/0103-6351/5449
Silva, V. H. M. C., Mariano, F. Z., de Franca, J. M. S., and Firmiano, M. R. (2023). Evaluating the impact of an innovative anti-poverty program: evidence using the generalized synthetic control method. Appl. Econ. Lett. 30 (19), 2867–2871. doi:10.1080/13504851.2022.2110561
Tian, Z., Hu, A., Yang, Z., and Lin, Y. (2024). Highway networks and regional poverty: evidence from Chinese counties. Struct. Chang. Econ. Dyn. 69, 224–231. doi:10.1016/j.strueco.2023.12.010
Wang, W., Ren, Q., and Yu, J. (2018). Impact of the ecological resettlement program on participating decision and poverty reduction in southern Shaanxi, China. For. Policy Econ 95, 1–9. doi:10.1016/j.forpol.2018.06.007
Wen, L., and Sun, S. (2023). Can China's new rural pension scheme alleviate the relative poverty of rural households? An empirical analysis based on the PSM-DID method. Aust. Econ. Pap. 62 (3), 396–429. doi:10.1111/1467-8454.12295
Yang, R., Zhong, C., Yang, Z., and Wu, Q. (2022). Analysis on the effect of the targeted poverty alleviation policy on narrowing the urban-rural income gap: an empirical test based on 124 counties in Yunnan province. Sustainability 14, 12560. doi:10.3390/su141912560
Keywords: multidimensional poverty, natural capital, synthetic control, Yucatan Peninsula, Mayan train
Citation: Avilés-Polanco G, Beltrán-Morales LF, Sour L, Hernández-Trejo V, Martinez-Cruz AL and Ortega-Rubio A (2025) Impact of natural capital loss on poverty in the Yucatán Peninsula, Mexico: a synthetic control analysis. Front. Environ. Sci. 13:1617170. doi: 10.3389/fenvs.2025.1617170
Received: 24 April 2025; Accepted: 01 July 2025;
Published: 14 July 2025.
Edited by:
Pierre Glynn, Arizona State University, United StatesReviewed by:
Nuria Torrescano, El Colegio de la Frontera Sur, MexicoAlejandro Prera, Washington State University, United States
Chrispine Mtocha, The World Bank, United States
Copyright © 2025 Avilés-Polanco, Beltrán-Morales, Sour, Hernández-Trejo, Martinez-Cruz and Ortega-Rubio. This is an open-access article distributed under the terms of the Creative Commons Attribution License (CC BY). The use, distribution or reproduction in other forums is permitted, provided the original author(s) and the copyright owner(s) are credited and that the original publication in this journal is cited, in accordance with accepted academic practice. No use, distribution or reproduction is permitted which does not comply with these terms.
*Correspondence: Luis Felipe Beltrán-Morales, bGJlbHRyYW4wNEBjaWJub3IubXg=