 E. J. Bushnell
 K. Miner
 D. Sousa
 L. Baskaran1
- 1NASA Jet Propulsion Laboratory, California Institute of Technology, Pasadena, CA, United States
- 2Department of Geography, San Diego State University, San Diego, CA, United States
Human populations are increasingly impacted by climate change, especially in the Arctic, where Polar Amplification is accelerating impacts to more than four times the global average. The complex, interconnected risks that result need to be measured and tracked to characterize highly impacted areas. We reviewed a select cross-section of published vulnerability indices developed to characterize change in the Alaska Arctic. These pertain to permafrost thaw, water availability, animal habitat and migration, and anthropogenic development. While this cross-section offers a diversity of analysis, the next step would be to increase the accessibility of the indices to Arctic communities. Increasing availability of these tools will enable the incorporation and planning for these interconnected vulnerabilities.
Highlights
• Vulnerability indices for Alaska are diverse and often apply to a specific region or topic.
• Existing vulnerability indices pertaining to water availability, permafrost, infrastructure, fish and game, and oil spills are excellent but need to be integrated.
1 Introduction
Polar amplification is causing the mean Arctic air temperature to increase more than four times as fast as the global average (Chapman and Walsh, 1993; Cohen et al., 2020; IPCC, 2021; Docquier and Koenigk, 2021; Rantanen et al., 2022). Many of the climate change impacts in the Arctic can be characterized by a loss of ice (Moon, 2017), where the melting of sea and glacier ice, as well as permafrost thaw, can affect weather patterns, land stability, flora growth, and fauna movement (Foster et al., 2022). For example, from 1979 to 2020, there was an 18% relative decrease in sea ice extent, accompanied by a 49% relative decrease in sea ice thickness over the same period (Lindsay and Schweiger, 2015; Kwok 2018; IPCC, 2019; Lavergne et al., 2019; Docquier and Koenigk, 2021). Sea-ice loss lowers albedo, increasing the potential for warming at the poles. Research suggests that the Arctic Ocean will be seasonally ice-free by 2030–2040 (Overland and Wang, 2013; Ivanov, 2023). On land, Arctic permafrost thaw reduces the stability of the surface, damaging infrastructure (Hong et al., 2014; Scheer et al., 2023), releasing stored microbes (Miner et al., 2021), and potentially shifting the Arctic from a carbon sink to a carbon source as the climate continues to warm (Miner et al., 2022; Abakumov et al., 2023).
The depletion or loss of salmon stocks, pollution from legacy and recent anthropogenic sources, impacts from overfishing in fisheries and tourist operations, and land subsidence due to permafrost thaw represent only a handful of emerging challenges to communities (Huntington et al., 2023; Miner et al., 2021). Many settlements in the North American Arctic are remote (disconnected from the road system with limited access to healthcare (Debortoli et al., 2019), freshwater (Alessa et al., 2008), and a reliance on subsistence hunting (Wolfe, 2004; Himes-Cornell and Kasperski, 2016) and have limited infrastructure, increasing their risk from these impacts of emergent change (Debortoli et al., 2019). Already, changes to wild food stocks and animal migration have left some Arctic communities vulnerable to small disruptions (Foster et al., 2022).
To assess a selection of vulnerability indices capturing changing dynamics of importance to Alaskan communities, this brief review summarizes a cross-section of tools including the Arctic Water Resources Vulnerability Index, the Permafrost Settlement Hazard Index, the Thaw Settlement Susceptibility Index and the Arctic Climate Change Vulnerability Index, in addition to applied research on biological change (Figure 1; Table 1). These indices quantify and compare the potential system impacts from environmental change and assess the potential for their expansion and application. While all the indices and associated research are intended to be informative to diverse sectors, some of these vulnerability assessments were created to be implemented at regional scales by community members, whereas others require more specialized knowledge.
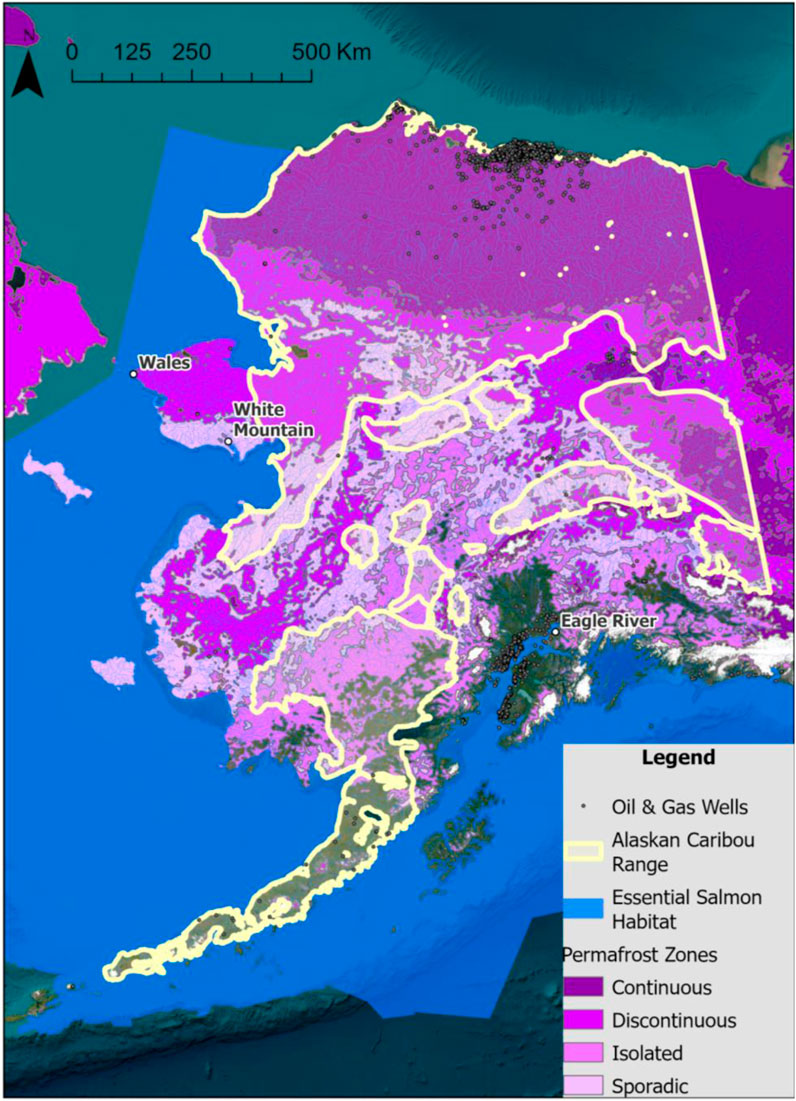
Figure 1. This map was constructed using ArcGIS Pro v3.3 and openly available datasets relevant to the discussed indices (Table 1). Many of the identified vulnerabilities overlap in the North Slope region of Alaska (Figure 2) and that the effects of petroleum extraction on permafrost are a concern. A 1985 dataset was used for the caribou range as there is not much available in GIS-friendly format.
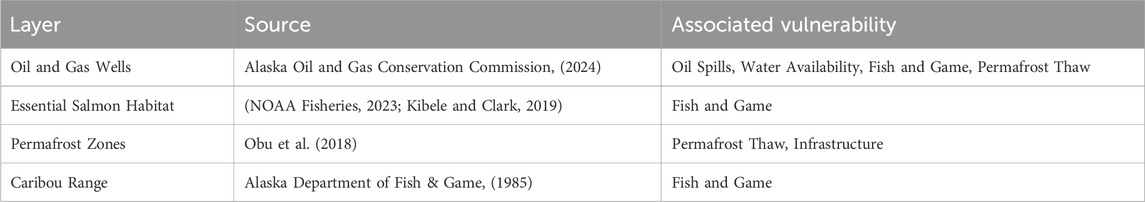
Table 1. Data sources used for the map of emergent vulnerabilities in Alaska.
2 Indices and Alaska Arctic applications
2.1 Water vulnerability indices
Freshwater is a critical need for human settlements, and Arctic communities are vulnerable to water stress due to their remote location, poor infrastructure, high energy costs, and seasonally limited access to liquid freshwater (Alessa et al., 2008). Additionally, the growing industrial and extractive activities in North America (Williams et al., 2019) can impact water quality and availability for downstream communities (Alessa et al., 2008). Therefore, evaluating resilience to water stress in Arctic communities is imperative for community health.
Several indices have been developed over the past 20 years to quantify Alaska’s water vulnerabilities at both global and regional scales (Alessa et al., 2008). The indices most actively used by governments include the Water Poverty Index (WPI) (Lawrence et al., 2002; Sullivan et al., 2003) and the Water Availability Index (WAI) (Meigh et al., 1999). These indices can function regionally (Gleick, 1996; Hayward et al., 2021), but the Arctic Water Resources Vulnerability Index (AWRVI) operates at a smaller community scale (Alessa et al., 2008; Kliskey et al., 2019; Williams et al., 2019). The AWRVI utilizes public domain data and can be calculated without any specialized equipment or training (Alessa et al., 2008). AWRVI includes physical and social sub-indices, ranging from 0 (highly vulnerable) to 1 (highly resilient), using a total of 25 indicators. (Alessa et al., 2008).
Several AWRVI physical indicators utilize remote sensing tools, including the Advanced Very High Resolution Radiometer (AVHRR), Landsat, atmospheric data, and precipitation measurements from the National Oceanic and Atmospheric Administration (NOAA) (Alessa et al., 2008). The social sub-indices and any validation required, such as perceptions of change at the community scale or changes to the quality of local drinking water from ecosystem disturbances, require in situ data. For example, a community’s AWRVI score is generally driven by its location relative to long-term water storage sources, including snowfall, glaciers, or rivers. It integrates the capabilities of infrastructure to treat and store these water stocks (Alessa et al., 2008).
Applying the AWRVI to three Alaska community case studies, researchers found that the Eagle River area near Anchorage was “moderately resilient” to climate driver water stressors, Wales (along the Bering Strait) was “moderately vulnerable” and White Mountain (on the Seward Peninsula) was just inside the vulnerability threshold established by the index as shown in table 5 of Alessa et al., 2008. When the WAI was applied to 24 settlements in the Nunavut region, 25% were classified as high risk for water shortages by 2070 (Hayward et al., 2021).
2.2 Permafrost thaw indices
Permafrost thaw can lead to ground subsidence, causing damage to human infrastructure (Hong et al., 2014; Scheer et al., 2023). Consequently, remote Arctic communities may rely on marine, overland, and aviation transport for essential goods and services (Alessa et al., 2008; Debortoli et al., 2019). An understanding of which areas will be most impacted by permafrost thaw, and when, is necessary for planning. However, thaw susceptibility indices are not often applied to finer scales (Scheer et al., 2023). Indices regularly used to understand the impacts of permafrost thaw include the Permafrost Settlement Hazard Index (PSHI), which quantifies permafrost thaw hazards by assigning six variable values, ranging from 1 (low risk) to 5 (high risk) (Hong et al., 2014). The variables are ground ice volume, air temperature, soil texture, snow depth, vegetation, and soil organic content (Hong et al., 2014). Many of these parameters can be remotely quantified through satellite imagery or weather stations, but the content of soil organics often requires field sampling. As such, this index is limited by data availability and is a static model that requires updates (Hong et al., 2014). Researchers found that the greatest risk from permafrost thaw impacts to infrastructure, ecosystems, and livelihoods in Alaska is from Kotzebue to Bethel, extending across the state, with severe patches in the Brooks Range (Hong et al., 2014; Figure 2). They also found that areas with discontinuous permafrost underlying villages tend to be the most vulnerable to hazards associated with permafrost thaw (Hong et al., 2014).
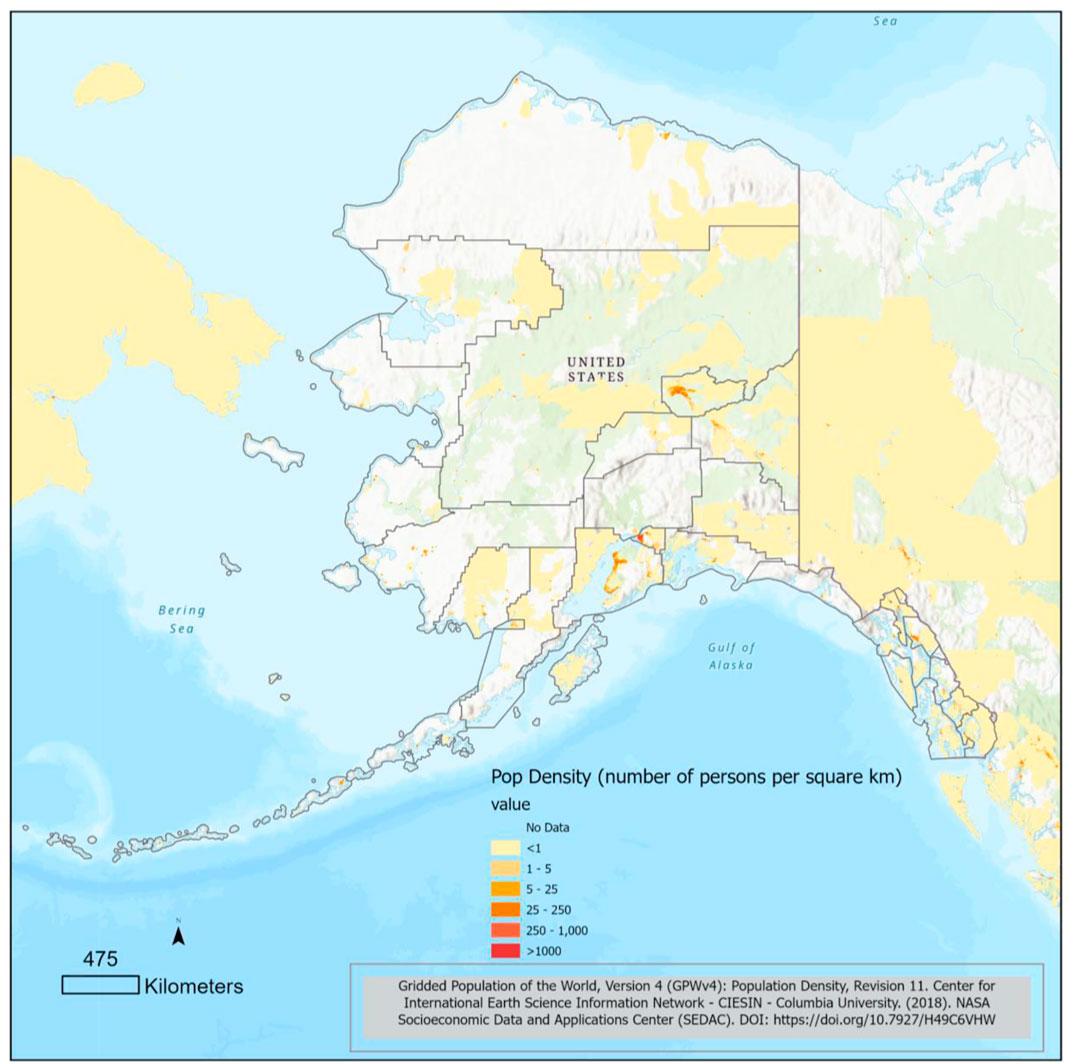
Figure 2. Population density in Alaska. The data was sourced from Center for International Earth Science Information Network (CIESIN) and NASA Socioeconomic Data and Applications Center (SEDAC).
Another recently developed index is the Thaw Settlement Susceptibility Index (TSSI) (Scheer et al., 2023). The TSSI works similarly to the PSHI by classifying areas as low, medium, or high risk, based on soil type, average seasonal deformation, water and snow accumulation, and assigning weights (Scheer et al., 2023). While several variables were considered when evaluating permafrost risk, the authors identified areas with discontinuous, thawing permafrost as the highest risk for thaw subsidence. TSSI also addresses the starting condition of infrastructure and the frequency of repair, and identifies critical infrastructure through Python-driven network analysis that identifies susceptible structures without alternative routes (Scheer et al., 2023). The index was initially designed for Greenland and was designed for infrastructure built around asphalt roads. Some adjustments to this index are required to make it more applicable to Alaska, including the addition of parameters that consider ice extent and unpaved infrastructure. An estimate of the expected subsidence or the integration of additional critical infrastructure types would enhance applicability.
2.3 Applied fish indices
Commercial and recreational fishing in Alaska contributes billions of dollars to the economy and supports over 50,000 jobs (Himes-Cornell and Kasperski, 2016), with over 90% of rural Alaskans relying on wild-caught fish and game (Wolfe, 2004; Himes-Cornell and Kasperski, 2016). Traditionally, many local communities rely on subsistence hunting (Ayeb-Karlsson et al., 2024), where fish and game are vital resources that directly link to the health and wellbeing of Alaskan communities. For example, Himes-Cornell and Kasperski (2016) developed 14 indices of community wellbeing that track fishing as related to subsequent socioeconomic indicators. They found a statistically significant positive correlation between a community’s involvement with fishing and socioeconomic status (Himes-Cornell and Kasperski, 2016).
Salmon are a particularly important fishery in Alaska (Hedger et al., 2013; Shanley and Albert, 2014), but research suggests that elevated sea surface and atmospheric temperatures encourage the northern range movement and may increase the production of fry and juvenile salmon (Nielsen et al., 2012; Hedger et al., 2013). Salmon have complex life cycles and are more vulnerable to small changes to hydrology and flow regimes, increasing their exposure and susceptibility to shocks (Graham and Harrod, 2009; Hedger et al., 2013; Shanley and Albert, 2014).
Shanley and Albert (2014) developed a salmon conservation priority matrix that combines hydrologic changes with available data on current salmon habitat and species diversity (Shanley and Albert, 2014). They used top-performing climate models for southeast Alaska (ECHAM5, HadCM3, and CGCM3.1; with monthly precipitation and temperature estimates from the PRISM climate model) and a salmon habitat and diversity index that was designed and calculated using the 2012 Alaska Department of Fish and Game (ADF&G) Anadromous Waters Catalog (AWC) (Shanley and Albert, 2014). They found that areas with high biodiversity of salmon species that are also deemed sensitive to predicted hydrologic change (quantified by the average percent increase in monthly discharge during the salmon spawning and incubation period from September to March) have the highest risk of impact on salmon fish populations over time (Shanley and Albert, 2014). For example, salmon populations along the southeastern coast of Alaska are highly vulnerable to population loss in the face of warming and reduced water clarity (as shown in figures 4 and 5 of Shanley and Albert, 2014), therefore, conservation should be prioritized.
However, their approach relies on climate models for southeast Alaska, and it is unclear how their index will perform in other areas of the state. Future work could replicate their approach using additional data for other regions and salmon population numbers that are more indicative of the broader Arctic. Additionally, the specifics for calculating the salmon habitat and species diversity index from the ADF&G AWC are opaque for non-experts seeking to use the tool and can be expanded.
2.4 Applied herd and ungulate indices
As with fishing, many Arctic communities rely on ungulate species for subsistence (Johnson et al., 2022). While any greening of the Arctic may benefit ungulates (Messier et al., 1988; Cebrian et al., 2008; Tveraa et al., 2013; Mallory and Boyce, 2018), future Arctic greening is not guaranteed, and many ungulate species are currently in decline (Fauchald et al., 2017).
To assess the impacts on herds from landscape change, researchers measured digestible energy (DE) and digestible nitrogen (DN) (as a proxy for protein) in Arctic vegetation (Fauchald et al., 2017). They found that a decline in pasture quality, driven by shifting water and soil dynamics, may partly explain the recent population decline (Fauchald et al., 2017). Based on this work, and to further assess the impacts on ungulates, researchers combined existing data on forage biomass and quality with a mosquito index using established mosquito activity equations (Johnson et al., 2022). Researchers then monitored GPS-collared female caribou using fixed-wing aerial surveys during calving season and shortly after to track the proportion of pregnant females and those that successfully gave birth and reared a calf. They found that higher DN in early summer was associated with greater reproductive success, while greater DE improved adult survival, and that mosquito activity was associated with decreased parturition (Johnson et al., 2022). Years with low DN and high mosquito activity have a synergistic effect (Johnson et al., 2022).
While an interesting way to assess ungulate herd populations, applying it to community needs would require additional work. In its current form, this research requires chemical testing of vegetation, tagging of ungulate herds, and comprehensive access to technology. To address these challenges, researchers have proposed working with communities to monitor large herds and their habitats through satellite imagery (Hansen et al., 2001), uncrewed aerial vehicles (UAVs) (Prosekov et al., 2020), or camera traps (Pfeffer et al., 2017). Much of the work done with UAV remote sensing can be accomplished using consumer-grade drones and off-the-shelf digital cameras, which are increasingly accessible to the public (Garza, 2019). Any effort to process the photos could be offset by volunteer efforts through citizen science platforms like Zooniverse, which also helps build public awareness of the critical link between fish, game, and food security in the Arctic (Gilbert et al., 2022).
2.5 Marine and aviation infrastructure vulnerability index
Remote Arctic communities are heavily dependent on marine and aviation transport for access to food, fuel, building materials, vehicles, inter-community transport, and medical care (Figure 2; Debortoli et al., 2019). Therefore, assessing community-level interruption of these services is critical. Researchers have proposed the Arctic Climate Change Vulnerability Index (ACCVI), a “multiplex network analysis model” to combine data on temperature, precipitation, sea level rise, and RCP scenarios with socioeconomic data from the Community Wellbeing Index (CWI) as well as census data (Debortoli et al., 2019).
When the ACCVI is applied to the Alaska Arctic, Debortoli et al. (2019) found that of the four Inuit regions (Inuvialuit, Nunatsiavut, Nunavik, and Nunavut), Nunatsiavut and Nunavut had the highest levels of vulnerability due to the loss of critical infrastructure. Specifically, the Rigolet, Coral Harbor, and Whale Cove communities were the most vulnerable due to their location close to the coast and reliance on these two transportation forms (Debortoli et al., 2019). It is unclear whether the ACCVI directly incorporates increased storm surge and storm severity, which is important to coastally located airports (Debortoli et al., 2019; Figure 2).
Based on this index, communities already affected by change may experience further long-term negative impacts on housing, transportation, and finances, and support from government agencies is required (Pearce et al., 2015; Debortoli et al., 2019). The creators of the ACCVI note that it is essential for Arctic vulnerability indices to reflect the values of Indigenous people and take small steps toward incorporating local knowledge, which is quantified through census data on the percentage of Inuktitut speakers (Debortoli et al., 2019). They highlight that as scientists develop indices, it is essential to produce research developed in collaboration with First Nations partners, where feasible and available (Ermine, 2007; Inuit Circumpolar Council, 2021).
2.6 Oil spill vulnerability indices
While this paper focuses on vulnerability to change, secondary impacts from petroleum extraction may impact communities. As Arctic ice melts, maritime traffic to the Arctic is expected to increase, with implications for Arctic shipping (Stephen, 2018). Additionally, increased shipping activity could lead to more tourism, infrastructure development, and accidents (Nevalainen et al., 2019; Gunnarsson, 2024), resulting in deleterious impacts on marine mammals (Hauser et al., 2018).
Wenning et al. (2018) review common mitigation practices for oil spills and their development. However, mitigation practices are reactive and do not account for the damage that is immediately done by oil spills. For example, researchers critiquing existing oil spill indices (SIMAP, OSCAR, ESI) suggest that they are limited by data availability, do not account for seasonal variation, or are location-specific (Nevalainen et al., 2019). They propose a new index that assigns impact probability to organisms based on 16 behavioral or life history characteristics (Nevalainen et al., 2019), thereby creating 16 different accident scenarios (Nevalainen et al., 2019). Decisions about organism characteristics and, subsequently, which probability distributions are assigned to regions and organisms are based on literature review and are qualitative data. They found that seabirds are among the most vulnerable to long-term impacts from oil spills, while whales and seals are among the least vulnerable. The vulnerability of other organisms varies strongly by season, as seen in polar bears (Nevalainen et al., 2019). An easy-to-use tool, such as a GIS mapper, to map high-vulnerability areas occupied by multiple sensitive species would improve the use of this research.
3 Discussion and conclusion
3.1 Connecting the vulnerability indices
All of the reviewed emergent vulnerabilities are interconnected within a changing Alaska. Warming of lakes and rivers is detrimental to salmon (Graham and Harrod, 2009; Hedger et al., 2013; Shanley and Albert, 2014) and poses a challenge for ungulate populations (Fauchald et al., 2017). Permafrost degradation and thawing destabilize the above-ground vegetation structure and function (Treat et al., 2024; Foster et al., 2022) and alter the hydrological flow both above and within the permafrost matrix (Miner et al., 2022). Ongoing demand for fossil fuels drives extractive activities, which can increase tourism and traffic (Woods, 2013) and can lead to negative impacts on water quality and the disruption of habitats for fish and game (Kumpula et al., 2010; Kumpula and Forbes, 2012).
The increasingly overlapping human-natural systems in the Arctic are rapidly changing, where both the anthropogenic and natural drivers can increase and multiply vulnerabilities. For example, as the ice melts, additional routes of human incursion into the Arctic increase, accompanied by a rise in Arctic tourism, shipping, and extractive industries, which in turn heighten vulnerability to oil spills and accidents (Stephen, 2018; Nevalainen et al., 2019). There is a growing footprint from “last-chance tourism” (Nyman and Lamphere, 2024), but the lack of infrastructure poses challenges to tourism in these remote regions (Palma et al., 2019). Ungulate range is changing as human activities and ecosystem shifts intensify, leading to increased pressures on resources and migration away from traditional calving grounds (Severson et al., 2021). Many of these compounding vulnerabilities are expected to intensify and feed back due to positive feedback loops associated with ice melt (Ren and Leslie, 2011), which may drive further warming and system feedbacks (Miner et al., 2022).
To better encounter and manage the interconnected system vulnerabilities, an integrated systems approach could be applied to the existing vulnerability matrices that were developed as stand-alone measures of one dynamic or population. An integrated system would enable the greater use of indices to assess cumulative or compounding vulnerabilities, thereby increasing risk to the larger area. For example, the utilization of GIS mapping tools with the available indices for tracking emergent vulnerabilities would be valuable in furthering the understanding of the spatiotemporal relationships between them (Figures 1, 2) (Gridded Population of the World, 2018). This applied visualization would allow prioritization of resources and response.
Additional integration of existing indices can be achieved through partnerships with regional stakeholders (Miner et al., 2022). For example, land managers or planners interested in applying basic research findings to their area can be supported with how-to videos, plain language summaries of journal articles, or web-based tools that utilize APIs to retrieve updated data. For example, the US Department of Transportation’s Vulnerability Assessment Scoring Tool (VAST) features an Excel-based format and a user’s guide with documentation (US Department of Transportation, 2017). Arctic vulnerability and risk indices could be incorporated into similarly accessible tools, with documentation including formats such as Excel or mapping software. With these data and index calculations available, land managers and other interested end-users can calculate, map, and overlay indices to elucidate which communities will need to adapt to multiple cumulative effects. Based on the reviewed literature, some Alaskan communities may struggle to meet their basic survival needs in the near future (Overland and Wang, 2013; Ivanov, 2023; Ayeb-Karlsson et al., 2024). Actionable steps for adaptation, including the expansion and meaningful interpretation of existing applied research, can protect the lives and livelihoods of Alaskan communities.
4 Plain language summary
In the Arctic, oceanic and atmospheric effects are accelerating change at nearly four times the global average, and communities are feeling the effects. Over 50 papers were reviewed to gain a deeper understanding of the tools scientists have developed to track and measure community vulnerabilities. These indices focused on water availability, infrastructure damage, thawing of ice, impacts on wildlife, and oil spills. The existing tools were not designed to integrate, making it challenging to understand cumulative risks.
Author contributions
EB: Conceptualization, Writing – review and editing, Writing – original draft, Investigation. KM: Conceptualization, Supervision, Writing – review and editing, Funding acquisition, Project administration, Validation, Writing – original draft. DS: Data curation, Resources, Methodology, Software, Writing – review and editing, Investigation, Conceptualization, Funding acquisition, Supervision. LB: Software, Funding acquisition, Writing – review and editing, Conceptualization, Resources, Investigation, Project administration, Methodology, Supervision.
Funding
The author(s) declare that financial support was received for the research and/or publication of this article. A portion of this work was carried out at the Jet Propulsion Laboratory, California Institute of Technology, under a contract with the National Aeronautics and Space Administration (80NM0018D0004). This work was made possible by NASA Jet Propulsion Lab’s Maximizing Student Potential in STEM program, the “Analyzing land-use change impacts of oil and gas exploration-related infrastructure changes on Arctic communities” project, and continued funding provided by Dan Sousa through the San Diego State University Research Foundation. I am also incredibly grateful for the mentoring of Drs. Kimberly Miner, Latha Baskaran, and Dan Sousa. We’d also like to acknowledge a variety of open-data sources that we used in compiling a map of emergent vulnerabilities in Alaska (Table 1).
Conflict of interest
The authors declare that the research was conducted in the absence of any commercial or financial relationships that could be construed as a potential conflict of interest.
Generative AI statement
The author(s) declare that no Generative AI was used in the creation of this manuscript.
Publisher’s note
All claims expressed in this article are solely those of the authors and do not necessarily represent those of their affiliated organizations, or those of the publisher, the editors and the reviewers. Any product that may be evaluated in this article, or claim that may be made by its manufacturer, is not guaranteed or endorsed by the publisher.
References
Abakumov, E., Petrov, A., Polyakov, V., and Nizamutdinov, T. (2023). Soil organic matter in urban areas of the Russian arctic: a review. Atmosphere 14 (6), 997. doi:10.3390/atmos14060997
Alaska Department of Fish and Game (1985). Alaska habitat management guides: 1985. Alaska Dep. Fish Game. Available online at: https://www.adfg.alaska.gov/index.cfm?adfg=maps.habitatmanagement.
Alaska Oil and Gas Conservation Commission (2024). Data. Data. Alaska Oil Gas Conservation Comm. Available online at: https://www.commerce.alaska.gov/web/aogcc/Data.aspx#dataextract.
Alessa, L., Kliskey, A., Lammers, R., Arp, C., White, D., Hinzman, L., et al. (2008). The arctic water resource vulnerability index: an integrated assessment tool for community resilience and vulnerability with respect to freshwater. Environ. Manag. 42, 523–541. doi:10.1007/s00267-008-9152-0
Ayeb-Karlsson, S., Hoad, A., and Trueba, M. L. (2024). My appetite and mind would go’: inuit perceptions of (im)mobility and wellbeing loss under climate change across Inuit nunangat in the Canadian arctic. Humanit Soc. Sci. Commun. 11, 277. doi:10.1057/s41599-024-02706-1
Cebrian, M., Kielland, K., and Finstad, G. (2008). Forage quality and reindeer productivity: multiplier effects amplified by climate change. Arct. Antarct. Alp. Res. 40, 48–54. doi:10.1657/1523-0430(06-073)[CEBRIAN]2.0.CO;2
Chapman, W. L., and Walsh, J. E. (1993). Recent variations of sea ice and air temperature in high latitudes. Bull. Am. Meteorol. Soc. 74, 33–47. doi:10.1175/1520-0477(1993)074<0033:rvosia>2.0.co;2
Cohen, J., Zhang, X., Francis, J., Jung, T., Kwok, R., Overland, J., et al. (2020). Divergent consensuses on arctic amplification influence on midlatitude severe winter weather. Nat. Clim. Change 10, 20–29. doi:10.1038/s41558-019-0662-y
Debortoli, N. S., Clark, D. G., Ford, J. D., Sayles, J. S., and Diaconescu, E. P. (2019). An integrative climate change vulnerability index for arctic aviation and marine transportation. Nat. Commun. 10, 2596. doi:10.1038/s41467-019-10347-1
Docquier, D., and Koenigk, T. (2021). A review of interactions between ocean heat transport and arctic sea ice. Environ. Res. Lett. 16 (12), 123002. doi:10.1088/1748-9326/ac30be
Fauchald, P., Park, T., Tømmervik, H., Myneni, R., and Hausner, V. H. (2017). Arctic greening from warming promotes declines in caribou populations. Sci. Adv. 3 (4), e1601365. doi:10.1126/sciadv.1601365
Foster, A. C., Wang, J. A., Frost, G. V., Davidson, S. J., Hoy, E., Turner, K. W., et al. (2022). Disturbances in North American boreal forest and arctic tundra: impacts, interactions, and responses. Environ. Res. Lett. 17 (11), 113001. doi:10.1088/1748-9326/ac98d7
Garza, C. (2019). Landscape ecology in the rocky intertidal: opportunities for advancing discovery and innovation in intertidal research. Curr. Landsc. Ecol. Rep. 4 (3), 83–90. doi:10.1007/s40823-019-00042-8
Gilbert, N. A., Stenglein, J. L., Van Deelen, T. R., Townsend, P. A., and Zuckerberg, B. (2022). Behavioral flexibility facilitates the use of spatial and temporal refugia during variable winter weather. Behav. Ecol. 33 (2), 446–454. doi:10.1093/beheco/arab154
Gleick, P. H. (1996). Basic water requirements for human activities: meeting basic needs. Water Int. 21, 83–92. doi:10.1080/02508069608686494
Graham, C. T., and Harrod, C. (2009). Implications of climate change for the fishes of the British isles. J. Fish Biol. 74 (6), 1143–1205. doi:10.1111/j.1095-8649.2009.02180.x
Gridded Population of the World (2018). Version 4 (GPWV4): population density, revision 11. Center for international Earth science information network - CIESIN - columbia university. Palisades, New York: NASA Socioeconomic Data and Applications Center SEDAC. doi:10.7927/H49C6VHW
Gunnarsson, B. (2024). On the vulnerabilities of the northern sea Route’s maritime transportation system. Arct. Rev. Law Polit. 15. doi:10.23865/arctic.v15.6409
Hansen, M. J., Franklin, S. E., Woudsma, C. G., and Peterson, M. (2001). Caribou habitat mapping and fragmentation analysis using landsat MSS, TM, and GIS data in the north Columbia Mountains, British Columbia, Canada. Remote Sens. Environ. 77 (1), 50–65. doi:10.1016/s0034-4257(01)00193-6
Hauser, D. D., Laidre, K. L., and Stern, H. L. (2018). Vulnerability of arctic marine mammals to vessel traffic in the increasingly ice-free northwest passage and northern sea route. Proc. Natl. Acad. Sci. 115 (29), 7617–7622. doi:10.1073/pnas.1803543115
Hayward, J., Johnston, L., Jackson, A., and Jamieson, R. (2021). Hydrological analysis of municipal source water availability in the Canadian arctic territory of Nunavut. ARCTIC 74 (1), 30–41. doi:10.14430/arctic72137
Hedger, R. D., Sundt-Hansen, L. E., Forseth, T., Ugedal, O., Diserud, O. H., Kvambekk, Å. S., et al. (2013). Predicting climate change effects on subarctic–Arctic populations of Atlantic salmon (Salmo salar). Can. J. Fish. Aquatic Sci. 70 (2), 159–168. doi:10.1139/cjfas-2012-0205
Himes-Cornell, A., and Kasperski, S. (2016). Using socioeconomic and fisheries involvement indices to understand Alaska fishing community wellbeing. Coast. Manag. 44 (1), 36–70. doi:10.1080/08920753.2016.1116671
Hong, E., Perkins, R., and Trainor, S. (2014). Thaw settlement hazard of permafrost related to climate warming in Alaska. ARCTIC 67 (1), 93–104. doi:10.14430/arctic4368
Huntington, H. P., Strawhacker, C., Falke, J., Ward, E. M., Behnken, L., Curry, T. N., et al. (2023). “Ch. 29. Alaska,” in Fifth national climate assessment. Crimmins. Editors C. W. Avery, D. R. Easterling, K. E. Kunkel, B. C. Stewart, and T. K. Maycock (Washington, DC, USA: U.S. Global Change Research Program). doi:10.7930/NCA5.2023.CH29
Inuit Circumpolar Council (2021). ICC ethical and equitable engagement synthesis report. Ottawa, Canada: Inuit Circumpolar Council. Available online at: https://www.inuitcircumpolar.com/project/icc-ethical-and-equitable-engagement-synthesis-report/(Accessed September 19, 2024).
IPCC (2021). Climate Change 2021: the Physical Science Basis. Contribution of Working Group I to the Sixth Assessment Report of the Intergovernmental Panel on Climate Change ed V Masson-Delmotte et al. Cambridge: Cambridge University Press. Summary for policymakers.
IPCC (2019). IPCC Special Report on the Ocean and Cryosphere in a Changing Climate. Editors H.-O. Pörtner, D.C. Roberts, V. Masson-Delmotte, P. Zhai, M. Tignor, E. Poloczanskaet al. In press
Ivanov, V. (2023). Arctic sea ice loss enhances the Oceanic contribution to climate change. Atmosphere 14 (2), 409. doi:10.3390/atmos14020409
Johnson, H. E., Lenart, E. A., Gustine, D. D., Adams, L. G., and Barboza, P. S. (2022). Survival and reproduction in arctic caribou are associated with summer forage and insect harassment. Front. Ecol. Evol. 10. doi:10.3389/fevo.2022.899585
Kafalenos, R. (2017). U.S. department of transportation’s vulnerability assessment scoring tool (VAST). Adapt. Clgh. Available online at: https://www.adaptationclearinghouse.org/resources/u-s-department-of-transportation-s-vulnerability-assessment-scoring-tool-vast.html.
Kibele, , and Clark, (2019). Rivers of Alaska grouped by SASAP region, 2018. Knowl. Netw. Biocomplexity. doi:10.5063/F1SJ1HVW
Kliskey, A., Williams, P., Abatzoglou, J. T., Alessa, L., and Lammers, R. B. (2019). Enhancing a community-based water resource tool for assessing environmental change: the arctic water resources vulnerability index revisited. Environ. Syst. Decis. 39, 183–197. doi:10.1007/s10669-018-9712-7
Kumpula, T., Forbes, B. C., and Stammler, F. (2010). Remote sensing and local knowledge of hydrocarbon exploitation: the case of bovanenkovo, yamal peninsula, west siberia, Russia. Arctic 63, 165–178. doi:10.14430/arctic972
Kumpula, T., Forbes, B. C., Stammler, F., and Meschtyb, N. (2012). Dynamics of a coupled system: multi-resolution remote sensing in assessing social-ecological responses during 25 years of gas field development in arctic Russia. Remote Sens. 4 (4), 1046–1068. doi:10.3390/rs4041046
Kwok, R. (2018). Arctic sea ice thickness, volume, and multiyear ice coverage: Losses and coupled variability (1958–2018). Environ. Res. Lett. 13 (10), 105005. doi:10.1088/1748-9326/aae3ec
Lavergne, T., Sørensen, A. M., Kern, S., Tonboe, R., Notz, D., Aaboe, S., et al. (2019). Version 2 of the EUMETSAT OSI SAF and ESA CCI sea-ice concentration climate data records. Cryosphere 13, 49–78. doi:10.5194/tc-13-49-2019
Lawrence, P., Meigh, J., and Sullivan, C. (2002). “The water poverty index: an international comparison,” in Keele economics research papers (Staffordshire, U.K: Keele University), 1352–8955.
Lindsay, R., and Schweiger, A. (2015). Arctic sea ice thickness loss determined using subsurface, aircraft and satellite observations. Cryosphere 9, 269–283. doi:10.5194/tc-9-269-2015
Mallory, C. D., and Boyce, M. S. (2018). Observed and predicted effects of climate change on arctic caribou and reindeer. Environ. Rev. 26, 13–25. doi:10.1139/er-2017-0032
Meigh, J. R., McKenzie, A. A., and Sene, K. J. (1999). A grid-based approach to water scarcity estimates for Eastern and Southern Africa. Water Resources Management 13 (2), 85–115. doi:10.1023/a:1008025703712
Messier, F., Huot, J., le Henaff, D., and Luttich, S. (1988). Demography of the george river caribou herd: evidence of population regulation by forage exploitation and range expansion. Arctic 41, 279–287. doi:10.14430/arctic1733
Miner, K. R., D’Andrilli, J., Mackelprang, R., Edwards, A., Malaska, M. J., Waldrop, M. P., et al. (2021). Emergent biogeochemical risks from arctic permafrost degradation. Nat. Clim. Change 11 (10), 809–819. doi:10.1038/s41558-021-01162-y
Miner, K. R., Turetsky, M. R., Malina, E., Bartsch, A., Tamminen, J., McGuire, A. D., et al. (2022). Permafrost carbon emissions in a changing arctic. Nat. Rev. Earth and Environ. 3 (1), 55–67. doi:10.1038/s43017-021-00230-3
Nevalainen, M., Vanhatalo, J., and Helle, I. (2019). Index-based approach for estimating vulnerability of arctic biota to oil spills. Ecosphere 10 (6), e02766. doi:10.1002/ecs2.2766
Nielsen, J. L., Ruggerone, G. T., and Zimmerman, C. E. (2012). Adaptive strategies and life history characteristics in a warming climate: salmon in the arctic? Environ. Biol. Fishes 96 (10–11), 1187–1226. doi:10.1007/s10641-012-0082-6
NOAA Fisheries (2023). Alaska essential fish habitat (EFH) species shapefiles. Silver Spring, Maryland: NOAA. Available online at: https://www.fisheries.noaa.gov/resource/data/alaska-essential-fish-habitat-efh-species-shapefiles.
Nyman, E., and Lamphere, J. A. (2024). Climate change, energy production, and arctic tourism: a case study analysis of northern Alaska. Polar Rec. 60, e10. doi:10.1017/s0032247424000044
Obu, J., Westermann, S., Kääb, A., and Bartsch, A. (2018). Ground temperature map, 2000-2016, northern hemisphere permafrost. Bremerhaven, Germany: Alfred Wegener Institute, Helmholtz Centre for Polar and Marine Research, Bremerhaven, PANGAEA. doi:10.1594/PANGAEA.888600
Overland, J. E., and Wang, M. (2013). When will the summer arctic be nearly sea ice free? Geophys Res. Lett. 40, 2097–2101. doi:10.1002/grl.50316
Palma, D., Varnajot, A., Dalen, K., Basaran, I. K., Brunette, C., Bystrowska, M., et al. (2019). Cruising the marginal ice zone: climate change and arctic tourism. Polar Geogr. 42 (4), 215–235. doi:10.1080/1088937x.2019.1648585
Pearce, T., Ford, J., Cunsolo Willox, A., and Smit, B. (2015). Inuit traditional ecological knowledge (TEK), subsistence hunting and adaptation to climate change in the Canadian arctic. Arctic 68, 233–245. doi:10.14430/arctic4475
Pfeffer, S. E., Spitzer, R., Allen, A. M., Hofmeester, T. R., Ericsson, G., Widemo, F., et al. (2017). Pictures or pellets? Comparing camera trapping and dung counts as methods for estimating population densities of ungulates. Remote Sens. Ecol. Conservation 4 (2), 173–183. doi:10.1002/rse2.67
Prosekov, A., Kuznetsov, A., Rada, A., and Ivanova, S. (2020). Methods for monitoring large terrestrial animals in the wild. Forests 11 (8), 808. doi:10.3390/f11080808
Rantanen, M., Karpechko, A.Y., Lipponen, A., Nordling, K., Hyvärinen, O., Ruosteenoja, K., et al. (2022). The arctic has warmed nearly four times faster than the globe since 1979. Commun. Earth and Environ. 3 (1), 168. doi:10.1038/s43247-022-00498-3
Ren, D., and Leslie, L. M. (2011). Three positive feedback mechanisms for ice-sheet melting in a warming climate. J. Glaciol. 57 (206), 1057–1066. doi:10.3189/002214311798843250
Scheer, J., Tomaškovičová, S., and Ingeman-Nielsen, T. (2023). Thaw settlement susceptibility mapping for roads on permafrost - towards climate-resilient and cost-efficient infrastructure in the arctic. Cold Regions Sci. and Technol. 220. doi:10.2139/ssrn.4558538
Severson, J. P., Johnson, H. E., Arthur, S. M., Leacock, W. B., and Suitor, M. J. (2021). Spring phenology drives range shifts in a migratory arctic ungulate with key implications for the future. Glob. Change Biol. 27 (19), 4546–4563. doi:10.1111/gcb.15682
Shanley, C. S., and Albert, D. M. (2014). Climate change sensitivity index for Pacific salmon habitat in southeast Alaska. PLoS ONE 9 (8), e104799. doi:10.1371/journal.pone.0104799
Stephen, K. (2018). Societal impacts of a rapidly changing arctic. Curr. Clim. change Rep. 4 (3), 223–237. doi:10.1007/s40641-018-0106-1
Sullivan, C. A., Meight, J. R., and Giacomello, A. M. (2003). The water poverty index: development and application at the community scale. Nat. Resour. Forum 27, 189–199. doi:10.1111/1477-8947.00054
Treat, C. C., Virkkala, A., Burke, E., Bruhwiler, L., Chatterjee, A., Fisher, J. B., et al. (2024). Permafrost carbon: progress on understanding stocks and fluxes across northern terrestrial ecosystems. J. Geophys. Res. Biogeosciences 129 (3), e2023JG007638. doi:10.1029/2023jg007638
Tveraa, T., Stein, A., Bårdsen, B.-J., and Fauchald, P. (2013). Population densities, vegetation green-up, and plant productivity: impacts on reproductive success and juvenile body mass in reindeer. PLoS One 8, e56450. doi:10.1371/journal.pone.0056450
US Department of Transportation (2017). U.S. department of transportation’s vulnerability assessment scoring tool (VAST). Adapt. Clgh. Available online at: https://www.adaptationclearinghouse.org/resources/u-s-department-of-transportation-s-vulnerability-assessment-scoring-tool-vast.html.
Wenning, R. J., Robinson, H., Bock, M., Rempel-Hester, M. A., and Gardiner, W. (2018). Current practices and knowledge supporting oil spill risk assessment in the arctic. Mar. Environ. Res. 141, 289–304. doi:10.1016/j.marenvres.2018.09.006
Williams, P., Kliskey, A., McCarthy, M., Lammers, R., Alessa, L., and Abatzoglou, J. (2019). Using the arctic water resources vulnerability index in assessing and responding to environmental change in Alaskan communities. Clim. Risk Manag. 23, 19–31. doi:10.1016/j.crm.2018.09.001
Wolfe, R. J. (2004). Local traditions and subsistence: a synopsis from twenty-five years of research by the state of Alaska. Juneau, Alaska: Alaska Department of Fish and Game, Division of Subsistence.
Woods, (2013). The “middle place”: the NPR-A impact mitigation program and alaska’s north slope, 30. Alsk. Law Rev., 263–294. Available online at: https://scholarship.law.duke.edu/alr/vol30/iss2/7.
Keywords: Alaska, vulnerability, risk, climate change, environment
Citation: Bushnell EJ, Miner K, Sousa D and Baskaran L (2025) A review of emergent vulnerabilities indices in the Alaska Arctic. Front. Environ. Sci. 13:1619823. doi: 10.3389/fenvs.2025.1619823
Received: 28 April 2025; Accepted: 21 July 2025;
Published: 12 August 2025.
Edited by:
Vikram Kumar, Govt. of Bihar, IndiaReviewed by:
Jan Marcin Weslawski, Polish Academy of Sciences, PolandNurçin Killi, Muğla University, Türkiye
Copyright © 2025 Bushnell, Miner, Sousa and Baskaran. This is an open-access article distributed under the terms of the Creative Commons Attribution License (CC BY). The use, distribution or reproduction in other forums is permitted, provided the original author(s) and the copyright owner(s) are credited and that the original publication in this journal is cited, in accordance with accepted academic practice. No use, distribution or reproduction is permitted which does not comply with these terms.
*Correspondence: E. J. Bushnell, bGJ1c2huZWxsQHNhbmRpZWdvLmVkdQ==