 Gerald Schernewski
 Thomas Neumann
 Sarah Piehl
 Mario von Weber4
- 1Coastal Sea Geography Group, Leibniz-Institute for Baltic Sea Research, Rostock, Germany
- 2Marine Research Institute, Klaipeda University, Klaipėda, Lithuania
- 3Biogeochemical Modelling Group, Leibniz-Institute for Baltic Sea Research, Rostock, Germany
- 4Landesamt für Umwelt, Naturschutz und Geologie, Güstrow, Germany
Oxygen is a key indicator for assessing the ecological condition of coastal waters, yet current monitoring programs often fail to adequately capture the occurrence and impact of hypoxia, anoxia, and their consequences. In this study, we combine long-term observational data with a 3D ecosystem model and use summer peaks of inorganic phosphorus concentrations as a proxy for anoxic events and subsequent sedimentary phosphorus release. This approach allows us to assess the duration, spatial extent, and ecological impacts of oxygen depletion in the Oder/Szczecin Lagoon, located in the southern Baltic Sea. Mass mortality events of aquatic organisms have been observed in the lagoon, and the model indicates that anoxic conditions frequently occur at a large scale directly above the sediment. However, these events are not captured in standard oxygen measurements, sampling 1 m above the sediment. We suggest a site-specific precautionary value for hypoxia of 8 mg O2/L, when measurements are limited to 1 m above the sediment. Daily and hourly maximum wind speeds can serve as site-specific proxies for oxygen depletion, reflecting changes in water mixing depth and indicating periods of stagnation above the sediment. Altogether hypoxia is still an underestimated problem and modified monitoring and assessment strategies are required and suggested. Anoxic phosphorus release from sediments can result in internal phosphorus loads of up to 1,000 tons per month, significantly exceeding all other external phosphorus inputs to the lagoon. The phosphorus concentration peaks do not permit detailed quantification of these anoxic processes and do not appear to have ecological consequences within the lagoon itself. However, it alters the seasonal pattern of nutrient loading and contributes additional phosphorus to the coastal Baltic Sea during the ecologically critical summer months. Over recent decades, both anoxia and internal eutrophication in the lagoon have shown a declining trend, coinciding with reductions in external nutrient inputs from riverine sources. Consequences on policy implementation and monitoring are discussed.
1 Introduction
Conley et al. (2011) conducted a comprehensive assessment of hypoxia (most commonly defined as <2 mg dissolved oxygen/L) in Baltic coastal waters. They identified 115 sites with at least episodic hypoxia and highlighted an “alarming trend of steadily increasing hypoxia since the 1950s.” However, is this the full story, or is hypoxia nonetheless quantitively underestimated?
Hypoxia has well-documented societal and economic consequences, particularly for fish stocks, as highlighted in both global (e.g., Diaz and Rosenberg, 2011; Kim et al., 2023) and Baltic Sea contexts (Rosciszewski-Dodgson and Cirella, 2024). Its environmental impacts, such as disruption of biogeochemical processes, degradation of benthic habitats, and declines in species diversity, are well documented (e.g., Zhang et al., 2010; Villnäs et al., 2012). In Eckernförde Bay, for instance, Dietze and Löptien (2021) linked fish kills to hypoxia, while Carstensen and Conley (2019) addressed the same event from a broader perspective. During the summer 2018, hypoxia conditions led to a loss of benthic fauna and finally caused collapse of the benthic community, disrupting sediment bioturbation and bio-irrigation in Eckernförde Bay.
Another major consequence of oxygen depletion is the enhanced release of phosphorus from sediments, a process known as internal eutrophication (e.g., Smolders et al., 1995). In coastal waters, phosphorus is partly bound to iron oxides; under hypoxic and especially anoxic, oxygen-free conditions, iron oxides are reduced, releasing phosphorus into the water column. Frequent oxygen fluctuations promote the transformation of organic phosphorus into Fe-phosphate minerals (Carstensen et al., 2014). This internal eutrophication has been widely observed in the open Baltic Sea (Mort et al., 2010; Schneider, 2011), shallow Baltic areas (e.g., Tammeorg et al., 2020; Helminen, 2025) Baltic lagoons and bays (e.g., Stoicescu et al., 2020) but also in many lakes (Søndergaard et al., 1999; Zhao et al., 2024). In sediment core experiments from Lake Erie, Anderson et al. (2021) observed a phosphate (PO4) release up to 65 µmol P m−2 day−1 from sediments under oxic and hypoxic conditions. Similarily, Eglīte et al. (2014) found phosphorus release rates of 100 µmol P m−2 day−1 under hypoxia in laboratory experiments supported by modeling for Riga Bay.
Since hypoxia not only has a negative impact on biodiversity (Vaquer-Sunyer and Duarte, 2008) and eutrophication, it is highly relevant for coastal and marine policy. It directly affects implementation of the EU Water Framework Directive (WFD, 2000/60/EC) and the Marine Strategy Framework Directive (MSFD, 2008/56/EC), which aim to ensure a good ecological and environmental status in European waters. Oxygen is a core quality indicator under both frameworks, and hypoxia negatively impacts ecosystem quality assessments (e.g., Piehl et al., 2023). In the Baltic Sea, these policies are supported by the Helsinki Convention and the Baltic Sea Action Plan (BSAP) (HELCOM, 2021), which set target limits for external nitrogen and phosphorus loads. However, the underlying load calculations do not account for episodic high phosphorus inputs from coastal waters during hypoxia, despite their known potential to exacerbate eutrophication (Stigebrandt and Andersson, 2020). Thus, a more detailed understanding of hypoxia and its quantitative impacts on phosphorus-release remains crucial.
Conley et al. (2011) based their assessment of hypoxia on existing oxygen monitoring data. Among the 24 sites in German Baltic coastal waters, hypoxia was reported at only two locations, near Eckernförde and in the Pomeranian Bay. This suggests that hypoxia is not a major concern in German waters. However, evidence suggests otherwise. For instance, in the large, shallow Oder/Szczecin Lagoon at the German-Polish border, Conley et al. (2011) reported episodic hypoxia only at the river mouth in Poland, despite five other existing sampling locations. In contrast, clear signs of hypoxia, such as temporary mussel and fish kills, have been observed in different parts of the lagoon, but are not published. As another sign, Schernewski et al. (2011) estimated that in August 2000, phosphorus release from lagoon sediments exceeded riverine inputs by a factor of four, indicating strong sedimentary phosphorus fluxes. Yet, while water column phosphorus concentrations showed unusually high peaks, oxygen data above the sediment did not indicate hypoxia. Could this indicate that existing monitoring data that does not capture conditions closer than 1 m to the seafloor is insufficient and underestimates the spatial and temporal extent of hypoxia?
Fredriksson et al. (2024) collected continuous high-resolution oxygen data less than 1 m above the sediment at a Baltic coastal site. In contrast to standard monitoring data, their observations revealed temporary hypoxia in thin bottom layers. The authors concluded that “transient benthic hypoxia is much more common than routine monitoring data indicate.” Hypoxia’s high spatiotemporal variability is not captured with conventional monitoring approaches. For example, the German coastal monitoring program (LUNG, 2016) measures oxygen only every 4 weeks, at 1 m depth and 1 m above the sediment. Fredriksson et al. (2024) demonstrated that this methodology is insufficient for detecting hypoxia. Implementing high-frequency oxygen profiling at multiple locations over long periods is logistically challenging and hardly realistic. Further, it would provide information for only one spot. Beside the duration, the spatial extent of hypoxia is crucial. A better knowledge of the spatio-temporal behavior of hypoxia is the basis for an improved ecological assessment of coastal waters.
Consequently, new approaches are required that allow a retrospective analysis of hypoxia in coastal waters as well as an assessment of present and future situations. We address this challenge and apply and test alternative approaches, conducting a retrospective analysis of oxygen depletion in the large, shallow Oder/Szczecin Lagoon. We employ two methods: (1) We utilize long-term monitoring data (40 years) of phosphorus in the water column, assuming that when oxygen is fully depleted, anoxia results in a fast P-release into the water body that remains visible in the data over weeks and can serve as proxy for hypoxia and (2) carry out long-term simulations with a 3D-ecosystem model, adapted for coastal waters.
Our objectives are to (a) analyze long-term oxygen monitoring data and assess shortcomings; (b) test an alternative method for hypoxia assessment, using phosphorus concentrations as a proxy; (c) employ a 3D-model for a complementary assessment of the spatial extent and duration of hypoxia and anoxia as well as sedimentary phosphorus release (d) combine the results to obtain an estimate of frequency, spatial extent and duration of hypoxia and anoxia as well as the quantity of internal eutrophication and (e) discuss the consequences and discuss steps towards an improved hypoxia assessment method.
2 Case study and methods
2.1 Case study–The Oder/Szczecin lagoon
The Oder Lagoon (German) or Szczecin Lagoon (Polish) (53°48′ N, 14°08′ E) is located at the German/Polish border in the southern Baltic Sea and is one of the largest lagoons in Europe. It covers an area of 687 km2, with an average depth of 3.8 m and a natural maximum depth of 8.5 m (Radziejewska and Schernewski, 2008), while it reached 10.5 m in the shipping across the lagoon. The average water residence time is about 3 months in the Kleines Haff and around 1 month in Wielki Zalew. Approximately 40% of the lagoon, known as the “Kleines Haff” lies in Germany and 60%, referred to as the “Wielki Zalew” is located in Poland (Figure 1a).
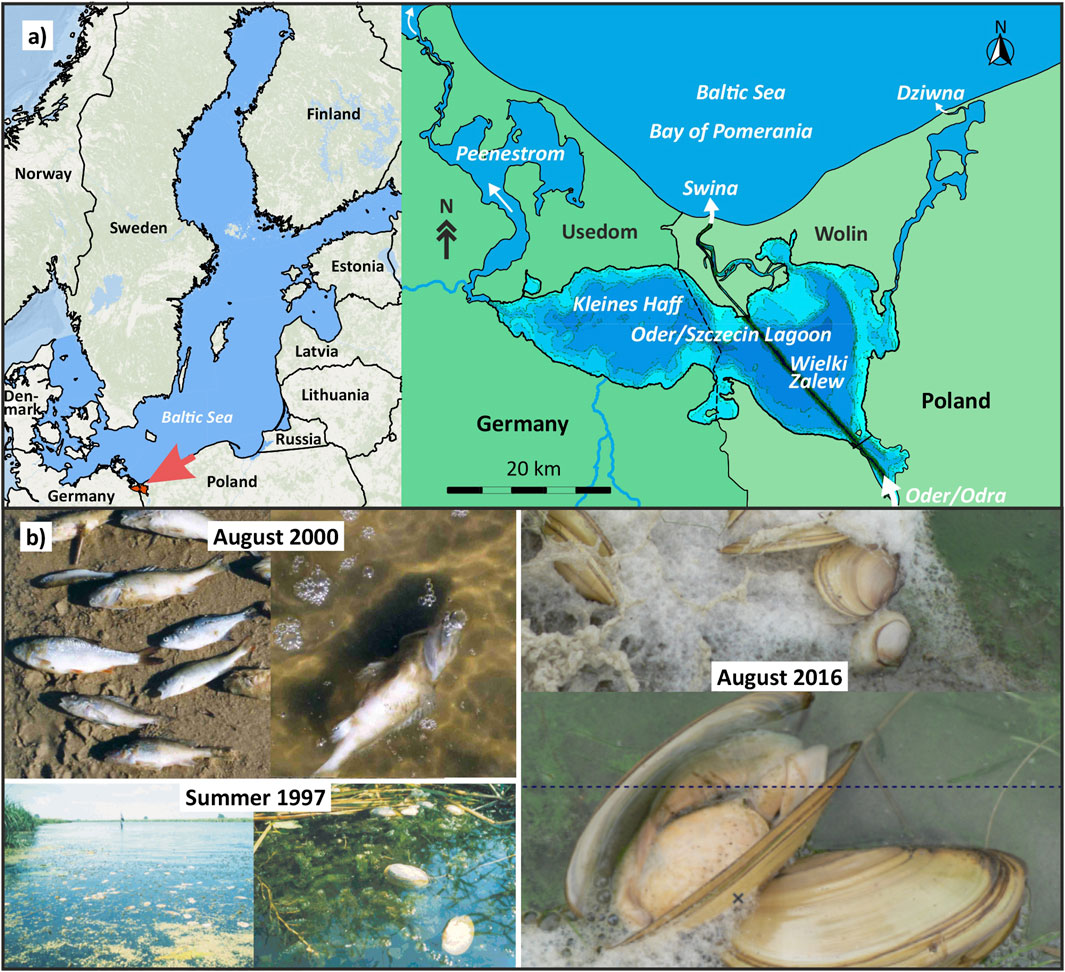
Figure 1. (a) Location of the Oder/Szczecin Lagoon (Baltic Sea) at the German/Polish border; (b) Organism kills very likely resulting from hypoxia in the Oder Lagoon: Floating dead mussels in the southern lagoon in summer 1997 (Fotos: M. Zettler); Large scale fish kill in the German part of the lagoon in August 2000 and mussel kill in the Neuwarper See, the southern bay of the lagoon.
The Oder Lagoon drains into the Baltic Sea through three outlets, with roughly 70% of the outflow passing through the dredged Świna shipping channel (Mohrholz and Lass, 1998). Its salinity of less than 3 PSU and low spatial salinity gradients indicate that significant intrusions of Baltic water into the lagoon are rare. If they happen, they are limited to the area were the shipping channel leaves the lagoon.
The lagoon is classified as hypertrophic by the OECD (1982) system, and its current eutrophication status is rated as “bad” according to the latest HELCOM assessment (HELCOM, 2023c). Under the European Water Framework Directive (WFD), which also considers the status of benthic flora and fauna, the lagoon’s ecological quality is classified as “insufficient” (IKSO, 2022).
The main driver of the lagoon’s poor ecological condition is the high nutrient input from rivers, predominantly the Oder River (Polish: Odra). With a catchment area of approximately 120,000 km2, accounting for 7% of the entire Baltic Sea drainage basin, the Oder contributes over 95% of the lagoon’s water inflow and nitrogen (N) and phosphorus (P) loads.
Between 1995 and 2019, the average water discharge into the lagoon was 518 m3/s, with mean nutrient loads of 46,266 tons total nitrogen (TN) per year and 1,635 tons total phosphorus (TP) per year (Neumann et al., 2025). To achieve good ecological status in the Baltic Sea, the HELCOM Baltic Sea Action Plan (HELCOM, 2013) demands reducing annual nutrient inputs from the Oder River to 48,850 t TN/a (1,570 t TP/a). The most recent internationally agreed nutrient input ceilings are 49,298 t TN/a and 1,554 t TP/a (HELCOM, 2023a). According to the German thresholds (2.6 and 0.1 mg TP/L) (BLANO, 2014) for a good water quality in the river, the corresponding river loads would amount to roughly 44,000 t TN/a (1,700 t TP/a). In recent years (2015–2019), observed nutrient inputs to the lagoon were 37,077 and 1,449 t TP/a, meaning they met all legal thresholds for both river and marine water quality.
However, despite meeting legal nutrient targets, the lagoon still fails to achieve a good eutrophication status. This discrepancy suggests that current thresholds may not be sufficient for improving the lagoon’s ecological condition.
2.2 Monitoring data and calculations
The official monitoring of water quality is a legal obligation and is subject, among other things, to the regulations of the Water Framework Directive (WFD), the Marine Strategy Framework Directive (MSFD), as well as the monitoring guidelines of the Helsinki Commission (LUNG, 2024). The requirements of the WFD have been legally implemented in Germany through the Oberflächengewässerverordnung (OGew, 2016). For the Oder/Szczecin Lagoon, a joint monitoring program has been developed for the Szczecin Lagoon by the German-Polish Border Waters Commission. Presently, in both the German and Polish parts of the lagoon, three stations each are sampled monthly, 1 m below the surface and 1 m above the bottom (in the German part, only at station M near-bottom sampling takes place). The nutrients nitrogen and phosphorus, as well as oxygen and other water quality parameters (LUNG, 2024), are determined according to various DIN EN ISO standards. All laboratories investigating the border waters operate under an established quality system, certified according to ISO 17025, and use reference or equivalent methods (Grenzgewässerkommission, 2024). Comparative measurements between the German and Polish laboratories are conducted every 2–3 years to ensure the quality of the measurement results. The detection limit is 0.01 μmol/L for PO4-P and 0.1 μmol/L for NO3-N. Only in some years the limit was 0.05 μmol/L NO3-N. The location of the stations is shown in Figure 2.
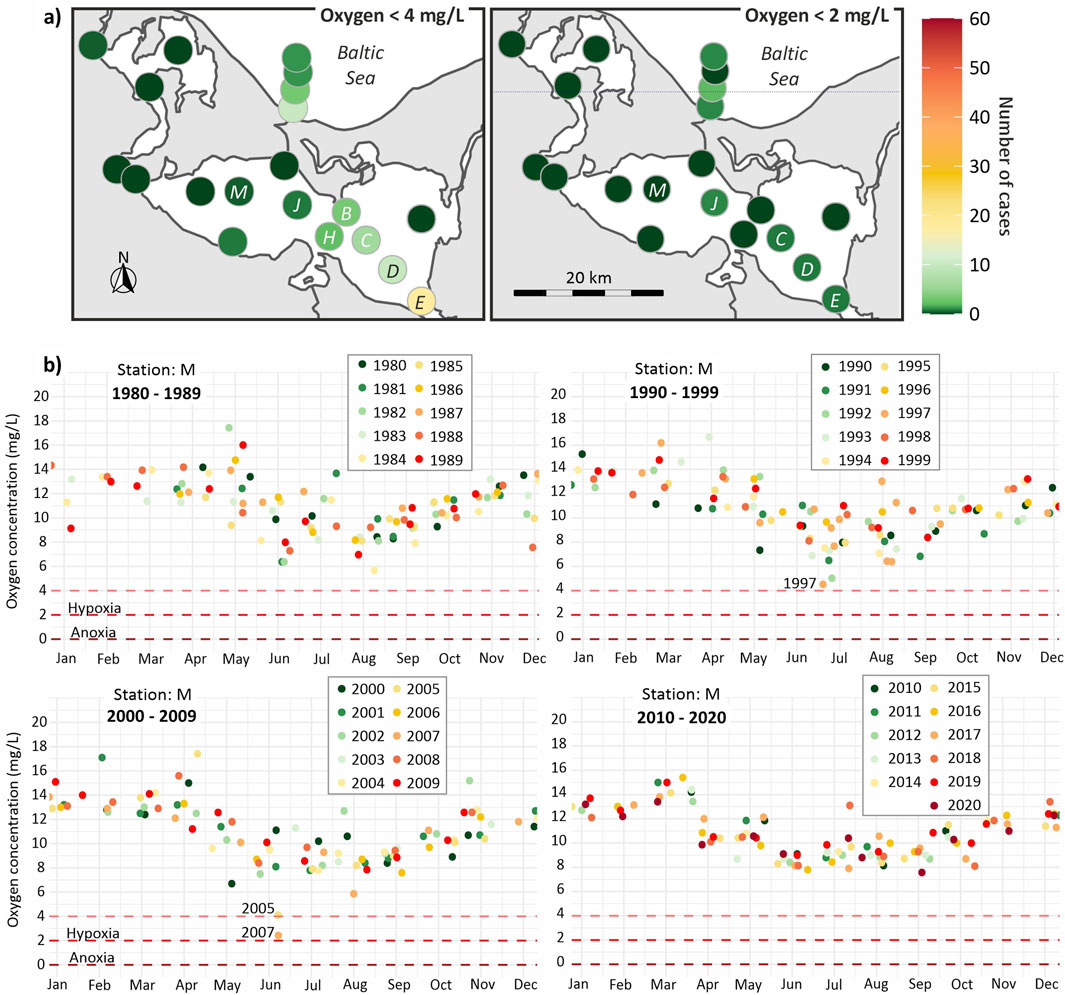
Figure 2. (a) Absolute number of measured oxygen concentrations below 4 mg/L and below 2 mg/L (hypoxia) in a water depth deeper than 1 m in the Oder Lagoon and surrounding waters during the period 1980–2020. (b) Oxygen data of the Oder Lagoon (station M) 1 m above the sea floor for the years 1980 until 2020.
For estimating the amount of summerly phosphate (PO4-P) release under anoxic conditions, monitored PO4-P concentrations in a water depth of 1 m during the period mid-June to mid-September were taken into account. The highest increase in concentrations at station M between two following sampling dates was used. In years were an ongoing increase occurred over two sampling dates, the concentration difference between two sampling dates was used. The concentration difference was re-calculated into tons PO4-P for the entire lagoon, using a lagoon volume of 2,580 mm3. The result is considered as the maximum summerly PO4-P increase. Since the time intervals for these calculated maximum concentration increases differed, the values were additionally re-calculated into monthly values for making the results of different years better comparable. For this, the maximum release was divided by the number of days between two resp. three sampling dates, during which the release occurred, and multiplied by 31. Additionally, the area-specific release (µmol P m−2 day−1) was calculated using the total lagoon surface area of 687 mm2.
Since phosphorus is not a limiting factor for phytoplankton growth during summer, we assumed that released phosphate largely remains in the water. In every summer, a slight increase in phosphate surface water concentrations is observed during summer. This indicates that phosphate removal by phytoplankton uptake and possible precipitation is overcompensated by phosphate release due to organic matter mineralization. We estimated the average mineralization rate from the 10 years with the lowest observed summer increases in summer phosphate. This rate amounts to approximately 0.15 µmol P m−2 day−1, or 100 tons of P per month for the entire lagoon. The loss of P to the Baltic Sea by water exchange has been neglected. For these low-activity years, it is assumed that anoxic conditions and internal eutrophication were minimal or absent. Consequently, the difference between the observed summer phosphate peak and the estimated background mineralization is interpreted as the amount of phosphorus released due to internal eutrophication, likely triggered by anoxic or at least hypoxic conditions in bottom waters. These calculations appear reasonable, as other potential sources and sinks of phosphorus play only a secondary role in the overall phosphorus balance of the lagoon, as will be demonstrated later.
2.3 The 3D-ecosystemmodel ERGOM
We applied the 3D biogeochemical model ERGOM (Ecological ReGional Ocean Model) (Neumann et al., 2022). The circulation component is based on the Modular Ocean Model (MOM5.1), while the biogeochemical component employs ER-GOM version 1.2. For this study, the model was specifically adapted for the Oder Lagoon, featuring a high horizontal grid resolution of 150 m. The vertical structure consists of 28 layers, with thicknesses ranging from 25 cm at the surface to 50 cm near the bottom (Neumann et al., 2025). Open boundary conditions from an earlier 2 km resolution ERGOM model run covering the entire Baltic Sea were applied at the lagoon’s three outlets connecting to the Baltic Sea.
The included biogeochemical cycles, processes, state variables and constants are documented in Neumann et al. (2022). The original model includes three functional phytoplankton groups, called diatoms, flagellates and cyanobacteria. For applications in the lagoon, an additional limnic phytoplankton group was introduced, which growths under very low salinity and has an increased light sensitivity. These four groups were well able to represent the annual course and amount of phytoplankton biomass in the lagoon. Chlorohyll-a was calculated by summing up the phytoplankton biomass, multiplied with a constant chlorophyll to carbon mass ratio of 40 (Neumann et al., 2025). The model incorporates temperature- and oxygen-dependent mineralization processes, releasing dissolved inorganic nitrogen and phosphorus from organic matter in both the water column and sediment. Oxygen is produced through primary production and consumed during metabolism and mineralization. Additionally, extracellular excretion by phytoplankton leads to non-Redfield carbon uptake. In oxygen-rich conditions, phosphate binds with iron oxides to form particles that settle in sediments. These particles can be resuspended by erosion and redistributed by currents to deposition zones. Under anoxic conditions, iron oxides are reduced, releasing dissolved phosphate back into the water. The amount of phosphorus released under anoxic conditions depends on the release rate and the available FePO4 sediment pool. In order to represent temporary high phosphorus concentration during summer, we carried out pre-studies, where we increased the release rates and the available FePO4 sediment pool. While the release rate was less important, an increased FePO4 sediment pool allowed a better representation of summer peaks. However, suitable data on phosphorus in sediments, the share of FePO4 and its spatial distribution in the lagoon does not exist (reflecting pollution history). Therefore, we avoided a model modification and used the original parametrization, that 10% of this FePO4 pool is released during one anoxic day, as documented in (Neumann et al., 2022), being aware that the model would not well represent the internal eutrophication process.
ERGOM was recently evaluated by the European Commission (European Commission, 2022) and rated as one of the best marine biogeochemical and lower trophic level models in Europe. The lagoon model validation and application are presented in (Neumann et al., 2025).
Data on discharge and riverine nutrient loads from the Oder, Uecker, and Zarow Rivers were supplied by the Instytut Meteorologii i Gospodarki Wodnej and Friedland et al. (2019). Meteorological data were sourced from the coastDat-3 dataset and the Norwegian Meteorological Institute (Geyer and Rockel, 2013). The wind data is provided as hourly averages for a height of 10 m and in a 12.5 km spatial grid. The wind velocities were corrected for the sea surface using a logarithmic boundary layer structure. Coastal wind shelter effects near the shoreline were not taken into account. All model data was stored as 2-day averages, which were considered as sufficient for this research question and enabled a long-term data storage.
3 Results
3.1 Hypoxia in long-term monitoring data
Long-term monthly monitoring data indicate that oxygen concentrations below the hypoxia threshold of 2 mg/L were rarely observed in the western part of the Oder Lagoon (the Kleines Haff) between 1980 and 2021. Figure 2 provides an overview of the available data from station M, centrally located in the Kleines Haff, where measurements were typically taken 1 m above the sediment at a depth of 4.5 m. This station was selected due to the completeness of its long-term dataset. While 2 mg O2/L is a commonly used threshold for hypoxia, Vaquer-Sunyer and Duarte (2008) argue that this level is already below the sublethal and lethal thresholds for many benthic species. For this reason, we also highlight oxygen concentrations below 4 mg O2/L, a more ecologically relevant threshold. Furthermore, HELCOM (2023b) recommends an even more conservative precautionary value of 6 mg O2/L for mixed coastal waters.
Despite some notable drops in oxygen saturation (not shown), 46% in July 2007, 43% in June 2005, and 29% in June 2007, measured oxygen concentrations at station M never fell below the 2 mg/L hypoxia threshold. However, at station J, located near the German–Polish border, hypoxic conditions were observed once, in July 2001, with an oxygen concentration of 1.8 mg O2/L and an oxygen saturation of 20% at a depth of 5.3 m.
In the Pomeranian Bay, near the mouth of the Świna Channel, which connects the Oder Lagoon to the Baltic Sea, hypoxia occurs only occasionally, typically triggered by upwelling events. However, these instances have no measurable impact on the lagoon itself, particularly not on the Wielki Zalew, the eastern part of the lagoon. Within the Wielki Zalew, hypoxic conditions were recorded only twice: once in July 1992 at station C, and again in July 2006 at stations D and E (not shown). Nevertheless, oxygen concentrations below 4 mg/L, which indicate a risk of hypoxia, were observed more frequently: 10 times at station D and 18 times at station E. This elevated occurrence of low oxygen levels is likely linked to the influence of the Oder River and the shipping channel, which increases water depth locally to 10.5 m.
Overall, the monitoring data suggest that hypoxia is extremely rare across the entire Oder Lagoon and adjacent western coastal waters. Even suboptimal oxygen conditions (<4 mg/L) are infrequent and generally limited to isolated events in the eastern bay of the lagoon. Since 2007, no instances of low oxygen concentrations have been recorded in the lagoon.
3.2 Evidence of hypoxia–organism death
Figure 1b presents examples of fish and mussel mortality events observed during the summers of 1997, 2000, and 2016, which are most likely linked to hypoxic conditions. While alternative causes, such as toxic cyanobacterial blooms, cannot be entirely ruled out, they are considered unlikely, as no widespread harm to other organisms was reported during these events. Notably, all documented incidents were observed by chance and were not part of any systematic data collection or investigation. These occurrences were confined to the Kleines Haff or connected bays.
According to Vaquer-Sunyer and Duarte (2008), sensitivity to hypoxia varies among benthic organisms—fish being the most sensitive, followed by crustaceans, worms, echinoderms, and molluscs. Therefore, observed mussel die-offs are a strong indication that prolonged hypoxia may have occurred. When comparing these mortality events to the available oxygen monitoring data, only the mussel mortality in 1997 aligns with reduced oxygen concentrations measured at station M in the Kleines Haff (see Figure 2b). For other years, such as 2005 and 2007, where similarly low oxygen concentrations were recorded, no organism mortality was reported, likely due to a lack of observations than the absence of events. This discrepancy suggests that hypoxia and related organism mortality likely occurred more frequently over past decades, but systematic reporting and documentation are lacking. As such, only a few of these events can be directly correlated with measured bottom oxygen levels in the central lagoon.
3.3 Evidence of hypoxia–phosphorus as a proxy
Assessing to what extent extreme summer phosphate concentrations can serve as proxy for internal eutrophication and subsequently for anoxia, requires a more comprehensive analysis, as nutrient concentrations are influenced by multiple interacting factors, including external inputs, mineralization processes, and phytoplankton uptake.
Figure 3 offers essential context on the ecological state and nutrient dynamics of the lagoon. Since the early 1980s, total nitrogen (TN) loads from the Oder River have declined significantly, from up to 100,000 t/year to approximately 40,000 t/year today. Total phosphorus (TP) loads have followed a similar trend, decreasing from around 9,000 t/year to roughly 2,000 t/year. Based on the Redfield ratio (N/P mass ratio ≈ 7), Figure 3a is scaled to illustrate that the Oder River delivers excess nitrogen relative to phosphorus to the lagoon (TN above the TP curve). The high interannual variability in these nutrient loads mainly reflects fluctuations in river discharge, as the average annual nutrient concentrations remain relatively stable over short timescales and shift appreciably only over decades.
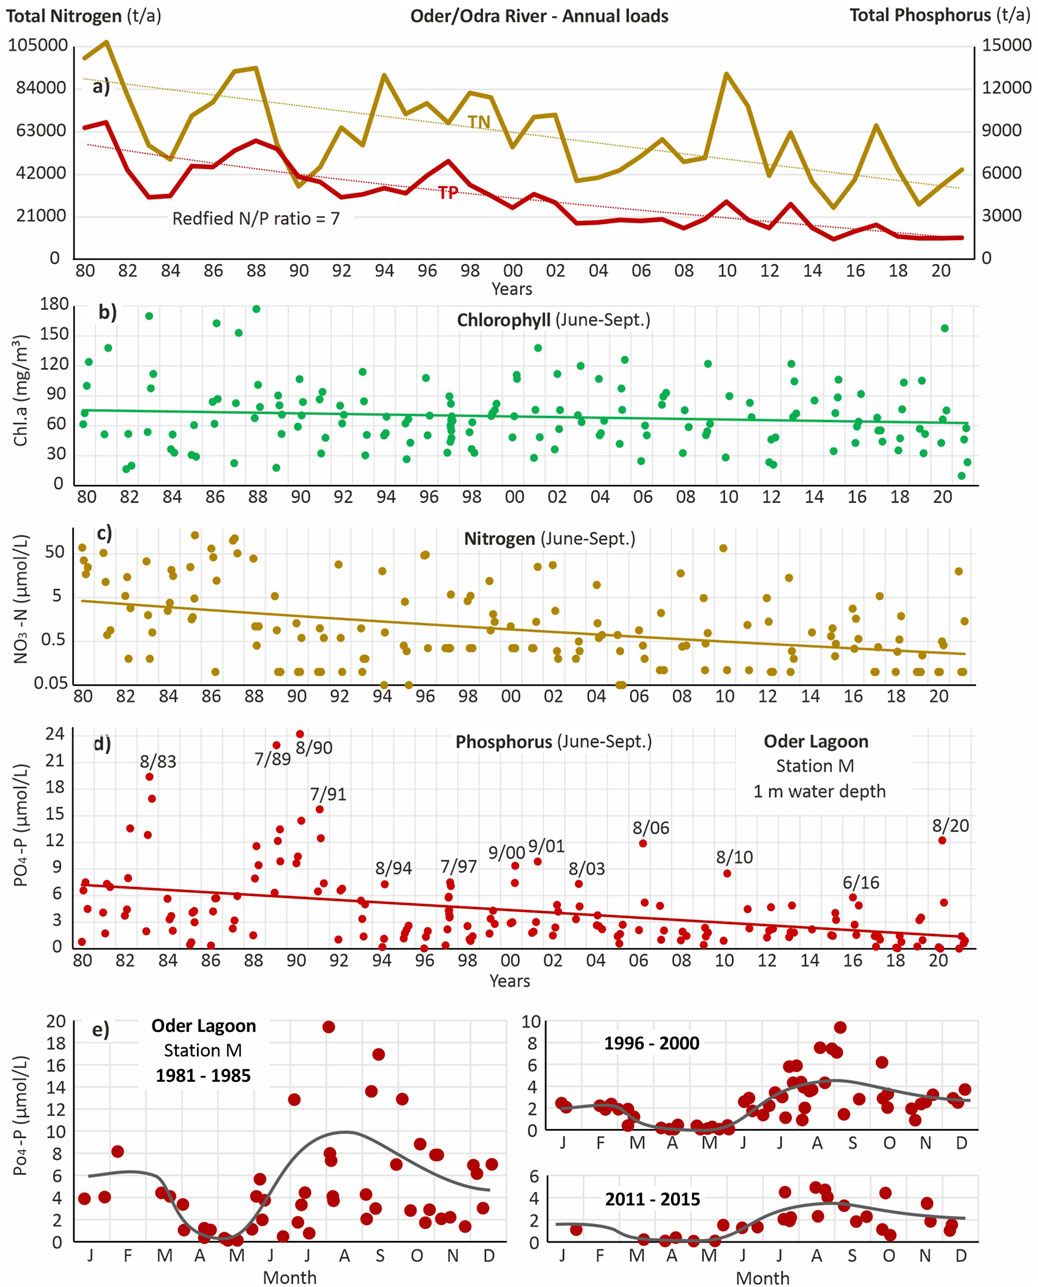
Figure 3. (a) Annual loads (1980–2021) of total nitrogen (TN) and total phosphorus (TP) entering the Oder Lagoon with the Oder/Odra River (after Friedland et al., 2019). (c, d) Monitoring data of (b) chlorophyll-a, (c) nitrate (NO3-N) (log. Scale) and (d) phosphate (PO4-P) concentrations at station M in the Kleines Haff in a water depth of 1 m (e) Annual courses of phosphate concentrations during three periods, 1981–1985, 1996–2000 and 2011–2015. The detection limit is 0.1 μmol/L for NO3-N in most years.
Long-term trends are presented for station M in the central western Kleines Haff, which offers the most complete dataset (Figure 3). Located approximately 50 km off the Oder River mouth, this station is not directly influenced by immediate river inputs. Despite the significant reductions in nitrogen and phosphorus loads over the past 4 decades, summer chlorophyll-a concentrations (June–September) show only a modest decline (Figure 3b). This suggests that phytoplankton biomass during summer has not responded proportionally to the decreased external nutrient inputs. In fact, the sustained high chlorophyll-a levels, even as nitrogen and phosphorus concentrations dropped sharply (Figures 3c,d), imply that nutrient availability, especially phosphorus, remained sufficient to support algal growth.
However, there were periods, particularly in the early 1990s and after 2007, when nitrogen concentrations approached detection limits, indicating temporary nitrogen limitation during summer.
Figure 3e illustrates the average annual phosphate concentration cycle in the lagoon. In the early 1980s, phosphate concentrations declined through April and May, reaching a minimum, followed by a marked increase during summer and a slight decrease in autumn. This seasonal pattern is also evident in the late 1990s and early 2010s. With decreasing external phosphorus inputs, the duration of low springtime phosphate concentrations has extended, now lasting approximately 3 months (2011–2015). However, despite this extended period of low phosphorus, there is still no clear indication of phosphorus limitation on phytoplankton biomass (as measured by chlorophyll-a) in late spring.
Overall, the lagoon appears to be transitioning towards a nutrient-limited system, assuming current trends of declining riverine nutrient inputs continue. One critical factor constraining phytoplankton biomass is light availability. At station M, average summer Secchi depth ranges from 0.4 to 0.8 m. During periods of high phytoplankton biomass, self-shading reduces Secchi depth to 0.3 m or less (not shown), further limiting light penetration.
With declining phosphorus loads and falling ambient phosphate concentrations, extreme summer phosphate peaks have become less frequent and less intense (Figure 3d). For instance, while concentrations exceeding 20 µmol PO4-P/L were recorded in 1989 and 1990, the highest value in the past 15 years was 12 µmol PO4-P/L in 2020. Notably, these extreme values do not correlate with annual external phosphorus loads. On the contrary, the high summer phosphate concentration in 1990 occurred during one of the lowest-loading years of the 1980s and 1990s—a pattern repeated in 2020.
Interestingly, these elevated summer phosphate concentrations are not accompanied by corresponding increases in chlorophyll-a levels, indicating that phosphorus availability alone does not drive phytoplankton biomass. These high phosphate values consistently occur in late summer, and in several years, a sharp increase in concentrations is observed between late spring and summer (Figure 3d). One might expect phosphorus levels to gradually increase between autumn and winter due to ongoing mineralization in the water column and the sediment as well as reduced uptake, but the Oder Lagoon shows a different pattern: phosphate concentrations peak in summer and then decline toward winter (Figure 3e).
The period 1988 to 1991 stands out for exceptionally high summer phosphate concentrations (Figure 3d), a trend also reflected in total phosphorus data, which includes phosphorus bound in organic material (Figure 4a). Between June and August, total phosphorus levels increased by over 400%, with the share of inorganic phosphorus rising from ∼10% to over 70% during this time (Figure 4b).
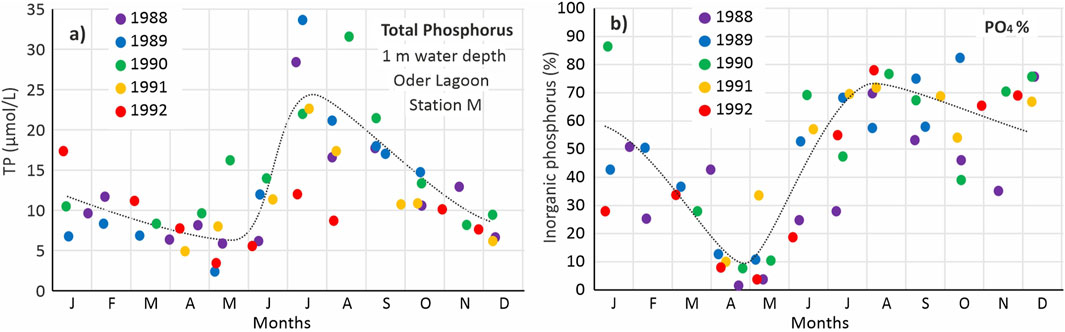
Figure 4. (a) Annual course of total phosphorus (TP) concentrations and (b) relative share (%) of inorganic phosphate (PO4-P) at station M in the Kleines Haff in a water depth of 1 m in the years 1988 until 1992.
Three main processes could potentially explain these summer peaks in phosphorus: External riverine loads (not shown), intensive mineralization of organic material and internal eutrophication by the sediment. The riverine phosphorus loads are lowest in summer (in recent year about 100 t TP/month), do not show strong changes between the months and are quantitatively not high enough to serve as explanation, especially since station M is located over 30 km off the river mouth. During summer, phosphorus bound in organic matter is mineralized and steadily increases the share of inorganic phosphorus until winter, where the share should reach the maximum. However, steady mineralization cannot account for the sudden and steep increases observed in certain years (e.g., 1989 and 1990), and the absence of such peaks in others (e.g., 1992) (Figure 4).
The only process that plausibly explains the steep increases in inorganic phosphorus concentrations during several summer periods is internal eutrophication, the rapid release of iron-bound sedimentary phosphorus under temporary anoxic conditions just above the sediment. This is typically followed by wind-induced mixing, which redistributes the released phosphate throughout the water column. Since phosphorus is already abundant in the lagoon after June, the additional phosphate remains in the water body and undergoes gradual precipitation in the second half of the year. This mechanism explains the decrease in phosphorus concentrations toward winter, as phosphate is re-bound to oxidized iron complexes and partly flushed out of the lagoon, ultimately entering the Baltic Sea.
A comparison of phosphorus concentrations in surface waters and at 5 m depth (approximately 1 m above the sediment), available only after 1993 and only for station M, shows little evidence of strong vertical gradients (not shown). In several summers, small gradients of about 1 μmol P/L were observed (e.g., 1997, 2008, 2011, 2012, 2013, and 2015). Only in 2004 and 2007 more pronounced gradients were recorded, above 2 and 4 μmol P/L, respectively. However, no concurrent thermal stratification was detected in any of these years, based on temperature monitoring data.
These findings suggest that temporary anoxic conditions do occur in the lagoon and can result in substantial phosphorus release from sediments. However, the monitoring data do not directly confirm such events, nor do they reveal persistent vertical stratification in the water column that could facilitate prolonged anoxia. Supporting this, Puttonen et al. (2016) noted that PO4-P concentrations measured 1 m above the seafloor often fail to reflect the true conditions at the sediment–water interface.
3.4 Spatial pattern of phosphorus concentrations
How spatially representative is the data from central station M in the Kleines Haff, and can the results be extrapolated to quantify internal eutrophication across the entire western lagoon or even the entire Oder Lagoon?
For the years with the highest recorded summer phosphate (PO4) concentrations, 1989 and 1990, data are available from only six stations within the Kleines Haff. On 11 July 1989, station M recorded 23.0 μmol P/L, while concentrations at the other stations ranged from 16.4 to 25.5 μmol P/L. On 16 August 1990, station M showed 24.2 μmol P/L, with values at the remaining stations ranging between 15.7 and 21.5 μmol P/L. In some cases, the maximum concentration occurred at a later sampling date at other stations. These findings suggest that wind-driven transport and vertical mixing processes effectively distribute phosphate throughout the water body of the Kleines Haff. Therefore, phosphate data from station M can be considered spatially representative of the western lagoon under typical summer conditions.
Figure 5 provides an overview of spatial phosphate concentrations in the entire lagoon for selected years with good data availability and based on all stations. In April, all years display a concentration gradient—with generally lower values in the western lagoon due to phytoplankton uptake, and higher concentrations in the eastern parts near the Oder River mouth, where riverine input continuously replenishes phosphate. By contrast, summer phosphate concentrations are markedly higher in all years, and their spatial distribution is more uniform, showing no clear or systematic gradients across the lagoon. However, it is important to note that sampling dates between German and Polish stations can differ by up to 2 weeks, and the figures are based on single-date snapshots, which may limit their comparability.
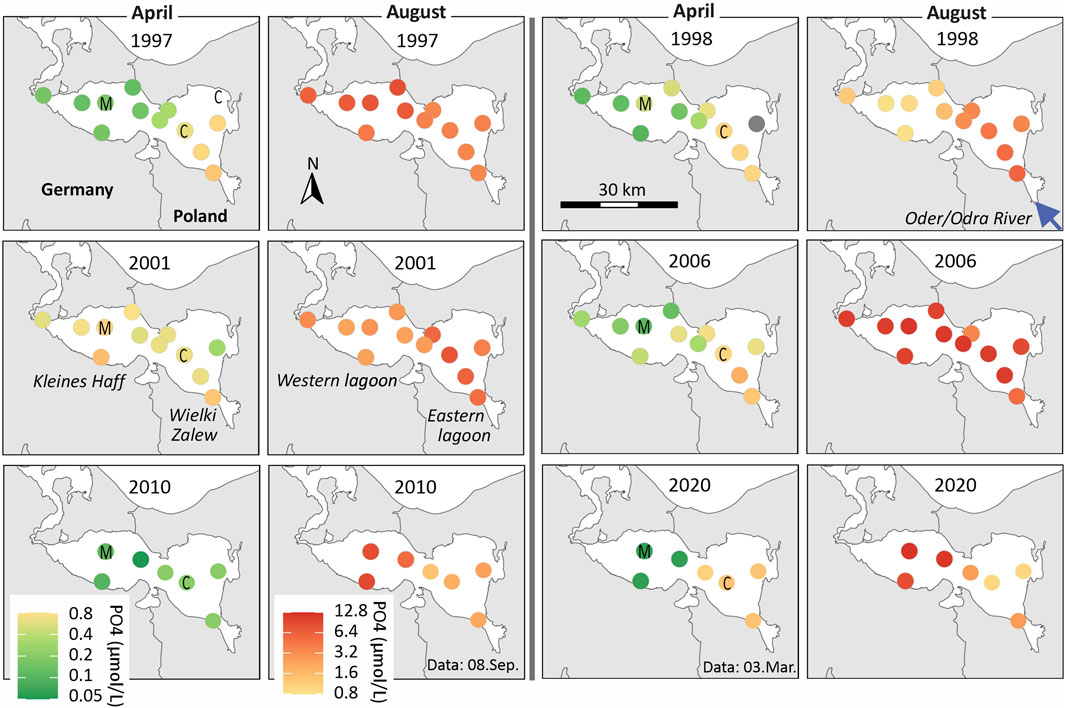
Figure 5. Spatial pattern of near-surface phosphate (PO4-P) concentrations in the Oder Lagoon for selected years. Shown is the data of April and August based on the German and Polish monitoring program. The sampling did not take place on the same date. For 2010 and 2020 lacking Polish data was complemented from neighboring months. Stations M and C are indicated and the blue arrow indicates the entering Oder River. The divided color bars apply to all figures.
Because of these results and data limitations, in the following, we assumed that phosphorus concentrations measured at station M can be used as a proxy for assessing internal eutrophication of the entire lagoon, particularly in summer when phosphate is well mixed and spatial variability is low.
3.5 Quantification of internal eutrophication
Due to the low temporal resolution and limited spatial coverage of the monitoring data, only simplified estimations of phosphorus release under anoxic conditions are possible. Nevertheless, these estimations provide a useful indication of the quantitative relevance of internal phosphorus release and can act as a proxy for the intensity and occurrence of anoxic events. Figure 6 illustrates the estimated summerly internal eutrophication.
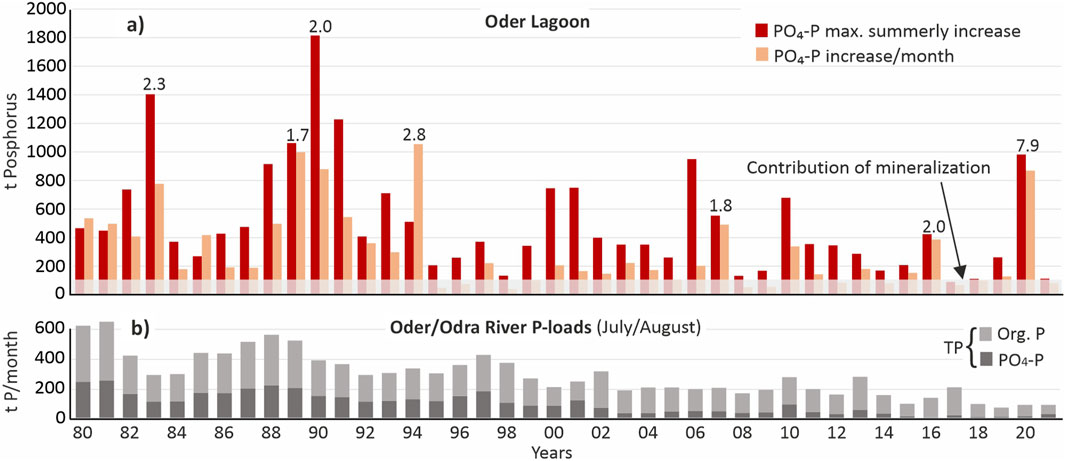
Figure 6. (a) Maximum annual increase in phosphate (PO4-P) concentrations in the entire Oder Lagoon over two or three sampling dates during the summer months for the years 1980–2021 (max. summerly increase) as well as maximum increase in PO4-P concentrations recalculated per month (increase/month). The calculations are based on data of station M extrapolated to the entire lagoon and expressed in tons. The bars indicate the estimated internal eutrophication. The shaded area indicates the estimated PO4-P share resulting from mineralization of organic phosphorus compounds in the water. The numbers above the bars of selected years indicate the factor of which internal eutrophication exceed the average monthly summer total phosphorus (TP) load by the Oder/Odra River. (b) Average monthly organic phosphorus and PO4-P loads by the Oder/Odra River in July and August of the years 1980–2021.
The Oder/Odra River continuously contributes phosphorus loads to the lagoon. From the early 1980s to the 2020s, summer riverine loads have declined significantly, from approximately 600 tons of total phosphorus (TP) per month to about 100 tons per month. Between 1995 and 2021, when more detailed monitoring data is available, TP concentrations in the river dropped from 11 to 5 μmol/L, while phosphate concentrations declined from roughly 5 to 1.5 μmol/L (not shown), a trend consistent with the observed decrease in overall loads. Additionally, the declining share of PO4-P in total phosphorus indicates that primary production within the Oder River and its contributing lakes and tributaries is actively consuming available phosphorus. Given the river’s length of 866 km, water transport from the upper river basin to the lagoon in summer takes approximately 1 week, providing ample time for biological uptake and nutrient processing.
As a result, phosphate concentrations in the river during summer are generally lower than those in the lagoon, meaning the river does not account for the high phosphorus concentrations observed in the lagoon during summer. In fact, the inflow of river water has a diluting effect, especially in the eastern lagoon (Wielki Zalew). This dilution disguises internal eutrophication at station near the river mouth and explains why phosphorus concentrations are typically lower there compared to the western part (Kleines Haff). This gradient is occasionally visible in spatial data (see Figure 5), showing increasing phosphorus concentrations from the river mouth toward the central lagoon. Phosphorus-rich water in the eastern lagoon is continuously flushed into the Baltic Sea, further contributing to lower concentrations there compared to the western bay.
Given this context, it is possible to quantify phosphorus release from the sediment under hypoxic conditions. Between 1980 and 2021, the annual average contribution of internal eutrophication was approximately 190 tons of phosphorus per year. This number is based on the maximum increase per month in Figure 6. By comparison, the average monthly riverine load over the same period was 294 tons TP/month (104 tons PO4-P/month). In several years, such as 1983, 1990, 1994, 2007, and 2016, the phosphorus load from internal eutrophication exceeded the riverine monthly total phosphorus input by approximately 100%, effectively doubling the phosphorus flux to the Baltic Sea during July and August. In 2020, this pattern was even more pronounced, with internal eutrophication surpassing riverine phosphorus inputs by nearly 800% (see Figure 6). Although the absolute quantity of phosphorus released internally appears to have declined from the early 1990s to the 2020s, the process remains frequent and quantitatively significant.
In summary, internal eutrophication is a recurring and important mechanism in the phosphorus dynamics of the Oder Lagoon. It delivers additional inorganic and bioavailable phosphorus to the water column, a portion of which is transported to adjacent coastal waters and the Baltic Sea. This particularly takes place during the summer months when primary production in the Baltic Sea is at its peak and limited by nutrients.
3.6 Model simulations: long-term development of nutrients and phytoplankton
Since monitoring data does not reflect hypoxia and phosphorus peaks in the water allows only a coarse estimation of internal eutrophication, serving as proxy of anoxia, the 3D-ecosystem model was employed. Previous validation studies did show that the model is generally suitable for the Oder Lagoon and provides stable long-term mass balances and represents annual cycles well (Neumann et al., 2025). Here we only focus on relevant parameters and stations for the purpose of this study.
The model captures the effects of long-term reduced external nutrient loads on phytoplankton, with the decline more pronounced near the Oder River mouth at station C compared to station M in the western bay (Figure 7a). Covering the period from 1995 to 2019, the simulation indicates a decrease in summer surface chlorophyll-a concentrations from approximately 75 to 40 μg/L at station C, and from about 55 to 40 μg/L at station M. Correspondingly, the monitoring data for the same period shows a smaller decrease at station M, from about 70 to 63 μg/L.
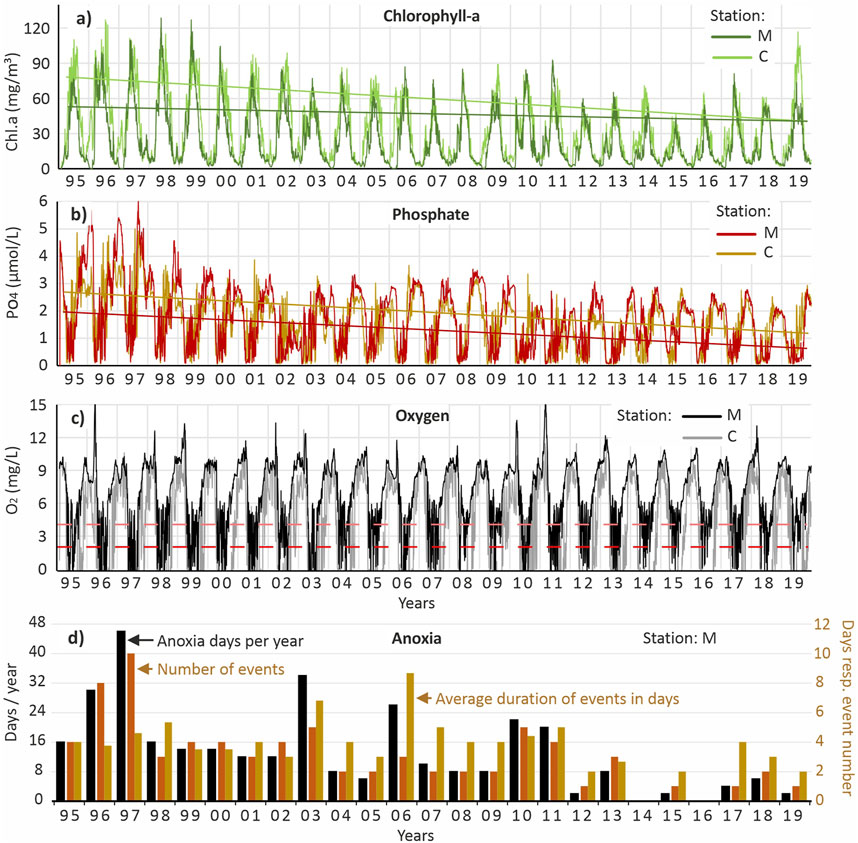
Figure 7. 3D-ecosystem model results covering the years 1995 until 2019 for the stations C (central eastern bay) and M (central western bay) of the Oder Lagoon for the parameters chlorophyll-a (a) and phosphate (PO4-P) (b) for the surface layer as well as oxygen (c) in the bottom layer (0–0.3 m above the sediment). The trend-lines are based on the data for the summer months (June–August). (d) Accumulated number of days with anoxia above the sediment at station M as well as number and duration (days) of anoxia events.
As with the monitoring data, the model suggests only a moderate summer decline in chlorophyll-a at station M. However, the observed data is significantly influenced by occasional extreme peaks, likely caused by small-scale spatial phytoplankton patchiness, whereas the model produces a smoother trend. When disregarding these outliers in the observed data (Figure 3b), model and measurements align closely, suggesting the model is a reliable tool for hindcasting chlorophyll-a dynamics (Neumann et al., 2025).
For near-surface phosphate concentrations during summer (1995–2019), the model simulates a decrease from approximately 2.5 to 1.2 μmol P/L at station C, and from 1.9 to 0.6 μmol P/L at station M (Figure 7b). In contrast, monitoring data at station M shows a decrease from around 4.5 to 1.5 μmol P/L. As with chlorophyll-a, discrepancies between model and observed data are primarily due to a few exceptionally high observed phosphate values. Unlike chlorophyll-a, however, these high phosphate concentrations are not isolated events, resulting from patchiness, they occur across broad areas of the lagoon and are therefore resulting from biochemical processes. Consequently, they should be reflected in the model output. The fact that these extreme phosphate levels are underrepresented, regardless of whether surface or near-bottom layers are considered, suggests that the model underestimates phosphorus release under anoxic conditions. Although the model does account for this process, it appears the observed release is substantially higher than simulated.
The model includes a variable describing the amount of phosphorus bound to iron and for most years this variable shows, in the bottom layer above the sediment, a strong annual cycle with low concentrations during summer and high concentrations in winter (not shown). This suggests that, in the model, iron-bound phosphorus is released in summer and precipitated as FePO4 compounds in autumn and winter again. The phosphorus release from sediments is especially fast under anoxic conditions. This is why we, in the following, focus on anoxic conditions in the bottom layer (0–0.3 m above the sediment), instead of focusing on hypoxia.
3.7 Model simulations: long-term development of oxygen and anoxia
Between 1995 and 2019, the model indicates that anoxia occurred at station M in nearly every year, with the exception of 2014 and 2016 (Figure 7d). Over this 25-year period, a general decline in the total number of anoxic days per year is evident. The highest value was recorded in 1997, with 46 anoxic days, followed by 30 days in 1996 and 26 days in 2006. In each of these years, the model simulates not a single prolonged period of anoxia, but multiple shorter episodes: ten events in 1997 (average duration 4.6 days), eight in 1996 (3.8 days), and three in 2006 (8.7 days).
Since 2011, both the frequency and duration of these events have decreased. According to the model, anoxia is now uncommon at station M. This contrasts with station C in the eastern lagoon, where anoxia remains frequent and persistent. Over the same 25-year period, the number of anoxic days per year at station C ranged from 94 to 178, with long-lasting events (several weeks) still regularly occurring. The high frequency of anoxia at station C is largely due to its location in the artificially deepened Świna shipping channel (10.5 m), where the model simulates reduced bottom water mixing and an accumulation of organic matter. However, this may not represent reality, as the model does not account for the enhanced turbulence and mixing caused by ship traffic.
All simulated anoxia events occur between May and October, with a clear peak in July and August. The model does not simulate winter anoxia, even during cold periods like the winter of 2006/2007 when the lagoon was partially or completely ice-covered.
In principle, station M is well suited for comparing model and observational data. However, a key limitation remains: the model results refer to conditions directly at the sediment–water interface, whereas field measurements are taken 1 m above the sediment. This vertical offset is one likely reason for the poor agreement between model and measured data. Moreover, the model data (representing the layer 0–0.3 m) confirms that anoxia events are brief and confined to thin bottom layers, conditions that are missed by standard monitoring programs.
Overall, the model provides a plausible representation of frequent anoxia in the deeper parts of the lagoon. However, it fails to reproduce the extreme phosphorus concentrations occasionally observed in the field. This suggests a mismatch: while the model supports the occurrence of anoxia and subsequent internal eutrophication, it underestimates the resulting magnitude of phosphorus release. Nonetheless, it reinforces the conclusion that anoxia is a real and recurring phenomenon, and that internal eutrophication is likely, even if not fully captured by the model.
3.8 Model simulations: spatial pattern of hypoxia and anoxia
For selected contrasting years, those characterized by either strong or absent internal eutrophication based on field data, Figure 8 presents the spatial distribution of hypoxia and anoxia as simulated by the model. The results highlight the critical role of the deepened Świna shipping channel across the eastern Oder Lagoon (Wielki Zalew), which emerges as a hotspot for both hypoxia and anoxia. Other deeper parts of the eastern lagoon also experience hypoxia for more than 50 days per year, whereas such conditions are less frequent in the western lagoon.
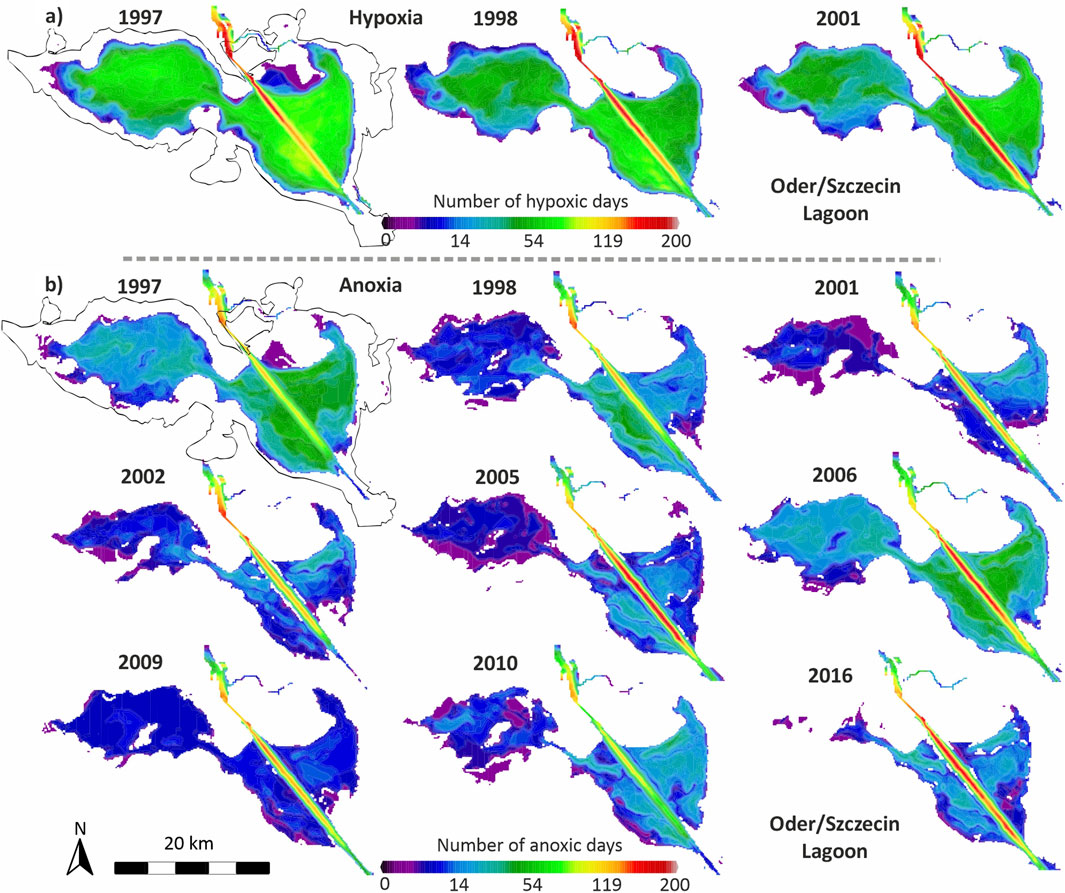
Figure 8. 3D-ecosystem model results representing the accumulated number of days with (a) hypoxia (<2 mg O2/L) and (b) anoxia (0 mg O2/L) in the bottom water layer (0–0.3 m) of the Oder/Szczecin Lagoon for selected years.
Figure 8b illustrates the extensive spatial spread of anoxia, particularly in 1997 and 2006. Overall, the western lagoon appears less affected by anoxia than the eastern section. In 2016, for example, anoxia was absent at station M, a pattern also reflected across much of the western lagoon, while some anoxic conditions persisted in parts of the eastern lagoon outside the main channel. The model also indicates that hypoxia and anoxia are rare in shallow areas with water depths of 2 m or less.
In summary, the spatial model outputs suggest that when hypoxia occurs, it often affects broad areas and may significantly impact benthic fauna on a large scale. Even anoxia can cover extensive zones, potentially enabling substantial phosphorus release from sediments.
3.9 Towards a synthesis
The model suggests that during the period 1995–2019 at station M, on average per year in the bottom layer, 36 days with hypoxia (<2 mg O2/L) and 16 days with anoxia (<0 mg O2/L) (Figure 9d). In contrast, according to the model, the layer about 1 m above the sediment did show only 5.3 days with hypoxia (<2 mg O2/L) and 0.2 days with anoxia (<0 mg O2/L). The model results confirm that oxygen depletion often occurs in the layer immediately above the sediment. The model layer thickness above the sediment is about 0.4 m. It can be expected that thinner anoxic layers are even more common. Furthermore, the model results suggest that anoxic events typically last only a few days and vary greatly in their spatial extent, characteristics that are easily missed by monthly sampling programs. As a result, assessments based solely on monitoring data tend to significantly underestimate the presence and frequency of hypoxic and anoxic conditions.
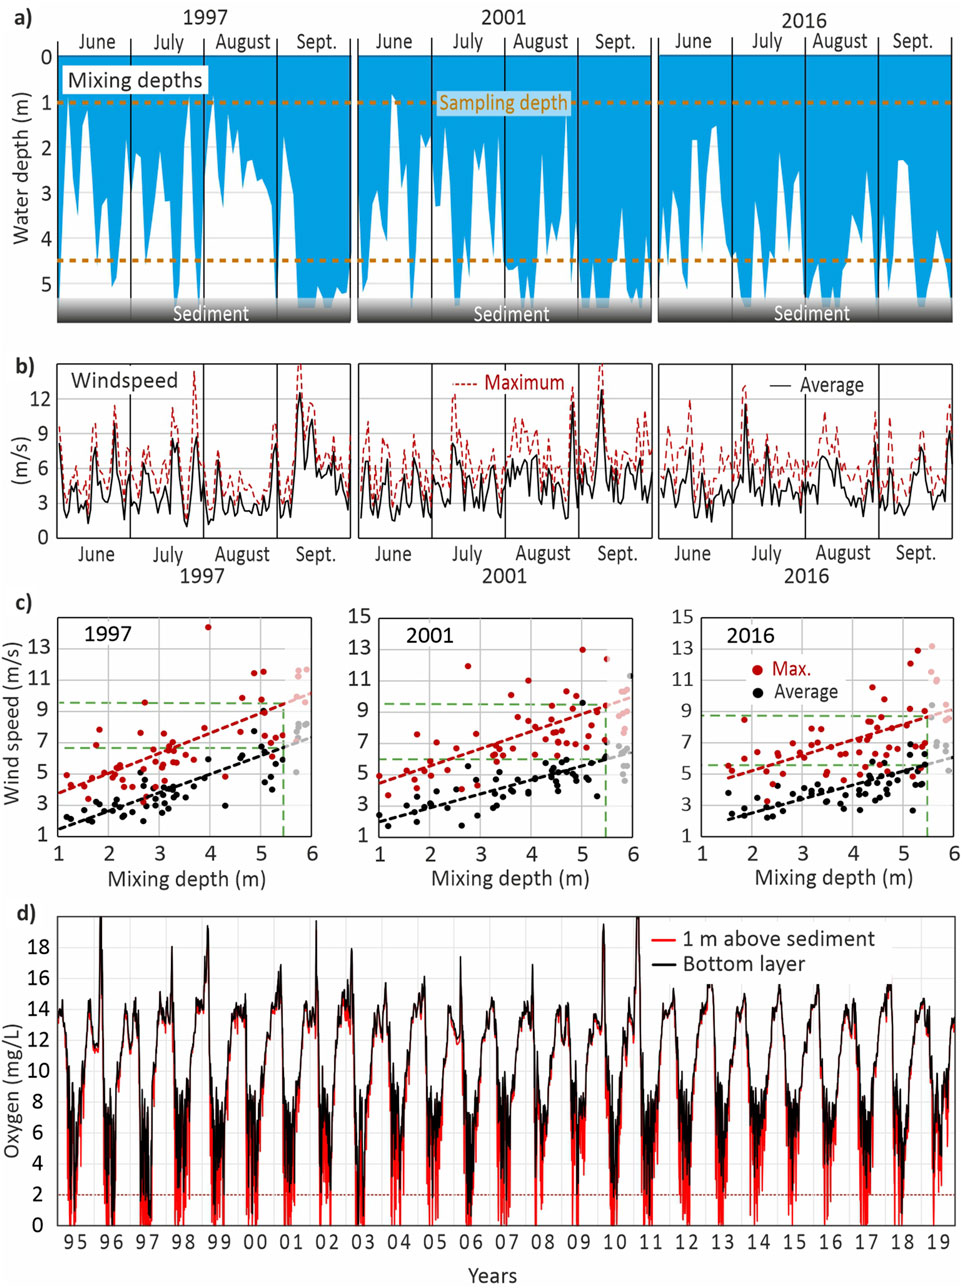
Figure 9. 3D-ecosystem model results for the Oder/Szczecin Lagoon: (a) Average mixing depth for the summer months of the years 1997, 2001 and 2016. The dashed lines indicate the monitoring sampling depths at 1 and 4.5 m. (b) Average daily and maximum hourly average wind speed per day near station M and (c) Relationship between vertical mixing depths and average daily as well as maximum hourly wind speed for the years 1997, 2001 and 2016. The depth of the lagoon at station M is about 5.5 m (green dashed line).
In contrast, 3D ecosystem model simulations provide a more accurate representation of these processes. They resolve near-bottom layers and deliver a comprehensive three-dimensional view of the spatio-temporal dynamics of oxygen-depleted zones. In the Oder Lagoon our model simulations show that the average number of days with 5 mg O2/L 1 m above the sediment is similar to the number of days with hypoxia in the layer above the sediment. For coastal systems lacking a suitable model, our findings indicate that even precautionary thresholds for dissolved oxygen, such as the 6 mg O2/L recommended by HELCOM (2023), may not sufficiently reflect hypoxia occurring in thin layers of a few centimeters above the sediment.
Between 1995 and 2019, on 27 sampling dates, data taken 1 m above the sediment did show oxygen-concentrations around 8 O2 mg/L (7.4–8.3 mg/L). For these dates the model suggests in 14% of the cases anoxia and in 37% hypoxia (<2 O2 mg/L) directly above the sediment. Including model data ± 5 days around the sampling date, we see in 41% of the cases anoxia and in 70% hypoxia (<2 O2 mg/L) near the sediment. Consequently, an observed oxygen threshold of 8 mg O2/L seems to be an appropriate site-specific early warning level for hypoxia risk.
A simplified approach for estimating hypoxia could be the usage of hydro-physical information. The model’s calculated vertical mixing depth offers insight into how often bottom sediments are affected by mixing events that can prevent or interrupt anoxia, as well as the duration of stagnation periods that allow hypoxia or anoxia to develop. Figure 9a illustrates this for station M (central Kleines Haff) during the summers of three contrasting years. In 1997, prolonged near-bottom stagnation occurred between June and August, promoting oxygen depletion. In contrast, 2016 saw more frequent and deeper mixing throughout summer. In all years, strong vertical mixing in September prevented oxygen depletion. Thus, hypoxia in the lagoon is largely confined to late spring and summer.
Mixing depth is governed by several factors, including temperature, salinity, and hydrodynamics, but wind speed is the dominant driver. Figures 9b,c show the wind speeds necessary to induce full vertical mixing down to the sediment surface. At station M (water depth ∼5.5 m), a daily average wind speed of 6 m/s or a short-term wind event of 9 m/s lasting 1 hour is sufficient. At the deeper station C (located in the 10.5 m-deep shipping channel), full mixing requires average daily winds above 10 m/s or hourly wind speeds exceeding 14 m/s. These stronger winds are relatively rare during summer before September.
Wind data, specifically, the frequency of wind speeds exceeding mixing thresholds and the duration of calm periods below those thresholds, can serve as a simple proxy for estimating the risk of oxygen depletion. However, this approach is site-specific. It is influenced by local conditions such as water depth and coastal wind sheltering, which are not directly accounted for in standard wind datasets.
The model enables calculation of the average annual area affected by anoxia, the maximum spatial extent of anoxic zones each year, and the total phosphorus release from sediments (Figure 10). Because of the functional relationship between P-release from sediments anoxia a close correlation between both exists. Interesting is the interannual variability. In certain years, such as 2013 and 2018, the average area affected by anoxia remains below 1 km2, yet the maximum extent exceeds 100 km2, approximately 15% of the total lagoon surface. The model suggests short-term but widespread anoxic conditions. In more extreme years, such as 1997, the maximum anoxic area surpasses 150 km2 (around 23% of the lagoon), while the annual mean reaches nearly 10 km2. The modelled P-releases, range from just a few tons to a peak of approximately 70 tons of phosphorus in 1997.
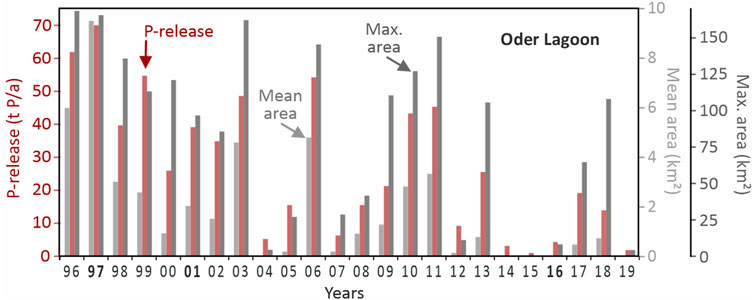
Figure 10. 3D-ecosystem model results for the Oder/Szczecin Lagoon: The total annual phosphorus release from sediments (t/a) under anoxic conditions, the maximum extent of the anoxic area as well as the average annual anoxic area for the years 1996 until 2019.
However, the phosphorus release estimated by the model reaches only about 10% of the maximum values derived from monitoring data (Figure 6). This discrepancy indicates a significant divergence between model-based and data-based assessments of internal eutrophication. On a year-by-year basis, the agreement between the model and observational data is occasionally good, for example, in 2006, but overall, the model cannot be considered a reliable tool for quantifying internal phosphorus loading, at least retrospective and a close correlation between modeled anoxia and the calculated release based on measured P-peaks does not exist.
The limitations in capturing extreme P concentrations during summer suggest that the model underrepresents short-term, high-intensity phosphorus releases under anoxic conditions. Despite this, the model does reproduce realistic seasonal phosphorus patterns, as well as consistent long-term trends and budgets. This indicates that phosphorus release under anoxic conditions and its subsequent re-precipitation may be rapid and episodic processes that do not substantially influence the long-term phosphorus balance in the lagoon.
4 Discussion
4.1 Critical assessment of the approaches
The limitations of the long-term monitoring data used in this analysis—particularly the insufficient temporal and vertical resolution—are evident. These data alone are inadequate for capturing spatially and temporally dynamic short-term processes such as oxygen depletion and offer limited utility in assessing internal eutrophication.
Our analysis relies primarily on data of station M. Long-term data from other stations in the lagoon proved less suitable, either because the water is too shallow for anoxia to develop, or because the sites are frequently disturbed. Stations B, C, D, and E are located within the shipping channel (Figure 2). It can be expected that anoxia and bottom oxygen are strongly affected by the frequent ship-traffic induced turbulence. This artificial mixing, very likely, causes discrepancies between model output and observed data.
In contrast, the limitations of the model are less immediately apparent. Generally, it provides a sufficiently detailed representation of the ecosystem, including key processes, state variables, and spatio-temporal resolution, to analyze seasonal and long-term changes in the lagoon. The model results are most sensitive to the following input parameters, (a) the exchange with the Baltic Sea, (b) windspeed and direction and (c) external nutrient loads. With respect to salinity, the model validation shows a very good agreement between data and model simulations (Neumann et al., 2025). This means that the exchange with the Baltic Sea is well represented and reliable during the 25 years.
With respect to wind, we employed state-of-the-art datasets. However, vertical mixing can be strongly influenced by gusts lasting only a few minutes that are spatially highly variable. Similarly, coastal wind shelter effects near the shoreline can significantly alter resuspension, mixing and transport dynamics and this is not fully represented in the wind input data. Performance and spatio-temporal resolution of our underlying hydrodynamic model can be regarded as suitable and very reliable for open parts of the lagoon and for our purpose. Limitations are likely to be more pronounced when focusing on short-term (days) and localized processes (e.g., nearshore areas). However, more detailed physical studies on mixing and oxygen depletion need to carried out.
Another important parameter are the external riverine nutrient loads. The accuracy of these loads depends heavily on both discharge measurements and nutrient concentration data, with discrepancies of up to ±20% observed across different data sources. Our used monthly riverine nutrient is state-of-the-art, but cannot accurately capture short-term nutrient concentrations changes especially near the river mouth. Simplifications with respect to spatio-temporal atmospheric deposition, diffuse surface water loads and the unknown intrusions of groundwater are one possible explanation for a differing performance quality of our model in different parts of the lagoon, e.g., between stations C and M (Neumann et al., 2025). Correlation analyses show that station M is only affected by long-term change in riverine nutrient loads and is not affected by coastal wind modifications. Therefore, the model can, especially for station M, be regarded as reliable. However, model applications in coastal waters and near-shore are much more sensitive to the quality and resolution of external input data, compared model applications in the Baltic Sea.
The model also relies on assumed initial conditions, which introduce further uncertainty. For example, it requires an estimate of FePO4 stored in the sediment at the simulation’s onset, and assumes that 10% of this FePO4 is released during one anoxic day. This assumed availability largely determines the model’s ability to replicate phosphorus peaks. However, reliable data on sediment FePO4 levels are lacking.
Additionally, the model struggles to represent specific local conditions. One example is the assumption of persistent anoxia in the lagoon’s shipping channel. In reality, over 3,000 cargo ships, many with drafts near 10 m, enter the Port of Szczecin annually, with a peak during the summer months (Schernewski et al., 2025). These vessels likely cause regular vertical mixing of the water column in the navigation channel, making sustained anoxia, as predicted by the model, unlikely.
Overall, the discrepancies between datasets and between model results and observational data suggest that short-term processes occurring on the scale of days play a significant role, one that is not adequately captured in our current modeling approach. These limitations push our model to its boundaries.
4.2 Hypoxia and anoxia
Phosphorus peaks in summer along with observed organism die-offs and especially long-term model simulations, suggest that hypoxia, and even anoxia, are common phenomena in the Oder Lagoon. In contrast, such events are not apparent in the available monitoring data. A key reason for this discrepancy lies in the different sampling depths: while the model represents oxygen conditions in the 0–0.3 m layer directly above the sediment, monitoring data are typically collected 1 m above the bottom. This difference likely explains the absence of hypoxia signals in the monitoring records. This finding is consistent with the observations of Puttonen et al. (2016), who concluded that measurements taken 1 m above the sediment are inadequate for detecting hypoxia. It is further supported by Fredriksson et al. (2024), who found that hypoxia frequently occurs temporarily in thin bottom layers, meaning its prevalence is significantly underestimated by standard monitoring methods.
Therefore, we conclude that our model provides the most suitable tool for investigating oxygen depletion. It delivers a highly resolved, three-dimensional, spatio-temporal perspective that captures the dynamic nature of oxygen conditions. The unexpected frequency and spatial extent of hypoxic conditions revealed by the model may also help explain the limited distribution of zebra mussels (Dreissena polymorpha) in the deeper regions of the lagoon (Fenske, 2003), as well as the observed sudden collapse of local mussel beds (Wolnomiejski and Woźniczka, 2008).
Since vertical mixing is primarily driven by wind speed, wind can be used as a proxy to estimate the duration and frequency of hypoxic events. Mixing depth is site-specific and depends on local bathymetry. For instance, in the central western bay of the Oder Lagoon, where water depth is approximately 5.5 m, a daily average wind speed of 6 m/s, or a short-term wind event reaching 9 m/s for just 1 hour, is sufficient to prevent hypoxia. These results are based on the provided wind input data resulting from a regional wind-model. The direct usage of locally measured near surface wind data might result in slightly different values.
In coastal water bodies with complex morphometry, where full ecosystem models are not yet feasible, high-resolution hydrodynamic models (e.g., Lange et al., 2020) can be a valuable tool to assess hypoxia risk. Recent approaches, such as the simplified integration of oxygen consumption into a hydrodynamic model of the Baltic Sea (Gräwe, pers. com) or of Chesapeake Bay (Scully, 2013) are promising.
Standard oxygen monitoring, conducted 1 m above the sediment, often fails to capture hypoxic events. When assessments rely solely on monitoring data, a more precautionary threshold is needed. HELCOM (2023) proposes a threshold of 6 mg O2/L for hypoxia in mixed coastal waters. However, our results show that hypoxia can occur near the sediment even when oxygen concentrations 1 m above the bottom are relatively high, around 8 mg O2/L (∼87% saturation). Therefore, we propose that 8 mg O2/L should be adopted as a more appropriate early-warning threshold for hypoxia in such environments.
Model results also indicate a long-term decline in the intensity of hypoxia in the Oder Lagoon, and today such events are relatively rare. However, despite the sustained reduction of external nutrient inputs over recent decades, phytoplankton concentrations have only slightly decreased, and the lagoon remains highly eutrophic. Thus, the risk of hypoxia persists. Climate change, in particular, the increased frequency and severity of hot summers (e.g., Safonova et al., 2024), along with recent deepening of the shipping channel to 12 m, could potentially exacerbate hypoxia in the lagoon in the future. Effects of climate-driven warming in promoting hypoxia have been examined in other estuaries (e.g., Rheuban et al., 2016; Whitney and Vlahos, 2021; Codiga et al., 2022).
4.3 Internal eutrophication
Puttonen et al. (2016) concluded that phosphorus release from sediments hampers recovery from eutrophication in coastal waters near Finland. Similarly, in the Oder Lagoon, internal eutrophication temporarily leads to the release of significant amounts of phosphorus, some of which is transported to the coastal Baltic Sea, where it can contribute to algal growth. However, since summer primary production in the lagoon is not limited by phosphorus, these additional releases do not have an immediate impact on productivity in the lagoon. Furthermore, declining phosphorus concentrations in autumn and winter suggest that, in addition to export to the Baltic Sea, a portion of the phosphorus is likely precipitated again as FePO4 compounds. These compounds settle into the lagoon sediment, where they may later become re-available, supporting future internal eutrophication cycles.
Over the past 40 years, the intensity of internal eutrophication appears to have declined. This trend can partially be attributed to a reduced frequency and severity of anoxic events. Another significant factor may be the net loss of FePO4 compounds from the lagoon, which may exceed the subsequent replacing input of iron via river inflows, since the high heavy metal load of the Oder River has declined during the last decades (e.g., Korol et al., 2005).
As a result, the relevance of internal eutrophication as a driving process in the lagoon has diminished. Nonetheless, we cannot rule out the possibility that internal eutrophication still occurs, albeit at levels that are no longer reflected in persistent, multi-week elevations of phosphorus concentrations in the water. In recent years, the lagoon has shifted toward a nutrient-limited system. This shift has resulted in longer periods of low nutrient concentrations during summer. As a consequence, phosphorus uptake by phytoplankton may now deplete available phosphorus from the water more rapidly, leading to shorter-lived peaks that are even more likely to be missed by monthly monitoring programs.
Several studies have shown that internal phosphorus release begins under hypoxic conditions and reaches peak values exceeding 50 µmol P m−2 day−1 during full anoxia (e.g., Puttonen et al., 2014; Eglīte et al., 2014; Anderson et al., 2021). Although our data do not allow for precise quantification of phosphorus release rates, we can make rough estimates based on observed concentration peaks. Assuming phosphorus is released over a 3-day period from oxygen-depleted areas covering 50% of the lagoon, annual release rates in many years approximate 10 µmol P m−2 day−1. Based on data for Station M, in specific years, such as 1983, 1989, 1991, 2006, and 2020, estimated rates exceed 30 µmol P m−2 day−1, with values in 1990 surpassing 50 µmol P m−2 day−1. These estimates suggest that our approximations are of a realistic order of magnitude. The model assumes that intense phosphorus release only takes place during anoxia and based on the FePO4 pool established during the year. The model cannot take into account the eutrophication and pollution history and FePO4 pools in older sediments, which, at least partly, explain differences in phosphorus release between model and data-based calculations.
In the early 1990s, surface sediments in the Oder Lagoon (fraction <63 µm) contained an average of 3.3% iron, with maximum values reaching 5.7% (Leipe et al., 1998). Based on sediment analyses from this period, it was estimated that at least 10,000 tons of phosphorus were stored in the upper 10 cm of the muddy sediments in the Kleines Haff region alone (Meyer et al., 1998; Schernewski and Wielgat, 2001). These high concentrations of iron and phosphorus reflect the lagoon’s history of long-term pollution from the Oder River (Glasby et al., 2004). They strongly suggest that, at least in the early 1990s, large quantities of FePO4 compounds were present and available to support intense internal eutrophication. However, direct measurements of FePO4 compounds in sediments are lacking, and such data are essential for refining model simulations and enabling more accurate model-based nutrient budget calculations.
Currently, reliable model-based estimations of hypoxia and phosphorus release during ice-covered periods in cold winters are not feasible, and corresponding monitoring data are missing. Nevertheless, recent studies conducted during the cold winter of 2018 in the Oder Lagoon indicate that such events can trigger the mobilization and redistribution of several chemical elements (Bełdowska et al., 2021), highlighting the need for further investigation.
4.4 Practical consequences
Our findings have several implications for both the quality assessment and the monitoring approach within the Oder Lagoon. The standard bio-chemical monitoring strategy, monthly sampling near the surface and approximately 1 m above the sediment, is inadequate for capturing short-term events lasting from days to weeks, such as floods, droughts, or heatwaves. Furthermore, this monitoring is typically limited to the period between early spring and early winter, leaving a significant data gap during the winter months. This is a notable shortcoming, particularly during periods of complete ice cover.
Limitations in vertical data resolution are especially critical for parameters such as oxygen. Detailed knowledge of the timing, duration, and spatial extent of hypoxia and anoxia is essential for assessing the condition of benthic communities and understanding internal eutrophication processes. This necessitates oxygen measurements close to the sediment surface and a more spatially comprehensive sampling strategy, especially when concentrations fall below the precautionary threshold of 8 mg/L. Additionally, care must be taken to avoid disturbance of the water column by research vessel operations during data collection.
Above the water surface, wind data can offer valuable supplementary information. Wind-derived mixing depth calculations could enhance the interpretation of oxygen dynamics and support hypoxia assessments.
For evaluating the ecological status of benthic fauna, new insights into the extent, frequency, and duration of hypoxic events must be incorporated. In the eastern part of the lagoon, known as Wielki Zalew, most monitoring stations are located within the shipping channel. Regular ship traffic induces deep mixing, and since most stations are located in the channel, the available data may not reveal the real extent of hypoxia in the eastern lagoon. It is likely that the sampling stations cause an underestimation of hypoxia in deeper areas of the eastern bay, that are not affected by ships. Additionally, the impacts of the recently completed deepening of the navigation channel, from 10.5 to 12 m, require further evaluation, particularly in relation to hypoxia.
Chlorophyll-a and nutrient monitoring data from the lagoon frequently exhibit single high values. In the case of chlorophyll, this is attributed to small-scale patchiness of phytoplankton. In contrast, the exceptionally high phosphorus concentrations result from short-term internal eutrophication. These extreme values, when simply averaged, can obscure long-term trends and should ideally be excluded from assessments of water quality status. Alternatively, using median values can provide a more representative metric. When such outliers are removed, there is good agreement between monitoring data and model simulations, indicating that model-based approaches can reliably enable the establishment of realistic future water quality targets in line with the EU Water Framework Directive.
For the station M, the present water quality threshold values for a good status according to the WFD, are 14.5 mg/m3 chlorophyll-a, 45.5 mmol/m3 total nitrogen, 2.8 mmol/m3 total phosphorus, and 0.8 m Secchi-depth between as averages over the period between April and September (Schernewski et al., 2015). In recent years the observed nutrient concentration in the river in summer and the resulting annual riverine loads meet the legal thresholds for both river and marine water quality. Therefore, recent observed nutrient and chlorophyll-concentrations in the lagoon should reflect a status, close to the thresholds. The averaged observed values covering the period between June and September for the years 2018–2021 at station M are 62 mg/m3 chlorophyll-a (Median: 54 mg/m3), 87 mmol/m3 total nitrogen (median: 84), 5.1 mmol/m3 total phosphorus (median: 4.1 mg/m3), and 0.65 m Secchi-depth (median: 0.5). Both approaches differ with respect to assumed riverine nutrient and atmospheric deposition, but the strong difference between the threshold values for all parameters, indicate that meeting a good water quality in the river does not cause a good status in the lagoon. In summer practically all nutrients in the water column are bound to organic material, while especially the concentrations of inorganic nitrogen are often close 0.2 mmol/m3. It seems that the lagoon can maintain a high phytoplankton biomass after nutrient load reductions and it is questionable whether total nitrogen and total phosphorus are suitable indicator parameters. However, despite water quality improvements, the lagoon is still in a highly eutrophic state and it is not likely that this will change. A reconsideration of societal and ecological expectations and resulting water quality targets in the river-lagoon-sea continuum seems necessary.
Despite some improvements, all available data indicate that the lagoon remains in a highly eutrophic state. Continued climate change, particularly reductions in summer water discharge and nutrient loads, may lead to improvements in water quality. However, it is hardly possible that the lagoon will achieve a non-eutrophic condition. Even future-oriented and updated target values are expected to confirm that the lagoon is naturally eutrophic.
In several years, internal eutrophication has led to the summer export of substantial amounts of phosphorus to the adjacent coastal Baltic Sea, potentially promoting algal blooms. Similar impacts of excess phosphorus have been observed in other Baltic coastal systems (Tammeorg et al., 2020; Helminen, 2025; Stoicescu et al., 2020), and this may influence water quality assessments in the coastal Baltic region. However, the summerly phosphorus export to neighboring systems such as the Dziwna, Peenestrom, and Achterwasser is unlikely to cause harm, as these areas exhibit nutrient limitation dynamics comparable to those of the Oder Lagoon.
5 Conclusions and recommendations
So far, hypoxia in the Oder Lagoon was considered as of low relevance and the effects of internal eutrophication were unknown. Our results point out the relevance of these processes in the lagoon especially in the past. In recent years, the frequency of these events declined. The model simulations are most suitable for reflecting frequency, duration, and spatial extent of oxygen depletion. In contrast, monitoring data, taken 1 m above the sediment, is not sufficiently reliable to indicate hypoxia. In the central Oder lagoon, already slightly reduced oxygen concentrations of 8 mg O2/L near the water surface indicate the risk of near bottom hypoxia. If lacking, daily and hourly wind data can serve as site specific proxy for oxygen depletion. Summerly peaks of phosphorus concentrations can serve as a proxy for anoxia, but does not allow detailed assessments. A solution to overcome weaknesses in the data, could be a daily vertically profiling and recording floating station, that complements the present ship-based monitoring. This should include the continuous collection of wind data. Alternatively, an expanded spatial monitoring with data collection down to the sediment surface should be carried out as soon as reduced oxygen concentrations are observed. Further, organism mortality events should be reported and systematically documented as complementary data. Models or a combination of data with other proxies, such as wind speed are able to overcome short-comings in hypoxia assessments.
Data availability statement
Publicly available datasets were analyzed in this study. This data can be found here: The long-term monitoring data can be obtained from the named authorities.
Author contributions
GS: Writing – original draft, Investigation, Resources, Formal Analysis, Visualization, Funding acquisition, Software, Conceptualization, Validation, Data curation, Supervision, Methodology, Writing – review and editing, Project administration. TN: Validation, Writing – review and editing, Investigation, Methodology, Formal Analysis, Visualization, Software, Data curation, Writing – original draft. SP: Writing – review and editing, Project administration, Funding acquisition, Visualization, Writing – original draft, Resources. MW: Writing – review and editing, Validation, Data curation, Methodology, Writing – original draft.
Funding
The author(s) declare that financial support was received for the research and/or publication of this article. This work was financially supported by the German Federal Ministry of Education and Research (BMBF), projects “DAM Schutz und Nutzen: Coastal Futures II” (grant number 03F0980B), “DAM Extrem: Prime Prevention” (grant number 03F0953D) and UBA-MoSea (FKZ 3723252040).
Acknowledgments
Supercomputing power was provided HLRN (North-German Supercomputing Alliance). The authors thank the LUNG-MV and the Główny Inspektorat Ochrony Środowiska for providing German and Polish monitoring data as well as Alice Hunt for graphical support.
Conflict of interest
The authors declare that the research was conducted in the absence of any commercial or financial relationships that could be construed as a potential conflict of interest.
Generative AI statement
The author(s) declare that no Generative AI was used in the creation of this manuscript.
Publisher’s note
All claims expressed in this article are solely those of the authors and do not necessarily represent those of their affiliated organizations, or those of the publisher, the editors and the reviewers. Any product that may be evaluated in this article, or claim that may be made by its manufacturer, is not guaranteed or endorsed by the publisher.
References
Anderson, H. S., Johengen, T. H., Miller, R., and Godwin, C. M. (2021). Accelerated sediment phosphorus release in Lake Erie’s central basin during seasonal anoxia. Limnol. Oceanogr. 66, 3582–3595. doi:10.1002/lno.11900
Bełdowska, M., Jędruch, A., Sieńska, D., Chwiałkowski, W., Magnuszewski, A., and Kornijów, R. (2021). The impact of sediment, fresh and marine water on the concentration of chemical elements in water of the ice-covered lagoon. Environ. Sci. Pollut. Res. 28, 61189–61200. doi:10.1007/s11356-021-14936-w
BLANO (2014). Harmonisierte hintergrund-und orientierungswerte für nährstoffe und chlorophyll-a in den deutschen küstengewässern der ostsee sowie zielfrachten und zielkonzentrationen für die einträge über die gewässer. Available online at: https://www.meeresschutz.info/sonstige-berichte.html (Accessed April 15, 2025).
Carstensen, J., and Conley, D. J. (2019). Baltic Sea hypoxia takes many shapes and sizes. Limnol. Oceanogr. Bull. 28, 125–129. doi:10.1002/lob.10350
Carstensen, J., Conley, D. J., Bonsdorff, E., Gustafsson, B. G., Hietanen, S., Janas, U., et al. (2014). Hypoxia in the Baltic Sea: Biogeochemical cycles, benthic fauna and management. Ambio 43, 26–36. doi:10.1007/s13280-013-0474-7
Codiga, D. L., Stoffel, H. E., Oviatt, C. A., and Schmidt, C. E. (2022). Managed nitrogen load decrease reduces chlorophyll and hypoxia in warming temperate urban estuary. Front. Mar. Sci. 9, 930347. doi:10.3389/fmars.2022.930347
Conley, D. J., Carstensen, J., Aigars, J., Axe, P., Bonsdorff, E., Eremina, T., et al. (2011). Hypoxia is increasing in the coastal zone of the Baltic Sea. Environ. Sci. & Technol. 45 (16), 6777–6783. doi:10.1021/es201212r
Díaz, R. J., and Rosenberg, R. (2011). Introduction to environmental and economic consequences of hypoxia. Int. J. Water Resour. Dev. 27 (1), 71–82. doi:10.1080/07900627.2010.531379
Dietze, H., and Löptien, U. (2021). Retracing hypoxia in Eckernförde Bight (Baltic Sea). Biogeosciences 18, 4243–4264. doi:10.5194/bg-18-4243-2021
Eglīte, E., Lavrinovičs, A., Müller-Karulis, B., Aigars, J., and Poikāne, R. (2014). Nutrient turnover at the hypoxic boundary: flux measurements and model representation for the bottom water environment of the Gulf of Riga, Baltic Sea. Oceanologia 56, 711–735. doi:10.5697/oc.56-4.711
European Commission. Marine biodiversity modelling study (2022). Publications Office of the European Union; European Comission: Brusells, Belgium. Available online at: https://data.europa.eu/doi/10.2777/213731 (Accessed April 15, 2025).
Fenske, C. (2003). Die Wandermuschel (Dreissena polymorpha) im Oderhaff und ihre Bedeutung für das Küstenzonenmanagement. 144. [dissertation] Ernst-Moritz-Arndt-Universität Greifswald.
Fredriksson, J. P., Attard, K., Stranne, C., Koszalka, I. M., Glud, R. N., Andersen, T. J., et al. (2024). Hidden seafloor hypoxia in coastal waters. Limnol. Oceanogr. 69, 2489–2502. doi:10.1002/lno.12607
Friedland, R., Schernewski, G., Gräwe, U., Greipsland, I., Palazzo, D., and Pastuszak, M. (2019). Managing eutrophication in the Szczecin (Oder) lagoon-development, present state and future perspectives. Front. Mar. Sci. 5, 521. doi:10.3389/fmars.2018.00521
Geyer, B., and Rockel, B. (2013). coastDat-2 COSMOCLM atmospheric reconstruction [data set]. doi:10.1594/WDCC/coastDat-2_COSMO-CLM
Glasby, G. P., Szefer, P., Geldon, J., and Warzocha, J. (2004). Heavy-metal pollution of sediments from Szczecin lagoon and the Gdansk basin, Poland. Sci. Total Environ. 330 (1–3), 249–269. doi:10.1016/j.scitotenv.2004.04.004
Grenzgewässerkommission (2024). Bericht über die Beschaffenheit der deutsch–polnischen Grenzgewässer 2022. Available online at: https://www.wasserblick.net/servlet/is/1/ (Accessed April 15, 2025).
HELCOM (2021). Baltic Sea action plan – 2021 update. Available online at: https://helcom.fi/baltic-sea-action-plan (Accessed April 15, 2025).
HELCOM (2023a). Nutrient input ceiling (NIC) assessment 1995-2020. Tech. Rep. Available online at: https://helcom.fi/baltic-sea-action-plan/nutrient-reduction-scheme/national-nutrient-input-ceilings/ (Accessed April 15, 2025).
HELCOM (2023b). “Shallow water oxygen,” in HELCOM core indicator report. Available online at: https://indicators.helcom.fi/wp-content/uploads/2023/04/Shallow-water-oxygen_Final_April_2023-1.pdf (Accessed April 15, 2025).
HELCOM (2023c). “State of the Baltic Sea. Third HELCOM holistic assessment 2016–2021,” in Baltic Sea environment proceedings 194. Available online at: https://helcom.fi/wp-content/uploads/2023/10/State-of-the-Baltic-Sea-2023.pdf (Accessed April 15, 2025).
HELCOM (2013). Summary report on the development of revised maximum allowable inputs (MAI) and updated country allocated reduction targets (CART) of the Baltic Sea action plan. Available online at: http://www.helcom.fi/ (Accessed April 15, 2025).
Helminen, H. (2025). The role of internal phosphorus loading in the archipelago sea ecological status. Water 17 (2), 248. doi:10.3390/w17020248
IKSO (2022). Zweite Aktualisierung des Bewirtschaftungsplans für die Internationale Flussgebietseinheit. Available online at: http://www.mkoo.pl/download.php?fid=6996&lang=DE (Accessed April 15, 2025).
Kim, H., Franco, A. C., and Sumaila, U. R. (2023). A selected review of impacts of ocean deoxygenation on fish and fisheries. Fishes 8 (6), 316. doi:10.3390/fishes8060316
Korol, R., Kolanek, A., and Strońska, M. (2005). Trends in water quality variations in the Odra River the day before implementation of the water framework directive. Limnologica 35 (3), 151–159. doi:10.1016/j.limno.2005.06.002
Lange, X., Klingbeil, K., and Burchard, H. (2020). Inversions of estuarine circulation are frequent in a weakly tidal estuary with variable wind forcing and seaward salinity fluctuations. J Geophys. Res. Oceans 125, 125–129. doi:10.1029/2019JC015789
Leipe, T., Eidam, J., Lampe, R., Meyer, H., Neumann, T., Osadczuk, A., et al. (1998). Das Oderhaff: beitrage zur Rekonstruktion der holozanen geologoischen Entwicklung und anthropogenen Beeinflussung des OderAstuars. Mar. Sci. Rep. 28, 61.
LUNG (2016). Monitoringprogramm zur Überwachung der Oberflächengewässer und des Grundwassers in Mecklenburg-Vorpommern im Zeitraum 2016-2021. Available online at: http://www.lung.mv-regierung.de/ (Accessed April 15, 2025).
LUNG (2024). Monitoringprogramm zur Überwachung der Oberflächengewässer und des Grundwassers in Mecklenburg-Vorpommern im Zeitraum 2022-2027. Available online at: https://www.lung.mv-regie-rung.de/static/lUNG/dateien/fachinformationen/wasser/Gewaesserueberwachung/monitoringprogramm_2022-2027.pdf (Accessed April 15, 2025).
Meyer, H., Lampe, R., Jonas, P., and Buckmann, K. (1998). Nährstoffe im Oderästuar - Transporte und Inventare. Greifswald. Geogr. Schriften 16, 99–129.
Mohrholz, V., and Lass, H. U. (1998). Transports between Oderhaff and Pomeranian Bight – a simple barotropic box model. Ger. J. Hydrogr. 1998, 371–383. doi:10.1007/bf02764231
Mort, H. P., Slomp, C. P., Gustafsson, B. G., and Andersen, T. J. (2010). Phosphorus recycling and burial in Baltic Sea sediments with contrasting redox conditions. Geoch. Cosm. Act. 74 (4), 1350–1362. doi:10.1016/j.gca.2009.11.016
Neumann, T., Radtke, H., Cahill, B., Schmidt, M., and Rehder, G. (2022). Non-Redfieldian carbon model for the Baltic Sea (ERGOM version 1.2)—implementation and budget estimates. Geosci. Model. Dev. 15, 8473–8540. doi:10.5194/gmd-15-8473-2022
Neumann, T., Schernewski, G., and Friedland, R. (2025). Transformation processes in the oder lagoon as seen from a model perspective. EGUsphere Prepr. doi:10.5194/egusphere-2024-3734
OECD (1982). Eutrophication of waters. Monitoring, assessment and control. Paris: Organisation for Economic Co-Operation and Development, 154.
OGew (2016). Verordnung zum Schutz der Oberflächengewässer1. Available online at: https://www.gesetze-im-internet.de/ogewv_2016/OGewV.pdf (Accessed April 15, 2025).
Piehl, S., Friedland, R., Heyden, B., Leujak, W., Neumann, T., and Schernewski, G. (2023). Modeling of water quality indicators in the western Baltic Sea: seasonal oxygen deficiency. Environ. Model Assess. 28, 429–446. doi:10.1007/s10666-022-09866-x
Puttonen, I., Kohonen, T., and Mattila, J. (2016). Factors controlling phosphorus release from sediments in coastal archipelago areas. Mar. Pollut. Bull. 108 (1–2), 77–86. doi:10.1016/j.marpolbul.2016.04.059
Puttonen, I., Mattila, J., Jonsson, P., Karlsson, O. M., Kohonen, T., Kotilainen, A., et al. (2014). Distribution and estimated release of sediment phosphorus in the northern Baltic Sea archipelagos. Estuar. Coast. Shelf Sci. 145, 9–21. doi:10.1016/j.ecss.2014.04.010
Radziejewska, T., and Schernewski, G. (2008). “The Szczecin (Oder-) lagoon,” in Ecology of Baltic coastal waters. Editor U. Schiewer (Berlin: Springer), 115–129.
Rheuban, J. E., Williamson, S., Costa, J. E., Glover, D. M., Jakuba, R. W., McCorkle, D. C., et al. (2016). Spatial and temporal trends in summertime climate and water quality indicators in the coastal embayments of Buzzards bay. Massachusetts. Biogeosci 13, 253–265. doi:10.5194/bg-13-253-2016
Rosciszewski-Dodgson, M. J., and Cirella, G. T. (2024). Environmental drivers affecting the status of top commercial fish stocks in the Baltic Sea: review. Front. Mar. Sci. 11, 1399707. doi:10.3389/fmars.2024.1399707
Safonova, K., Meier, M., and Gröger, M. (2024). Summer heatwaves on the Baltic Sea seabed contribute to oxygen deficiency in shallow areas. Commun. Earth Environ., 5. doi:10.1038/s43247-024-01268-z
Schneider, B. (2011). PO4 release at the sediment surface under anoxic conditions: a contribution to eutrophication of the Baltic Sea ? Oceanologia 53, (1-TI), 415–429.
Schernewski, G., Friedland, R., Carstens, M., Hirt, U., Leujak, W., Nausch, G., et al. (2015). Implementation of European marine policy: new water quality targets for German Baltic waters. Mar. Policy 51, 305–321. doi:10.1016/j.marpol.2014.09.002
Schernewski, G., Neumann, T., and Behrendt, H. (2011). “Sources, dynamics and management of phosphorus in a southern Baltic estuary,” in The Baltic Sea basin as a natural laboratory. Editors J. Harff, S. Björck, and P. Hoth (Berlin: Springer, Central and Eastern European Development Studies), 373–388.
Schernewski, G., Neumann, T., Piehl, S., and Swer, N. M. (2025). Ecosystem-model-based valuation of ecosystem services in a Baltic lagoon: long-term human technical interventions and short-term variability. Environments 12 2, 35. doi:10.3390/environments12020035
Schernewski, G., and Wielgat, M. (2001). Eutrophication of the shallow Szczecin Lagoon (Baltic Sea): modelling, management and the impact of weather. Available online at: https://www.witpress.com/Secure/elibrary/papers/CE01/CE01008FU.pdf (Accessed April 15, 2025).
Scully, M. E. (2013). Physical controls on hypoxia in Chesapeake Bay: a numerical modeling study. J. Geophys. Res. Oceans 118, 1239–1256. doi:10.1002/jgrc.20138
Smolders, A. J. P., Roelofs, J. G. M., and den Hartog, C. (1995). Internal eutrophication of aquatic ecosystems: mechanisms and possible remedies. Acta Bot. Gallica 142 (6), 707–717. doi:10.1080/12538078.1995.10515295
Søndergaard, M., Jensen, J. P., and Jeppesen, E. (1999). “Internal phosphorus loading in shallow Danish lakes,” in Shallow lakes ’98. Developments in Hydrobiology 143. Editors N. Walz, and B. Nixdorf (Dordrecht: Springer). doi:10.1007/978-94-017-2986-4_15
Stigebrandt, A., and Andersson, A. (2020). The eutrophication of the Baltic Sea has been boosted and perpetuated by a major internal phosphorus source. Front. Mar. Sci. 7, 572994. doi:10.3389/fmars.2020.572994
Stoicescu, S. T., Laanemets, J., Liblik, T., Skudra, M., Samlas, O., Lips, I., et al. (2020). Causes of the extensive hypoxia in the Gulf of Riga in 2018. Biogeosciences 19, 2903–2920. doi:10.5194/bg-19-2903-2022
Tammeorg, O., Nürnberg, G., Niemistö, J., Haldna, M., and Horppila, J. (2020). Internal phosphorus loading due to sediment anoxia in shallow areas: implications for lake aeration treatments. Aquat. Sci. 82, 54. doi:10.1007/s00027-020-00724-0
Vaquer-Sunyer, R., and Duarte, C. M. (2008). Thresholds of hypoxia for marine biodiversity. Proc. Natl. Acad. Sci. U. S. A. 105 (40), 15452–15457. doi:10.1073/pnas.0803833105
Villnäs, A., Norkko, J., Lukkari, K., Hewitt, J., and Norkko, A. (2012). Consequences of increasing hypoxic disturbance on benthic communities and ecosystem functioning. PLoS One 7, e44920. doi:10.1371/journal.pone.0044920
Whitney, M. M., and Vlahos, P. (2021). Reducing hypoxia in an urban estuary despite climate warming. Environ. Sci. Technol. 55 (2), 941–951. doi:10.1021/acs.est.0c03964
Wolnomiejski, N., and Woźniczka, A. (2008). A drastic reduction in abundance of Dreissena polymorpha Pall. In the Skoszewska Cove (Szczecin lagoon, river Odra estuary): effects in the population and habitat. Ecol. Quest. 9, 103–111. doi:10.2478/v10090-009-0025-9
Zhang, J., Gilbert, D., Gooday, A. J., Levin, L., Naqvi, S. W. A., Middelburg, J. J., et al. (2010). Natural and human-induced hypoxia and consequences for coastal areas: synthesis and future development. Biogeosciences 7, 1443–1467. doi:10.5194/bg-7-1443-2010
Keywords: hypoxia, anoxia, Szczecin lagoon, coastal waters, water quality, monitoring, assessment, phosphorus release
Citation: Schernewski G, Neumann T, Piehl S and von Weber M (2025) New approaches to unveil the unknown: oxygen depletion and internal eutrophication in a Baltic lagoon over decades. Front. Environ. Sci. 13:1620191. doi: 10.3389/fenvs.2025.1620191
Received: 29 April 2025; Accepted: 18 July 2025;
Published: 07 August 2025.
Edited by:
Dominika Lewicka-Szczebak, University of Wrocław, PolandReviewed by:
Daniel L. Codiga, University of Rhode Island, United StatesJoanna Podlasińska, West Pomeranian University of Technology, Poland
Copyright © 2025 Schernewski, Neumann, Piehl and von Weber. This is an open-access article distributed under the terms of the Creative Commons Attribution License (CC BY). The use, distribution or reproduction in other forums is permitted, provided the original author(s) and the copyright owner(s) are credited and that the original publication in this journal is cited, in accordance with accepted academic practice. No use, distribution or reproduction is permitted which does not comply with these terms.
*Correspondence: Gerald Schernewski, Z2VyYWxkLnNjaGVybmV3c2tpQGlvLXdhcm5lbXVlbmRlLmRl