- 1School of Management Science and Engineering, Nanjing University of Information Science and Technology, Nanjing, China
- 2School of Industry and Urban Construction, Hengxing University, Qingdao, China
- 3School of Foreign Languages, Nanjing University of Finance and Economics, Nanjing, China
- 4The Commerce Bureau of Ordos City, Ordos, Inner Mongolia, China
Validating the Environmental Kuznets Curve (EKC) hypothesis has been a core subject for decades. Still, its universality is contested in contemporary studies due to prior region-specific outcomes. Comprehensively estimating its applicability for West African countries, while addressing the gaps in prior studies, second-generation and non-spherical error methods, spatial approaches, and long-run estimators are applied to 3 decades’ worth of data. The findings reveal that (1) pertaining to environmental deterioration (EAI), West African countries fall within clusters of low-low, low-high, and high-low, with the presence of spatial dependencies. Thus, three types of spatial associations are discovered: low-low clusters (LL), where low-EAI countries are neighbours to other low-EAI countries; low-high outliers (LH), where a low-EAI country is surrounded by high-EAI neighbours; and high-low outliers (HL), where a high-EAI country is bordered by low-EAI countries. (2) Per capita GDP and its quadratic form locally have an inverse relationship with environmental degradation, but in the long run, have a positive correlation. (3) FDI’s impact supports the pollution halo hypothesis, while trade exacerbates emissions through emission-intensive goods and transportation-related emissions. (4) Industries affect environmental degradation in the long run negatively, whereas population density exhibits a similar effect locally, and its effects spill over to neighbouring countries. (5) The inverted U-shaped correlation does not hold for West African countries, insinuating that the EKC hypothesis is not universally applicable. Overall, recommendations based on the empirical outcomes are cited for policymakers, stakeholders, and future research.
1 Introduction
The growing concern and focus on ecological sustainability have been globally stretching, stemming from the continuous rise in emissions (Tenaw and Beyene, 2021). Undoubtedly, the anthropogenic contribution to this, driven by the notions of survival and economic development, has been a key driver of the now-renowned predicament. Thus, from the prehistoric to the medieval, industrial, and contemporary eras, human activities such as the agricultural revolution, the Renaissance, and the industrial revolution have cohesively contributed to the current emissions problem. From 1990 to 2024, the amount of greenhouse gas (GHG) emissions stemming from agricultural practices, fossil fuel extractions, industrial practices, and the energy production substantially increased by 25%, 52%, 93%, and 104%, respectively; overall, global GHGs as of 2024, excluding land use, land use and forestry, reached 53.2 Gt CO2eq (EDGAR, 2025).
Irrespective of the proliferation of climate accords and regulatory measures over the past decades (Boamah et al., 2023), GHGs have exhibited a persistent upward trajectory, raising an issue of ecological degradation, pronounced in West African countries over the past decade (Jiang et al., 2025). In 1994, the average amounts of the top three GHGs for West African countries were 6.099 Mt CO2e for carbon dioxide emissions (CO2), 20.005 Mt CO2e for methane emissions (CH4), and 2.253 Mt CO2e for nitrous oxide (N2O). However, these amounts grew by 121.34%, 20.14%, and 134.80%, respectively, as of 2023 (see Figure 1). This raises the critical question of what dynamics are propelling these sustained increases. Jacquet et al. (2025) highlighted the minor fraction that West Africa’s GHGs account for on the global scale. Still, their growing amounts, as illustrated in Figure 1, reveal the severity within the region and ultimately, globally. According to Adu and Denkyirah (2018), economic development is a key driver of environmental deterioration in West African countries, while Ntiamoah et al. (2023) empirically demonstrated that agriculture has a mitigating effect.
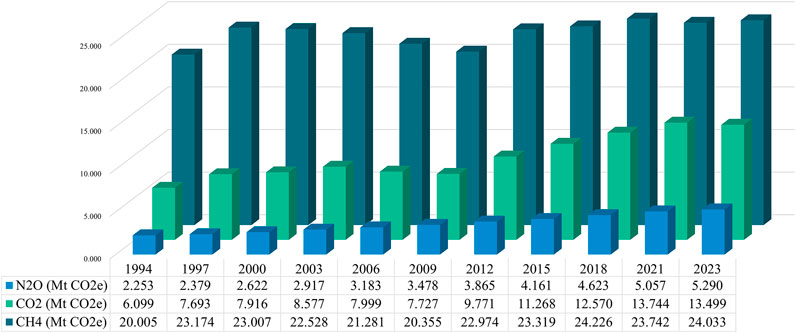
Figure 1. West African CO2, CH4, and N2O from 1994 to 2023 Graph source: Author construct; Data source: WDI (2025).
Nonetheless, ecological sustainability and economic studies have been central in assessing the connection between economic development and rising levels of environmental degradation (Erdogan, 2023). This is because it is posited that the environment degrades in early development phases but diminishes after economies reach a specific income level birthing the Environmental Kuznets Curve hypothesis (EKC)1, insinuating that, as a host of developing economies, the West African region’s environmental deterioration is tied to its economic development; however, after reaching a certain threshold, this positive association will divert to an inverse correlation, resulting in ecological sustainability (Jian et al., 2022). Conversely, studies like (Abokyi et al., 2019; Voumik et al., 2022; Miao et al., 2024; Yue and Byrne, 2024) challenge the EKC’s validity, finding that the evidence is highly contingent upon the development stage, region, and methodology. This underscores the need for region-specific empirical testing, especially in West Africa, to determine if an EKC turning point exists or if growth remains inextricably linked to rising emissions.
Against the aforementioned backdrop, this study extends the EKC works and contributes to the concept of ecological sustainability by assessing the link between environmental deterioration in West African countries and their economic advancements. It addresses three core research questions:
First, accounting for internal factors such as industrial advancements and population density while controlling for external and global impacts, like FDI, does the EKC hypothesis hold for West African countries? Second, considering their transboundary systems and trade, do the local implications of neighbouring West African countries spill over and spatially impact the environmental degradation of the local country? Third, whether on a full scale or across the region’s diverse income groups, is there a long-run correlation between the economic development and ecological deterioration of West African countries? The answers to these questions furnish robust empirical evidence on the EKC’s applicability to a developing region and yield practical guidance for policymakers who aim to integrate economic development with environmental protection.
Therefore, this study transcends the previous literary works (Ogundipe et al., 2019; Salari et al., 2021) insightfully by extending the single-metric-single-country assessment of environmental deterioration from 1994 to 2023, creating an index that focuses on renowned GHGs for West African countries. Notwithstanding, it accounts for spatial dependencies by employing Moran’s I index and plots, as well as the Spatial Durbin Model (SDM), to address the spatial spillover effects that have received limited scholarly attention in most existing works related to this study’s context. Furthermore, it categorises the sample into lower-middle and low-income groups to ascertain the interdependencies between economic growth and environmental depletion. Also, it accounts for long-run relationships by estimating cointegration using the Fully Modified Ordinary Least Squares (FMOLS) approach and robustly verifying the results with the Canonical Cointegration Regression (CCR) model. Understanding these dynamics is imperative to curb environmental degradation in West Africa.
This study proceeds in four subsequent sections. A review of literary works, in addition to this study’s hypotheses, is established in Section 2. Section 3 delineates the empirical settings and approach, followed by the analysis and discussion of the results in Section 4. The study concludes in Section 5 with a synthesis of findings, policy recommendations, and directions for future research.
2 Literature review
Greenhouse gases (GHGs), as a blanket, trap heat to warm the Earth and make it inhabitable for humans, thereby introducing the greenhouse effect (Basheer et al., 2024). However, anthropogenic sources over the years have intensified this effect, leading to a well-documented predicament: global warming (Liu and Li, 2025). As the top three gases of the GHGs, CO2, CH4, and N2O have diverse lifespans and impacts on the Earth, resulting from their modes of generation and byproducts after reacting in the atmosphere. CO2, as the basis of reference for the other gases, is known for having a Global Warming Potential (GWP) of 1, lingers in the atmosphere for over 3 decades, and has a radiative efficacy that is low per molecule but high in atmospheric concentration (Meinshausen et al., 2020). CH4 is a shorter-lived but radiatively potent GHG compared to CO2. When evaluated over a 100-year timeframe, its GWP is 28, reflecting its strong instantaneous radiative force, which is roughly 120 times more effective per molecule than CO2 at trapping energy (Saunois et al., 2020). N2O, on the other hand, has a stronger radiative efficacy with a GWP of 273 over a 100-year timeframe2. Consequently, the profound impact of these GHGs has cemented their status as a prioritised focus for scholarly inquiry.
To elaborate, Kircher (2025) refined the United States EPA’s GHG estimates to more accurately reflect CH4 leakage generated from natural gas infrastructure. Lin et al. (2025), from a cost-benefit perspective, focused on the marginal abatement cost (MAC) of GHGs for some Chinese provinces. Bao et al. (2025) evaluated the environmental footprint, with a specific focus on GHG, of eastern China’s petrochemical wastewater treatment plant (PWWTP). Alvi et al. (2025) introduced a framework for Organisation for Economic Co-operation and Development (OECD) countries to enhance their achievement of Sustainable Development Goals 13 (SDG 13) by assessing the impact finance has on GHG emissions. And, Rahman et al. (2025) examined the causality between GHGs and GDP in Middle East and North Africa (MENA) economies. Still, cross-contextual divergence is apparent in the trajectories of GHG emissions; leveraging strong institutions and technological capacity, advanced economies have demonstrated a capacity to decouple economic growth from emissions (Yang and Khan, 2021). In contrast, developing economies, especially those across Africa, are often characterised by an energy-intensive growth model reliant on fossil fuels, wherein industrial expansion and urbanisation directly propel GHG emissions upward (Alex-Oke et al., 2025). Externally, inflow of investments (Boamah et al., 2023) and trade (Espinosa Gracia et al., 2023) also reel in emission-intensive goods from other global economies. However, empirical evidence is emerging that confirms the significant mitigation potential of renewable energy and green investments (Wu and Ampong, 2025).
In West Africa, key drivers of emissions-driven environmental degradation include the dominance of extractive industries, cross-border energy trade, and external factors. This is exemplified by Nigeria (Oladimeji et al., 2015), Ghana (Abokyi et al., 2019), and Côte d’Ivoire (Keho, 2015), whose status as the region’s largest emitters stems directly from their intensive oil, gas, and industrial operations. Conversely, Mali, a landlocked country, and others exhibit lower cumulative emissions but are susceptible to regional spillover effects. Additionally, non-regional inflows, including the import of used vehicles and the net displacement of environmental impacts from the global North through trade, contribute to the rising levels of GHGs in the region (Ayesu and Asaana, 2023; Boateng and Klopp, 2022). This heterogeneity in emission profiles, as well as global spillover, underscores the need for spatial methodologies that capture interdependencies, alongside long-term analyses capable of distinguishing between transient fluctuations and persistent structural drivers.
2.1 GHGs vs. economic growth
Economic growth in developing countries often spurs environmental degradation, as rising incomes and improved living standards expand the consumption of energy and goods, thereby increasing the per capita GHG footprint (İnal et al., 2022). To elaborate, rising incomes enable previously unaffordable consumption, such as vehicle purchases and migration to urban centres. This behavioural shift accelerates urbanisation, often facilitated by deforestation, and increases GHG emissions through fumes from exhaust pipes, as well as heightened consumption of petroleum-based fuels for energy and transportation. However, economic development can also create pathways for GHG mitigation. As economies mature, heightened sustainability awareness often emerges, which fosters public recognition of environmentally friendly products and activities, subsequently contributing to emission reductions. These aforementioned insights reveal the centrality of GHG and economic growth in the EKC discussions.
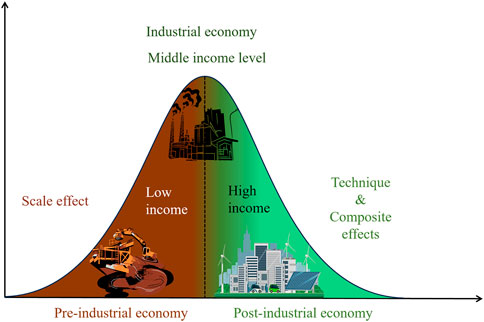
The EKC postulates an inverted U-shaped relationship between income per capita and environmental degradation (Grossman and Krueger, 1991). Initially, economic expansion exacerbates pollution through industrial scale-up and fossil fuel dependence (scale effects). Upon reaching a higher income threshold, economies transition towards cleaner technologies, stringent regulation, and service-based sectors, thereby reducing emissions through composition and technique effects. Figure 2 outlines the conceptual framework of the EKC hypothesis, tracing a three-phase evolution. The pre-industrial phase is marked by rising emissions fueled by resource-intensive growth. Emissions peak during the industrial phase, where rapid economic expansion typically supersedes environmental considerations. Finally, the post-industrial phase is characterised by declining emissions, driven by the synergistic effects of technological innovation, robust regulation, and shifting consumer preferences toward sustainability.
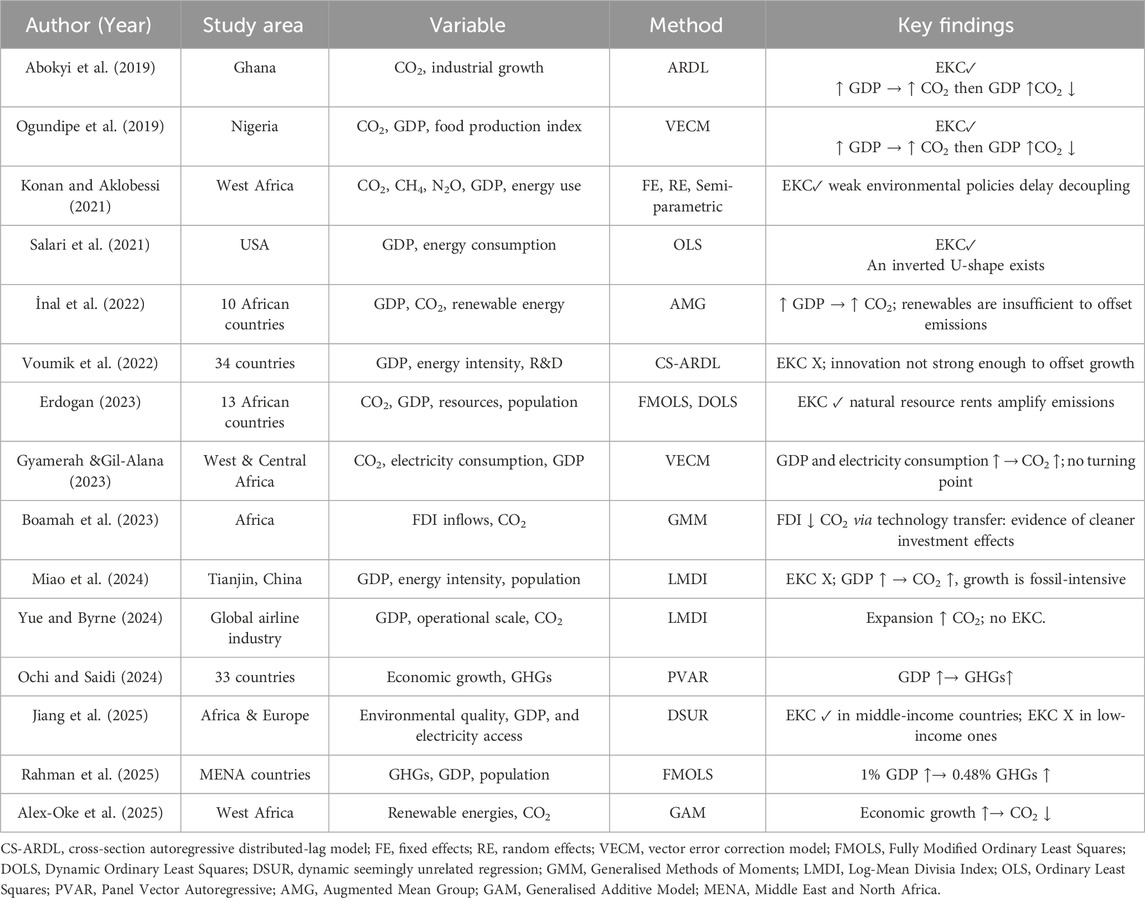
Empirical support for the EKC is nevertheless inconclusive. Findings validating the hypothesis exist for specific contexts, including Nigeria (Ogundipe et al., 2019), West Africa (Konan and Aklobessi, 2021), and other middle-income regions (Erdogan, 2023; Jiang et al., 2025), yet these are counterbalanced by contradictory results from Ghana (Abokyi et al., 2019), broader African samples (Gyamerah and Gil-Alana, 2023; İnal et al., 2022), and global datasets (Voumik et al., 2022). These inconsistencies imply that the EKC is a contingent, rather than universal, relationship, shaped by structural determinants such as industrial structure, energy portfolio, and governance efficacy. While developed economies often transition to cleaner production post-industrialisation, many developing regions remain locked in fossil-fuel-dependent growth. This divergence necessitates a rigorous, spatially sensitive empirical assessment to determine the validity of the EKC hypothesis within the West African context.
2.2 Literary gaps and hypothesis development
A synthesis of recent empirical works on GHGs, the economic growth–GHG nexus, and EKC is exhibited in Table 1. The outcomes, as iterated in Section 2.1, reveal the inconclusiveness on the validity of the EKC hypothesis, while insightfully showing the context-specific nature. Moreover, structural factors, including foreign direct investment (FDI), Industrial activities, population, and openness to trade, are found to be significant contributors to environmental degradation. However, three key gaps were noticed. (1) Most works applied a single-metric approach to quantify environmental degradation in relation to GHG, even though it encompasses other pollutants, and those that accounted for more than one assessed them individually. (2) Prior works assessed the linear correlation between economic growth and environmental degradation, but did not address spatial spillover effects or, in a unified paradigm, estimate their long-run dynamics. (3) Despite the disparities among the various West African income groups, most of the prior studies seldom addressed the income group heterogeneity. As such, this study proposes the following hypotheses to empirically address the aforementioned gaps while contributing to the theoretical understanding of the EKC.
H1a: As a measure of economic development, per capita GDP impacts the level of the top three greenhouse gases in West Africa, i.e., the GDP effects.
H1b: A cointegrated interdependence exists between West African countries’ per capita GDP and their ecological degradation, i.e., long-run effects.
H2a: Owing to their transboundary systems encompassing cross-border trading, shared energy, and infrastructure, West African countries’ greenhouse gases are impacted by their surrounding countries’ structural activities, i.e., spatial spillover effects.
H2b: The non-regional inflow of investments and trade impacts the varying levels of greenhouse gases in West African countries, i.e., global effects.
H3: West African countries’ per capita GDP positively impacts their environmental deterioration, while the square of per capita GDP has a negative impact, i.e., an inverted U-shape exists, and the EKC is validated.
3 Settings and methods
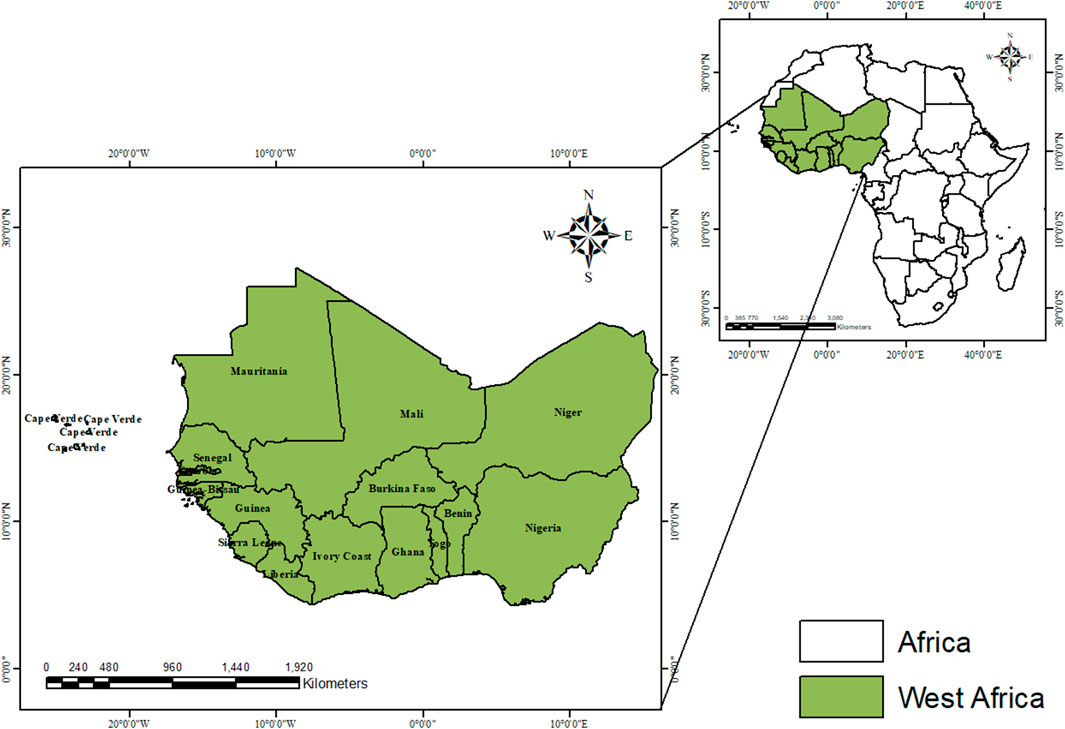
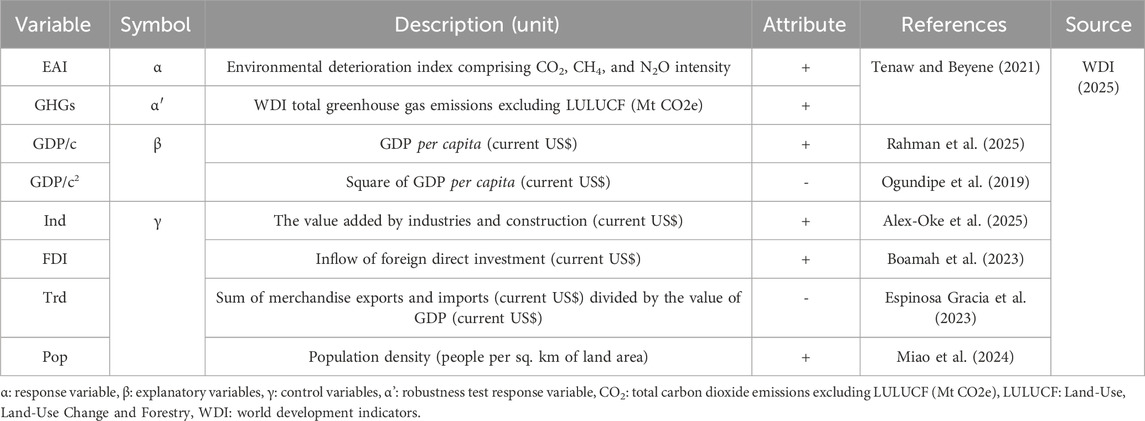
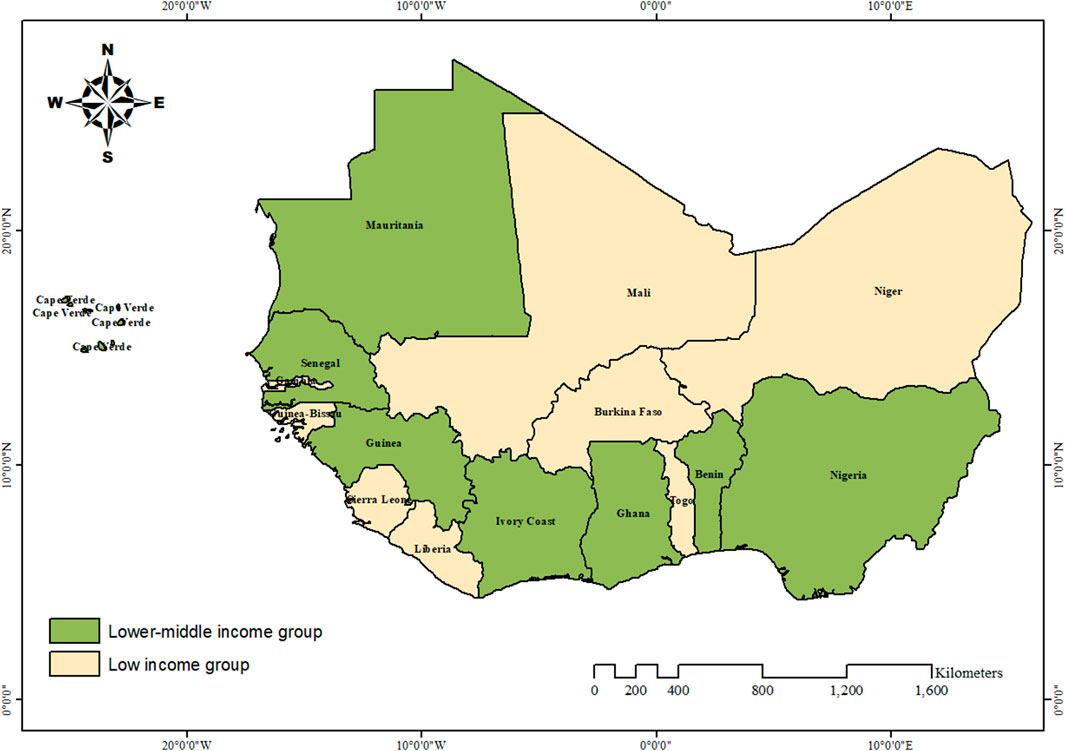
Data from the 16 West African countries (refer to Figure 3) spanning from 1994 to 2023 are utilised for the analyses in this study. The variables’ specifications and their corresponding data, along with sources and referenced literary works, are displayed in Table 2.
3.1 Entropy approach
An environmental deterioration index (EAI) comprising CO2 intensity, CH4 intensity, and N2O intensity is created to measure the degree of degradation in the West African region. The processes involved in the index creation are as follows.
Step 1: Create CO2 intensity (
The metrics are transformed into kg for a more readable ratio, and GDP (constant 2015 US$) is employed to adjust for inflation and facilitate comparison over time.
Step 2: Data standardisation utilising Equation 4.
Scyv is variable v standardised outcome for the sampled countries and their years, where indicator v corresponds to
The equation yields values [0,1]; however, to avoid assessment with zeros, Equation 5 is applied to transform and omit calculated zeros.
Step 3: Estimate contribution Ccyv using Equation 6.
Step 4: Estimate the value of entropy Ev for v with Equation 7.
Step 5: Estimate v’s entropy redundancy (EDv) using Equation 8.
Step 6: Estimate the weight (Wv) of v applying Equation 9.
Step 7: Estimate the composite index (EAIcy) with Equation 10.
3.2 Model specification
Due to the context of this work, the benchmark model is specified as:
First, an OLS model is established.
Second, the residuals after estimating Equation 11 are obtained via Equation 12.
Third, Ω, an unknown covariance matrix of errors, is estimated. Equations 13, 14 are applied to model the error structure for heteroskedasticity and autocorrelation, respectively.
Fourth, the transformed FGLS model is established in Equation 15.
3.2.1 Spatial model specification
The analysis of spatial dependencies in EAI and its explanatory factors across West African countries is conducted using the Moran I index, formulated in Equation 16, with the applied weights equated as shown in Equation 17.
Where N is the 16 West African countries; Referencing Wu et al. (2021),
According to Chen (2014) and Zhang et al. (2022), a general spatial model is given as depicted in Equation 18.
a. The Spatial Durbin Model (SDM) is feasible when
b. The Spatial Autoregression Model (SAR) is feasible when
c. The Spatial Error Model (SEM) is feasible when
3.2.2 Long-run model specification and study analytical framework
The FMOLS and CCR models are employed as long-run estimation approaches, as formulated in Equations 22, 23, respectively.
Where xn = vector of regressors;
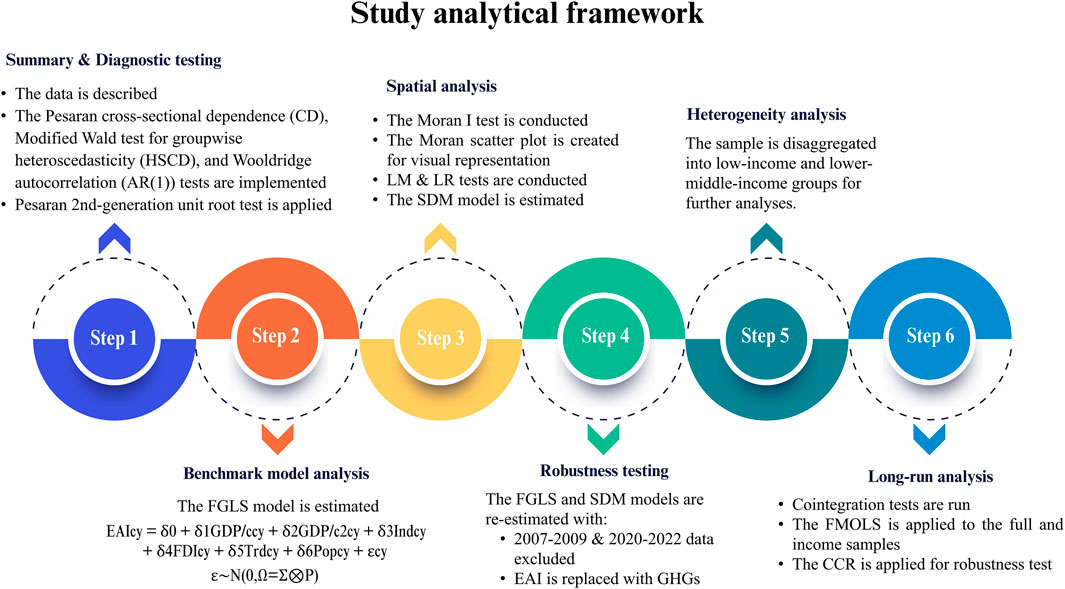
The analytical framework for addressing the study’s aim, while testing the proposed hypotheses, is presented in Figure 4.
4 Results and discussion
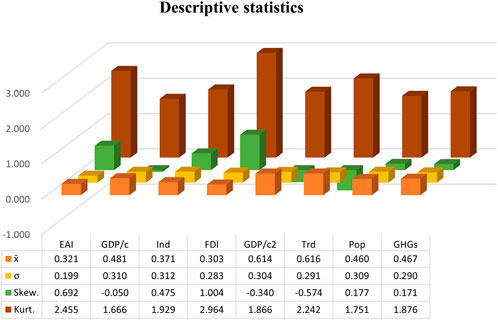
Table 2 provides a succinct description of the data. Furthermore, key distributional characteristics, namely, mean (x̄), standard deviation (σ), skewness (Skew.), and kurtosis (Kurt.), is estimated and visually reported in Figure 5 σ < x̄ indicates that the respective variables’ data are clustered relatively tightly around their mean values. Thus, in the case of EAI, it digresses from its mean (0.321) by 0.199, whereas for GDP/c and GDP/c2, they digress from their mean values by 0.310 and 0.304, respectively. In terms of measuring the asymmetry of the distribution to identify the data’s lopsidedness while assessing the heaviness and peakedness of the tails, the kurtosis values <3 reveal platykurtic distributions; thus, light tails with fewer outliers, while the skewness values of EAI (0.692), Ind (0.475), FDI (1.004), PoP (0.177), and GHGs (0.171) reveal a right-skewed distribution. In a nutshell, the |skewness| < 2 and kurtosis <4 values for the employed variables indicate a moderate or approximately normal distribution (Kline, 2016) with lower relative variability from their corresponding centre of distributions.
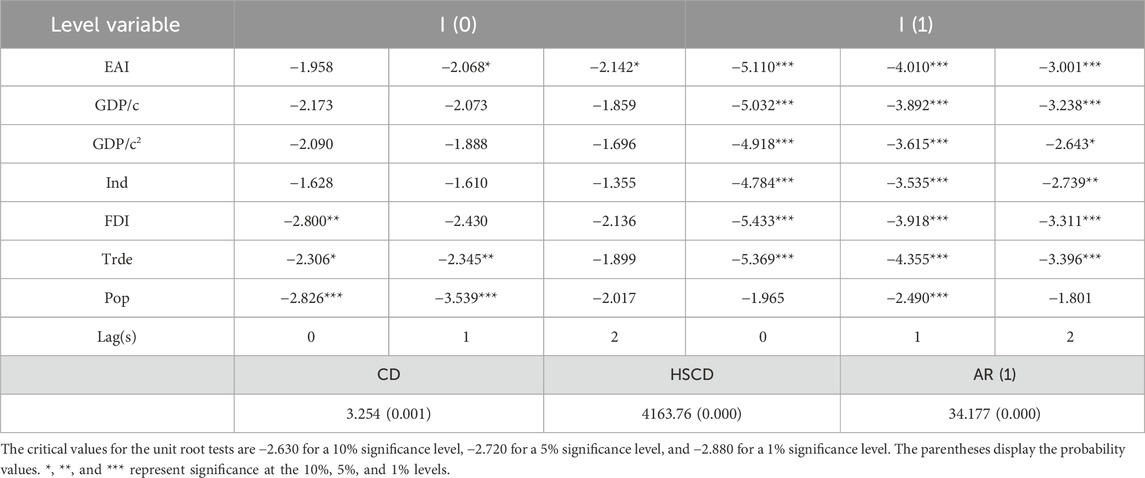
Proceeding from the descriptive statistics, the Pesaran cross-sectional dependence (CD), Modified Wald test for groupwise heteroscedasticity (HSCD), and Wooldridge autocorrelation (AR (1)) tests are run to estimate the error structure of the data in a regression setting to avoid spurious outcomes. The results, as reported in Table 3 under the columns CD (3.254, p-value <0.01), HSCD (4163.76, p-value <0.01), and AR (1) (34.177, p-value <0.01), indicate the presence of the three errors. The presence of CD also suggests that applying traditional unit root tests to assess stationarity may be inaccurate due to the violation of the assumption that the panels are independent of each other. Therefore, the Pesaran unit root test in the presence of cross-sectional dependence (PCADF) is applied (Pesaran, 2007), and the results are reported in Table 3.
The PCADF is conducted with three forms of lag augmentation: (1) there are no lags included, (2) a lag of one is included, and (3) a lag of two is included. Column I (0) reports on the variables at the level, while column I (1) reports on their first differences. The findings reveal that, except for Pop, which was stationary with lag 0 (−2.826, p-value <0.01) and lag 1 (−3.539, p-value <0.01), and FDI, which was stationary with lag 0 (−2.800, p-value <0.05), the rest of the variables were all non-stationary at I (0). However, at I (1), all but Pop were stationary; as such, Pop is integrated at level while the remaining variables are integrated of order 1.
4.1 Benchmark regression analysis
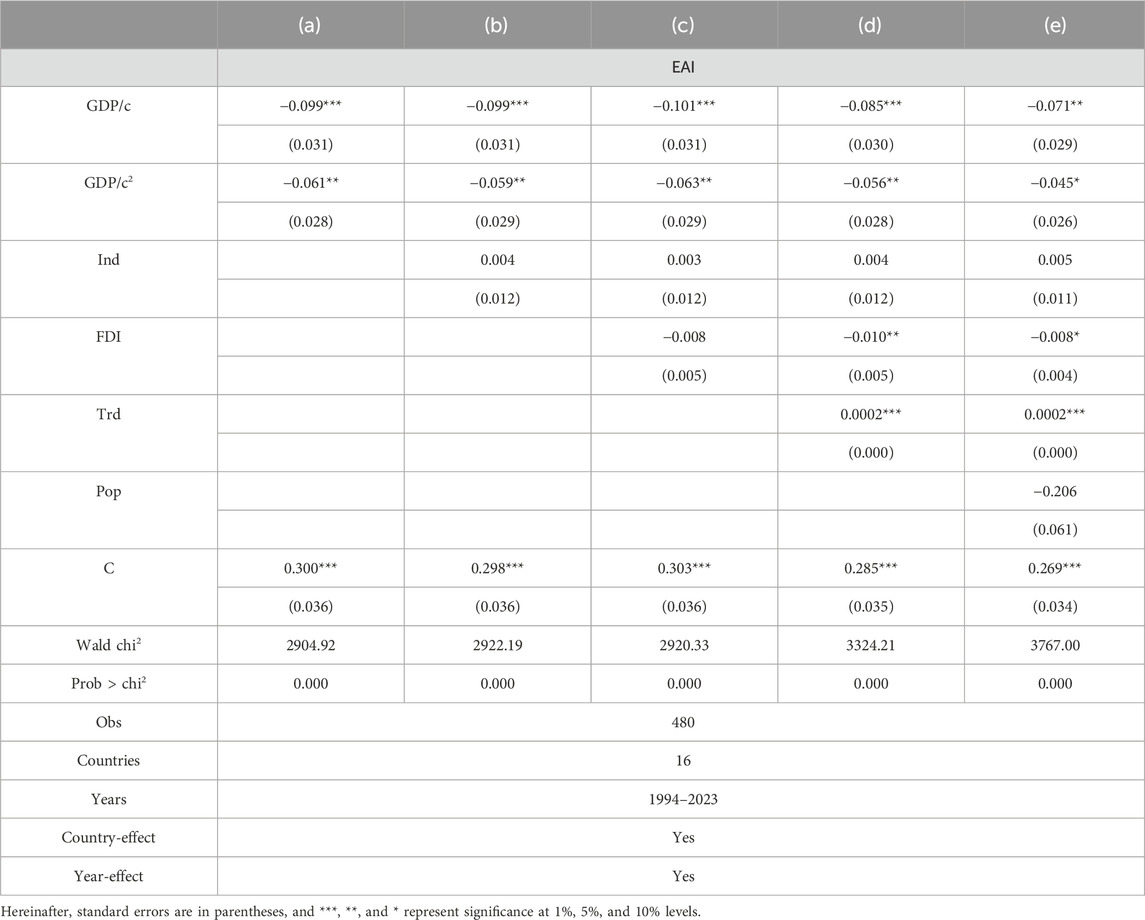
Considering the CD, HSCD, and AR (1) outcomes, the FGLS (Feasible Generalised Least Squares) approach is employed to conduct the benchmark analysis. As a BLUE (Best Linear Unbiased Estimator), the FGLS addresses the issue of biased standard errors that result in incorrect inference that OLS (Ordinary Least Squares) faces. Moreover, it is an efficient estimator when the type of error structure is specified, making it a suitable benchmark regression model. Table 4 reports on the results obtained after applying the FGLS approach; five models are generated, where column (a) regresses GDP and its square on EAI, and columns (b) to (e) regresses GDP and its square on EAI while gradually controlling for Ind, FDI, Trd, and Pop.
The models accounted for country and year effects to control for time-invariant unobserved heterogeneity and common year shocks, revealing that GDP/c and GDP/c2 have an inverse correlation with EAI. So, on average, ceteris paribus, a unit increase in per capita GDP reduces the intensity of environmental degradation by 0.085, while a unit increase in its squared term reduces it by 0.056, invalidating the EKC hypothesis. On the one hand, Ind and Trd are found to have a positive influence on EAI; however, while the coefficients for Trd are significant at the 1% level, those for Ind are statistically insignificant. On the other hand, FDI and Pop are found to have a negative impact on EAI, but only the FDI coefficient (−0.010) in column (d) is statistically significant at the 5% level. Overall, the Prob > chi2 indicates that the models are a good fit.
4.2 Spatial analysis
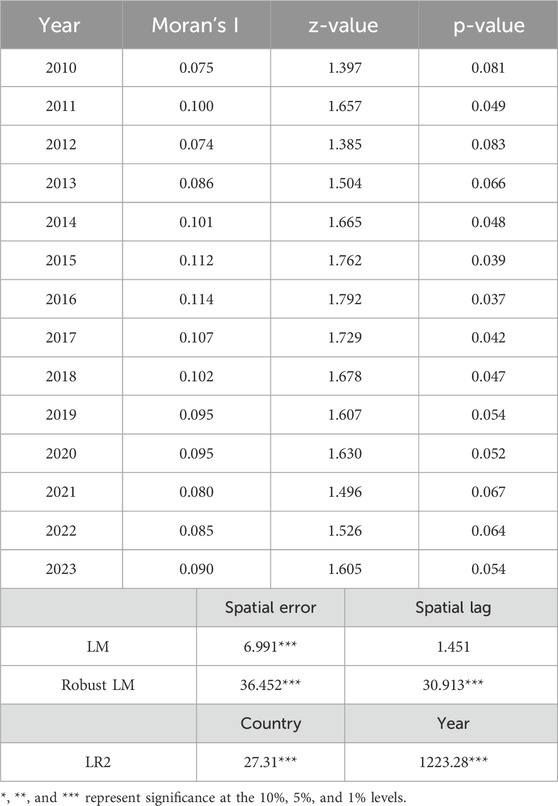
The preliminary tests (Table 3) revealed no presence of homogeneity; therefore, to address spatial dependencies and avoid model misspecifications, spatial approaches are employed for further analysis to account for geographical correlations. The Moran I results (see Table 5) reveal the presence of spatial dependence from 2010 to 2023, with highly significant outcomes in the years 2011 (p-value <0.049), 2014 (p-value <0.048), 2015 (p-value <0.039), 2016 (p-value <0.037), 2017 (p-value <0.042), and 2018 (p-value <0.047).
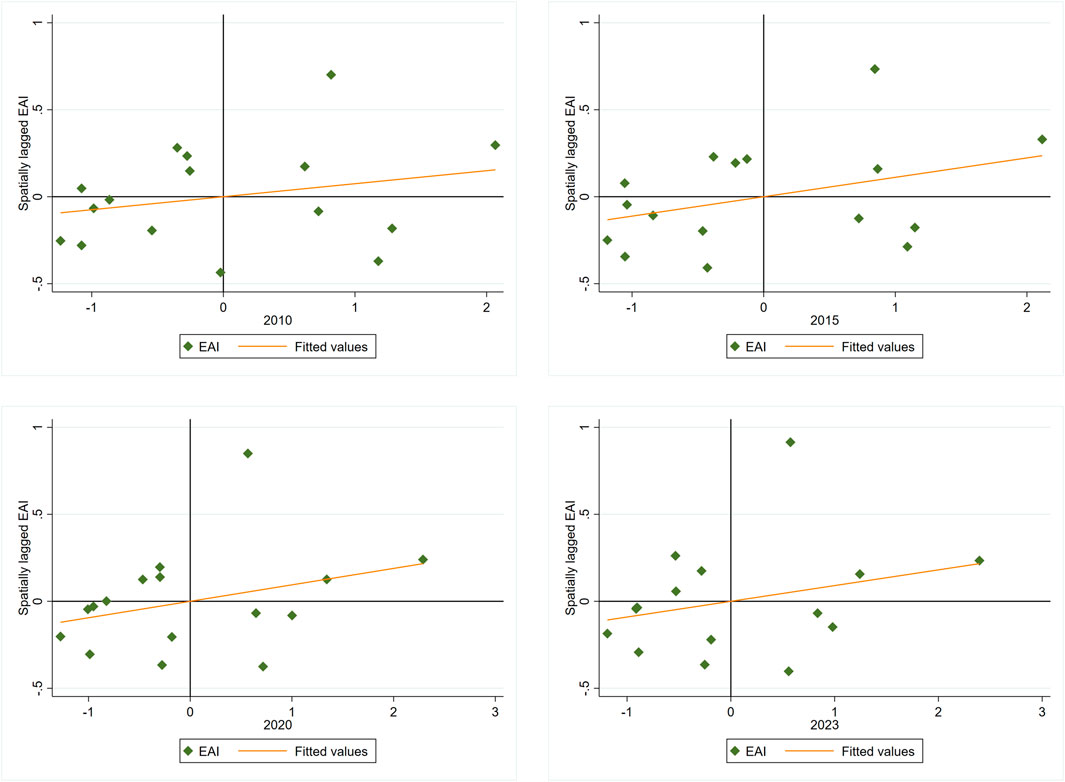
Nonetheless, to visually detect spatial clusters and outliers while revealing different types of spatial correlations, the Moran I scatter plot is applied using 2010, 2015, 2020, and 2023 as selected year sections. The outcomes, as displayed in Figure 6, show that most of the data points fall within the low-low (LL) quadrant, indicating a spatial cluster of countries with low EAI. This reveals a cold spot, meaning that countries with economies based on services or sustainable agriculture rather than heavy industry or resource extraction are bordered by countries with similar outlook. For instance, Benin and Burkina Faso or Senegal and Guinea-Bissau. The few countries that fall within the high-low (HL) and low-high (LH) quadrants indicate spatial outliers. This means that countries with high intensity in their environmental degradation are surrounded by countries with low degradation intensity, and vice versa. For instance, Nigeria with its oil industry emits high levels of GHGs than its neibouring country Benin.
With the presence of spatial dependence established, the LM test is estimated to find a fitting spatial regression model for the West African data. The results, as reported in the columns ‘Spatial error’ and ‘Spatial lag’ of Table 5, indicate that the selection of an SDM model is suitable due to the high significance level of the robust LM outcomes. Additionally, the LR tests conclude that the inclusion of a double fixed effects in the SDM model is warranted, given the highly significant outcomes of the year (1223.28, p-value <0.01) and country (27.31, p-value <0.01) effects. Therefore, an SDM with double fixed effects is selected for estimating the spatial correlation between EAI and GDP/c, GDP/c2, Ind, FDI, Trd, and Pop.
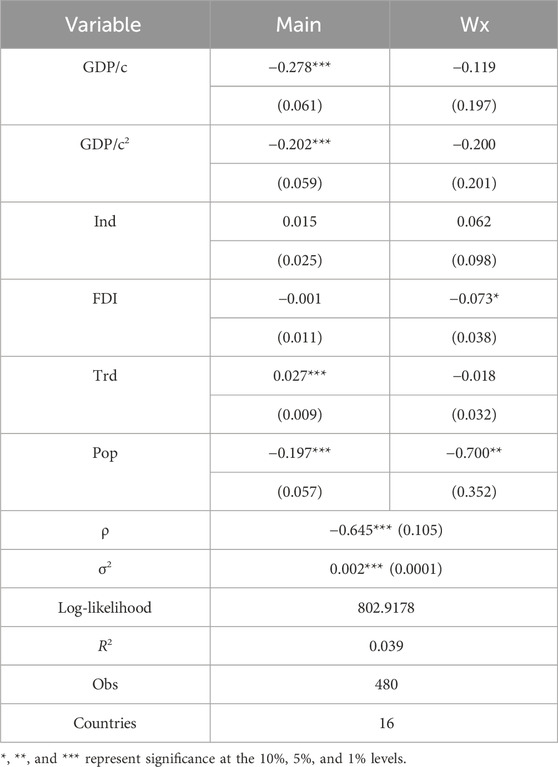
Table 6 reports on the results derived after implementing the SDM model, with the columns ‘Main’ and ‘Wx’ corresponding to local effects excluding spatial spillover effects and the effect of neighbouring countries’ spatially weighted values on the outcome of the local country’s EAI, respectively. Similar to the benchmark outcome, the SDM reveals that locally, GDP/c and GDP/c2 significantly lessen environmental deterioration by 0.278 and 0.202 per their unit rise with all things being constant; thus, pointing to economic development as a potential determinant of enhancing environmental sustainability through environmental degradation mitigation and invalidating the EKC hypothesis locally and spatially. Pertaining to the control variables, Industry value added has a boosting but a statistically insignificant effect overall, FDI mitigates EAI through spatial spillovers (Wx = −0.073*), trade openness locally enhances EAI by 0.027, and population density has a strongly adverse effect locally by 0.197 (p-value <0.01) and spatially spills over by 0.700 (p-value <0.05).
4.3 Robustness testing
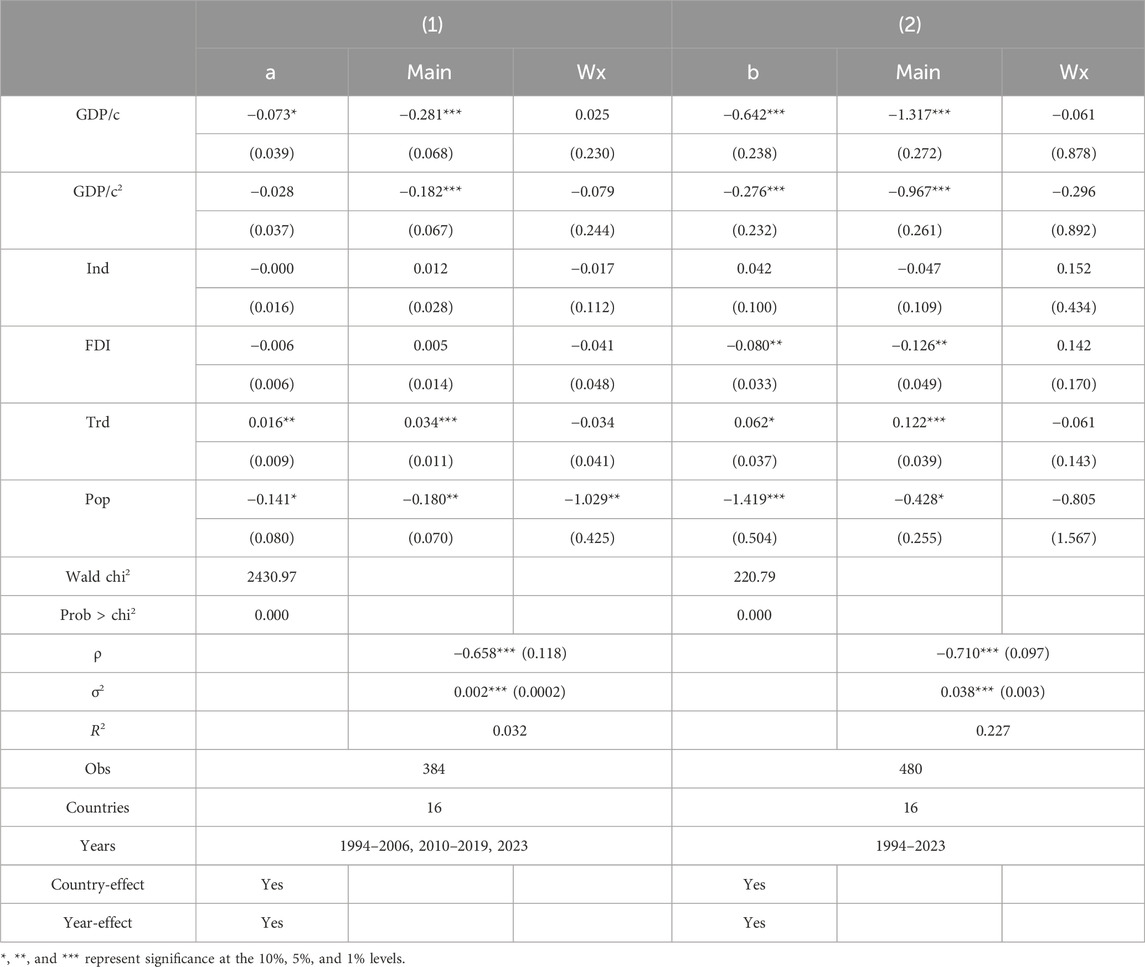
The benchmark and SDM models are modified to test the robustness of their outcomes, specifically their sensitivity to model and data adjustments. The robustness tests are conducted in two-fold: (1) the years 2007–2009 and 2020 to 2022 are excluded from the sampled years. The Great Recession of 2007–2009, stemming from the global financial crisis, generated unprecedented economic volatility. Subsequently, the COVID-19 pandemic (2020-2022) induced lockdowns and supply chain disruptions that produced a structural break in economic activities and data. (2) The EAI is replaced by WDI (2025) total GHGs. This accounts for potential error from variable selection while testing for scale and unit sensitivity.
Table 7 reports on the findings of the robustness analyses; columns a and b report on the FGLS’ robust analyses, while the rest report on the SDM’s robust analyses. It should be noted that the FGLS estimates reported in column b are assessed solely by factoring in heteroskedasticity and AR (1), as the presence of cross-sectional dependence was not found; column a follows the benchmark specified error structure. The consistency of the mitigation effect of GDP/c, GDP/c2, FDI, and Pop is maintained even with the exclusion of the 2007-2009 and 2020–2022 data, in addition to the substitution of the response variable. Moreover, the trade openness boosting impact is realised, but spatially, it negatively spills over, although the impact is statistically not significant. Overall, the robustness tests collectively indicate that the benchmark and SDM specifications yield stable estimates that are robust to both global economic shocks and alternative model parsimony selections.
4.4 Heterogeneity analysis
West Africa’s economic landscape, composed predominantly of lower-middle and low-income countries (WDI, 2025) (see Figure 7), reveals significant stratification in development pathways. The low-income countries feature informal sector dominance and volatile GDP growth, coupled with limited technological development and high climate vulnerability, while the lower-middle-income countries display greater economic diversification, moderate growth stability, increased infrastructure investment, and growing climate resilience. With that, this study proceeds to assess the impact of per capita GDP and its square, the value added by industries, inflows of FDI, trade openness, and population density on the extent of environmental deterioration in the various West African countries’ income groups.
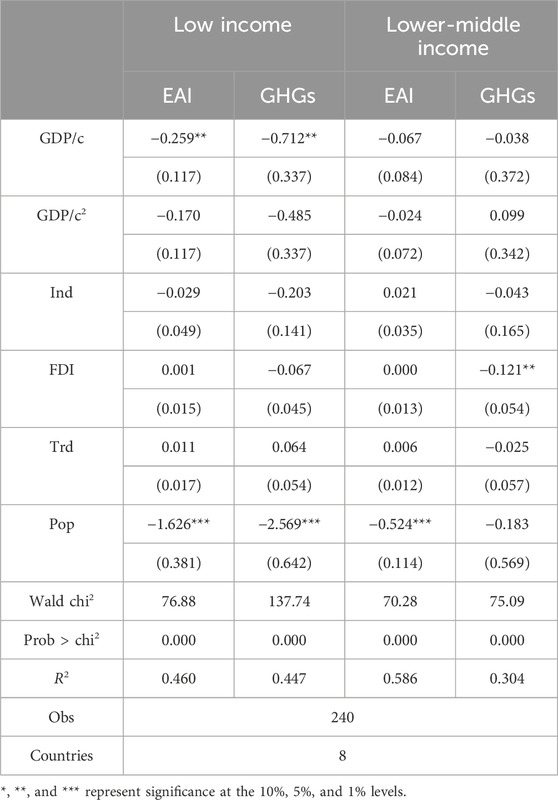
The panel-corrected standard error (PCSE) model is utilised for the heterogeneity estimations. The SDM and FGLS models were initially considered, but Moran’s I revealed no spatial dependence in the low-income group, in addition to the small sample sizes after decomposing the countries into their various income groups. As such, to maintain consistency and allow for a fair comparison, the PCSE approach is applied, and the results are reported in Table 8. It should be noted that column EAI reports on the PCSE model with EAI as the response variable, whereas the GHGs column is the robustness test with the GHGs as the response variable. The presence of cross-sectional dependence was found only in the model under column EAI for the lower-middle income group; as such, its PCSE model was modelled to factor in cross-sectional dependencies, heteroscedasticity, and AR (1), while the remaining three models were modelled to factor in all the errors, excluding cross-sectional dependencies.
The PCSE models revealed an inverse correlation between per capita GDP and environmental degradation in both income groups, as discovered in the full sample; however, the EAI model and GHGs model for the low-income group had significant outcomes at the 5% level. Insinuating that, with all things being equal, a unit rise in GDP/c of the low-income West African countries will mitigate environmental degradation or GHGs by 0.259 or 0.712, respectively. The EKC hypothesis is invalidated in both income groups, as the GDP/c and GDP/c2 coefficients do not conform to the underlying concept of the hypothesis. Nevertheless, the coefficients of population density are found to impact EAI negatively, and the same outcome is discovered for the GHGs model.
4.5 Long-run analysis
The second-generation unit root test (Table 3) indicated that all but Pop are integrated of order 1. As such, the Kao cointegration test is conducted to determine if a long-run equilibrium exists within the data, excluding Pop, thereby corroborating the estimation of a long-run analysis. According to the results (see Table 9), a conintegration exists within both the full sample and the low-income group. Based on this, the FMOLS approach is used, with the CCR implemented as a robust testing approach to assess the long-run estimates of GDP/c, GDP/c2, FDI, Ind, and Trd’s impact on EAI within the full sample and low-income groups.
Table 10 reports the findings of the FMOLS and CCR models for the total West African countries and those specifically categorised within the low-income group. For the full sample, GDP/c and GDP/c2 are found to exacerbate environmental degradation in West African countries, whereas FDI, Ind, and Trd have an adverse effect, as indicated in the FMOLS column. The CCR outcomes reveal similar findings to the FMOLS, but only the estimates for FDI (−0.01), Ind (−0.07), and Trd (−0.01) are statistically significant at the 1% level. For the low-income countries, similar outcomes as the full sample are realised for the explanatory and control variables pertaining to their effect on EAI. However, the significantly positive impact that GDP/c (0.15) and GDP/c2 (0.12) have on EAI, as shown in the FMOLS column, is corroborated by the findings of the CCR. Furthermore, the value added by industries is found to significantly mitigate EAI in the long run. Thus, on average, ceteris paribus, a unit rise in Ind will result in a decline in the value of EAI by either 0.10 or 0.11.
4.6 Discussion
This study spatially examines the correlation between environmental degradation and the role of population and economic development, coupled with the inflow of foreign investments, openness to trade, and the value industries add in West African countries. Synthesising the outcomes, this study contributes to the body of literature by empirically revealing that:
a. Spatial spillover effects: The presence of spatial dependencies exists, validating H2a. The Moran outcomes (Table 5; Figure 6) and the autoregressive coefficients in Tables 6 and 7 confirmed that the ecological sustainability of countries in West Africa is influenced by their neighbouring countries, as they are either clustered with countries sharing similar environmental traits (Burkina Faso and Niger) or surrounded by high emitters (Togo and Ghana). This corroborates with Jian et al.’s (2022) argument that the ecological predicaments of developing economies are aggravated by cross-border interdependencies.
b. GDP effects: The dynamics of economic growth and environmental degradation are quite complex. It is found that per capita GDP and its square locally enhance the ecological sustainability of West African countries by mitigating environmental pollution, corroborating the findings of Alex-Oke et al. (2025). However, a contrasting effect is realised in the long run, with the effects being more pronounced in low-income countries, substantiating the findings of Miao et al. (2024) and challenging the premise of income-driven decoupling. Nonetheless, these outcomes validate this study’s hypotheses H1a and H1b. A growth in GDP funds renewable and green practices–such as Côte d’Ivoire’s climate-smart cocoa initiatives and Nigeria’s cement plant carbon capture and storage trials–i.e., clean energy, establishment of eco-friendly infrastructure, and reduction in GHG emissions. Still, oil and gas extraction, mineral mining, agricultural frontiers, and massive energy trade are the economic strongholds of West African countries (İnal et al., 2022). Countries like Nigeria reinvest oil revenues in fossil infrastructure, while agriculturally based, low-emitting countries like Burkina Faso have been diversifying their economic structure by introducing and increasing industrial processes. With these actions, high emissions get locked in for decades, resulting in a rise in GDP in tandem with GHG emissions in the long run.
c. External global effects: The inflow of foreign investments into West African countries is found to impact their environmental degradation adversely (Tables 4, 7, and 10), supporting the findings of Boamah et al. (2023) and the “pollution halo” hypothesis, which suggests that globalisation promotes green practices. Most investors contribute to the sustainability of their host country to ensure long-term returns through cleaner technology transfers and manufacturing processes. For instance, Senegal’s wind farm reduces emissions along the country’s coastal energy corridors; FDI into Lagos’ Blue Line Rail and Accra’s electric buses lowers transport-related CO2; and FDI into Liberia’s carbon credits conserves and protects the cross-border forests. Conversely, openness to trade is found to exacerbate environmental deterioration (Tables 4, 6–8), repudiating the findings of Espinosa Gracia et al. (2023). Through the importation of used vehicles, West African countries introduce emission-intensive products, resulting in a rise in their emissions due to heavy fumes from exhaust pipes. Also, heavy reliance on imported products from the global North necessitates the movement of ships and vessels, which contributes to transportation-related emissions (Ayesu and Asaana, 2023). These insights validate H2b.
d. Local structural effects: Unlike Boamah et al. (2023) and Alex-Oke et al. (2025), the value added by industries is found to affect environmental degradation in the long run negatively, whereas population density exhibits a similar effect locally, and its effects spill over to neighbouring countries, substantiating the findings of Erdogan (2023). Using agricultural waste, some palm oil mills in Ghana utilise palm kernel shells as boiler fuel, while others treat their organic wastewater from the processing stage to capture CH4 and use it to generate energy. The continuous application of these processes, in conjunction with new green industrial processes, helps mitigate the impact of industrial value added on ecological degradation. Population density, on the other hand, can mitigate GHGs through agglomeration effects and more efficient infrastructure, coined as “demand-side pressure reduction” by Erdogan (2023), and these effects inherently spill over into neighbouring areas. To elaborate, population density reduces the per-unit cost of centralised infrastructure, such as electrical grids and waste management, thereby displacing the use of decentralised, high-emission sources like diesel generators and charcoal, with benefits often extending to surrounding areas.
e. EKC hypothesis validity: The EKC hypothesis and this study’s H3 are invalidated. For the EKC to hold, the coefficient for GDP/c must be positive, and its square must be negative. However, Table 10 shows that both are positive and significant in the long run, rejecting the inverted U-shape hypothesis. This outcome challenges the EKC validation in middle-income contexts, such as Nigeria (Ogundipe et al., 2019), but aligns with broader African studies and global evidence that question the EKC’s universality (Gyamerah and Gil-Alana, 2023; Voumik et al., 2022).
Overall, the discussion depicts that the EKC is not validated in West Africa for this study, where, in the long run, economic growth intensifies emissions, and globalisation’s mitigating effect is limited. This necessitates a policy shift towards stronger regional governance, targeted green FDI, and industrial transformation to avoid locking the region into an unsustainable, emission-intensive development trajectory.
5 Conclusion and recommendations
Applying data from 1994 to 2023 for West African countries, this study comprehensively estimates the validity of the EKC hypothesis in the region. Through second generation (PCADF) and non-spherical error methods (FGLS and PCSE), spatial approaches (SDM), and long-run estimators (FMOLS and CCR), the findings of the study reveal (1) the presence of spatial dependencies in the environmental degradation of countries within the region. Thus, three types of spatial associations are discovered: low-low clusters (LL), where low-EAI countries are neighbours to other low-EAI countries; low-high outliers (LH), where a low-EAI country is surrounded by high-EAI neighbours; and high-low outliers (HL), where a high-EAI country is bordered by low-EAI countries. (2) Per capita GDP and its quadratic form locally have an inverse relationship with environmental degradation, but in the long run, have a positive correlation. (3) FDI is found to boost environmental sustainability through cleaner technology transfers and manufacturing processes, supporting the pollution halo hypothesis; however, trade through the importation of emission-intensive goods and transportation-related emissions exacerbates environmental degradation. (4) Industries affect environmental degradation in the long run negatively, whereas population density exhibits a similar effect locally, and its effects spill over to neighbouring countries. (5) The inverted U-shaped correlation does not hold for West African countries, insinuating that the EKC hypothesis is not universally applicable.
5.1 Policy recommendations
Based on the above conclusions, this study yields contextually grounded policy insights for West Africa as follows:
➢ The presence of spatial dependence insightfully shows that addressing ecological deterioration in the region demands spatially coordinated policies. By leveraging West Africa’s diverse geography and economies of scale through regionally integrated initiatives like the ECOWAS-led WAPP (West African Power Pool) and the African Union’s GGWSSI (Great Green Wall for the Sahara and Sahel Initiative), complemented by cross-border green infrastructure projects, countries in the region can effectively and efficiently create a pathway to decouple economic growth from emissions, rather than country-specific actions.
➢ The mixed impacts of FDI and trade reveal the complex pressure globalisation exerts on the region. ECOWAS as a bloc should negotiate for the reduction of tariffs on imported EGS (Environmental Goods and Services) to make the green transition cheaper and faster. Also, develop and implement green FDI screening and incentive guidelines at the regional level and offer tax breaks, fast-tracked permits, and other incentives only to foreign investments that transfer advanced, low-emission technologies and adhere to environmental longevity standards.
➢ As local structures, the value industries add and the density of population in the region mitigate their impact on ecological degradation through agglomeration effects and more efficient infrastructure. Therefore, policymakers should foster the development of industrial symbiosis parks. In these purpose-built hubs, the waste output of one facility serves as the raw material for another, creating a circular economy. A foundational element of this strategy is the implementation of modern, centralised waste management systems in densely populated cities. These systems are essential for capturing landfill CH4 for energy generation and for supplying industries with standardised, reliable streams of recyclable materials.
The recommended measures offer a viable pathway to align the region’s development with the SDGs (Sustainable Development Goals), facilitating a transition away from emission-intensive trajectories.
5.2 Limitations and future research direction
This study achieved its aim, but it remains limited nonetheless. Some variables’ data had to be interpolated to fill in missing spots, which may have affected the precision, suggesting that sector-specific or primary data could enhance precision in future works. Core EKC drivers are captured, but significant factors such as renewable energy adoption and urbanisation patterns were not accounted for. Methodologically, the SDM, FGLS, PCSE, FMOLS, and CCR provided robust outcomes, but they assume linearity; future studies could explore dynamic or nonlinear models to uncover more complex pathways. The exclusive focus on West Africa limits the generalisability of the findings. A comparative analysis across other African regions is essential to determine if the rejection of the EKC hypothesis is a unique feature of West Africa or a broader continental phenomenon.
Data availability statement
The raw data supporting the conclusions of this article will be made available by the authors, without undue reservation.
Author contributions
DT: Conceptualization, Formal Analysis, Project administration, Supervision, Validation, Writing – original draft, Writing – review and editing. VB: Conceptualization, Data curation, Formal Analysis, Investigation, Methodology, Resources, Software, Validation, Writing – original draft, Writing – review and editing. QD: Formal Analysis, Investigation, Validation, Visualization, Writing – original draft. JB: Formal Analysis, Investigation, Visualization, Writing – review and editing.
Funding
The author(s) declare that no financial support was received for the research and/or publication of this article.
Conflict of interest
The authors declare that the research was conducted in the absence of any commercial or financial relationships that could be construed as a potential conflict of interest.
Generative AI statement
The author(s) declare that no Generative AI was used in the creation of this manuscript.
Any alternative text (alt text) provided alongside figures in this article has been generated by Frontiers with the support of artificial intelligence and reasonable efforts have been made to ensure accuracy, including review by the authors wherever possible. If you identify any issues, please contact us.
Publisher’s note
All claims expressed in this article are solely those of the authors and do not necessarily represent those of their affiliated organizations, or those of the publisher, the editors and the reviewers. Any product that may be evaluated in this article, or claim that may be made by its manufacturer, is not guaranteed or endorsed by the publisher.
Footnotes
1Grossman, G. M., and Krueger, A. B. (1991). Environmental impacts of a North American free trade agreement. National Bureau of Economic Research.
2EPA (2025). Understanding global warming potentials. United States Environmental Protection Agency. Available online at: https://www.epa.gov/ghgemissions/understanding-global-warming-potentials.
References
Abokyi, E., Appiah-Konadu, P., Abokyi, F., and Oteng-Abayie, E. F. (2019). Industrial growth and emissions of CO2 in Ghana: the role of financial development and fossil fuel consumption. Energy Rep. 5, 1339–1353. doi:10.1016/j.egyr.2019.09.002
Adu, D. T., and Denkyirah, E. K. (2018). Economic growth and environmental pollution in West Africa: testing the environmental kuznets curve hypothesis. Kasetsart J. Soc. Sci. doi:10.1016/j.kjss.2017.12.008
Alex-Oke, T., Bamisile, O., Cai, D., Olalekan, O. Q., Olubodun, A. A., Ukwuoma, C. C., et al. (2025). Comparative analysis of generalized additive model and quantile regression model in assessing renewable energy’s role in emissions mitigation in West Africa. J. Clean. Prod. 519, 146028. doi:10.1016/j.jclepro.2025.146028
Alvi, S., Ahmad, I., Nawaz, S. N., Cornell, W., Anser, M. K., and Hassan, M. U. (2025). The role of green finance, energy transition, and digitalization in OECD greenhouse gas emissions. J. Clean. Prod. 518, 145865. doi:10.1016/j.jclepro.2025.145865
Ayesu, E. K., and Asaana, C. A. (2023). Global shipping and climate change impacts in Africa: the role of international trade. J. Shipp. Trade 8 (1), 19. doi:10.1186/s41072-023-00149-6
Bao, X., Gao, S., Yao, H., Fu, X., Gao, X., Wang, H., et al. (2025). Greenhouse gas emission reduction strategies for petrochemical wastewater treatment: life cycle assessment of retrofitting scenarios. J. Clean. Prod. 524, 146487. doi:10.1016/j.jclepro.2025.146487
Basheer, S., Wang, X., Farooque, A. A., Nawaz, R. A., Pang, T., and Neokye, E. O. (2024). A review of greenhouse gas emissions from agricultural soil. Sustainability 16 (11), 4789. doi:10.3390/su16114789
Boamah, V., Tang, D., Zhang, Q., and Zhang, J. (2023). Do FDI inflows into African countries impact their CO2 emission levels? Sustainability 15 (4), 3131. doi:10.3390/su15043131
Boateng, F. G., and Klopp, J. M. (2022). Beyond bans: a political economy of used vehicle dependency in Africa. J. Transp. Land Use 15 (1), 651–670. doi:10.5198/jtlu.2022.2202
EDGAR (2025). GHG emissions of all world countries. Luxembourg: Publications Office of the European Union. Available online at: https://edgar.jrc.ec.europa.eu/report_2025.
Erdogan, S. (2023). On the impact of natural resources on environmental sustainability in African countries: a comparative approach based on the EKC and LCC hypotheses. Resour. Policy 88, 104492. doi:10.1016/j.resourpol.2023.104492
Espinosa-Gracia, A., Almazán-Gómez, M. Á., and Jiménez, S. (2023). CO2 emissions and Global Value Chains Indicators: new evidence for 1995–2018. J. Environ. Manag. 343, 118239. doi:10.1016/j.jenvman.2023.118239
Gyamerah, S. A., and Gil-Alana, L. A. (2023). A multivariate causality analysis of CO2 emission, electricity consumption, and economic growth: evidence from Western and Central Africa. Heliyon 9 (1), e12858. doi:10.1016/j.heliyon.2023.e12858
İnal, V., Addi, H. M., Çakmak, E. E., Torusdağ, M., and Çalışkan, M. (2022). The nexus between renewable energy, CO2 emissions, and economic growth: empirical evidence from African oil-producing countries. Energy Rep. 8, 1634–1643. doi:10.1016/j.egyr.2021.12.051
Jacquet, I., Zhang, J., Wang, K., Liang, S., Fu, S., and Liu, S. (2025). Effectiveness of governmental and policy initiatives in reducing agricultural greenhouse gas emissions: an empirical analysis of West Africa. Environ. Dev. 56, 101297. doi:10.1016/j.envdev.2025.101297
Jian, L., Chuimin, K., Jijian, Z., Yusheng, K., and Ntarmah, A. H. (2022). The relationship between economic growth and environmental degradation: could West African countries benefit from EKC hypothesis? Environ. Sci. Pollut. Res. 29 (48), 73052–73070. doi:10.1007/s11356-022-21043-x
Jiang, Q., Rahman, Z. U., and Zhang, X. (2025). Analyzing the environmental Kuznets and Philips curves in Europe and African regions: determining the role of Chinese FDI, institutional qualities, and access to electricity. Sustain. Futur. 9, 100579. doi:10.1016/j.sftr.2025.100579
Keho, Y. (2015). An econometric Study of the long-run determinants of CO2 emissions in Cote d’ivoire. J. Finance & Econ. 3 (2), 11–21. doi:10.12735/jfe.v3i2p11
Kircher, K. J. (2025). Accounting for methane from natural gas infrastructure in United States greenhouse gas emission estimates. Energy Policy 206, 114747. doi:10.1016/j.enpol.2025.114747
Kline, R. B. (2016). Principles and practice of structural equation modeling. 4th ed. New York, NY: The Guilford Press. Available online at: https://psycnet.apa.org/record/2015-56948-000.
Konan, Y. S., and Aklobessi, K. (2021). Revisiting the environmental Kuznets curve: evidence from West Africa. Environ. Econ. 12 (1), 64–75. doi:10.21511/ee.12(1).2021.06
Lin, S., Wang, Y., Li, L., Lei, Y., Wu, S., Wang, Y., et al. (2025). The cost and benefit of synergistic emission reduction of CO2 and non-CO2 greenhouse gases in the industrial sector in the context of carbon neutrality. J. Clean. Prod. 525, 146551. doi:10.1016/j.jclepro.2025.146551
Liu, T., and Li, Z. (2025). Does global warming affect the ecological surplus? J. Nat. Conservation 88, 127015. doi:10.1016/j.jnc.2025.127015
Meinshausen, M., Nicholls, Z. R. J., Lewis, J., Gidden, M. J., Vogel, E., Freund, M., et al. (2020). The shared socio-economic pathway (SSP) greenhouse gas concentrations and their extensions to 2500. Geosci. Model Dev. 13 (8), 3571–3605. doi:10.5194/gmd-13-3571-2020
Miao, Y., Lu, H., Cui, S., Zhang, X., Zhang, Y., Song, X., et al. (2024). CO2 emissions change in Tianjin: the driving factors and the role of CCS. Appl. Energy 353, 122122. doi:10.1016/j.apenergy.2023.122122
Ntiamoah, E. B., Appiah-Otoo, I., Li, D., Twumasi, M. A., Yeboah, E. N., and Chandio, A. A. (2023). Estimating and mitigating greenhouse gas emissions from agriculture in West Africa: does threshold matter? Environ. Dev. Sustain. 26 (4), 10623–10651. doi:10.1007/s10668-023-03167-3
Ochi, A., and Saidi, A. (2024). Impact of governance quality, population and economic growth on greenhouse gas emissions: an analysis based on a panel VAR model. J. Environ. Manag. 370, 122613. doi:10.1016/j.jenvman.2024.122613
Ogundipe, A. A., Obi, S., and Ogundipe, O. M. (2019). Environmental degradation and food security in Nigeria. Int. J. Energy Econ. Policy 10 (1), 316–324. doi:10.32479/ijeep.8083
Oladimeji, T., Sonibare, J., Odunfa, M., and Ayeni, A. (2015). Modeling of criteria air pollutant emissions from selected Nigeria petroleum refineries. J. Power Energy Eng. 03 (06), 31–45. doi:10.4236/jpee.2015.36004
Pesaran, M. H. (2007). A simple panel unit root test in the presence of cross-section dependence. J. Appl. Econ. 22 (2), 265–312. doi:10.1002/jae.951
Rahman, S. M., Raihan, A., Alam, M. S., and Chowdhury, S. (2025). Greenhouse gas emission dynamics and climate change mitigation efforts toward sustainability in the Middle East and North Africa (MENA) region. Reg. Sustain. 6 (4), 100246. doi:10.1016/j.regsus.2025.100246
Salari, M., Javid, R. J., and Noghanibehambari, H. (2021). The nexus between CO2 emissions, energy consumption, and economic growth in the U.S. Econ. Analysis Policy 69, 182–194. doi:10.1016/j.eap.2020.12.007
Saunois, M., Stavert, A. R., Poulter, B., Bousquet, P., Canadell, J. G., Jackson, R. B., et al. (2020). The global methane budget 2000–2017. Earth Syst. Sci. Data 12 (3), 1561–1623. doi:10.5194/essd-12-1561-2020
Tenaw, D., and Beyene, A. D. (2021). Environmental sustainability and economic development in Sub-Saharan Africa: a modified EKC hypothesis. Renew. Sustain. Energy Rev. 143, 110897. doi:10.1016/j.rser.2021.110897
Voumik, L. C., Rahman, M., and Akter, S. (2022). Investigating the EKC hypothesis with renewable energy, nuclear energy, and R&D for EU: fresh panel evidence. Heliyon 8 (12), e12447. doi:10.1016/j.heliyon.2022.e12447
Wu, J., and Ampong, S. A. (2025). The synergistic impact of renewable energy and the digital economy on CO2 emissions in Africa. Sustain. Futur. 10, 100921. doi:10.1016/j.sftr.2025.100921
Wu, X., Huang, Y., and Gao, J. (2021). Impact of industrial agglomeration on new-type urbanization: evidence from Pearl River Delta urban agglomeration of China. Int. Rev. Econ. & Finance 77, 312–325. doi:10.1016/j.iref.2021.10.002
Yang, X., and Khan, I. (2021). Dynamics among economic growth, urbanization, and environmental sustainability in IEA countries: the role of industry value-added. Environ. Sci. Pollut. Res. 29 (3), 4116–4127. doi:10.1007/s11356-021-16000-z
Yue, X., and Byrne, J. (2024). Identifying the determinants of carbon emissions of individual airlines around the world. J. Air Transp. Manag. 115, 102521. doi:10.1016/j.jairtraman.2023.102521
Keywords: environmental kuznets curve (EKC), spatial econometrics (SDM), long run analysis (FMOLS and CCR), emissions (GHGs), west africa
Citation: Tang D, Boamah V, Ding Q and Bai J (2025) Spatial dependencies and long-run dynamics of the Environmental Kuznets Curve in West Africa: an analysis of growth vs. emissions. Front. Environ. Sci. 13:1621251. doi: 10.3389/fenvs.2025.1621251
Received: 30 April 2025; Accepted: 17 October 2025;
Published: 30 October 2025.
Edited by:
Elias T. Ayuk, Independent Researcher, Accra, GhanaReviewed by:
Ummar Faruk Saeed, Jiangsu University, ChinaZia Ur Rehman, Woman University Swabi, Pakistan
Copyright © 2025 Tang, Boamah, Ding and Bai. This is an open-access article distributed under the terms of the Creative Commons Attribution License (CC BY). The use, distribution or reproduction in other forums is permitted, provided the original author(s) and the copyright owner(s) are credited and that the original publication in this journal is cited, in accordance with accepted academic practice. No use, distribution or reproduction is permitted which does not comply with these terms.
*Correspondence: Qiang Ding, cWlhbmdkaW5nQG51ZmUuZWR1LmNu
 Decai Tang
 Valentina Boamah
 Qiang Ding3*